
Low-Molecular-Weight Seaweed-Derived Polysaccharides Lead to Increased Faecal Bulk but Do Not Alter Human Gut Health Markers

 , , , , ,
  ,
,
Abstract
:
1. Introduction
2. Materials
2.1. Low-Molecular-Weight Polysaccharides (LMWP) Intervention Product
2.2. Participants
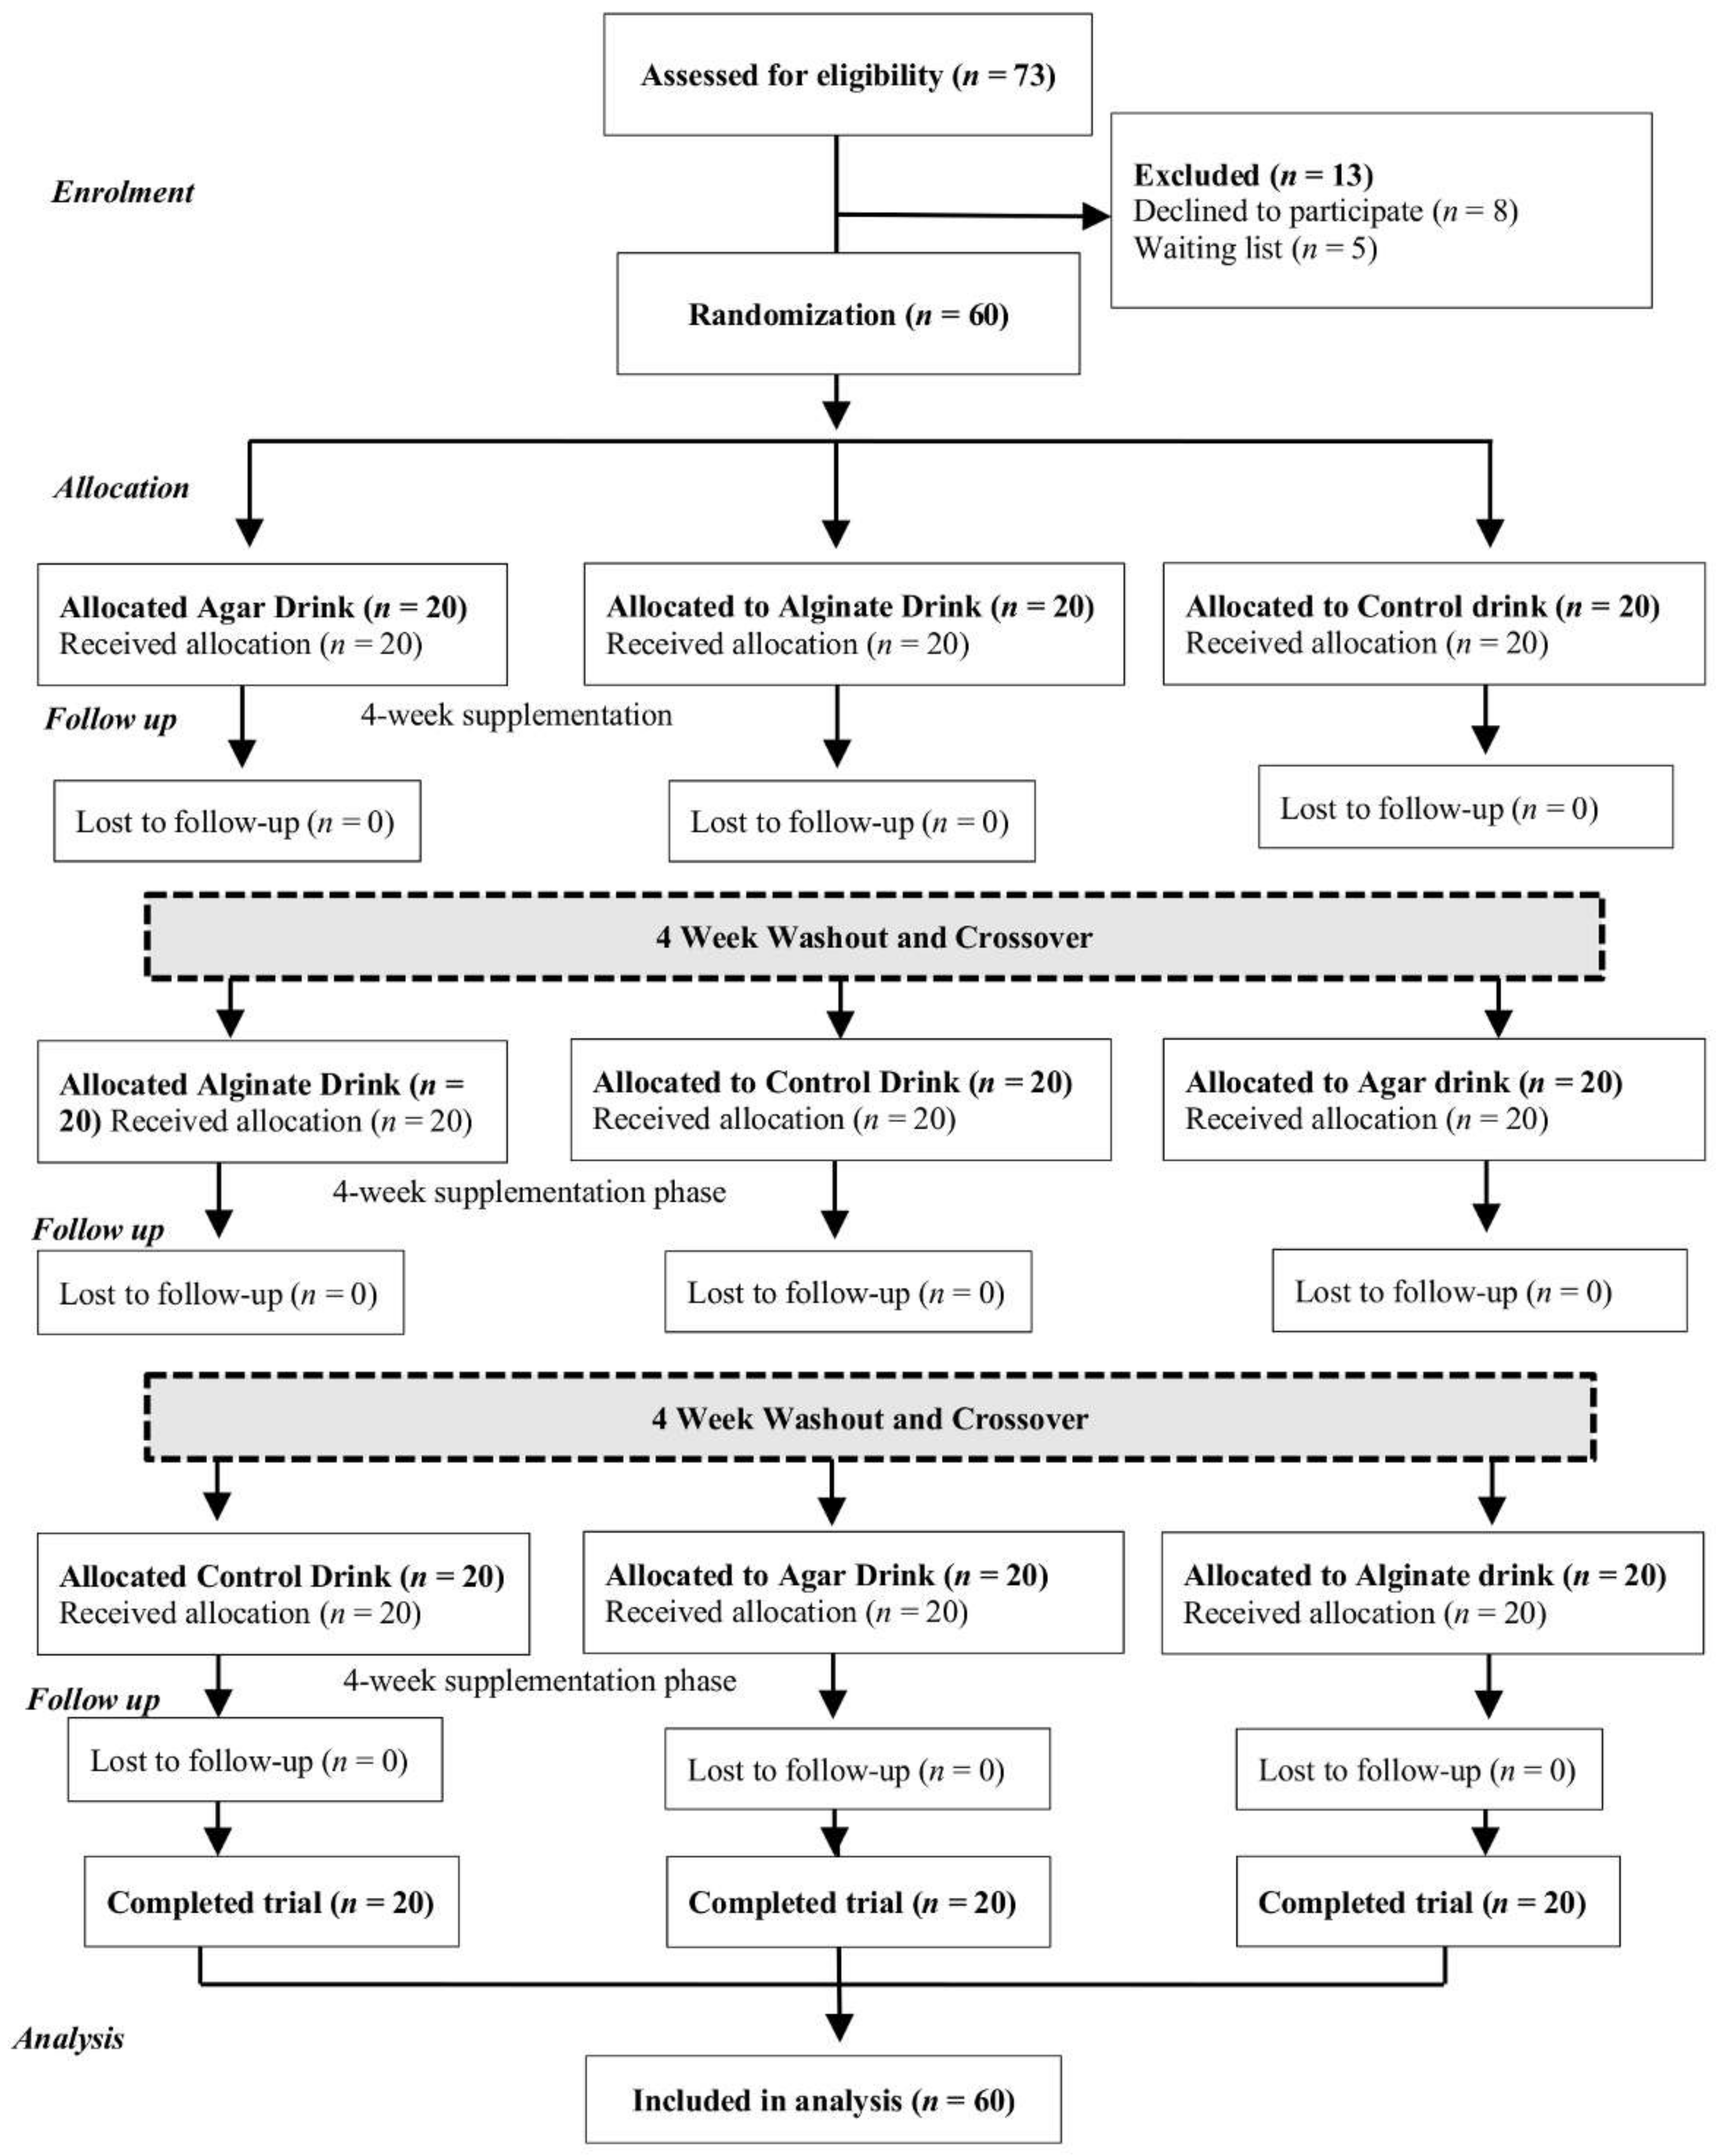
2.3. Study Design
2.4. Faecal Sample Processing
2.5. Short-Chain Fatty Acid Analysis (SCFA)
2.6. Fluorescence In Situ Hybridization (FISH)
2.7. Transepithelial Resistance Assay (TER)
2.8. Microbiome Analysis
2.8.1. DNA Extractions
2.8.2. Amplicon Sequencing
2.8.3. Bioinformatic Analysis
2.9. Statistical Analysis
3. Results
3.1. Participant Characteristics
3.2. Faecal Characteristics
3.3. Barrier Function Changes and Faecal SCFA Analysis
3.4. Assessment of Bacteriome Changes Using FISH and 16S Sequence Analysis
3.4.1. Fluorescence In Situ Hybridization (FISH) Analysis
3.4.2. Bacteriome Sequencing
4. Discussion
5. Conclusions
6. Research Highlights
- The first in vivo study to investigate the prebiotic potential of alginate and agar in the human gut.
- Low-molecular-weight seaweed-derived polysaccharides lead to increased faecal bulk.
- No demonstrable alteration of human gut health markers—microbiota, barrier function (transepithelial resistance) or faecal short-chain fatty acid (SCFA) levels.
- The need for additional focused human in vivo investigative studies using crude polysaccharide-rich seaweed extract mixtures.
Supplementary Materials
Author Contributions
Funding
Institutional Review Board Statement
Informed Consent Statement
Data Availability Statement
Acknowledgments
Conflicts of Interest
Abbreviations
| FISH | Fluorescence in situ hybridization |
| LMWPs | Low-molecular-weight polysaccharides |
| MTBSTFA | N-tert-butyldimethylsilyl-N-methyltrifluoroacetamide |
| SCFA | Short-chain fatty acids |
| TER | Transepithelial resistance assay |
References
- Cherry, P.; Yadav, S.; Strain, C.R.; Allsopp, P.J.; McSorley, E.M.; Ross, R.P.; Stanton, C. Prebiotics from Seaweeds: An Ocean of Opportunity? Mar. Drugs 2019, 17, 327. [Google Scholar] [CrossRef] [PubMed] [Green Version]
- Zava, T.T.; Zava, D.T. Assessment of Japanese iodine intake based on seaweed consumption in Japan: A literature-based analysis. Thyroid Res. 2011, 4, 14. [Google Scholar] [CrossRef] [PubMed] [Green Version]
- Brown, E.M.; Allsopp, P.J.; Magee, P.J.; Gill, C.I.R.; Nitecki, S.; Strain, C.R.; McSorley, E.M. Seaweed and human health. Nutr. Rev. 2014, 72, 205–216. [Google Scholar] [CrossRef]
- Andersen, S.; Noahsen, P.; Rex, K.F.; Florian-Sørensen, H.C.; Mulvad, G. Iodine in Edible Seaweed Its Absorption, Dietary Use, and Relation to Iodine Nutrition in Arctic People. J. Med. Food 2019, 22, 421–426. [Google Scholar] [CrossRef]
- Strain, C.R.; Collins, K.C.; Naughton, V.; McSorley, E.M.; Stanton, C.; Smyth, T.J.; Soler-Vila, A.; Rea, M.C.; Ross, P.R.; Cherry, P.; et al. Effects of a polysaccharide-rich extract derived from Irish-sourced Laminaria digitata on the composition and metabolic activity of the human gut microbiota using an in vitro colonic model. Eur. J. Nutr. 2020, 59, 309–325. [Google Scholar] [CrossRef] [Green Version]
- EFSA Panel on Dietetic Products, Nutrition, and Allergies (NDA). Scientific Opinion on Dietary Reference Values for carbohydrates and dietary fibre. Eur. Food Saf. Auth. J. 2010, 8, 1462. [Google Scholar] [CrossRef] [Green Version]
- United States Department of Agriculture Center for Nutrition Policy and Promotion. The Food Supply and Dietary Fiber: Its Availability and Effect on Health. Nutrition Insight. 2007. Available online: https://fns-prod.azureedge.net/sites/default/files/nutrition_insights_uploads/Insight36.pdf (accessed on 25 August 2021).
- Ho, K.S.; Tan, C.Y.; Mohd Daud, M.A.; Seow-Choen, F. Stopping or reducing dietary fiber intake reduces constipation and its associated symptoms. World J. Gastroenterol. 2012, 18, 4593–4596. [Google Scholar] [CrossRef]
- Emadian, A.; Andrews, R.C.; England, C.Y.; Wallace, V.; Thompson, J.L. The effect of macronutrients on glycaemic control: A systematic review of dietary randomised controlled trials in overweight and obese adults with type 2 diabetes in which there was no difference in weight loss between treatment groups. Br. J. Nutr. 2015, 114, 1656–1666. [Google Scholar] [CrossRef] [PubMed] [Green Version]
- Xi, M.; Dragsted, L.O. Biomarkers of seaweed intake. Genes Nutr. 2019, 14, 24. [Google Scholar] [CrossRef] [Green Version]
- MacArtain, P.; Gill, C.I.; Brooks, M.; Campbell, R.; Rowland, I.R. Nutritional value of edible seaweeds. Nutr. Rev. 2007, 65, 535–543. [Google Scholar] [CrossRef] [PubMed]
- De Jesus Raposo, M.F.; de Morais, A.M.; de Morais, R.M. Emergent Sources of Prebiotics: Seaweeds and Microalgae. Mar. Drugs 2016, 14, 27. [Google Scholar] [CrossRef]
- Murakami, R.; Hashikura, N.; Yoshida, K.; Xiao, J.Z.; Odamaki, T. Growth-promoting effect of alginate on Faecalibacterium prausnitzii through cross-feeding with Bacteroides. Food Res. Int. 2021, 144, 110326. [Google Scholar] [CrossRef]
- Ramnani, P.; Chitarrari, R.; Tuohy, K.; Grant, J.; Hotchkiss, S.; Philp, K.; Campbell, R.; Gill, C.; Rowland, I. In vitro fermentation and prebiotic potential of novel low molecular weight polysaccharides derived from agar and alginate seaweeds. Anaerobe 2012, 18, 1–6. [Google Scholar] [CrossRef]
- Urbaniak, G.C.; Plous, S. Research Randomizer, Version 4.0 [Computer software]. Available online: http://www.randomizer.org/ (accessed on 22 June 2013).
- Gill, C.I.R.; Haldar, S.; Boyd, L.A.; Bennett, R.; Whiteford, J.; Butler, M.; Pearson, J.R.; Bradbury, I.; Rowland, I.R. Watercress supplementation in diet reduces lymphocyte DNA damage and alters blood antioxidant status in healthy adults. Am. J. Clin. Nutr. 2007, 85, 504–510. [Google Scholar] [CrossRef] [PubMed] [Green Version]
- Gill, C.I.R.; Heavey, P.; McConville, E.; Bradbury, I.; Fässler, C.; Mueller, S.; Cresci, A.; Dore, J.; Norin, E.; Rowland, I. Effect of fecal water on an in vitro model of colonic mucosal barrier function. Nutr. Cancer 2007, 57, 59–65. [Google Scholar] [CrossRef]
- Lewis, S.J.; Heaton, K.W. Faecal form scale as a useful guide to intestinal transit time. Scand. J. Gastroenterol. 1997, 32, 920–924. [Google Scholar] [CrossRef] [PubMed]
- Salazar, N.; Ruas-Maliedo, P.; Kolida, S.; Collins, M.; Rastall, R.; Gibson, G.; de Los Reyes-Gavilán, C.G. Exopolysaccharides produced by Bifidobacterium longum IPLA E44 and Bifidobacterium animalis subsp. lactis IPLA R1 modify the composition and metabolic activity of human fecal microbiota in pH-controlled batch cultures. Int. J. Food Microbiol. 2009, 135, 260–267. [Google Scholar] [CrossRef] [Green Version]
- Daims, H.; Brühl, A.; Amann, R.; Schleifer, K.H.; Wagner, M. The domain-specific probe EUB338 is insufficient for the detection of all bacteria: Development and evaluation of a more comprehensive probe set. Syst. Appl. Microbiol. 1999, 22, 434–444. [Google Scholar] [CrossRef]
- Langendijk, P.S.; Schut, F.; Jansen, G.J.; Raangs, G.C.; Kamphuis, G.R.; Wilkinson, M.H.; Welling, G.W. Quantitative Fluorescence In Situ Hybridization of Bifidobacterium spp. with Genus-Specific 16S rRNA-Targeted Probes and Its Application in Fecal Samples. Appl. Environ. Microbiol. 1995, 61, 3069–3075. [Google Scholar] [CrossRef] [PubMed] [Green Version]
- Harmsen, H.J.M.; Elfferich, P.; Schut, F.; Welling, G.W. A 16S rRNA-targeted Probe for Detection of Lactobacilli and Enterococci in Faecal Samples by Fluorescent In Situ Hybridization. Microb. Ecol. Health Dis. 1999, 11, 3–12. [Google Scholar] [CrossRef] [Green Version]
- Franks, A.H.; Harmsen, H.J.; Raangs, G.C.; Jansen, G.J.; Schut, F.; Welling, G.W. Variations of Bacterial Populations in Human Feces Measured by Fluorescent In Situ Hybridization with Group-Specific 16S rRNA-Targeted Oligonucleotide Probes. Appl. Environ. Microbiol. 1998, 64, 3336–3345. [Google Scholar] [CrossRef] [PubMed] [Green Version]
- Manz, W.; Amann, R.; Ludwig, W.; Vancanneyt, M.; Schleifer, K.H. Application of a suite of 16S rRNA-specific oligonucleotide probes designed to investigate bacteria of the phylum cytophaga-flavobacter-bacteroides in the natural environment. Microbiology 1996, 142, 1097–1106. [Google Scholar] [CrossRef] [PubMed] [Green Version]
- Walker, A.W.; Duncan, S.H.; Leitch, E.C.M.; Child, M.W.; Flint, H.J. pH and peptide supply can radically alter bacterial populations and short chain fatty acid ratios within microbial communities from the human colon. Appl. Environ. Microbiol. 2005, 71, 3692–3700. [Google Scholar] [CrossRef] [Green Version]
- Benus, R.F.J.; van der Werf, T.S.; Welling, G.W.; Judd, P.A.; Taylor, M.A.; Harmsen, H.J.M.; Whelan, K. Association between Faecalibacterium prausnitzii and dietary fibre in colonic fermentation in healthy human subjects. Br. J. Nutr. 2010, 104, 693–700. [Google Scholar] [CrossRef] [PubMed] [Green Version]
- Klindworth, A.; Pruesse, E.; Schweer, T.; Peplies, J.; Quast, C.; Horn, M.; Glöckner, F.O. Evaluation of general 16S ribosomal RNA gene PCR primers for classical and next-generation sequencing-based diversity studies. Nucleic Acids Res. 2013, 41, e1. [Google Scholar] [CrossRef]
- Andrews, S. FastQC: A Quality Control Tool for High Throughput Sequence Data. 2010. Available online: http://www.bioinformatics.babraham.ac.uk/projects/fastqc/ (accessed on 14 August 2020).
- Bolger, A.M.; Lohse, M.; Usadel, B. Trimmomatic: A flexible trimmer for Illumina Sequence Data. Bioinformatics 2014, 30, 2114–21120. [Google Scholar] [CrossRef] [PubMed] [Green Version]
- R Core Team. R: A Language and Environment for Statistical Computing; R Foundation for Statistical Computing: Vienna, Austria, 2013; Available online: http://www.R-project.org/ (accessed on 14 August 2020).
- Callahan, B.J.; McMurdie, P.J.; Rosen, M.J.; Han, A.W.; Johnson, A.J.A.; Holmes, S.P. DADA2: High-resolution sample inference from Illumina amplicon data. Nat. Methods 2016, 13, 581–583. [Google Scholar] [CrossRef] [Green Version]
- Edgar, R.C.; Haas, B.J.; Clemente, J.C.; Quince, C.; Knight, R. UCHIME improves sensitivity and speed of chimera detection. Bioinformatics 2011, 27, 2194–2200. [Google Scholar] [CrossRef] [Green Version]
- Schloss, P.D.; Westcott, S.L.; Ryabin, T.; Hall, J.R.; Hartmann, M.; Hollister, E.B.; Lesniewski, R.A.; Oakley, B.B.; Parks, D.H.; Robinson, C.J.; et al. Introducing mothur: Open-source, platform-independent, community-supported software for describing and comparing microbial communities. Appl. Environ. Microbiol. 2009, 75, 7537–7541. [Google Scholar] [CrossRef] [PubMed] [Green Version]
- Glöckner, F.O.; Yilmaz, P.; Quast, C.; Gerkena, J.; Beccatia, A.; Ciuprinaa, A.; Brunsa, G.; Yarzac, P.; Pepliesc, J.; Westramc, R.; et al. 25 years of serving the community with ribosomal RNA gene reference databases and tools. J. Biotechnol. 2017, 261, 169–176. [Google Scholar] [CrossRef]
- Chao, A.; Gotelli, N.J.; Hsieh, T.C.; Sander, E.L.; Ma, K.H.; Colwell, R.K.; Ellison, A.M. Rarefaction and extrapolation with Hill numbers: A framework for sampling and estimation in species diversity studies. Ecol. Monogr. 2014, 84, 45–67. [Google Scholar] [CrossRef] [Green Version]
- Fernandes, A.D.; Macklaim, J.M.; Linn, T.G.; Reid, G.; Gloor, G.B. ANOVA-like differential expression (ALDEx) analysis for mixed population RNA-Seq. PLoS ONE 2013, 8, e67019. [Google Scholar] [CrossRef]
- Oksanen, J.; Blanchet, F.G.; Friendly, M.; Kindt, R.; Legendre, P.; McGlinn, D.; Minchin, P.R.; O’Hara, R.B.; Simpson, G.L.; Solymos, P.; et al. Vegan: Community Ecology Package. R Package Version 2.5-6. 2018; R Foundation for Statistical Computing: Vienna, Austria, 2018; Available online: https://CRAN.R-project.org/package=vegan (accessed on 14 August 2020).
- Benjamini, Y.; Drai, D.; Elmer, G.; Kafkafi, N.; Golani, I. Controlling the false discovery rate in behavior genetics research. Behav. Brain Res. 2001, 12, 279–284. [Google Scholar] [CrossRef] [Green Version]
- Wickham, H. Ggplot2: Elegant Graphics for Data Analysis; Springer: New York, NY, USA, 2016; ISBN 978-3-319-24277-4. [Google Scholar]
- Baldrick, F.R.; McFadden, K.; Ibars, M.; Sung, C.; Moffatt, T.; Megarry, K.; Thomas, K.; Mitchell, P.; Wallace, J.M.W.; Pourshahidi, L.K.; et al. Impact of a (poly)phenol-rich extract from the brown algae Ascophyllum nodosum on DNA damage and antioxidant activity in an overweight or obese population: A randomized controlled trial. Am. J. Clin. Nutr. 2018, 108, 688–700. [Google Scholar] [CrossRef]
- De Vries, J.; Birkett, A.; Hulshof, T.; Verbeke, K.; Gibes, K. Effects of cereal, fruit and vegetable fibers on human fecal weight and transit time: A comprehensive review of intervention trials. Nutrients 2016, 8, 130. [Google Scholar] [CrossRef] [PubMed] [Green Version]
- Praznik, W.; Loeppert, R.; Viernstein, H.; Haslberger, A.G.; Unger, F.M. Dietary Fiber and Prebiotics. In Polysaccharides: Bioactivity and Biotechnology; Ramawat, K.G., Mérillon, J.G., Eds.; Springer International Publishing: Cham, Switzerland, 2015; pp. 891–925. [Google Scholar]
- Monro, J.A. Faecal bulking index: A physiological basis for dietary management of bulk in the distal colon. Asia Pac. J. Clin. Nutr. 2000, 9, 74–812. [Google Scholar] [CrossRef]
- Palit, S.; Lunniss, P.J.; Scott, S.M. The physiology of human defecation. Dig. Dis. Sci. 2012, 57, 1445–1464. [Google Scholar] [CrossRef]
- Cummings, J.H.; Bingham, S.A.; Heaton, K.W.; Eastwood, M.A. Fecal Weight, Colon Cancer Risk, and Dietary Intake of Nonstarch Polysaccharides (Dietary Fiber). Gastroenterology 1992, 103, 1783–1789. [Google Scholar] [CrossRef]
- Koc, F.; Mills, S.; Strain, C.; Ross, R.P.; Stanton, C. The public health rationale for increasing dietary fibre: Health benefits with a focus on gut microbiota. Nutr. Bull. 2020, 45, 294–308. [Google Scholar] [CrossRef]
- Corino, C.; Di Giancamillo, A.; Modina, S.C.; Rossi, R. Prebiotic Effects of Seaweed Polysaccharides in Pigs. Animals 2021, 11, 1573. [Google Scholar] [CrossRef] [PubMed]
- Topping, D.L.; Clifton, P.M. Short-chain fatty acids and human colonic function: Roles of resistant starch and nonstarch polysaccharides. Physiol. Rev. 2001, 81, 1031–1064. [Google Scholar] [CrossRef]
- Ríos-Covián, D.; Ruas-Madiedo, P.; Margolles, A.; Gueimonde, M.; de Los Reyes-Gavilán, C.G.; Salazar, N. Intestinal Short Chain Fatty Acids and their Link with Diet and Human Health. Front. Microbiol. 2016, 7, 185. [Google Scholar] [CrossRef] [Green Version]
- Shannon, E.; Conlon, M.; Hayes, M. Seaweed Components as Potential Modulators of the Gut Microbiota. Mar. Drugs 2021, 19, 358. [Google Scholar] [CrossRef] [PubMed]
- Laursen, M.F.; Laursen, R.P.; Larnkjær, A.; Mølgaard, C.; Michaelsen, K.F.; Frøkiær, H. Faecalibaterium Gut Colonization Is Accelerated by Presence of Older Siblings. mSphere 2017, 2, e00448-17. [Google Scholar] [CrossRef] [PubMed] [Green Version]
- Mizuno, H.; Bamba, S.; Abe, N.; Sasaki, M. Effects of an alginate-containing variable-viscosity enteral nutrition formula on defecation, intestinal microbiota, and short-chain fatty acid production. J. Funct. Foods 2020, 67, 103852. [Google Scholar] [CrossRef]
- Sakai, C.; Abe, S.; Kouzuki, M.; Shimohiro, H.; Ota, Y.; Sakinada, H.; Takeuchi, T.; Okura, T.; Kasagi, T.; Hanaki, K. A Randomized Placebo-controlled Trial of an Oral Preparation of High Molecular Weight Fucoidan in Patients with Type 2 Diabetes with Evaluation of Taste Sensitivity. Yonago Acta Med. 2019, 62, 14–23. [Google Scholar] [CrossRef] [PubMed] [Green Version]


| Measures | Total Group (N = 60) | Order of Treatment | ||
|---|---|---|---|---|
| Control-Agar-Alginate (n = 20) | Agar-Alginate-Control (n = 20) | Alginate-Control-Agar (n = 20) | ||
| Height (m) | 1.71 ± 0.1 | 1.69 ± 0.08 a | 1.69 ± 0.08 a | 1.74 ± 0.09 a |
| Weight (kg) | 72.57 ± 10.76 | 73.72 ± 13.46 a | 73.01 ± 11.12 a | 81.04 ± 14.82 a |
| BMI (kg/m2) | 25.81 ± 3.46 | 25.67 ± 4.01 a | 25.28 ± 2.76 a | 26.47 ± 3.29 a |
| Faecal weight (g) | 82.3 ± 71.1 | 91.23 ± 84.49 a | 82.7 ± 68.55 a | 84.0 ± 70.49 a |
| Faecal pH | 6.86 ± 0.64 | 6.71 ± 0.65 a | 7.08 ± 0.61 a | 6.8 ± 0.63 a |
| Faecal frequency (7 d) | 11.83 ± 8.14 | 11.55 ± 7.12 a | 13.3 ± 11.2 a | 9.3 ± 4.31 a |
| Faecal type (median) | 4 | 4.5 | 3.5 | 4 |
| Treatment | Baseline | Post-Treatment | Change (Post-Pre) | |
|---|---|---|---|---|
| Control Drink | Height (m) | 1.71 ± 0.1 | 1.71 ± 0.1 | 0 a |
| (N = 60) | Weight (kg) | 75.7 ± 14.1 | 75.6 ± 14.4 | −0.1 a |
| BMI (kg/m2) | 25.7 ± 3.5 | 25.7 ± 3.5 | 0 a | |
| Energy (kcal) | 1860.4 ± 578.5 | 1798.6 ± 500.2 | −61.8 a | |
| Energy (kj) | 7783.8 ± 2420.4 | 7525.2 ± 2092.8 | −258.6 a | |
| Protein (g) | 74.3 ± 27.7 | 73.9 ± 19.3 | −0.4 a | |
| Total Fat (g) | 68.3 ± 30.1 | 65.9 ± 22.5 | −2.3 a | |
| CHO (g) | 211.3 ± 64.9 | 209.5 ± 69.6 | −1.8 a | |
| Fibre (g) | 10.9 ± 4.3 | 11.9 ± 5.4 | 1.0 a | |
| Alginate Drink | Height (m) | 1.71 ± 0.1 | 1.71 ± 0.1 | 0 a |
| (N = 60) | Weight (kg) | 76 ± 14.2 | 75.9 ± 14.3 | −0.1 a |
| BMI (kg/m2) | 25.8 ± 3.6 | 25.9 ± 3.6 | 0.1 a | |
| Energy kcal | 1917.0 ± 506.5 | 1867.7 ± 653.9 | −49.4 a | |
| Energy (kj) | 8020.9 ± 2119.1 | 7814.4 ± 2735.7 | −206.5 a | |
| Protein (g) | 76.1 ± 21.7 | 75.4 ±28.0 | −0.8 a | |
| Total Fat (g) | 71.3 ± 24.8 | 69.7 ± 31.5 | −1.6 a | |
| CHO (g) | 218.0 ± 67.2 | 207.6 ± 64.4 | −10.4 a | |
| Fibre (g) | 11.9 ± 4.9 | 11.4 ± 4.9 | −0.5 a | |
| Agar Drink | Height (m) | 1.71 ± 0.1 | 1.71 ± 0.1 | 0 a |
| (N = 60) | Weight (kg) | 76.0 ± 14.3 | 75.8 ± 14.4 | −0.2 a |
| BMI (kg/m2) | 25.8 ± 3.5 | 25.8 ± 3.6 | 0 a | |
| Energy kcal | 1838 ± 564.8 | 1933.4 ± 475.0 | −253.0 a | |
| Energy (kj) | 7683.6 ± 2363.1 | 8089.3 ± 1987.3 | −405.7 a | |
| Protein (g) | 75.6 ± 30.0 | 79.3 ± 20.9 | 3.7 a | |
| Total Fat (g) | 68.0 ± 27 | 72.4 ± 22.7 | 4.4 a | |
| CHO (g) | 205.9 ± 68.7 | 221.0 ± 74.3 | 15.1 a | |
| Fibre (g) | 11.0 ± 3.6 | 11.9 ± 5.2 | 0.9 a |
| Treatment | Faecal Weight (g) Change | ||
|---|---|---|---|
| Baseline | Treatment | (Treat-Base Values) | |
| Control Drink | 82.3 ± 71.1 | 64.2 ± 48 | −18.2 a |
| Agar Drink | 75.1 ± 58.7 | 84.8 ± 52.1 | 9.7 b |
| Alginate Drink ‡ | 67.3 ± 57.8 | 68.7 ± 52 | 1.2 b |
| Faecal pH | |||
| Control Drink ‡ | 7.0 ± 0.7 | 7.2 ± 0.5 | 0.2 a |
| Agar Drink | 7.1 ± 0.6 | 6.9 ± 0.5 | −0.2 b |
| Alginate Drink | 6.9 ± 0.6 | 7.1 ± 0.6 | 0.2 a |
| Faecal Frequency (per week) | |||
| Control drink † | 9.8 ± 5.1 | 10.2 ± 6.4 | 0.0 a |
| Agar Drink † | 11.3 ± 7.7 | 10.9 ± 5.7 | −0.7 a |
| Alginate Drink ¥ | 10.5 ± 5 | 10.2 ± 4.2 | 0.3 a |
| Faecal type (Scale 1–7; median value) | |||
| Control Drink | 4 | 3 | |
| Agar Drink | 4 | 4 | |
| Alginate Drink | 4 | 3 | |
| Control Drink | Agar Drink | Alginate Drink | ||||
|---|---|---|---|---|---|---|
| Faecal Water Activity * | Baseline | Treatment | Baseline | Treatment | Baseline | Treatment |
| Barrier function (24–0 h) | 111 ± 12 a | 111 ± 12 a | 114 ± 13 a | 111 ± 12 a | 111 ± 15 a | 112 ± 11 a |
| Barrier function (48–0 h) | 106 ± 13 a | 107 ± 12 a | 109 ± 20 a | 105 ± 13 a | 107 ± 20 a | 106 ± 14 a |
| SCFA | Control Drink | Agar Drink | Alginate Drink | |||
|---|---|---|---|---|---|---|
| (mmoles/L) | Baseline | Treatment | Baseline | Treatment | Baseline | Treatment |
| Acetic acid | 1.67 ± 0.93 | 2.03 ± 1.29 | 1.66 ± 1.11 | 1.91 ± 1.15 | 1.87 ± 1.12 | 2.09 ± 1.41 |
| Propionic acid | 0.84 ± 0.59 | 1.30 ± 0.57 a | 0.86 ± 0.60 | 1.18 ± 0.45 a | 0.96 ± 0.63 | 1.29 ± 0.53 a |
| Butyric acid | 0.97 ± 0.62 | 1.57 ± 0.57 a | 0.82 ± 0.54 | 1.44 ± 0.50 a | 0.97 ± 0.62 | 1.57 ± 0.57 a |
| Isobutyric acid | 0.02 ± 0.12 | 0.01 ± 0.01 | 0.01 ± 0.02 | 0.05 ± 0.16 | 0.03 ± 0.10 | 0.04 ± 0.16 |
| Valeric acid | 0.03 ± 0.14 | 0.01 ± 0.04 | 0.01 ± 0.06 | 0.03 ± 0.1 | 0.03 ± 0.9 | 0.03 ± 0.16 |
| Isovaleric acid | 0.01 ± 0.03 | 0.01 ± 0.07 | 0.01 ± 0.02 | 0.03 ± 0.12 | 0.01 ± 0.05 | 0.01 ± 0.07 |
| Caproic acid | 0.03 ± 0.10 | 0.04 ± 0.15 | 0.06 ± 0.14 | 0.03 ± 0.13 | 0.06 ± 0.12 | 0.01 ± 0.02 a |
| Control Drink | Agar Drink | Alginate Drink | ||||
|---|---|---|---|---|---|---|
| Bacterial Group | Baseline | Treatment | Baseline | Treatment | Baseline | Treatment |
| Total Bacteria | 10.73 ± 0.21 | 10.75 ± 0.26 | 10.74 ± 0.23 | 10.76 ± 0.22 | 10.76 ± 0.27 | 10.74 ± 0.20 |
| Bacteroides spp. | 10.07 ± 0.26 | 10.07 ± 0.33 | 10.03 ± 0.26 | 10.06 ± 0.36 | 10.02 ± 0.30 | 10.04 ± 0.32 |
| Eubacterium rectale | 9.81 ± 0.24 | 9.88 ± 0.33 | 9.81 ± 0.28 | 9.90 ± 0.30 b | 9.86 ± 0.32 | 9.89 ± 0.31 |
| subgroup | ||||||
| Bifidobacterium spp. | 9.16 ± 0.38 | 9.25 ± 0.37 b | 9.16 ± 0.35 | 9.20 ± 0.32 | 9.17 ± 0.36 | 9.20 ± 0.35 |
| Atopobium spp. | 9.27 ± 0.37 | 9.28 ± 0.35 | 9.31 ± 0.31 | 9.27 ± 0.37 | 9.30 ± 0.33 | 9.21 ± 0.35 b |
| Clostridium histolyticum histolyticum subgroup | 7.78 ± 0.19 | 7.71 ± 0.21 a | 7.79 ± 0.21 | 7.72 ± 0.23 b | 7.78 ± 0.21 | 7.73 ± 0.18 |
| Lactobacilli/Enterococci | 7.83 ± 0.37 | 7.74 ± 0.46 | 7.82 ± 0.39 | 7.84 ± 0.48 | 7.85 ± 0.36 | 7.72 ± 0.40 |
| Propionibacteria | 9.80 ± 0.31 | 9.81 ± 0.34 | 9.82 ± 0.26 | 9.79 ± 0.28 | 9.89 ± 0.26 | 9.83 ± 0.30 |
| Faecalibacterium prausnitzii | 9.84 ± 0.29 | 9.88 ± 0.21 | 9.81 ± 0.24 | 9.91 ± 0.28 a | 9.90 ± 0.22 | 9.98 ± 0.25 |
Publisher’s Note: MDPI stays neutral with regard to jurisdictional claims in published maps and institutional affiliations. |
© 2021 by the authors. Licensee MDPI, Basel, Switzerland. This article is an open access article distributed under the terms and conditions of the Creative Commons Attribution (CC BY) license (https://creativecommons.org/licenses/by/4.0/).
Share and Cite
Bannon, C.D.; Eckenberger, J.; Snelling, W.J.; Huseyin, C.E.; Allsopp, P.; Strain, C.; Ramnani, P.; Chitarrari, R.; Grant, J.; Hotchkiss, S.; et al. Low-Molecular-Weight Seaweed-Derived Polysaccharides Lead to Increased Faecal Bulk but Do Not Alter Human Gut Health Markers. Foods 2021, 10, 2988. https://doi.org/10.3390/foods10122988
Bannon CD, Eckenberger J, Snelling WJ, Huseyin CE, Allsopp P, Strain C, Ramnani P, Chitarrari R, Grant J, Hotchkiss S, et al. Low-Molecular-Weight Seaweed-Derived Polysaccharides Lead to Increased Faecal Bulk but Do Not Alter Human Gut Health Markers. Foods. 2021; 10(12):2988. https://doi.org/10.3390/foods10122988
Chicago/Turabian StyleBannon, Ciara D., Julia Eckenberger, William John Snelling, Chloe Elizabeth Huseyin, Philip Allsopp, Conall Strain, Priya Ramnani, Roberto Chitarrari, John Grant, Sarah Hotchkiss, and et al. 2021. "Low-Molecular-Weight Seaweed-Derived Polysaccharides Lead to Increased Faecal Bulk but Do Not Alter Human Gut Health Markers" Foods 10, no. 12: 2988. https://doi.org/10.3390/foods10122988