Fatty Acid Profile of Lipid Fractions of Mangalitza (Sus scrofa domesticus) from Northern Romania: A GC-MS-PCA Approach
Abstract
:1. Introduction
2. Materials and Methods
2.1. Materials
2.2. Derivatization of the Unprocessed and Thermally Processed Lipid Fractions
2.3. Gas Chromatography—Mass Spectrometry Analysis of the Derivatized Lipid Fractions
2.4. Fourier-Transform Infrared Spectroscopy Analysis of the Lipid Fractions
2.5. Principal Component Analysis and Classical Statistical Analysis
3. Results and Discussion
3.1. Fatty Acid Profile of the Unprocessed and Thermally Processed Mangalitza Lipid Fractions
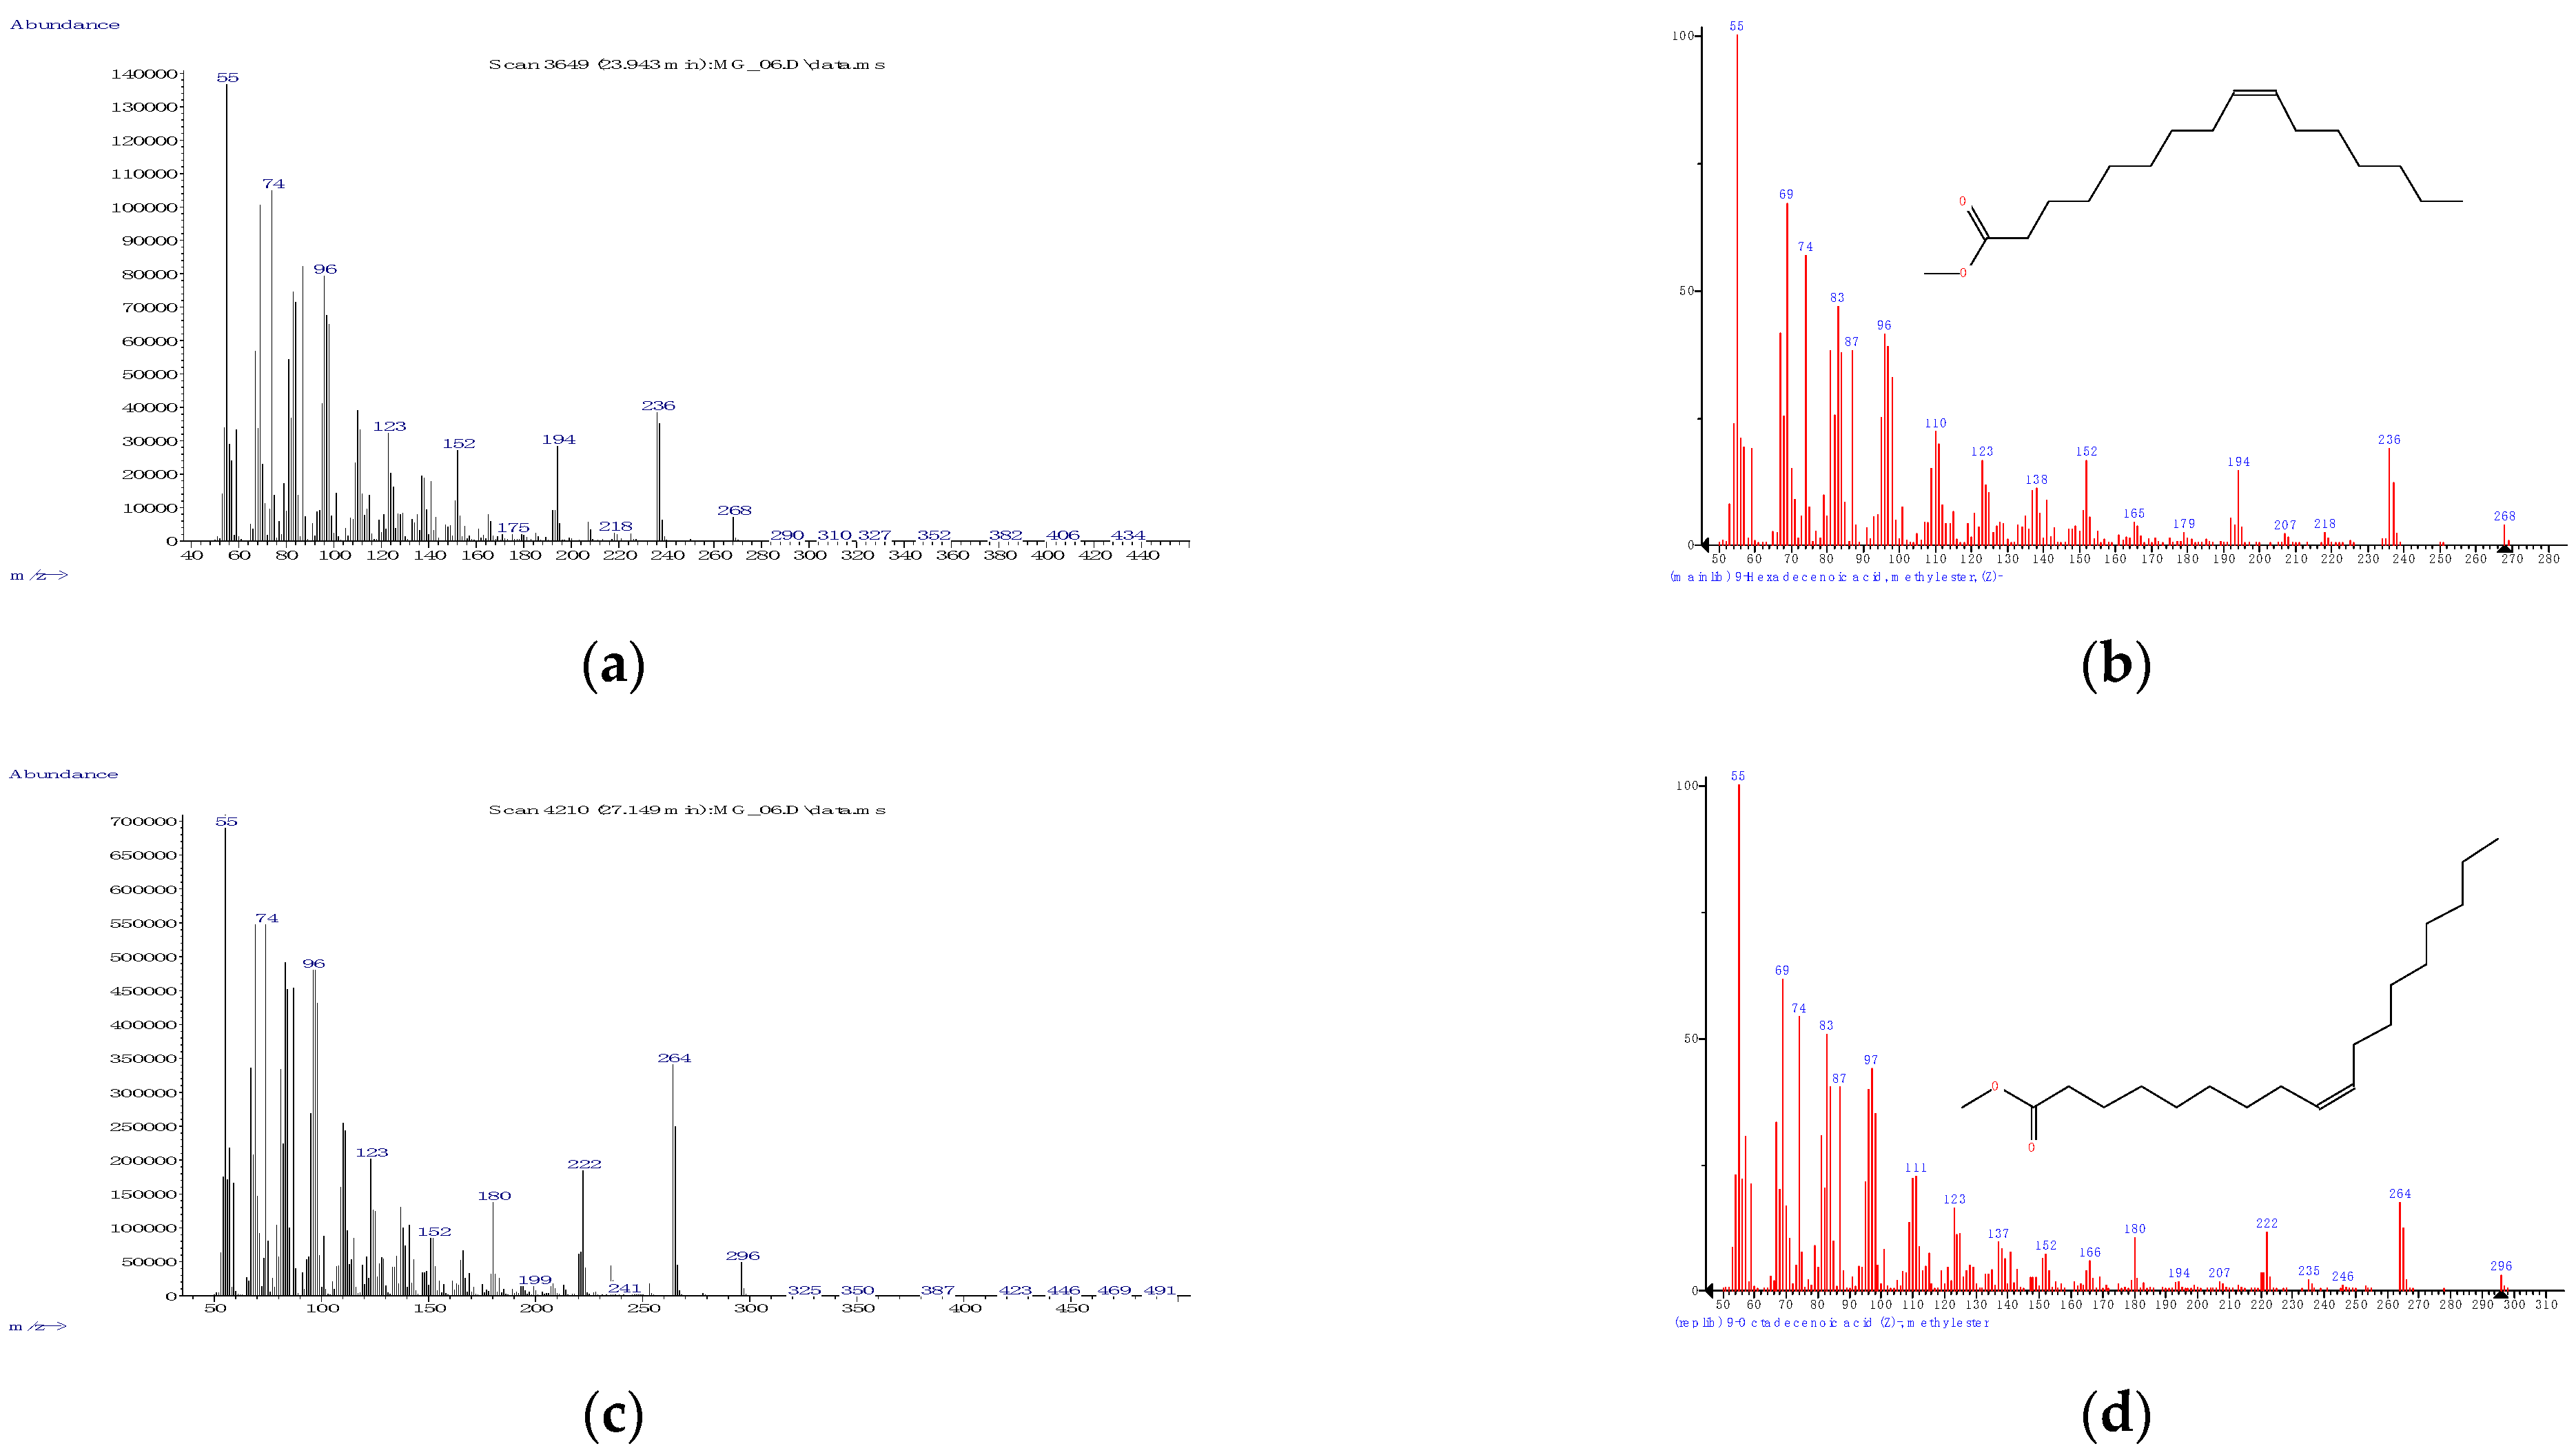
3.1.1. Derivatization, Identification, and Quantification—General Considerations
3.1.2. Fatty Acid Profile of the Unprocessed Mangalitza Lipid Fractions
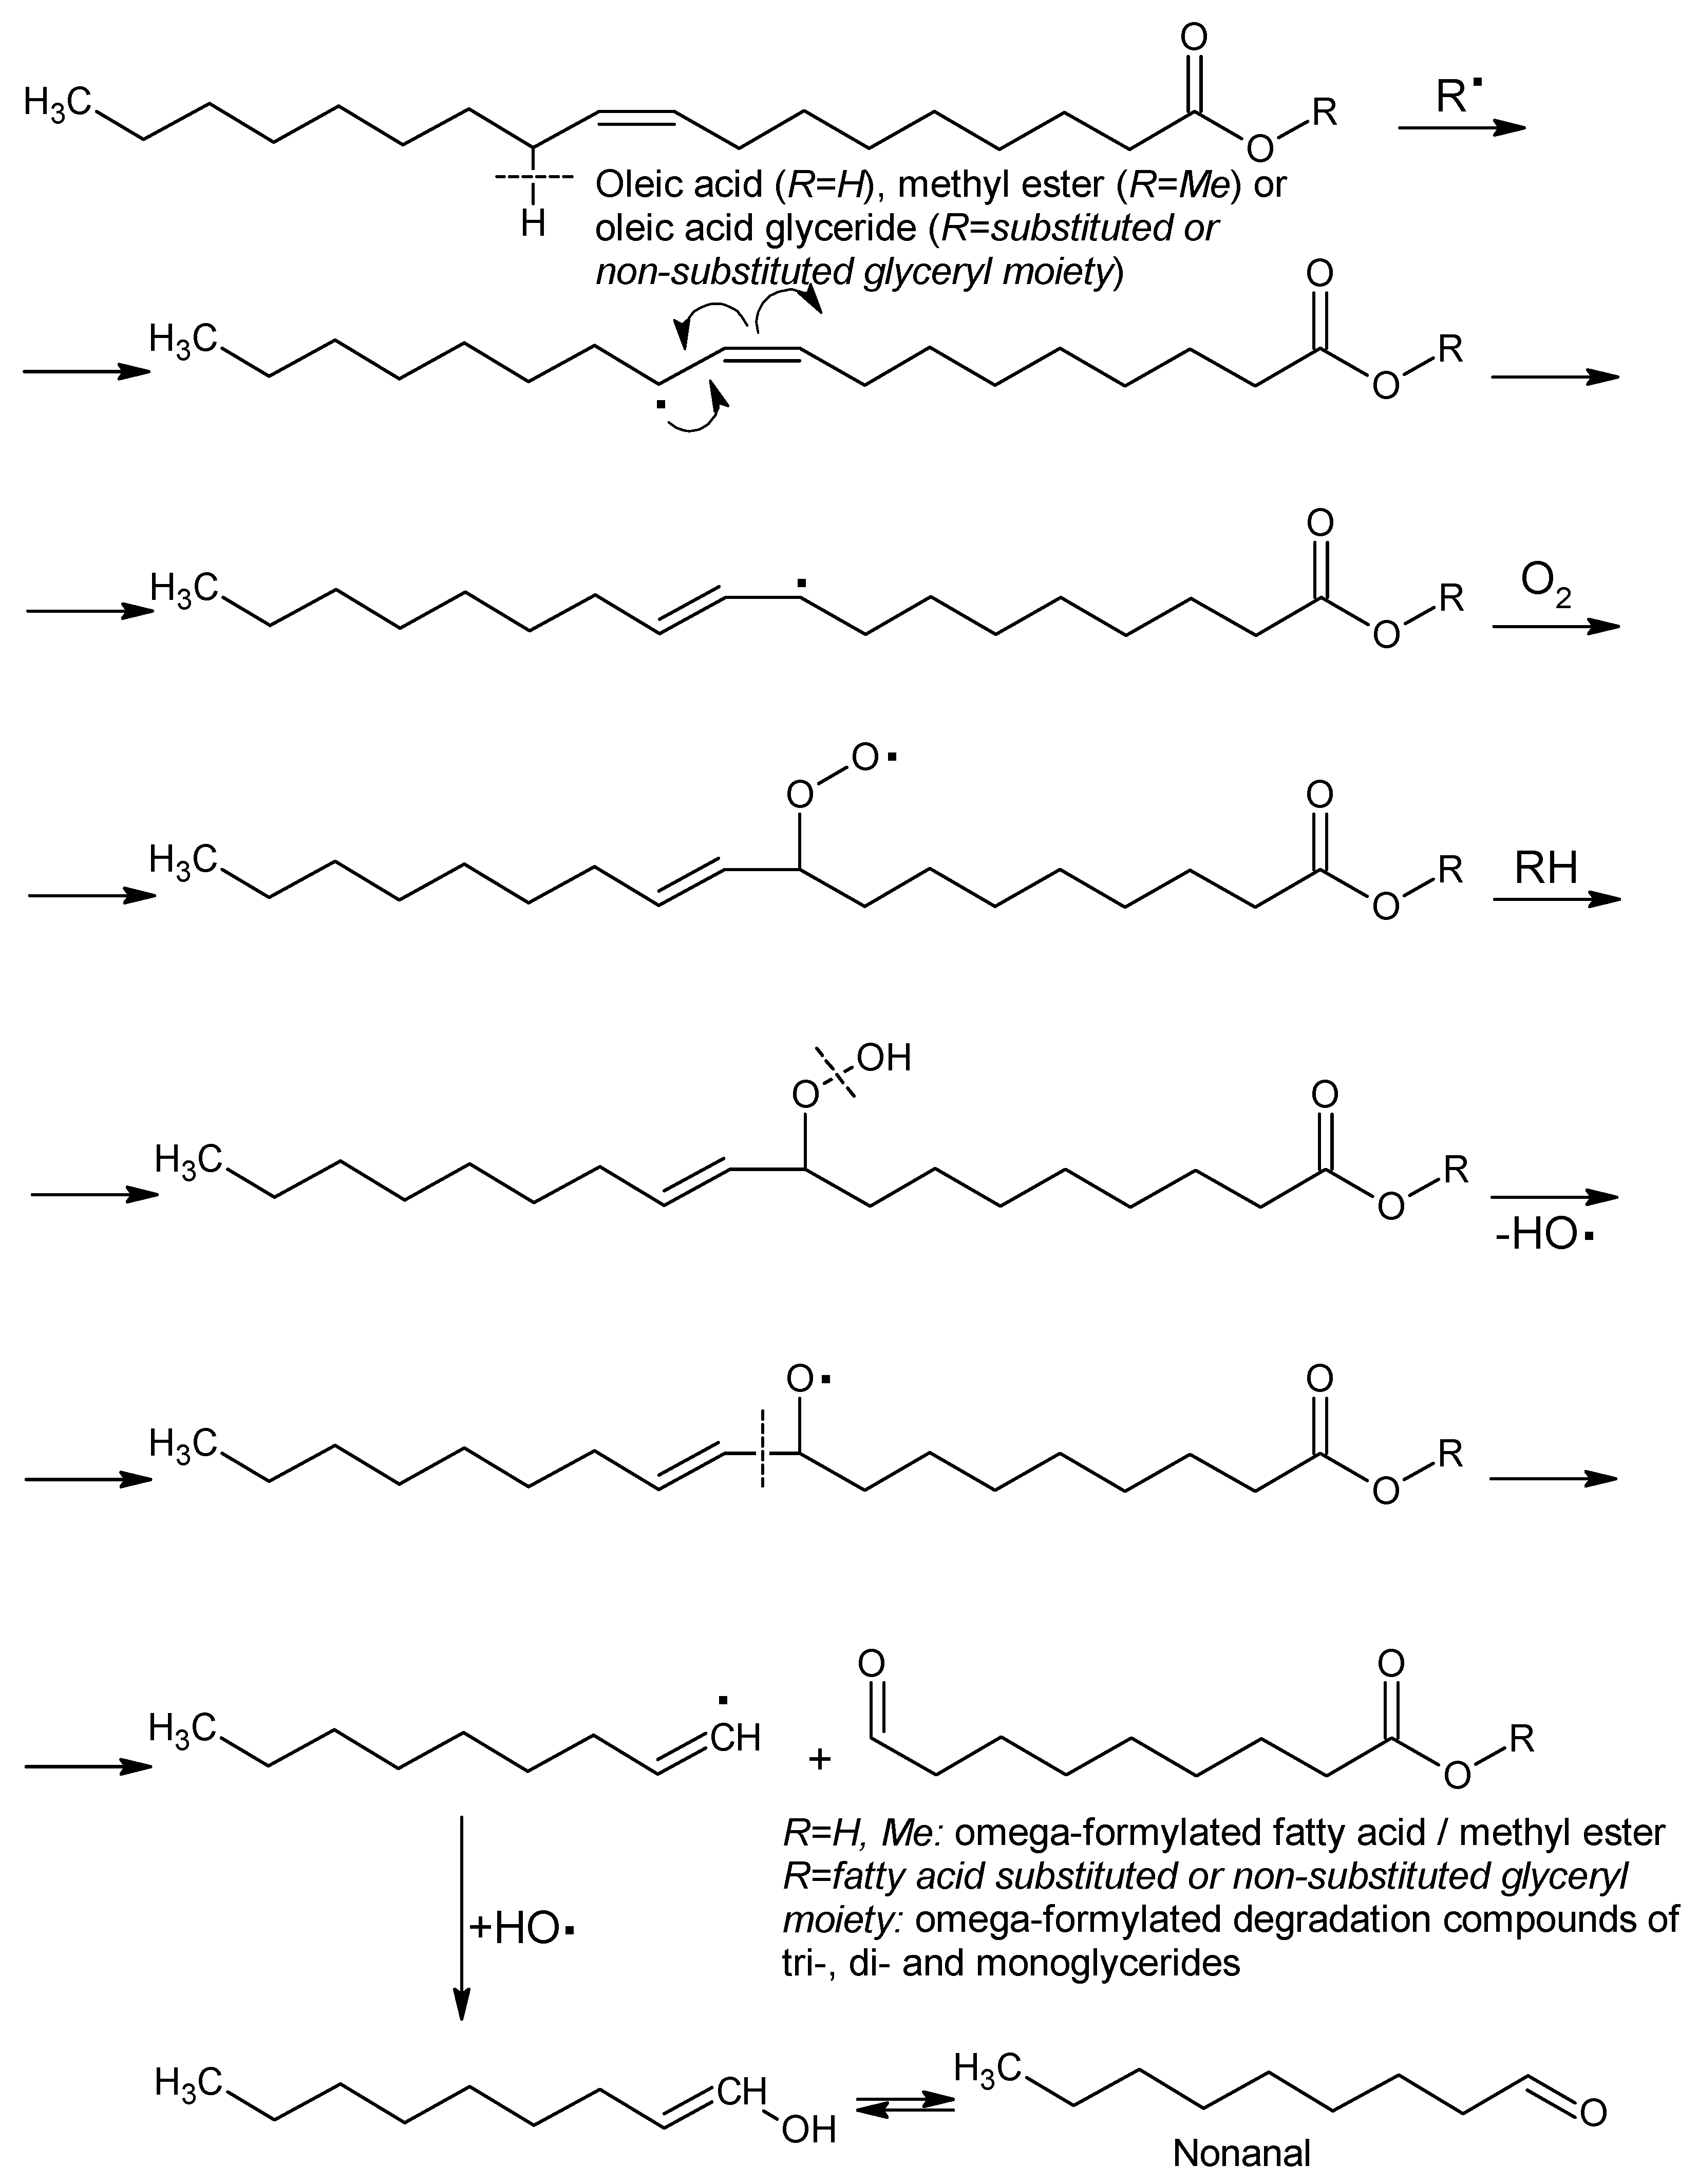
3.1.3. Fatty Acid Profile and Degradation of the Thermally Processed Mangalitza Lipid Fractions
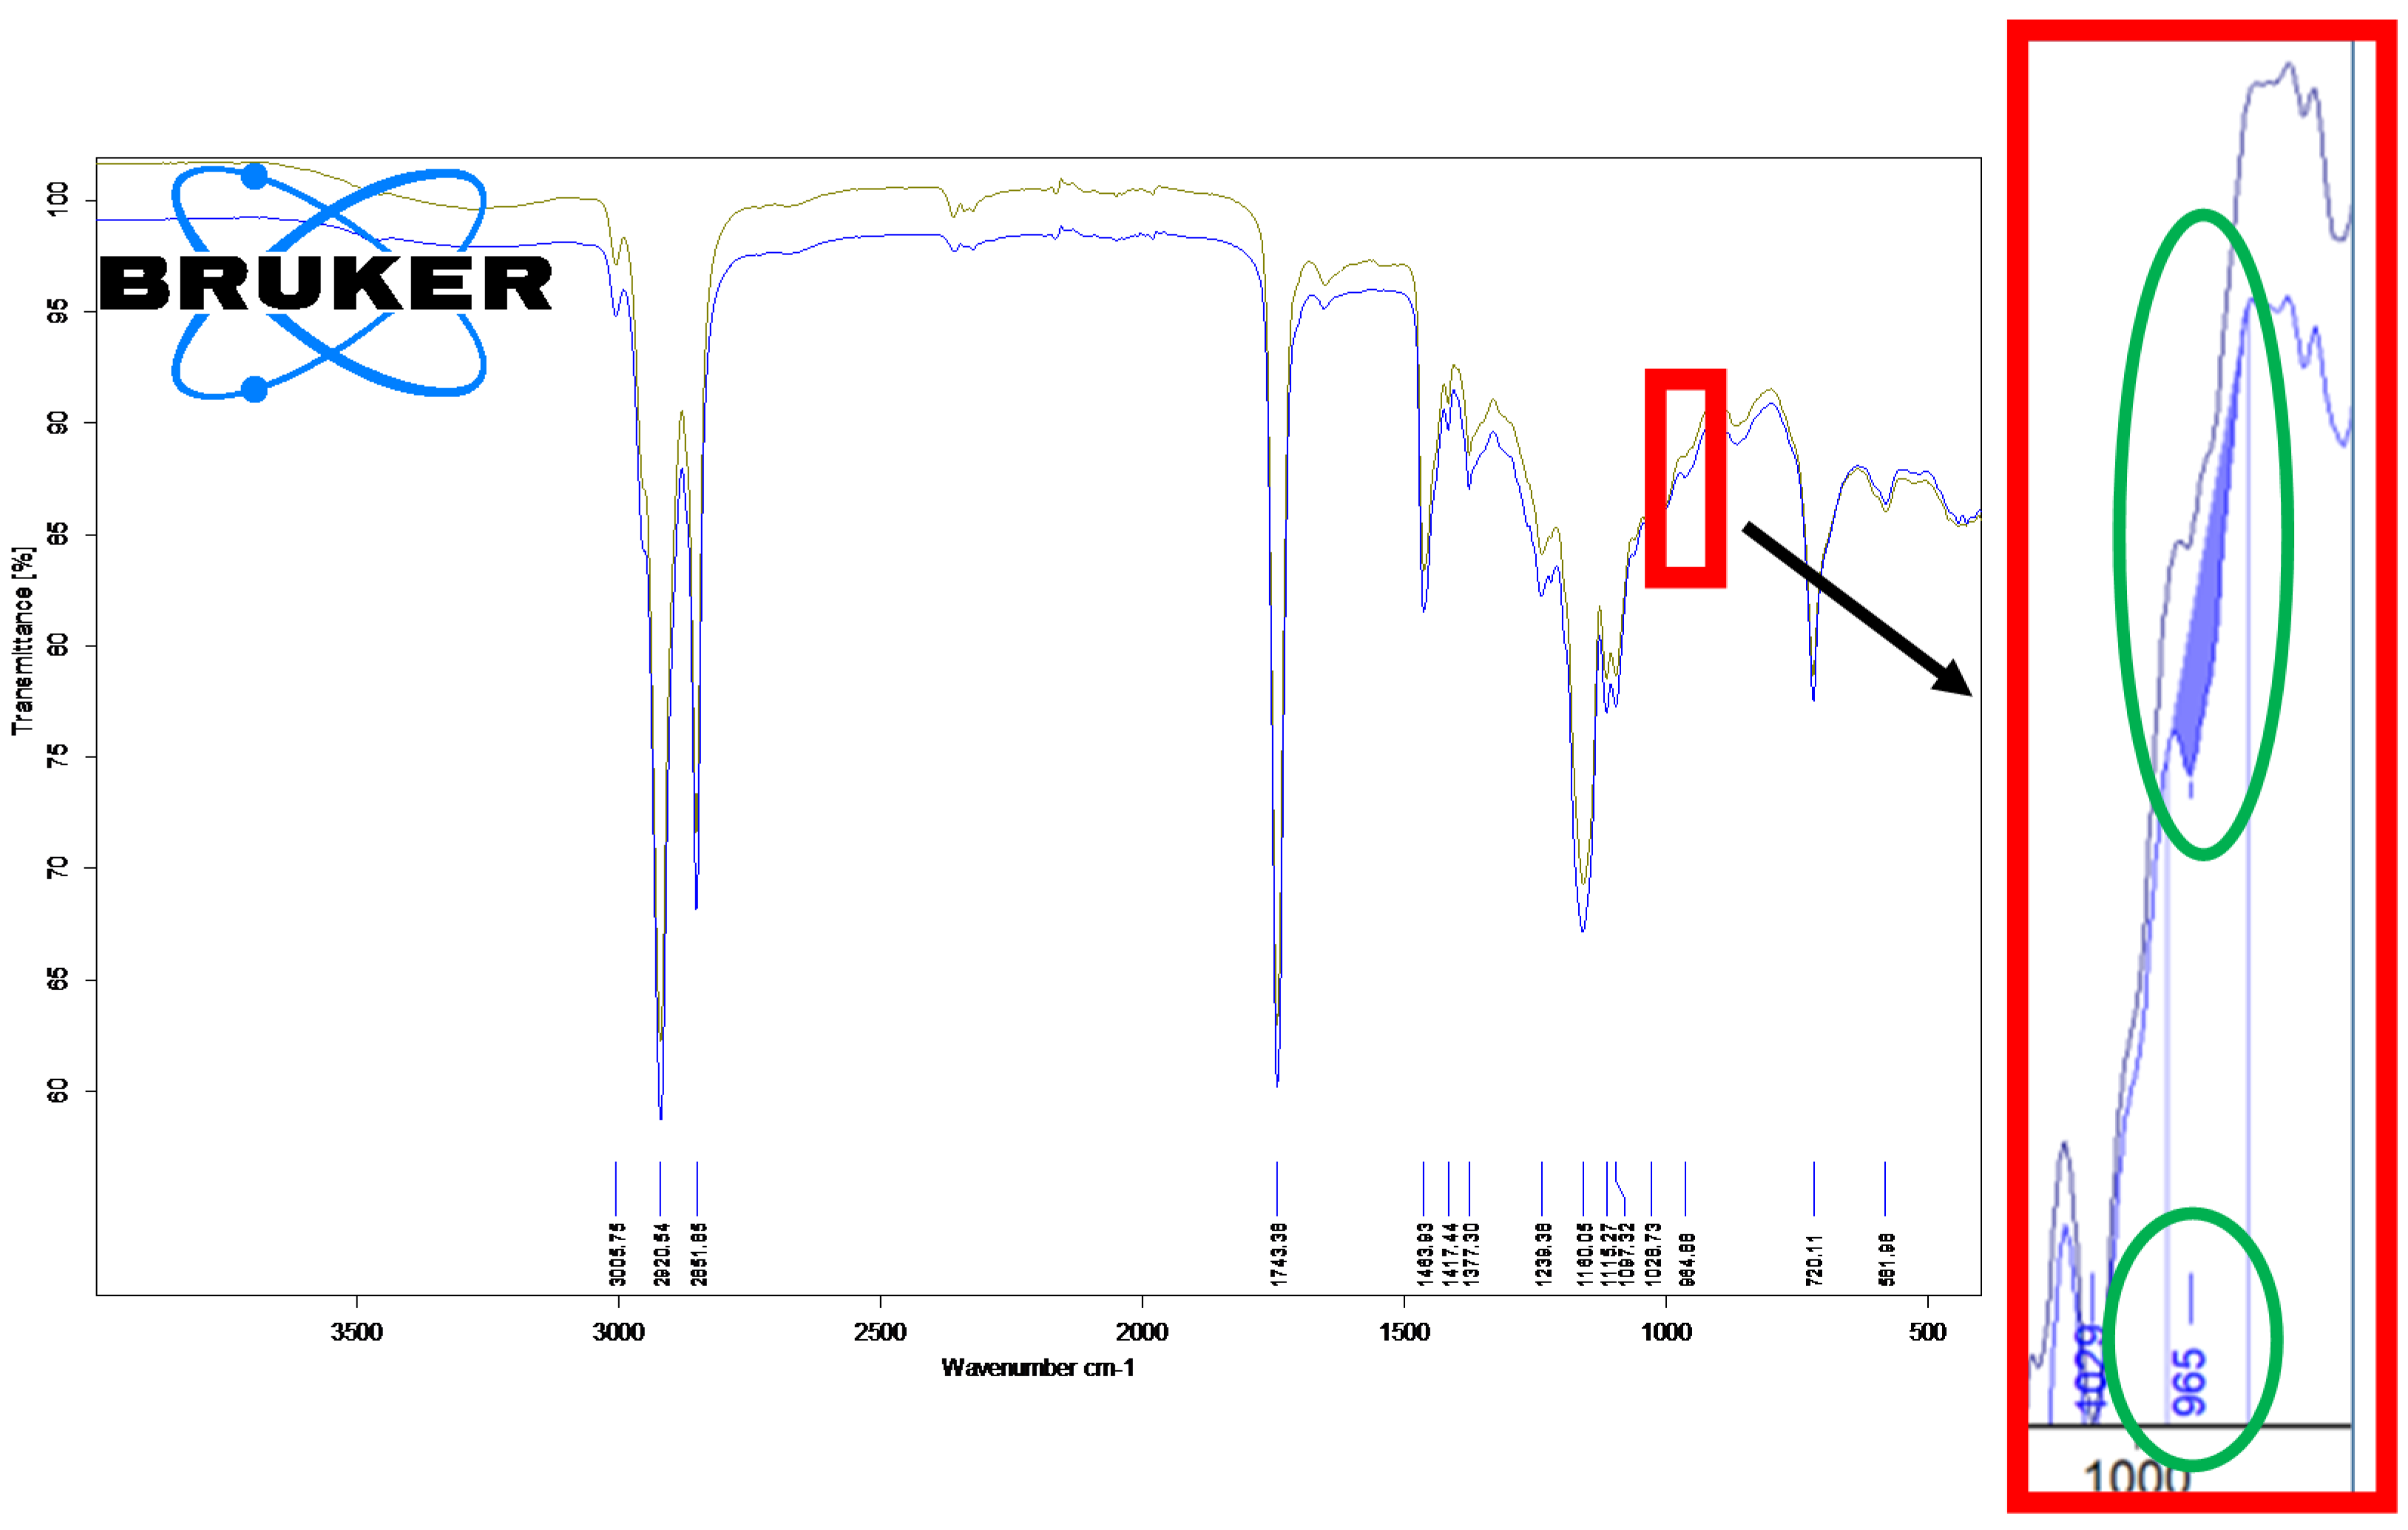
3.2. Fourier-Transform Infrared Spectroscopy Analysis of the Unprocessed and Thermally Processed Mangalitza Lipid Fractions
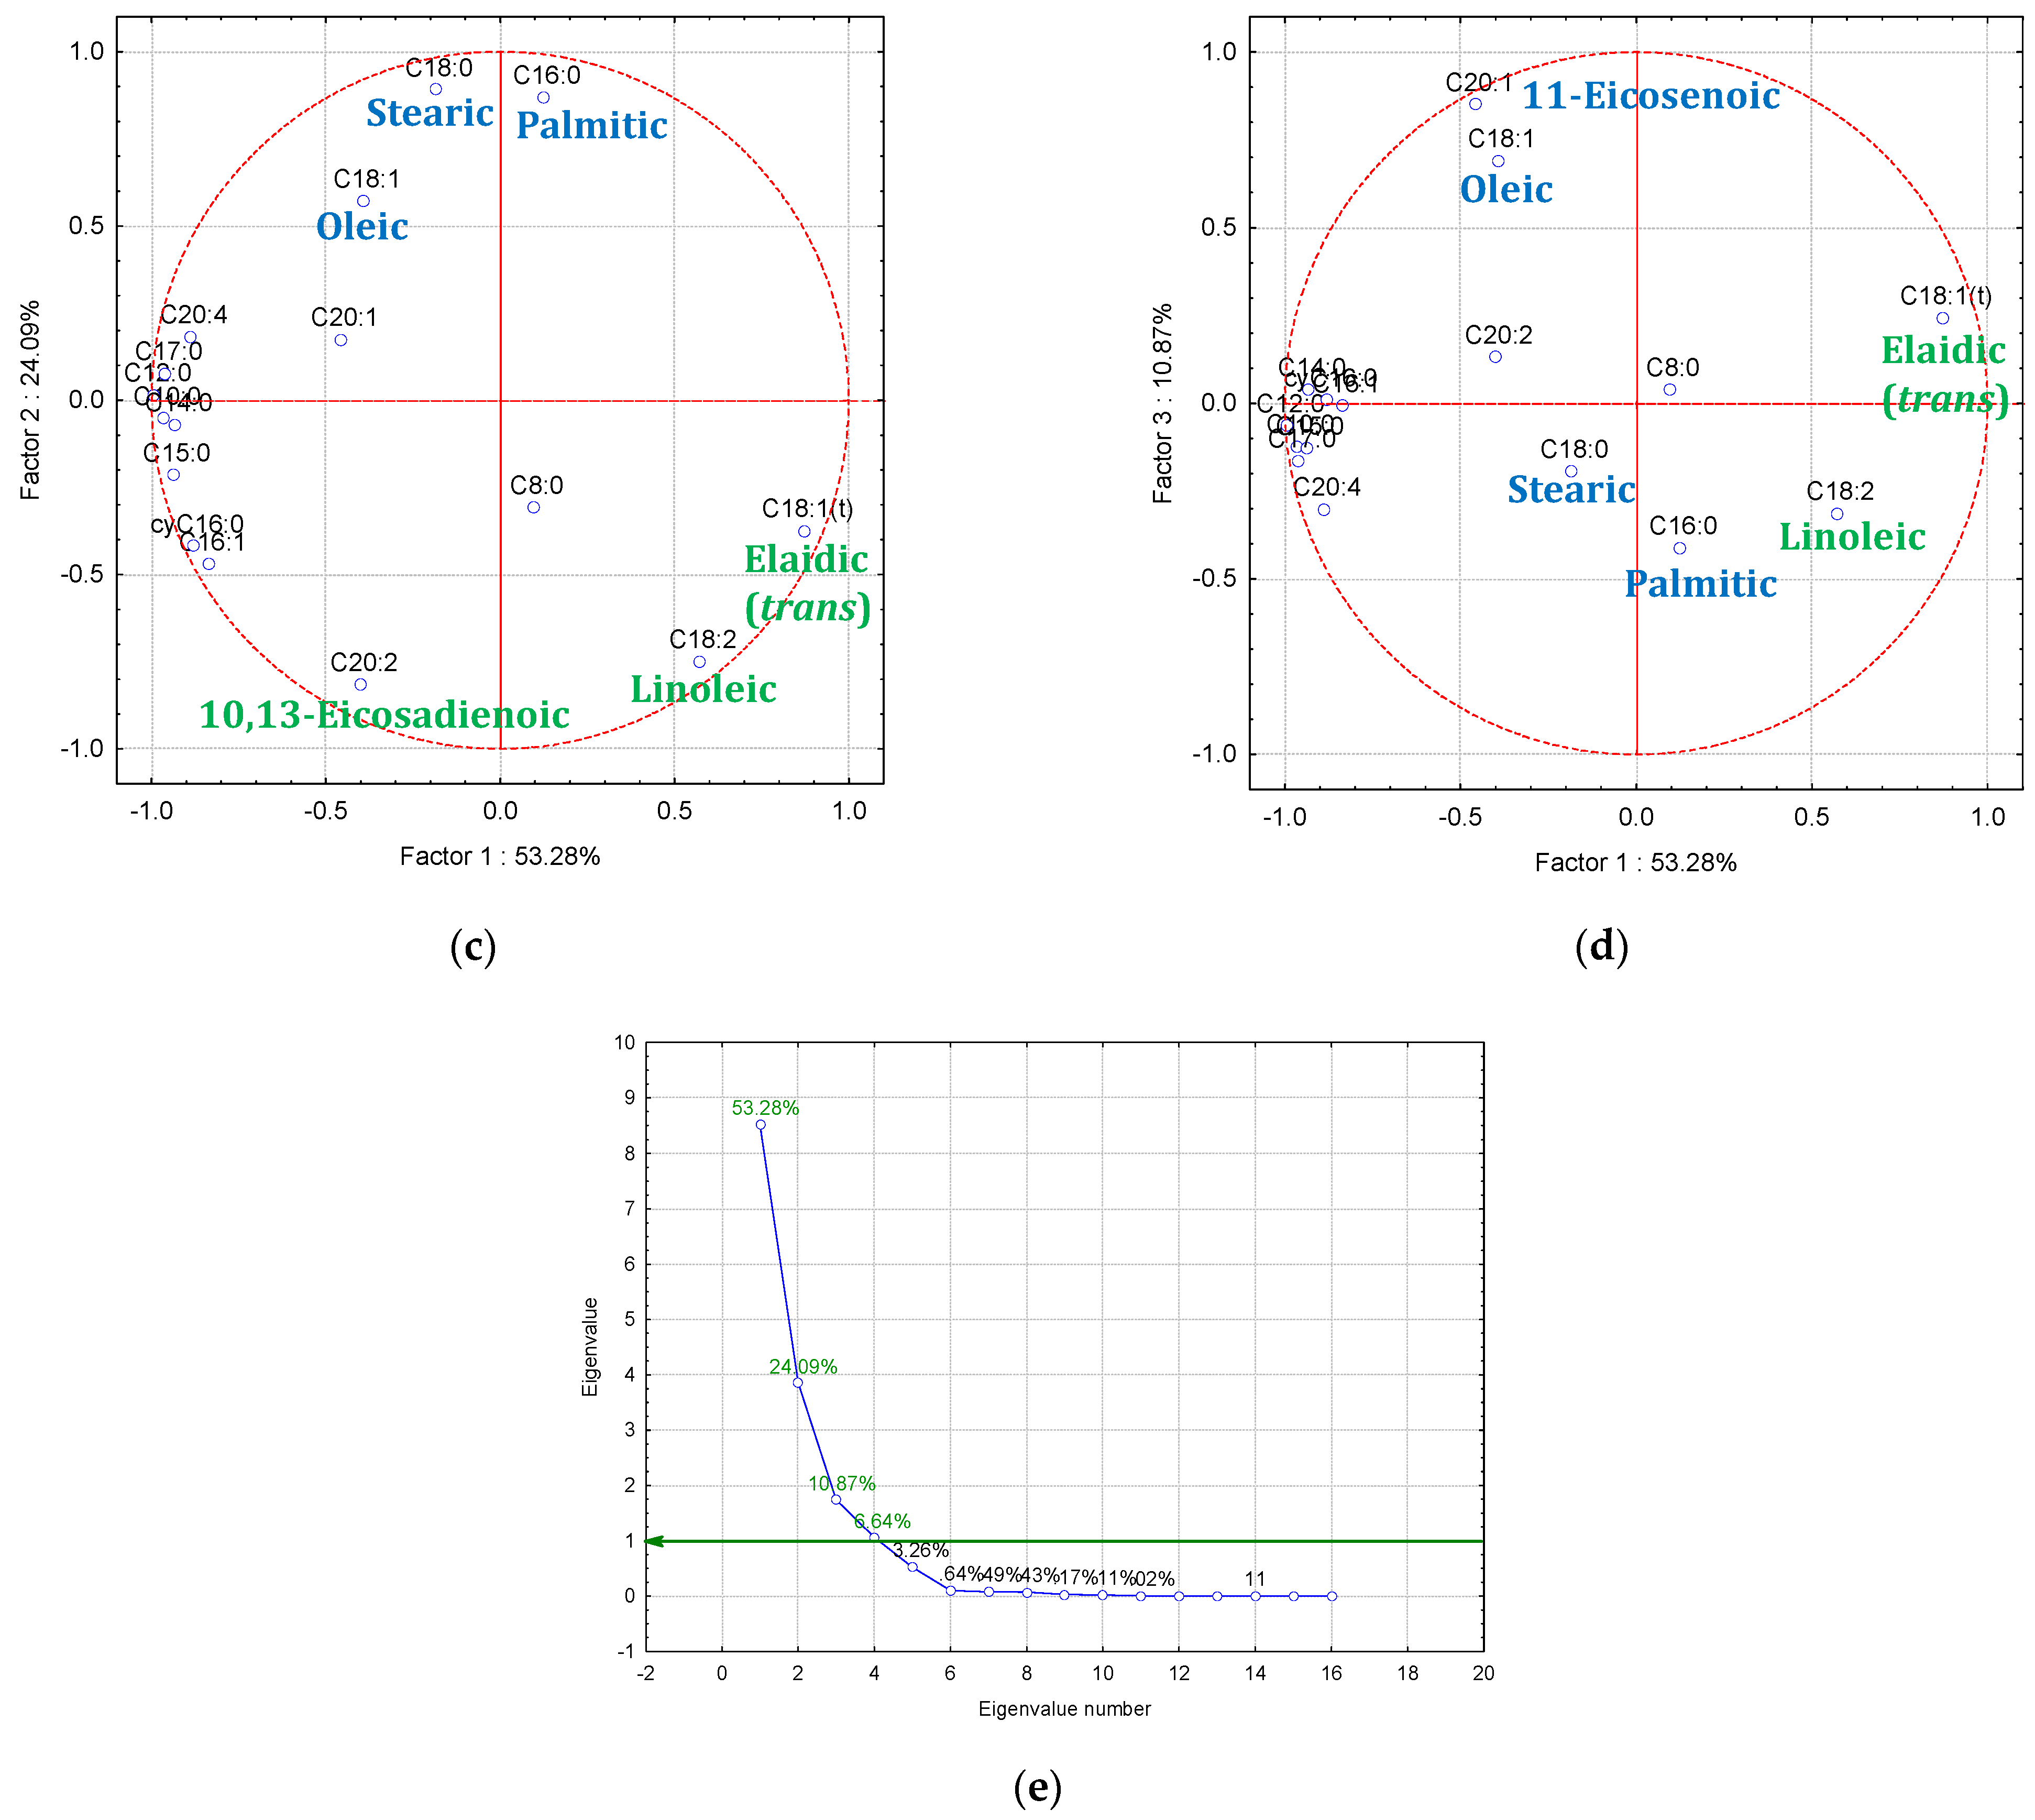
3.3. Gas Chromatography-Mass Spectrometry—Principal Component Analysis (GC-MS-PCA) for the Raw and Thermally Processed Mangalitza Lipid Fractions
4. Conclusions
Supplementary Materials
Author Contributions
Funding
Data Availability Statement
Acknowledgments
Conflicts of Interest
References
- Manunza, A.; Amills, M.; Noce, A.; Cabrera, B.; Zidi, A.; Eghbalsaied, S.; Carrillo-de-Albornoz, E.; Portell, M.; Mercadé, A.; Sànchez, A.; et al. Romanian wild boars and Mangalitza pigs have a European ancestry and harbour genetic signatures compatible with past population bottlenecks. Sci. Rep. 2016, 6, 29913. [Google Scholar] [CrossRef] [PubMed]
- Radović, Č.; Savić, R.; Petrović, M.; Gogić, M.; Lukić, M.; Radojković, D.; Batorek-Lukač, N. Mangalitsa (Swallow-Belly Mangalitsa) Pig. In European Local Pig Breeds—Diversity and Performance; Čandek-Potokar, M., Nieto-Linan, R.M., Eds.; IntechOpen Ltd.: London, UK, 2019; pp. 173–186. [Google Scholar] [CrossRef] [Green Version]
- Alonso, V.; del-Mar-Campo, M.; Español, S.; Roncalés, P.; Beltrán, J.A. Effect of crossbreeding and gender on meat quality and fatty acid composition in pork. Meat Sci. 2009, 81, 209–217. [Google Scholar] [CrossRef]
- Dugan, M.E.R.; Vahmani, P.; Turner, T.D.; Mapiye, C.; Juárez, M.; Prieto, N.; Beaulieu, A.D.; Zijlstra, R.T.; Patience, J.F.; Aalhus, J.L. Pork as a source of omega-3 (n-3) fatty acids. J. Clin. Med. 2015, 4, 1999–2011. [Google Scholar] [CrossRef]
- Huang, Y.; He, Z.; Li, H.; Li, F.; Wu, Z. Effect of antioxidant on the fatty acid composition and lipid oxidation of intramuscular lipid in pressurized pork. Meat Sci. 2012, 91, 137–141. [Google Scholar] [CrossRef] [PubMed]
- Leseigneur-Meynier, A.; Gandemer, G. Lipid composition of pork muscle in relation to the metabolic type of the fibres. Meat Sci. 1991, 29, 229–241. [Google Scholar] [CrossRef]
- Sinclair, A.J.; Barone, S.; Stobaus, T.; Tume, R.; Beilken, S.; Müller, W.; Cunningham, J.; Barnes, J.A.; Greenfield, H. Lipid composition of Australian pork cuts 2005/2006. Food Chem. 2010, 121, 672–681. [Google Scholar] [CrossRef]
- Skobrák, E.B.; Bodnár, K.; Jónás, E.M.; Gundel, J.; Jávor, A. The comparison analysis of the main chemical composition parameters of wild boar meat and pork. Sci. Pap. Anim. Sci. Biotechnol. 2011, 44, 105–112. [Google Scholar]
- Straadt, I.K.; Aaslyng, M.D.; Bertram, H.C. Sensory and consumer evaluation of pork loins from crossbreeds between Danish Landrace, Yorkshire, Duroc, Iberian and Mangalitza. Meat Sci. 2013, 95, 27–35. [Google Scholar] [CrossRef] [PubMed]
- Slover, H.T.; Thompson, R.H., Jr.; Davis, C.S.; Merola, G.V. The lipid composition of raw and cooked fresh pork. J. Food Compos. Anal. 1987, 1, 38–52. [Google Scholar] [CrossRef]
- Anton, D.; Koskar, J.; Raudsepp, P.; Meremäe, K.; Kaart, T.; Püssa, T.; Roasto, M. Antimicrobial and antioxidative efects of plant powders in raw and cooked minced pork. Foods 2019, 8, 661. [Google Scholar] [CrossRef] [Green Version]
- Rocchetti, G.; Bernardo, L.; Pateiro, M.; Barba, F.J.; Munekata, P.E.S.; Trevisan, M.; Lorenzo, J.M.; Lucini, L. Impact of a pitanga leaf extract to prevent lipid oxidation processes during shelf life of packaged pork burgers: An untargeted metabolomic approach. Foods 2020, 9, 1668. [Google Scholar] [CrossRef] [PubMed]
- Parunovic, N.; Petrovic, M.; Djordjevic, V.; Petronijevic, R.; Lakicevic, B.; Petrovic, Z.; Savic, R. Cholesterol content and fatty acids composition of Mangalitsa pork meat. Procedia Food Sci. 2015, 5, 215–218. [Google Scholar] [CrossRef] [Green Version]
- Alexandrescu, D.C.; Cărătuș-Stanciu, M. Ecologic breeding of pigs in Romania—Mangalitsa breed. Ann. Food Sci. Technol. 2018, 19, 636–640. [Google Scholar]
- Cordiş, I.; Mihaiu, M.; Tăbăran, A.; Mihaiu, R.; Dan, S.D.; Reget, O.; Cordea, D.; Mureşan, C. Compositional studies on Mangalitsa meat products for public consumption. Bull. Uasvm Vet. Med. 2015, 72, 57–61. [Google Scholar] [CrossRef] [Green Version]
- Habeanu, M.; Lefter, N.; Gheorghe, A.; Nagy, A.; Marin, D.; Ropota, M. Effects of dietary flaxseed oil on the muscle fatty acid composition in Mangalitsa pigs in an extensive rearing system. South Afr. J. Anim. Sci. 2014, 44, 240–244. [Google Scholar] [CrossRef] [Green Version]
- Lípová, P.; Bučko, O.; Debrecéni, O.; Mrázová, J. Effect of linseed and sunflower seeds in pig diet to fatty acid content in the pork from Mangalitsa. In Proceedings of the International Animal Nutrition PhD Conference—NutriNet 2017, University of South Bohemia, České Budějovice, Czech Republic, 13 September 2017; pp. 66–72. [Google Scholar]
- Parunović, N.; Đorđević, V.; Radović, Č.; Savić, R.; Karabasil, N.; Trbović, D.; Ćirić, J. Effect of rearing system on carcass properties, chemical content and fatty acid composition of backfat from Mangalitsa pigs. Meat Technol. 2020, 61, 37–43. [Google Scholar] [CrossRef]
- Parunović, N.; Petrović, M.; Matekalo-Sverak, V.; Trbović, D.; Mijatović, M.; Radović, Č. Fatty acid profile and cholesterol content of M. longissimus of free-range and conventionally reared Mangalitsa pigs. South Afr. J. Anim. Sci. 2012, 42, 101–113. [Google Scholar] [CrossRef]
- Petrović, M.; Wähner, M.; Radović, Č.; Radojković, D.; Parunović, N.; Savić, R.; Brkić, N. Fatty acid profile of m. longissimus dorsi of Mangalitsa and Moravka pig breeds. Arch. Tierz. 2014, 57, 1–12. [Google Scholar] [CrossRef] [Green Version]
- Oliveira, G.B.; Alewijn, M.; Boerrigter-Eenling, R.; van-Ruth, S.M. Compositional signatures of conventional, free range, and organic pork meat using fingerprint techniques. Foods 2015, 4, 359–373. [Google Scholar] [CrossRef]
- Hrbek, V.; Zdenkova, K.; Jilkova, D.; Cermakova, E.; Jiru, M.; Demnerova, K.; Pulkrabova, J.; Hajslova, J. Authentication of meat and meat products using triacylglycerols profiling and by DNA analysis. Foods 2020, 9, 1269. [Google Scholar] [CrossRef]
- McLafferty, F.W.; Stauffer, D.B. Retrieval and interpretative computer programs for mass spectrometry. J. Chem. Inf. Comput. Sci. 1985, 25, 245–252. [Google Scholar] [CrossRef]
- McLafferty, F.W.; Zhang, M.-Y.; Stauffer, D.B.; Loh, S.Y. Comparison of algorithms and databases for matching unknown mass spectra. J. Am. Soc. Mass Spectrom. 1998, 9, 92–95. [Google Scholar] [CrossRef] [Green Version]
- Stein, S.E. Estimating probabilities of correct identification from results of mass spectral library searches. J. Am. Soc. Mass Spectrom. 1994, 5, 316–323. [Google Scholar] [CrossRef] [Green Version]
- Birău (Mitroi), C.L.; Hădărugă, D.I.; Hădărugă, N.G. Cyclodextrin/Danube common rudd (Scardinius erythrophthalmus L.) oil complexes—Synthesis and characterization. J. Agroaliment. Process. Technol. 2017, 23, 78–84. [Google Scholar]
- Birău (Mitroi), C.L.; Hădărugă, D.I.; Hădărugă, N.G. Synthesis and thermal analysis of β-cyclodextrin/Danube common carp (Cyprinus carpio L.) oil complexes. J. Agroaliment. Process. Technol. 2017, 23, 110–119. [Google Scholar]
- David, I.; Orboi, M.D.; Simandi, M.D.; Chirilă, C.A.; Megyesi, C.I.; Rădulescu, L.; Lukinich-Gruia, A.T.; Muntean, C.; Hădărugă, D.I.; Hădărugă, N.G. Fatty acid profile of Romanian’s common bean (Phaseolus vulgaris L.) lipid fractions and their complexation ability by β-cyclodextrin. PLoS ONE 2019, 14, e0225474. [Google Scholar] [CrossRef] [PubMed]
- Hădărugă, D.I.; Birău (Mitroi), C.L.; Gruia, A.T.; Păunescu, V.; Bandur, G.N.; Hădărugă, N.G. Moisture evaluation of β-cyclodextrin/fish oils complexes by thermal analyses: A data review on common barbel (Barbus barbus L.), Pontic shad (Alosa immaculata Bennett), European wels catfish (Silurus glanis L.), and common bleak (Alburnus alburnus L.) living in Danube river. Food Chem. 2017, 236, 49–58. [Google Scholar] [CrossRef]
- Hădărugă, D.I.; Ünlüsayin, M.; Gruia, A.T.; Birău (Mitroi), C.L.; Rusu, G.; Hădărugă, N.G. Thermal and oxidative stability of Atlantic salmon oil (Salmo salar L.) and complexation with β-cyclodextrin. Beilstein J. Org. Chem. 2016, 12, 179–191. [Google Scholar] [CrossRef] [Green Version]
- Hădărugă, N.G.; Hădărugă, D.I.; Păunescu, V.; Tatu, C.; Ordodi, V.L.; Bandur, G.; Lupea, A.X. Thermal stability of the linoleic acid/α- and β-cyclodextrin complexes. Food Chem. 2006, 99, 500–508. [Google Scholar] [CrossRef]
- Hădărugă, N.G.; Szakal, R.N.; Chirilă, C.A.; Lukinich-Gruia, A.T.; Păunescu, V.; Muntean, C.; Rusu, G.; Bujancă, G.; Hădărugă, D.I. Complexation of Danube common nase (Chondrostoma nasus L.) oil by β-cyclodextrin and 2-hydroxypropyl-β-cyclodextrin. Food Chem. 2020, 303, 125419. [Google Scholar] [CrossRef]
- Ünlüsayin, M.; Hădărugă, N.G.; Rusu, G.; Gruia, A.T.; Păunescu, V.; Hădărugă, D.I. Nano-encapsulation competitiveness of omega-3 fatty acids and correlations of thermal analysis and Karl Fischer water titration for European anchovy (Engraulis encrasicolus L.) oil/β-cyclodextrin complexes. LWT—Food Sci. Technol. 2016, 68, 135–144. [Google Scholar] [CrossRef]
- Vranic, D.; Nikolic, D.; Koricanac, V.; Stanisic, N.; Lilic, S.; Djinovic-Stojanovic, J.; Parunovic, N. Chemical composition and cholesterol content in M. longissimus dorsi from free-range reared Swallow-belly Mangalitsa: The effect of gender. Procedia Food Sci. 2015, 5, 316–319. [Google Scholar] [CrossRef] [Green Version]
- Belitz, H.-D.; Grosch, W.; Schieberle, P. Food Chemistry; Springer: Berlin, Germany, 2009; pp. 158–247, 640–669. [Google Scholar] [CrossRef]
- Quantitative Analysis of trans Fatty Acid by FTIR. Shimadzu—Application News. 2018, A430. Available online: www.ssi.shimadzu.com/sites/ssi.shimadzu.com/files/Products/literature/FTIR/A430.pdf (accessed on 3 December 2020).
- Sinanoglou, V.J.; Cavouras, D.; Xenogiannopoulos, D.; Proestos, C.; Zoumpoulakis, P. Quality assessment of pork and turkey hams using FT-IR spectroscopy, colorimetric, and image analysis. Foods 2018, 7, 152. [Google Scholar] [CrossRef] [PubMed] [Green Version]
- Jimenez-Carvelo, A.M.; Osorio, M.T.; Koidis, A.; Gonzalez-Casado, A.; Cuadros-Rodríguez, L. Chemometric classification and quantification of olive oil in blends with any edible vegetable oils using FTIR-ATR and Raman spectroscopy. LWT—Food Sci. Technol. 2017, 86, 174–184. [Google Scholar] [CrossRef] [Green Version]
- Ozulku, G.; Yildirim, R.M.; Toker, O.S.; Karasu, S.; Durak, M.Z. Rapid detection of adulteration of cold pressed sesame oil adultered with hazelnut, canola, and sunflower oils using ATR-FTIR spectroscopy combined with chemometric. Food Control 2017, 82, 212–216. [Google Scholar] [CrossRef]
- Sherazi, S.T.H.; Talpur, M.Y.; Mahesar, S.A.; Kandhro, A.A.; Arain, S. Main fatty acid classes in vegetable oils by SB-ATR-Fourier transform infrared (FTIR) spectroscopy. Talanta 2009, 80, 600–606. [Google Scholar] [CrossRef]
- Sin, S.F.; Ting, W. An automated approach for analysis of Fourier Transform Infrared (FTIR) spectra of edible oils. Talanta 2012, 88, 537–543. [Google Scholar] [CrossRef]
- Karunathilaka, S.R.; Choi, S.H.; Mossoba, M.M.; Yakes, B.J.; Brückner, L.; Ellsworth, Z.; Srigley, C.T. Rapid classification and quantification of marine oil omega-3 supplements using ATR-FTIR, FT-NIR and chemometrics. J. Food Compos. Anal. 2019, 77, 9–19. [Google Scholar] [CrossRef]
- Vongsvivut, J.; Heraud, P.; Zhang, W.; Kralovec, J.A.; McNaughton, D.; Barrow, C.J. Quantitative determination of fatty acid compositions in micro-encapsulated fish-oil supplements using Fourier transform infrared (FTIR) spectroscopy. Food Chem. 2012, 135, 603–609. [Google Scholar] [CrossRef]
- Mahesar, S.A.; Sherazi, S.T.H.; Kandhro, A.A.; Bhanger, M.I.; Khaskheli, A.R.; Talpur, M.Y. Evaluation of important fatty acid ratios in poultry feed lipids by ATR FTIR spectroscopy. Vib. Spectrosc. 2011, 57, 177–181. [Google Scholar] [CrossRef]
- Rohman, A.; Che-Man, Y.B. FTIR spectroscopy combined with chemometrics for analysis of lard in the mixtures with body fats of lamb, cow, and chicken. Int. Food Res. J. 2010, 17, 519–526. [Google Scholar]
- Rohman, A.; Che-Man, Y.B. The optimization of FTIR spectroscopy combined with partial least square for analysis of animal fats in quartenary mixtures. Spectroscopy 2011, 25, 169–176. [Google Scholar] [CrossRef]
- Fang, G.; Goh, J.Y.; Tay, M.; Lau, H.F.; Li, S.F.Y. Characterization of oils and fats by 1H NMR and GC/MS fingerprinting: Classification, prediction and detection of adulteration. Food Chem. 2013, 138, 1461–1469. [Google Scholar] [CrossRef] [PubMed]
- Ai, F.-F.; Bin, J.; Zhang, Z.-M.; Huang, J.-H.; Wang, J.-B.; Liang, Y.-Z.; Yu, L.; Yang, Z.-Y. Application of random forests to select premium quality vegetable oils by their fatty acid composition. Food Chem. 2014, 143, 472–478. [Google Scholar] [CrossRef]
- Kritioti, A.; Menexes, G.; Drouza, C. Chemometric characterization of virgin olive oils of the two major Cypriot cultivars based on their fatty acid composition. Food Res. Int. 2018, 103, 426–437. [Google Scholar] [CrossRef]
- Peršurić, Ž.; Saftić, L.; Mašek, T.; Kraljević-Pavelić, S. Comparison of triacylglycerol analysis by MALDI-TOF/MS, fatty acid analysis by GC-MS and non-selective analysis by NIRS in combination with chemometrics for determination of extra virgin olive oil geographical origin. A case study. Lwt—Food Sci. Technol. 2018, 95, 326–332. [Google Scholar] [CrossRef]
- Sun, X.; Zhang, L.; Li, P.; Xu, B.; Ma, F.; Zhang, Q.; Zhang, W. Fatty acid profiles based adulteration detection for flaxseed oil by gas chromatography mass spectrometry. LWT—Food Sci. Technol. 2015, 63, 430–436. [Google Scholar] [CrossRef]




| Code 1 | Fatty Acid, Methyl Ester (ω Class) | Class 2 | Retention Time (RT) (Min) | Retention Index (RI) |
|---|---|---|---|---|
| C8:0 | Caprylic acid, methyl ester | SFA | 8.225 ± 0.012 | 1126.2 ± 0.5 |
| C10:0 | Capric acid, methyl ester | SFA | 12.784 ± 0.012 | 1327.8 ± 0.6 |
| C12:0 | Lauric acid, methyl ester | SFA | 17.018 ± 0.016 | 1528.5 ± 0.8 |
| C14:0 | Myristic acid, methyl ester | SFA | 20.873 ± 0.032 | 1734.3 ± 1.8 |
| C15:0 | Pentadecanoic acid, methyl ester | SFA | 22.636 ± 0.020 | 1835.9 ± 1.2 |
| C16:1 | Palmitoleic acid, methyl ester (ω-7) | MUFA | 23.994 ± 0.039 | 1916.5 ± 2.3 |
| C16:0 | Palmitic acid, methyl ester | SFA | 24.472 ± 0.081 | 1945.3 ± 4.9 |
| cyC16:0 | Cyclopropaneoctanoic acid, 2-hexyl-, methyl ester | cySFA | 25.563 ± 0.028 | 2011.6 ± 1.7 |
| C17:0 | Margaric acid, methyl ester | SFA | 25.969 ± 0.024 | 2036.4 ± 1.5 |
| C18:2 | Linoleic acid, methyl ester (ω-6) | PUFA | 27.054 ± 0.051 | 2102.8 ± 3.2 |
| C18:1 | Oleic acid, methyl ester (ω-9) | MUFA | 27.291 ± 0.099 | 2117.3 ± 6.0 |
| C18:1(t) | Vaccenic/Elaidic acid, methyl ester (ω-11/9) | MUFA | 27.328 ± 0.103 | 2119.6 ± 6.3 |
| C18:0 | Stearic acid, methyl ester | SFA | 27.617 ± 0.083 | 2137.2 ± 5.0 |
| C20:4 | Arachidonic acid, methyl ester (ω-6) | PUFA | 29.378 ± 0.028 | 2243.5 ± 1.7 |
| C20:2 | 10,13-Eicosadienoic acid, methyl ester (ω-7) | PUFA | 29.961 ± 0.028 | 2277.9 ± 1.7 |
| C20:1 | 11-Eicosenoic acid, methyl ester (ω-9) | MUFA | 30.053 ± 0.028 | 2283.3 ± 1.6 |
| C20:0 | Arachidic acid, methyl ester | SFA | 30.434 ± 0.024 | 2305.5 ± 1.4 |
| Code | Relative Concentration, % (Layer 1, Unprocessed) | Relative Concentration, % (Layer 1, Processed) |
|---|---|---|
| C8:0 | 0.03 ± 0.01 (0.02–0.03) | 0.04 ± 0.01 (0.03–0.04) |
| C10:0 | 0.21 ± 0.07 (0.16–0.26) | 0.12 ± 0.01 (0.12–0.13) |
| C12:0 | 0.26 ± 0.07 (0.21–0.31) | 0.15 ± 0.02 (0.14–0.17) |
| C14:0 | 2.96 ± 0.54 (2.58–3.34) | 2.54 ± 0.20 (2.40–2.68) |
| C15:0 | 0.16 ± 0.02 (0.15–0.18) | 0.06 ± 0.01 (0.06–0.07) |
| C16:1 | 5.80 ± 0.42 (5.5–6.10) | 3.96 ± 0.21 (3.81–4.11) |
| C16:0 | 22.80 ± 1.90 (21.45–24.14) | 23.53 ± 0.84 (22.94–24.13) |
| cyC16:0 | 0.84 ± 0.02 (0.83–0.86) | 0.40 ± 0.06 (0.36–0.44) |
| C17:0 | 0.66 ± 0.19 (0.52–0.80) | 0.32 ± 0.04 (0.29–0.35) |
| C18:2 | 10.38 ± 6.31 (5.92–14.85) | 8.73 ± 1.85 (7.42–10.04) |
| C18:1 | 38.29 ± 3.07 (36.11–40.46) | 40.62 ± 1.30 (39.71–41.54) |
| C18:1(t) | 2.21 (0.27–4.14) | 4.21 ± 0.12 (4.12–4.29) |
| C18:0 | 10.77 ± 2.96 (8.68–12.86) | 10.84 ± 0.07 (10.79–10.89) |
| C20:4 | 0.56 ± 0.21 (0.41–0.71) | 0.34 ± 0.09 (0.27–0.40) |
| C20:2 | 0.81 ± 0.21 (0.67–0.96) | 0.61 ± 0.06 (0.57–0.65) |
| C20:1 | 0.96 ± 0.06 (0.92–1.00) | 1.13 ± 0.22 (0.98–1.29) |
| C20:0 | 0.23 * | 0.13 ± 0.04 (0.10–0.15) |
| ΣSFA | 37.97 ± 5.93 (33.78–42.16) | 37.74 ± 0.47 (37.41–38.07) |
| ΣMUFA | 45.05 ± 3.55 (42.54–47.56) | 45.72 ± 1.72 (44.50–46.94) |
| ΣPUFA | 11.76 ± 6.31 (7.29–16.22) | 9.68 ± 1.70 (8.48–10.88) |
| Code | Relative Concentration, % (Layer 2, Unprocessed) | Relative Concentration, % (Layer 2, Processed) |
|---|---|---|
| C8:0 | 0.03 ± 0.01 (0.02–0.03) | 0.01 ± 0.00 (0.01–0.02) |
| C10:0 | 0.20 ± 0.03 (0.18–0.22) | 0.09 ± 0.01 (0.08–0.10) |
| C12:0 | 0.26 ± 0.05 (0.22–0.30) | 0.13 ± 0.02 (0.12–0.14) |
| C14:0 | 3.01 ± 0.45 (2.70–3.33) | 2.35 ± 0.11 (2.27–2.43) |
| C15:0 | 0.15 ± 0.03 (0.13–0.17) | 0.07 ± 0.00 (0.07–0.07) |
| C16:1 | 5.34 ± 1.20 (4.49–6.19) | 3.92 ± 0.24 (3.75–4.10) |
| C16:0 | 22.12 ± 0.37 (21.86–22.38) | 22.93 ± 0.19 (22.8–23.07) |
| cyC16:0 | 0.77 ± 0.29 (0.56–0.97) | 0.44 ± 0.02 (0.43–0.45) |
| C17:0 | 0.63 ± 0.09 (0.56–0.69) | 0.3 ± 0.00 (0.30–0.31) |
| C18:2 | 7.19 ± 1.98 (5.79–8.59) | 10.73 ± 0.15 (10.63–10.84) |
| C18:1 | 41.88 ± 0.70 (41.39–42.38) | 39.86 ± 0.08 (39.81–39.92) |
| C18:1(t) | 2.25 ± 0.35 (2.00–2.49) | 4.54 ± 0.15 (4.43–4.64) |
| C18:0 | 11.13 ± 0.34 (10.89–11.38) | 10.15 ± 0.26 (9.97–10.33) |
| C20:4 | 0.45 ± 0.08 (0.39–0.50) | 0.29 ± 0.01 (0.28–0.30) |
| C20:2 | 0.81 ± 0.01 (0.80–0.82) | 0.63 ± 0.04 (0.60–0.66) |
| C20:1 | 1.36 ± 0.19 (1.23–1.49) | 1.08 ± 0.05 (1.04–1.12) |
| C20:0 | 0.18 ± 0.02 (0.17–0.19) | 0.12 ± 0.00 (0.12–0.12) |
| ΣSFA | 37.71 ± 0.04 (37.68–37.73) | 36.17 ± 0.30 (35.95–36.38) |
| ΣMUFA | 48.59 ± 2.09 (47.11–50.07) | 44.87 ± 0.11 (44.79–44.94) |
| ΣPUFA | 8.45 ± 1.89 (7.11–9.79) | 11.65 ± 0.21 (11.50–11.79) |
| Code | Relative Concentration, % (Layer 3, Unprocessed) | Relative Concentration, % (Layer 3, Processed) |
|---|---|---|
| C8:0 | 0.02 ± 0.00 (0.02–0.03) | 0.06 ± 0.03 (0.04–0.09) |
| C10:0 | 0.20 ± 0.00 (0.19–0.20) | 0.15 ± 0.01 (0.15–0.16) |
| C12:0 | 0.25 ± 0.01 (0.24–0.26) | 0.17 ± 0.02 (0.15–0.18) |
| C14:0 | 3.13 ± 0.11 (3.05–3.21) | 2.79 ± 0.25 (2.62–2.97) |
| C15:0 | 0.16 ± 0.01 (0.15–0.17) | 0.09 ± 0.01 (0.08–0.09) |
| C16:1 | 6.68 ± 0.23 (6.52–6.84) | 5.27 ± 0.40 (4.99–5.56) |
| C16:0 | 21.53 ± 0.32 (21.31–21.76) | 21.38 ± 0.96 (20.70–22.06) |
| cyC16:0 | 0.94 ± 0.01 (0.94–0.95) | 0.61 ± 0.04 (0.58–0.64) |
| C17:0 | 0.54 ± 0.01 (0.53–0.54) | 0.36 ± 0.01 (0.35–0.36) |
| C18:2 | 9.77 ± 1.20 (8.92–10.62) | 13.06 ± 0.13 (12.97–13.15) |
| C18:1 | 40.85 ± 1.16 (40.03–41.67) | 38.67 ± 0.80 (38.1–39.23) |
| C18:1(t) | 3.36 ± 0.17 (3.24–3.48) | 4.22 ± 0.78 (3.67–4.77) |
| C18:0 | 7.88 ± 0.20 (7.73–8.02) | 8.14 ± 0.23 (7.97–8.31) |
| C20:4 | 0.42 ± 0.01 (0.41–0.43) | 0.35 ± 0.02 (0.34–0.37) |
| C20:2 | 0.85 ± 0.04 (0.82–0.88) | 0.82 ± 0.12 (0.74–0.90) |
| C20:1 | 1.24 ± 0.07 (1.19–1.29) | 1.03 ± 0.04 (1.00–1.06) |
| C20:0 | 0.17 ± 0.05 (0.13–0.20) | 0.10 ± 0.01 (0.09–0.11) |
| ΣSFA | 33.87 ± 0.29 (33.67–34.07) | 33.24 ± 0.96 (32.56–33.92) |
| ΣMUFA | 48.77 ± 1.01 (48.06–49.49) | 44.98 ± 0.44 (44.66–45.29) |
| ΣPUFA | 11.04 ± 1.15 (10.23–11.85) | 14.24 ± 0.03 (14.22–14.26) |
| Sample Code | Ald-C6:0 | Ald-C9:0 | AldAc-C12:0 1 | Ald-C18:2 1 |
|---|---|---|---|---|
| Retention index (RI) | 976.0 ± 0.5 | 1280.0 ± 0.6 | 1600.7 ± 0.8 | 1703.1 ± 2.9 |
| Retention time (RT) (min) | 5.037 ± 0.011 | 11.714 ± 0.013 | 18.420 ± 0.015 | 20.314 ± 0.052 |
| U1 | 0.013 ± 0.012 (0.005–0.022) | 0.009 ± 0.005 (0.005–0.012) | 0.018 ± 0.005 (0.014–0.021) | 0.008 ± 0.004 (0.006–0.011) |
| P1 | 0.018 ± 0.001 (0.017–0.019) | 0.022 ± 0.002 (0.020–0.023) | 0.060 ± 0.023 (0.043–0.076) | 0.015 ± 0.008 (0.010–0.021) |
| U2 | 0.003 ± 0.001 (0.002–0.003) | 0.005 ± 0.001 (0.004–0.005) | 0.009 ± 0.001 (0.008–0.009) | 0.009 ± 0.002 (0.007–0.010) |
| P2 | 0.023 ± 0.007 (0.018–0.027) | 0.019 ± 0.002 (0.018–0.020) | 0.042 ± 0.002 (0.040–0.043) | 0.011 ± 0.004 (0.008–0.014) |
| U3 | 0.003 ± 0.000 (0.002–0.003) | 0.004 ± 0.001 (0.003–0.004) | 0.010 ± 0.003 (0.008–0.012) | 0.010 ± 0.003 (0.007–0.012) |
| P3 | 0.026 ± 0.006 (0.022–0.030) | 0.022 ± 0.009 (0.016–0.028) | 0.032 ± 0.002 (0.030–0.033) | 0.007 ± 0.003 (0.005–0.009) |
Publisher’s Note: MDPI stays neutral with regard to jurisdictional claims in published maps and institutional affiliations. |
© 2021 by the authors. Licensee MDPI, Basel, Switzerland. This article is an open access article distributed under the terms and conditions of the Creative Commons Attribution (CC BY) license (http://creativecommons.org/licenses/by/4.0/).
Share and Cite
Petroman, C.; Popescu, G.; Szakal, R.-N.; Păunescu, V.; Drăghia, L.P.; Bujancă, G.S.; Chirilă, C.A.; Hădărugă, D.I.; Văduva, L.; Hădărugă, N.G.; et al. Fatty Acid Profile of Lipid Fractions of Mangalitza (Sus scrofa domesticus) from Northern Romania: A GC-MS-PCA Approach. Foods 2021, 10, 242. https://doi.org/10.3390/foods10020242
Petroman C, Popescu G, Szakal R-N, Păunescu V, Drăghia LP, Bujancă GS, Chirilă CA, Hădărugă DI, Văduva L, Hădărugă NG, et al. Fatty Acid Profile of Lipid Fractions of Mangalitza (Sus scrofa domesticus) from Northern Romania: A GC-MS-PCA Approach. Foods. 2021; 10(2):242. https://doi.org/10.3390/foods10020242
Chicago/Turabian StylePetroman, Cornelia, Gabriela Popescu, Raymond-Nandy Szakal, Virgil Păunescu, Lavinia P. Drăghia, Gabriel S. Bujancă, Cosmina A. Chirilă, Daniel I. Hădărugă, Loredana Văduva, Nicoleta G. Hădărugă, and et al. 2021. "Fatty Acid Profile of Lipid Fractions of Mangalitza (Sus scrofa domesticus) from Northern Romania: A GC-MS-PCA Approach" Foods 10, no. 2: 242. https://doi.org/10.3390/foods10020242
APA StylePetroman, C., Popescu, G., Szakal, R.-N., Păunescu, V., Drăghia, L. P., Bujancă, G. S., Chirilă, C. A., Hădărugă, D. I., Văduva, L., Hădărugă, N. G., & Petroman, I. (2021). Fatty Acid Profile of Lipid Fractions of Mangalitza (Sus scrofa domesticus) from Northern Romania: A GC-MS-PCA Approach. Foods, 10(2), 242. https://doi.org/10.3390/foods10020242


