3.1. Spectral Characterization of NADES Standard Solutions
The spectra of OHTyr and Tyr in NADES were acquired and analyzed.
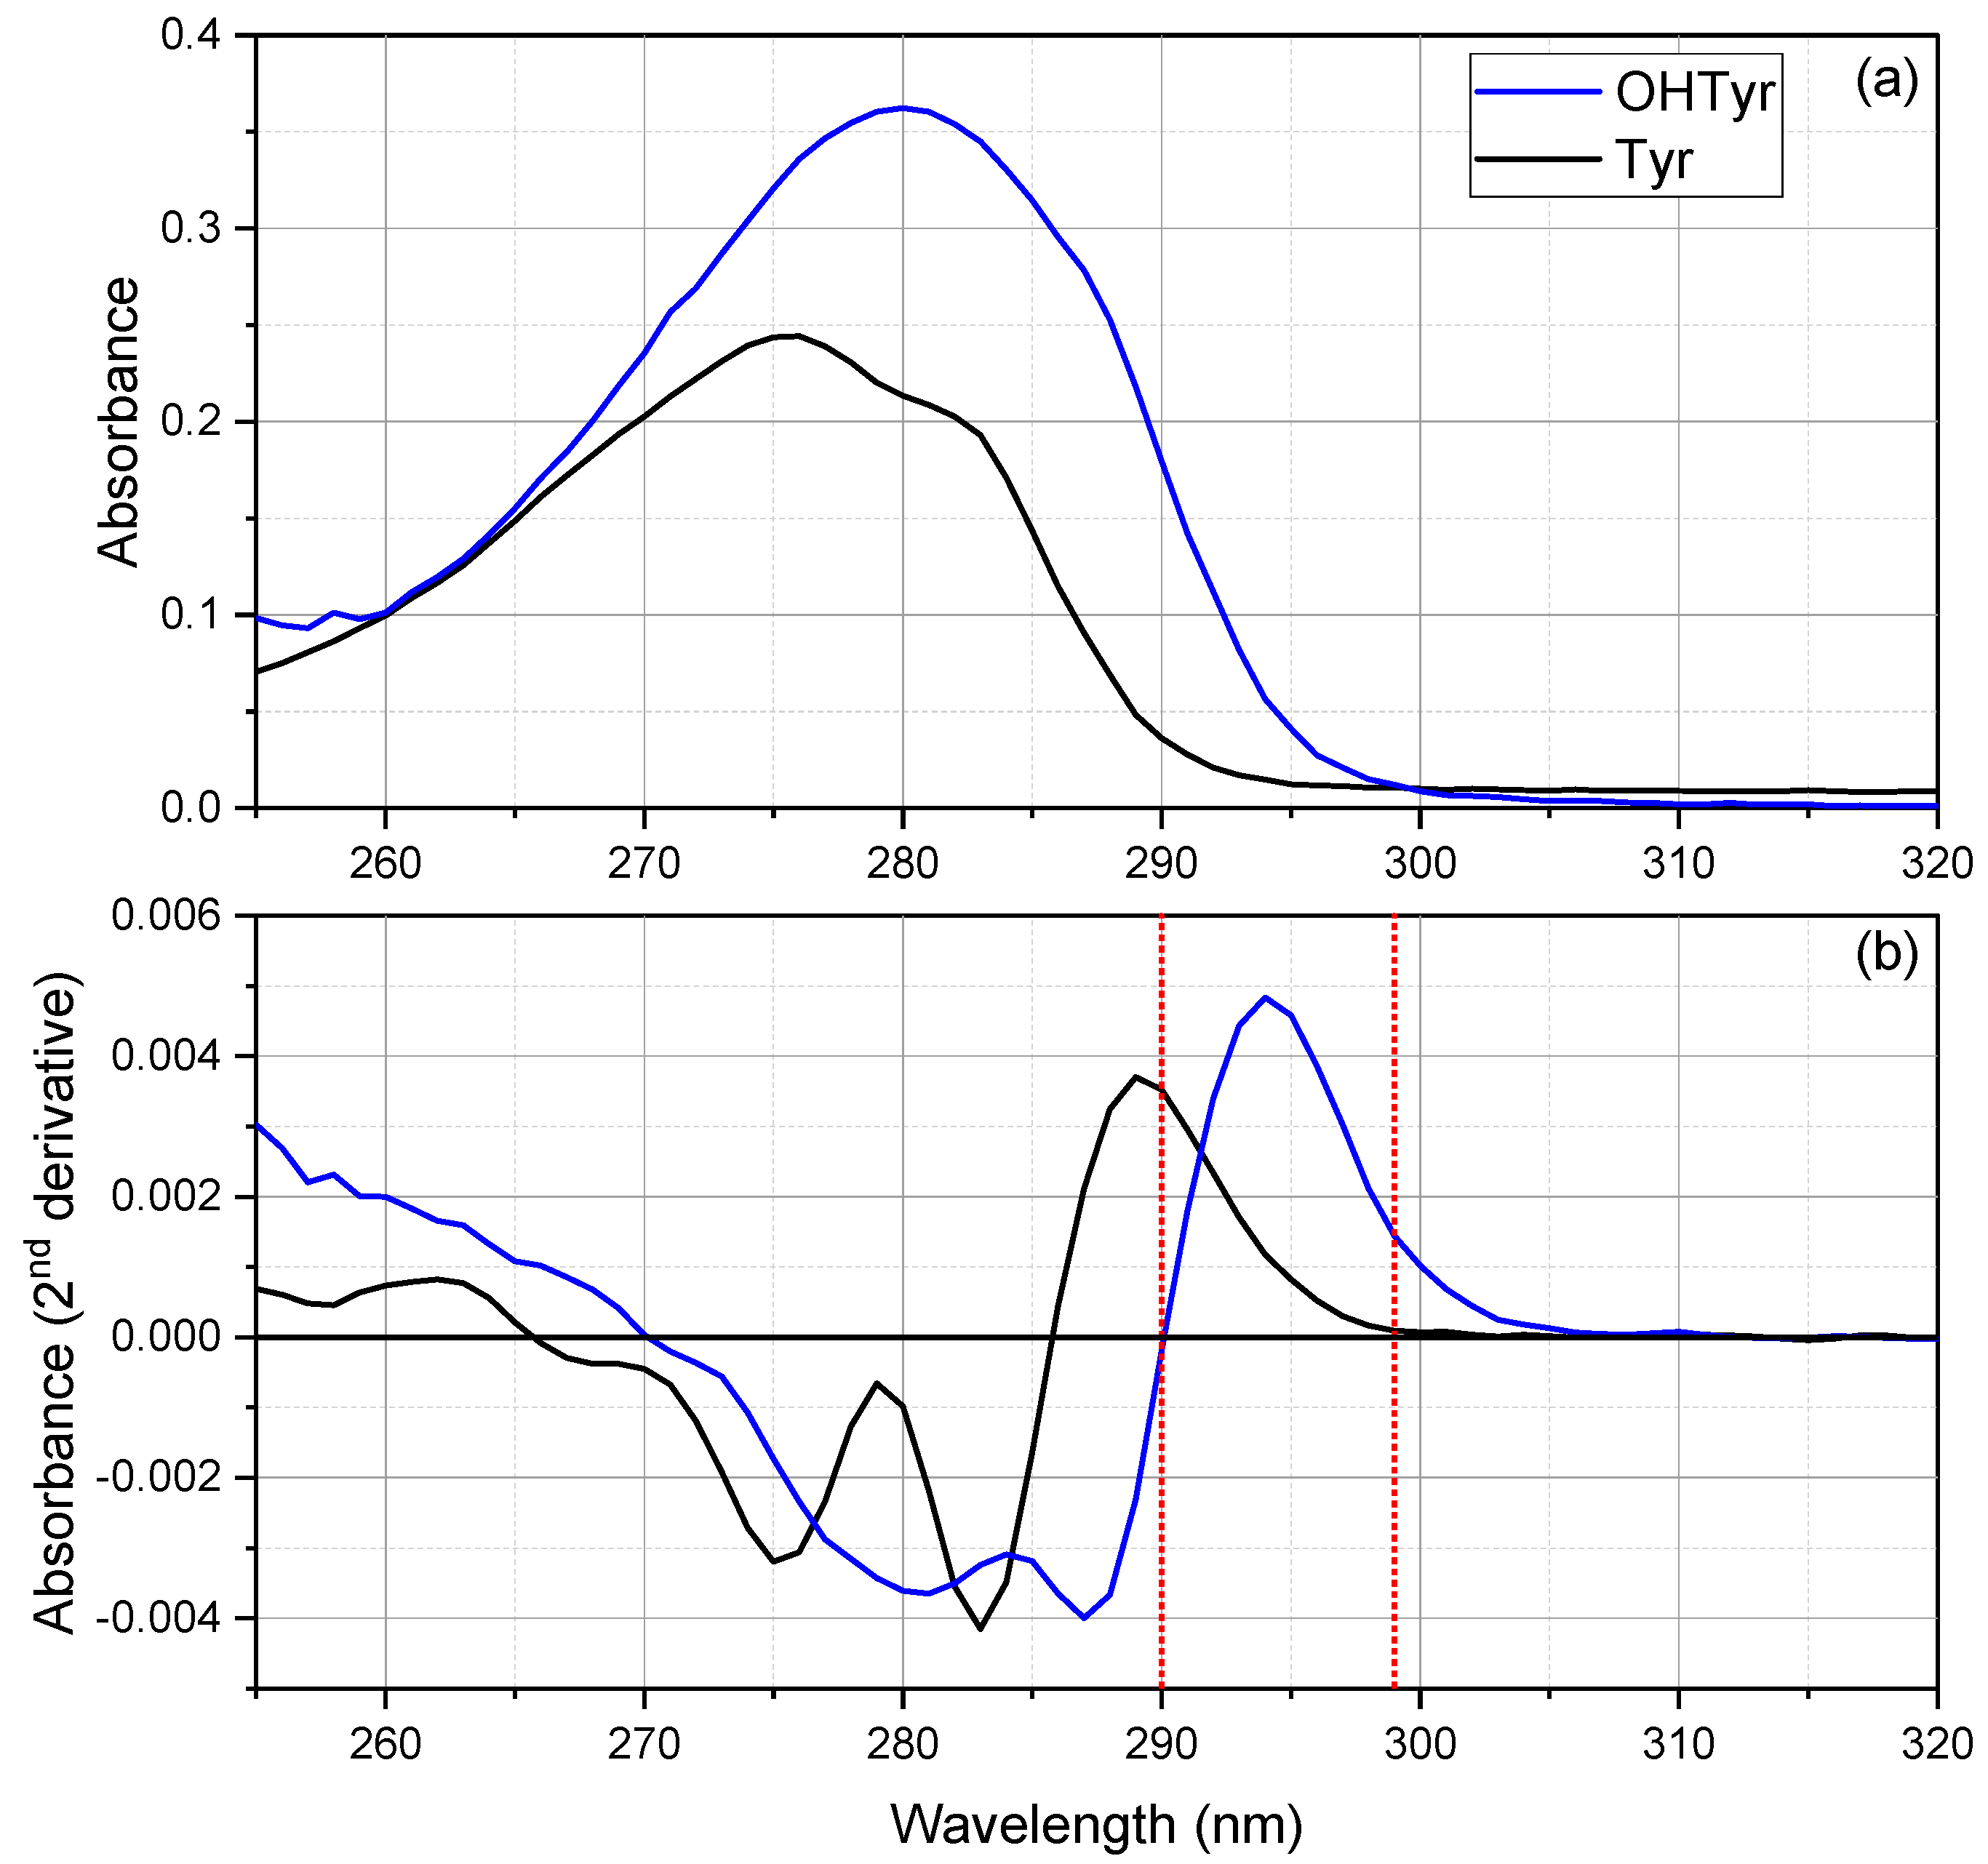
Figure 1 reports the mean spectra (a), and the second derivatives (b) of both compounds at the concentration of 20 mg L
−1. The application of a second derivative treatment allows highlighting minor or subtle spectral features, and resolves spectral overlapping [
23,
24,
25]. Valleys in the second derivative spectra correspond to peaks in direct absorption spectra, and vice versa.
As regards OHTyr, the spectrum showed a large peak at 280 nm (λ
max = 280 nm, ε
λmax = 2793 M
−1 cm
−1). The molar extinction (e) determined for OHTyr in NADES was lower than that reported for OHTyr in water [
26]. The second derivative showed more spectral features, with two negative peaks at 281 nm and 287 nm, and a positive peak at 294 nm, with a slight shoulder on the right. Spectra of NADES solutions at different concentrations of OHTyr (3, 5, 10, 20, 30 mg L
−1) were acquired. Then, a rapid screening via analysis of correlation (data not shown) indicated that the wavelengths that showed the best correlation of the second derivative of the spectrum with the concentrations of OHTyr were 294, 299, 286, and 280 nm (
r = 0.99878,
r = 0.9986,
r = 0.99853, and
r = 0.99839, respectively,
n = 15).
As regards Tyr, the spectrum showed a peak at 276 nm and a shoulder at about 283 nm (λmax = 276 nm, ελmax = 1676 M−1 cm−1). Therefore, hypsochromic and hypochromic shifts of the absorbance were observed for the monophenolic group of Tyr compared to the o-diphenolic structure of OHTyr. Spectra of NADES solutions at different concentrations of Tyr (5, 10, 20, 30, 40 mg L−1) were acquired. The analysis of correlation (data not shown) indicated that the wavelengths that showed the best correlation of the second derivative of the spectrum with the concentrations of Tyr were 290, 274, and 282 nm (r = 0.99911, r = 0.99897, r = 0.99883 respectively, n = 15).
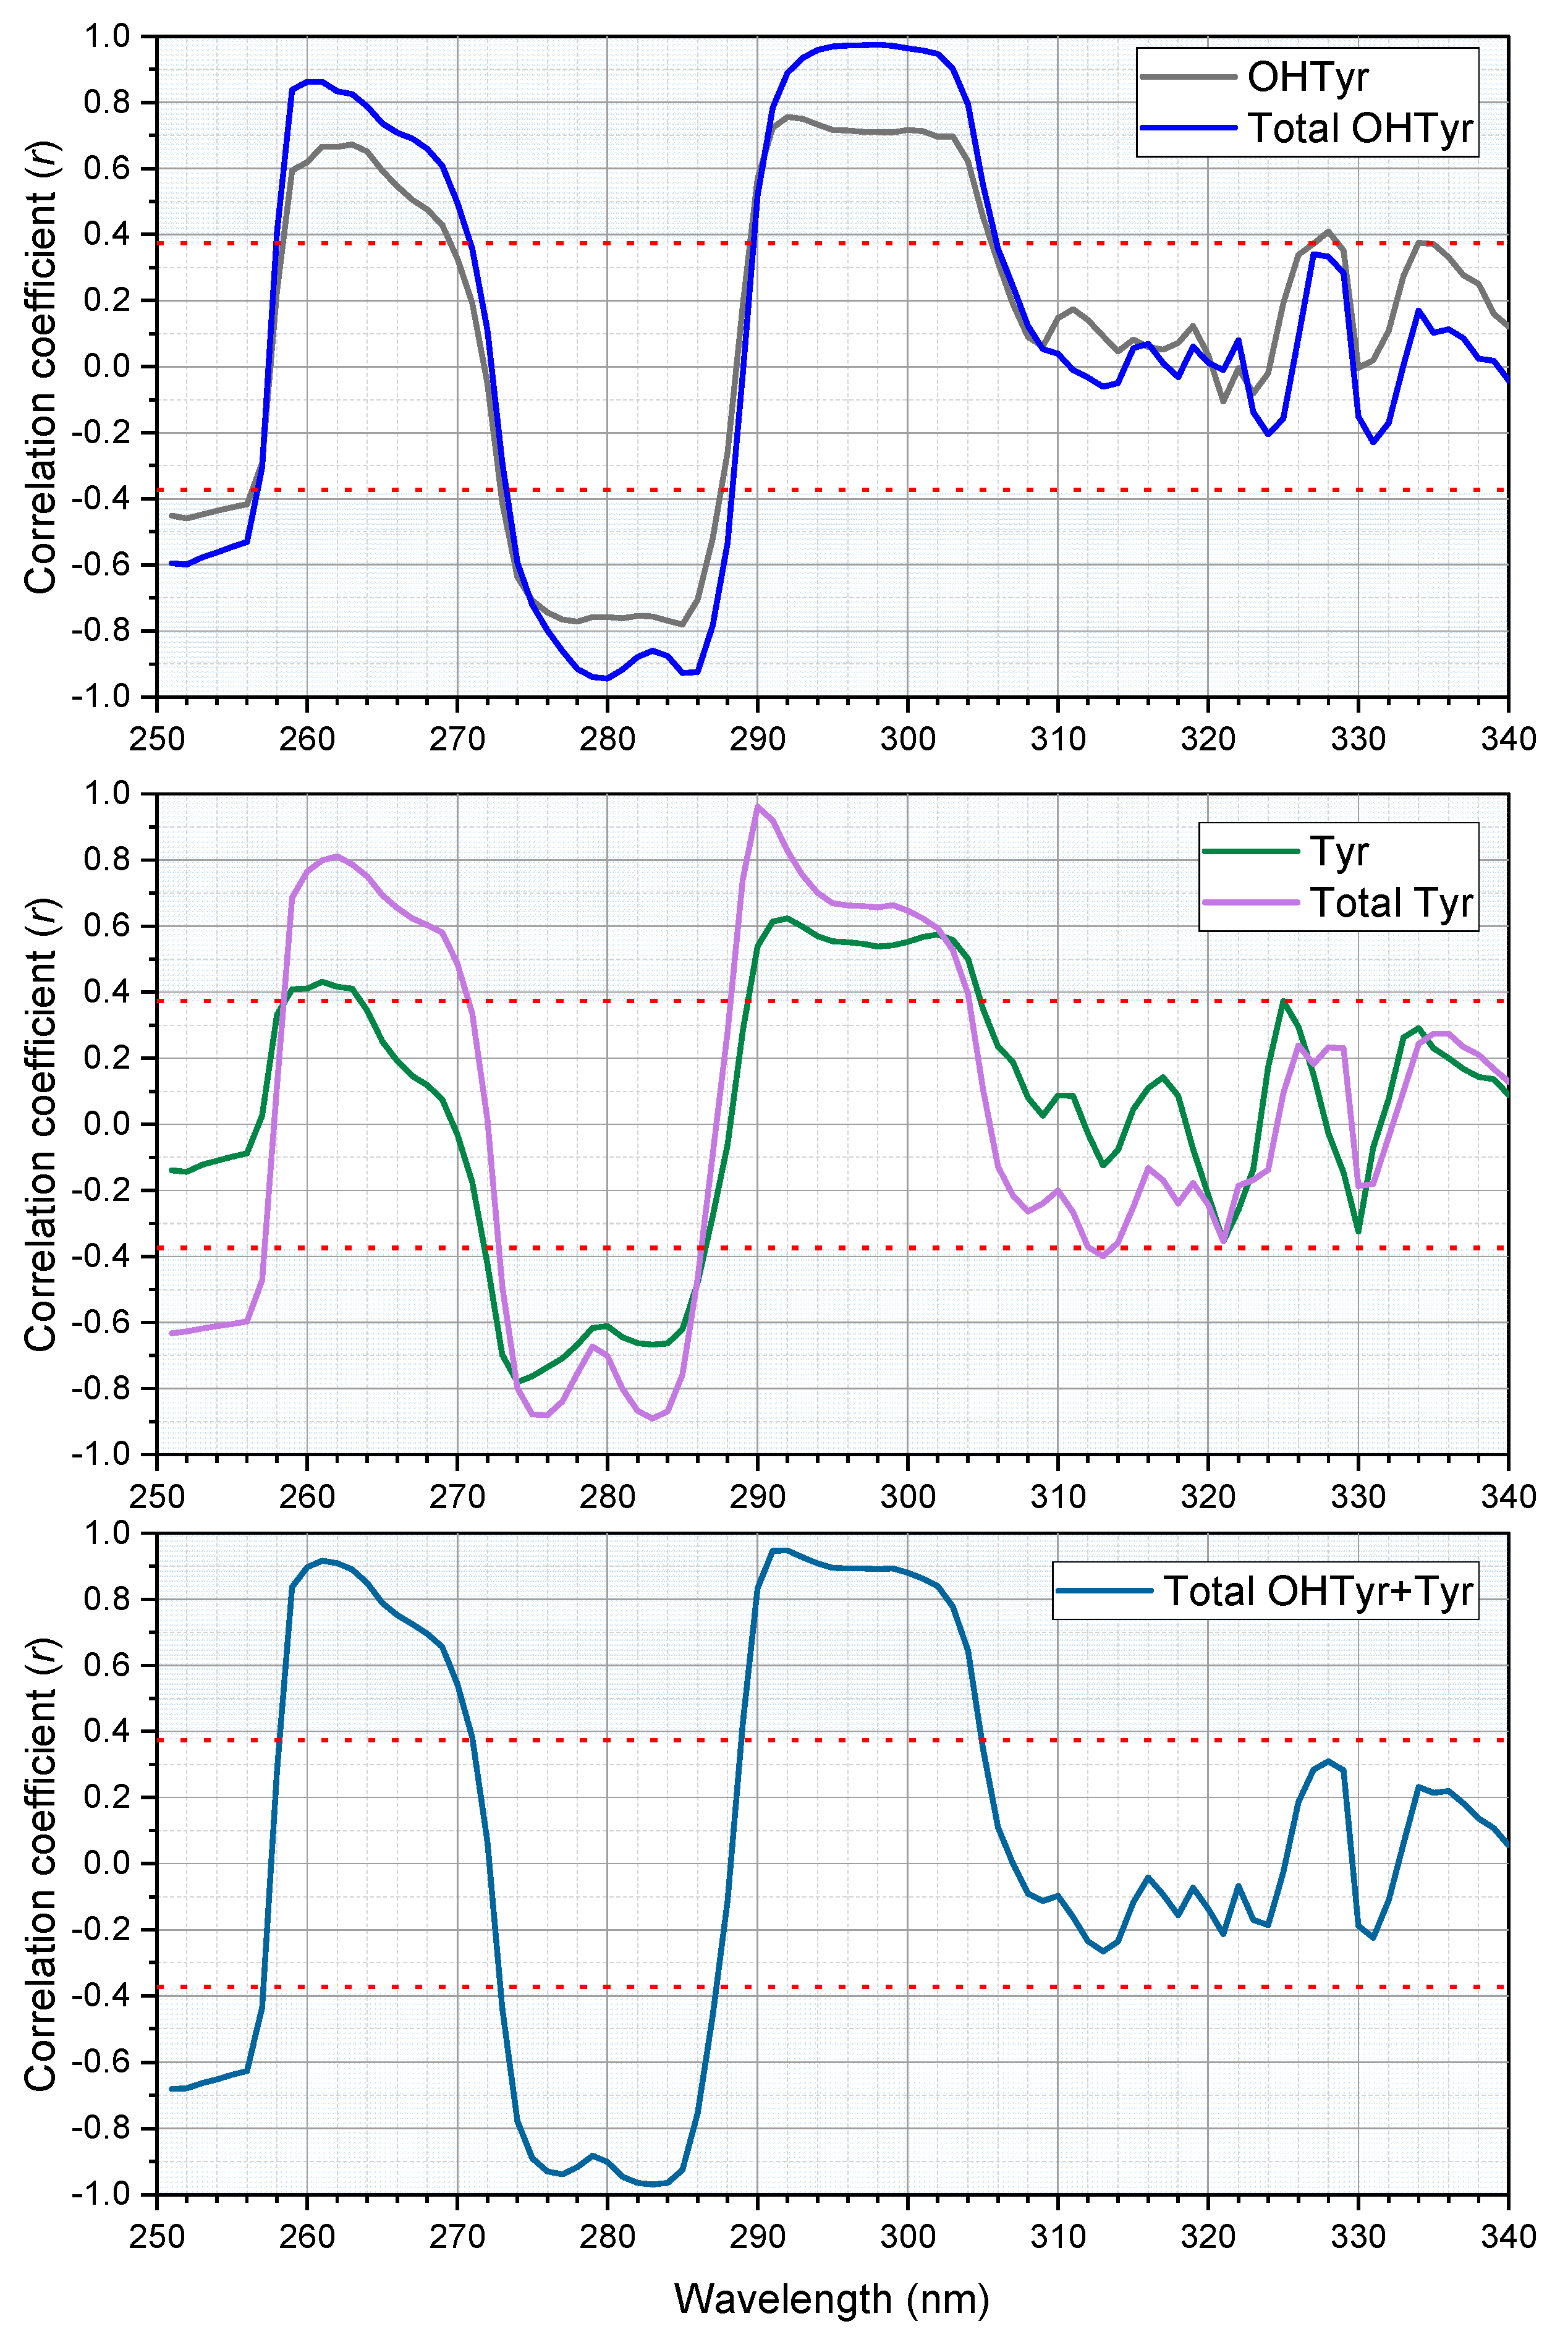
3.3. Analysis of Correlation
An analysis of correlation was carried out on the second derivative of absorption of the NADES extracts of the 26 EVOO samples with their contents of free and total OHTyr and Tyr (reported in
Supplementary Table S1). The correlation analysis confirmed the relationships between the spectral features of the extracts and the content of phenolic compounds in the oils (
Figure 3). OHTyr contents were associated with a peak of negative correlation with the second derivative of absorption at 280 and 285 nm. On the other hand, a positive correlation was observed with the second derivative of absorption in the range 293–302 nm (maximum at 299 nm, where a
r value of 0.9563 was reached). Hypsochromic shifts were observed for the peaks of correlation with the contents of Tyr (negative correlation with the second derivatives at 276 and 283 nm, and a maximum positive correlation at 290 nm). These results confirm that the spectral information contained in the NADES extracts of the oils was strictly related to their content of OHTyr and Tyr.
Notably, correlations were clearly higher when relating total OHTyr and Tyr rather than their free forms. This means that absorbance of the NADES extracts in the UV range can be attributed, rather than to specific molecules (i.e., free OHTyr and free Tyr), to specific moieties of a wide range of phenolic antioxidants (i.e., both free and esterified OHTyr and Tyr moieties). This is confirmed by the data in
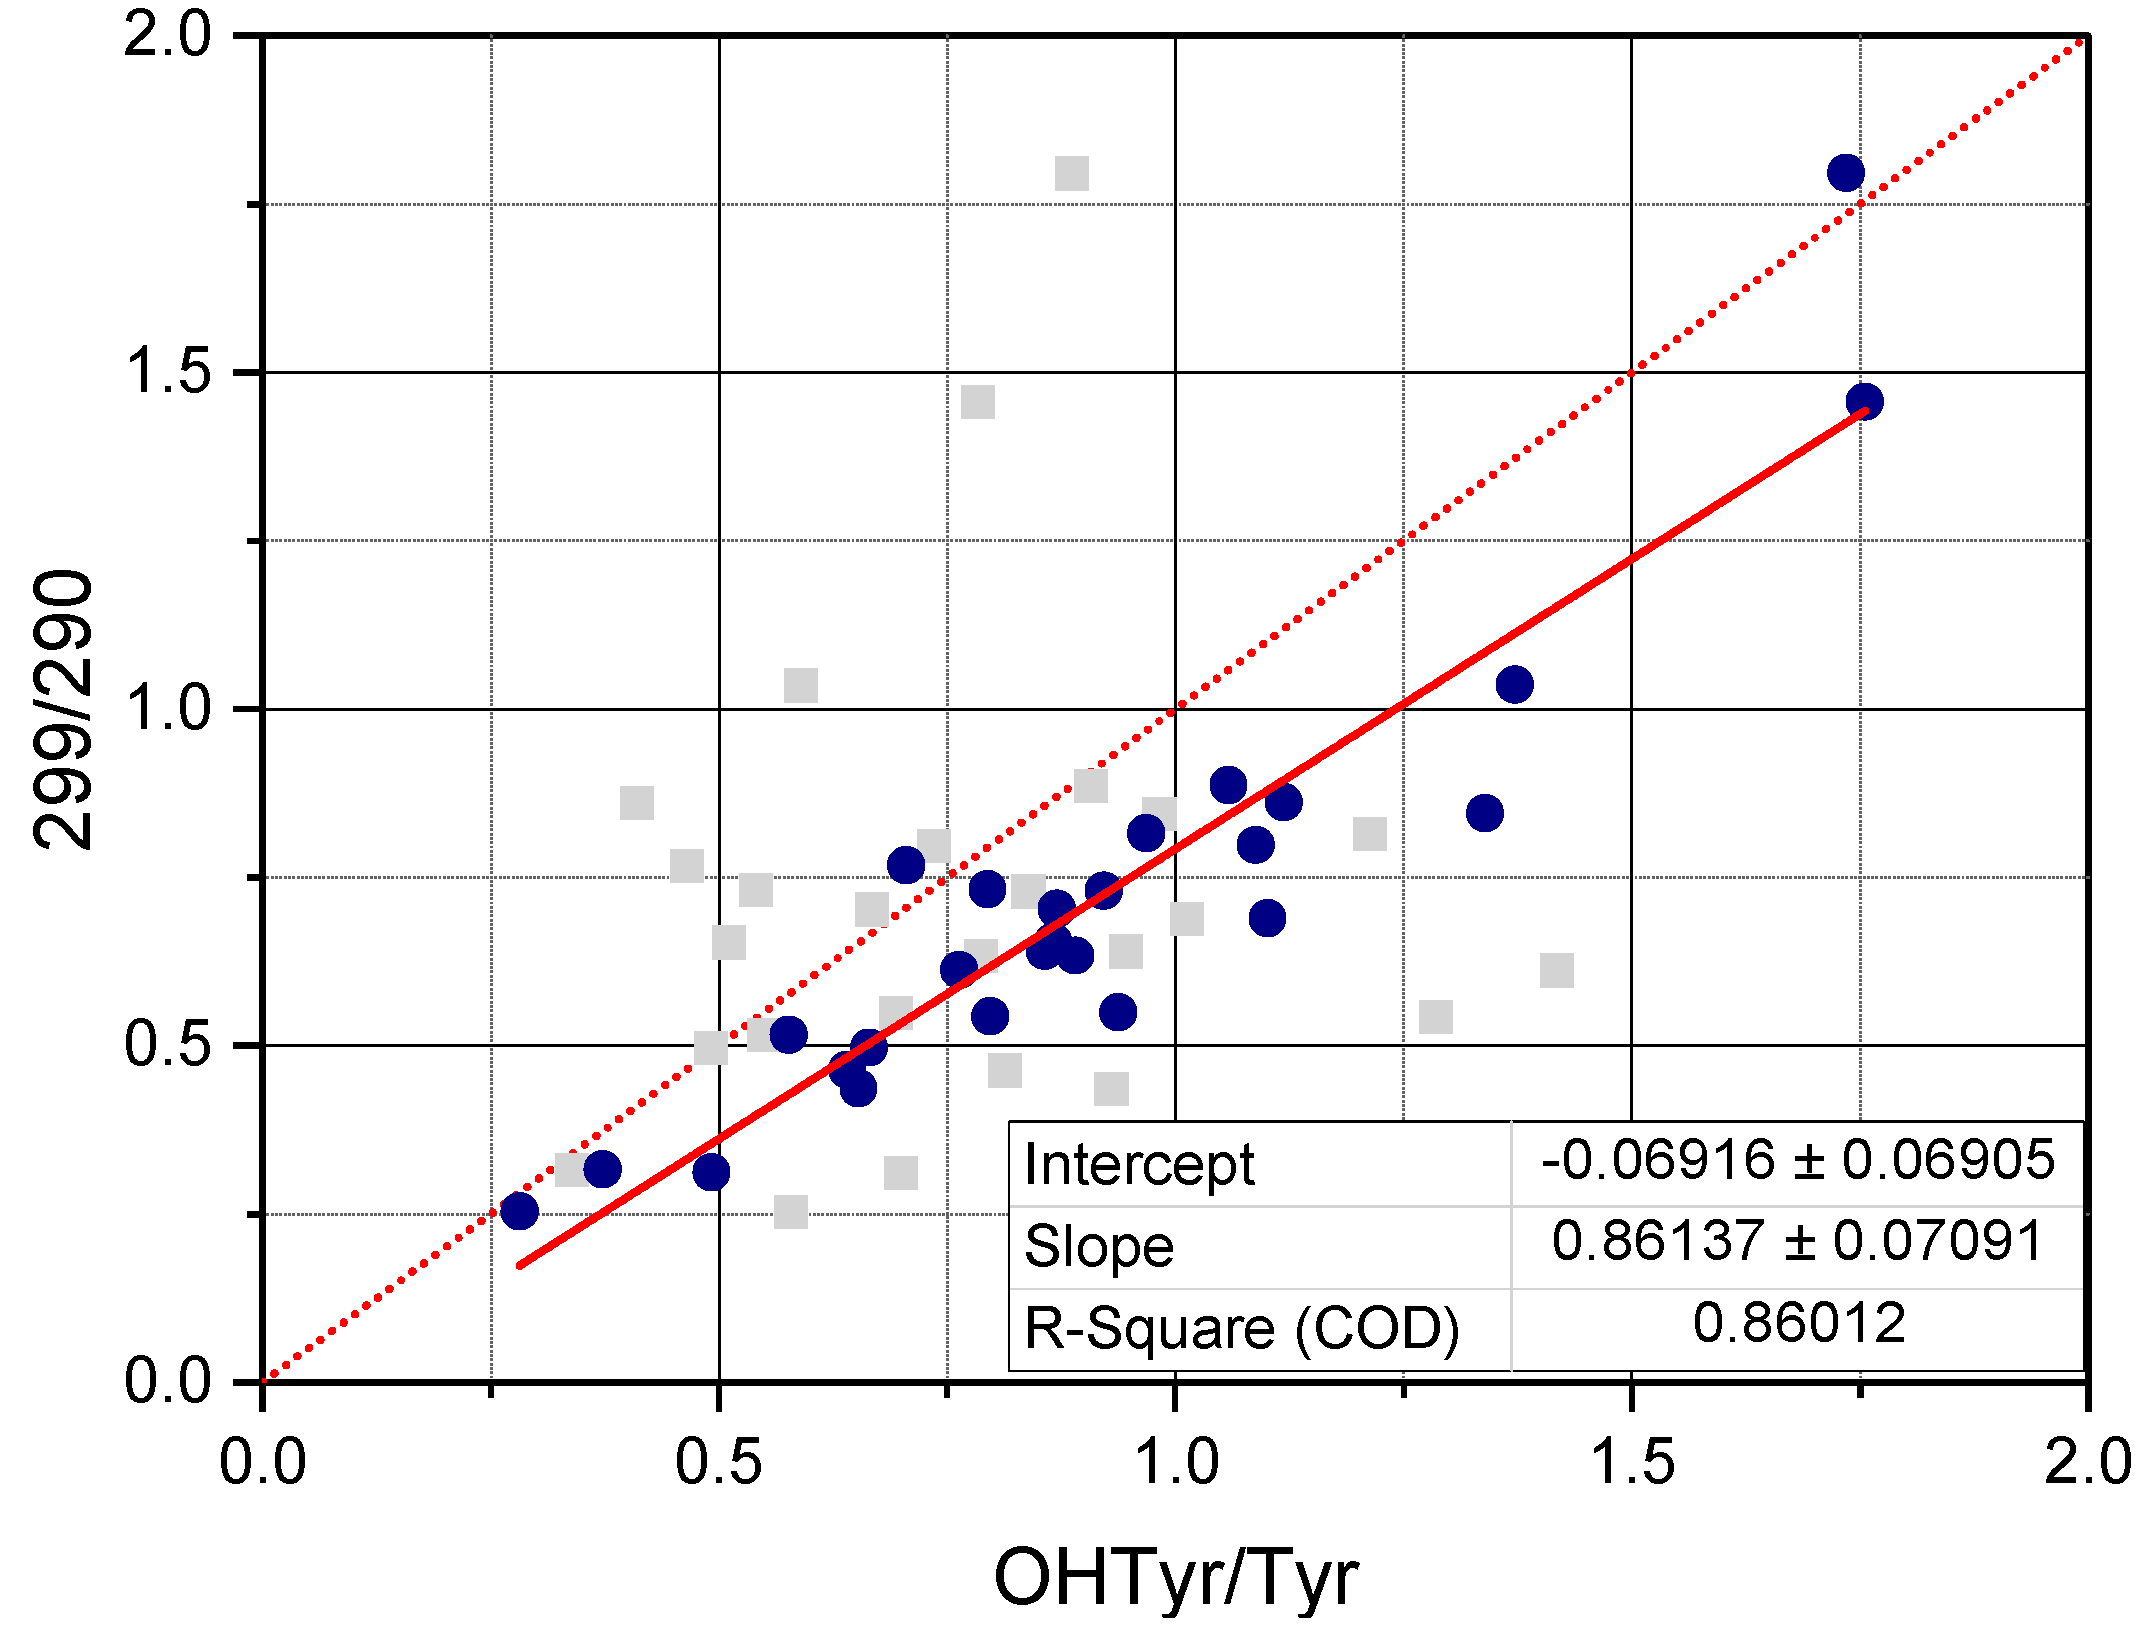
Figure 4, were the ratio between the values of the second derivative of absorbance at 299 nm and 290 nm (normalized by the extinction coefficients respectively of OHTyr and Tyr) of the NADES extracts is plotted against the corresponding ratio of either free OHTyr to free Tyr, or total OHTyr to total Tyr.
3.4. Determination of Total OHTyr and Tyr
On the basis of the UV spectral information of the NADES extracts, a quantitation of total OHTyr and Tyr could be approached. According to the analysis of OHTyr and Tyr spectra, as well as to the correlation analysis of the NADES extracts of the EVOO sample set, two different wavelengths were selected for the determination of total OHTyr and Tyr. As regards OHTyr, considering the overlaps with the spectra of Tyr, the wavelength selected for the calibration curve was 299 nm. For Tyr, the wavelength 290 nm was considered optimal, since it corresponded with a zero-point of the derivative of OHTyr spectrum.
The selected wavelengths allowed obtaining calibration curves of both OHTyr and Tyr in NADES, in the ranges 3–30 mg L−1 for OHTyr, and 5–40 mg L−1 for Tyr, with R2 values of 0.997 and 0.998, respectively.
Table 1 reports the parameters of the calibration curves:
where
Aλ is the second derivative of the absorbance at the selected wavelength l,
C is the concentration of the analyte in NADES,
a is the intercept, and
b is the slope.
The determination of Tyr was carried out on the basis of the second derivative of absorption at 290 nm of the extracts and of the parameters of the calibration curve of Tyr in NADES.
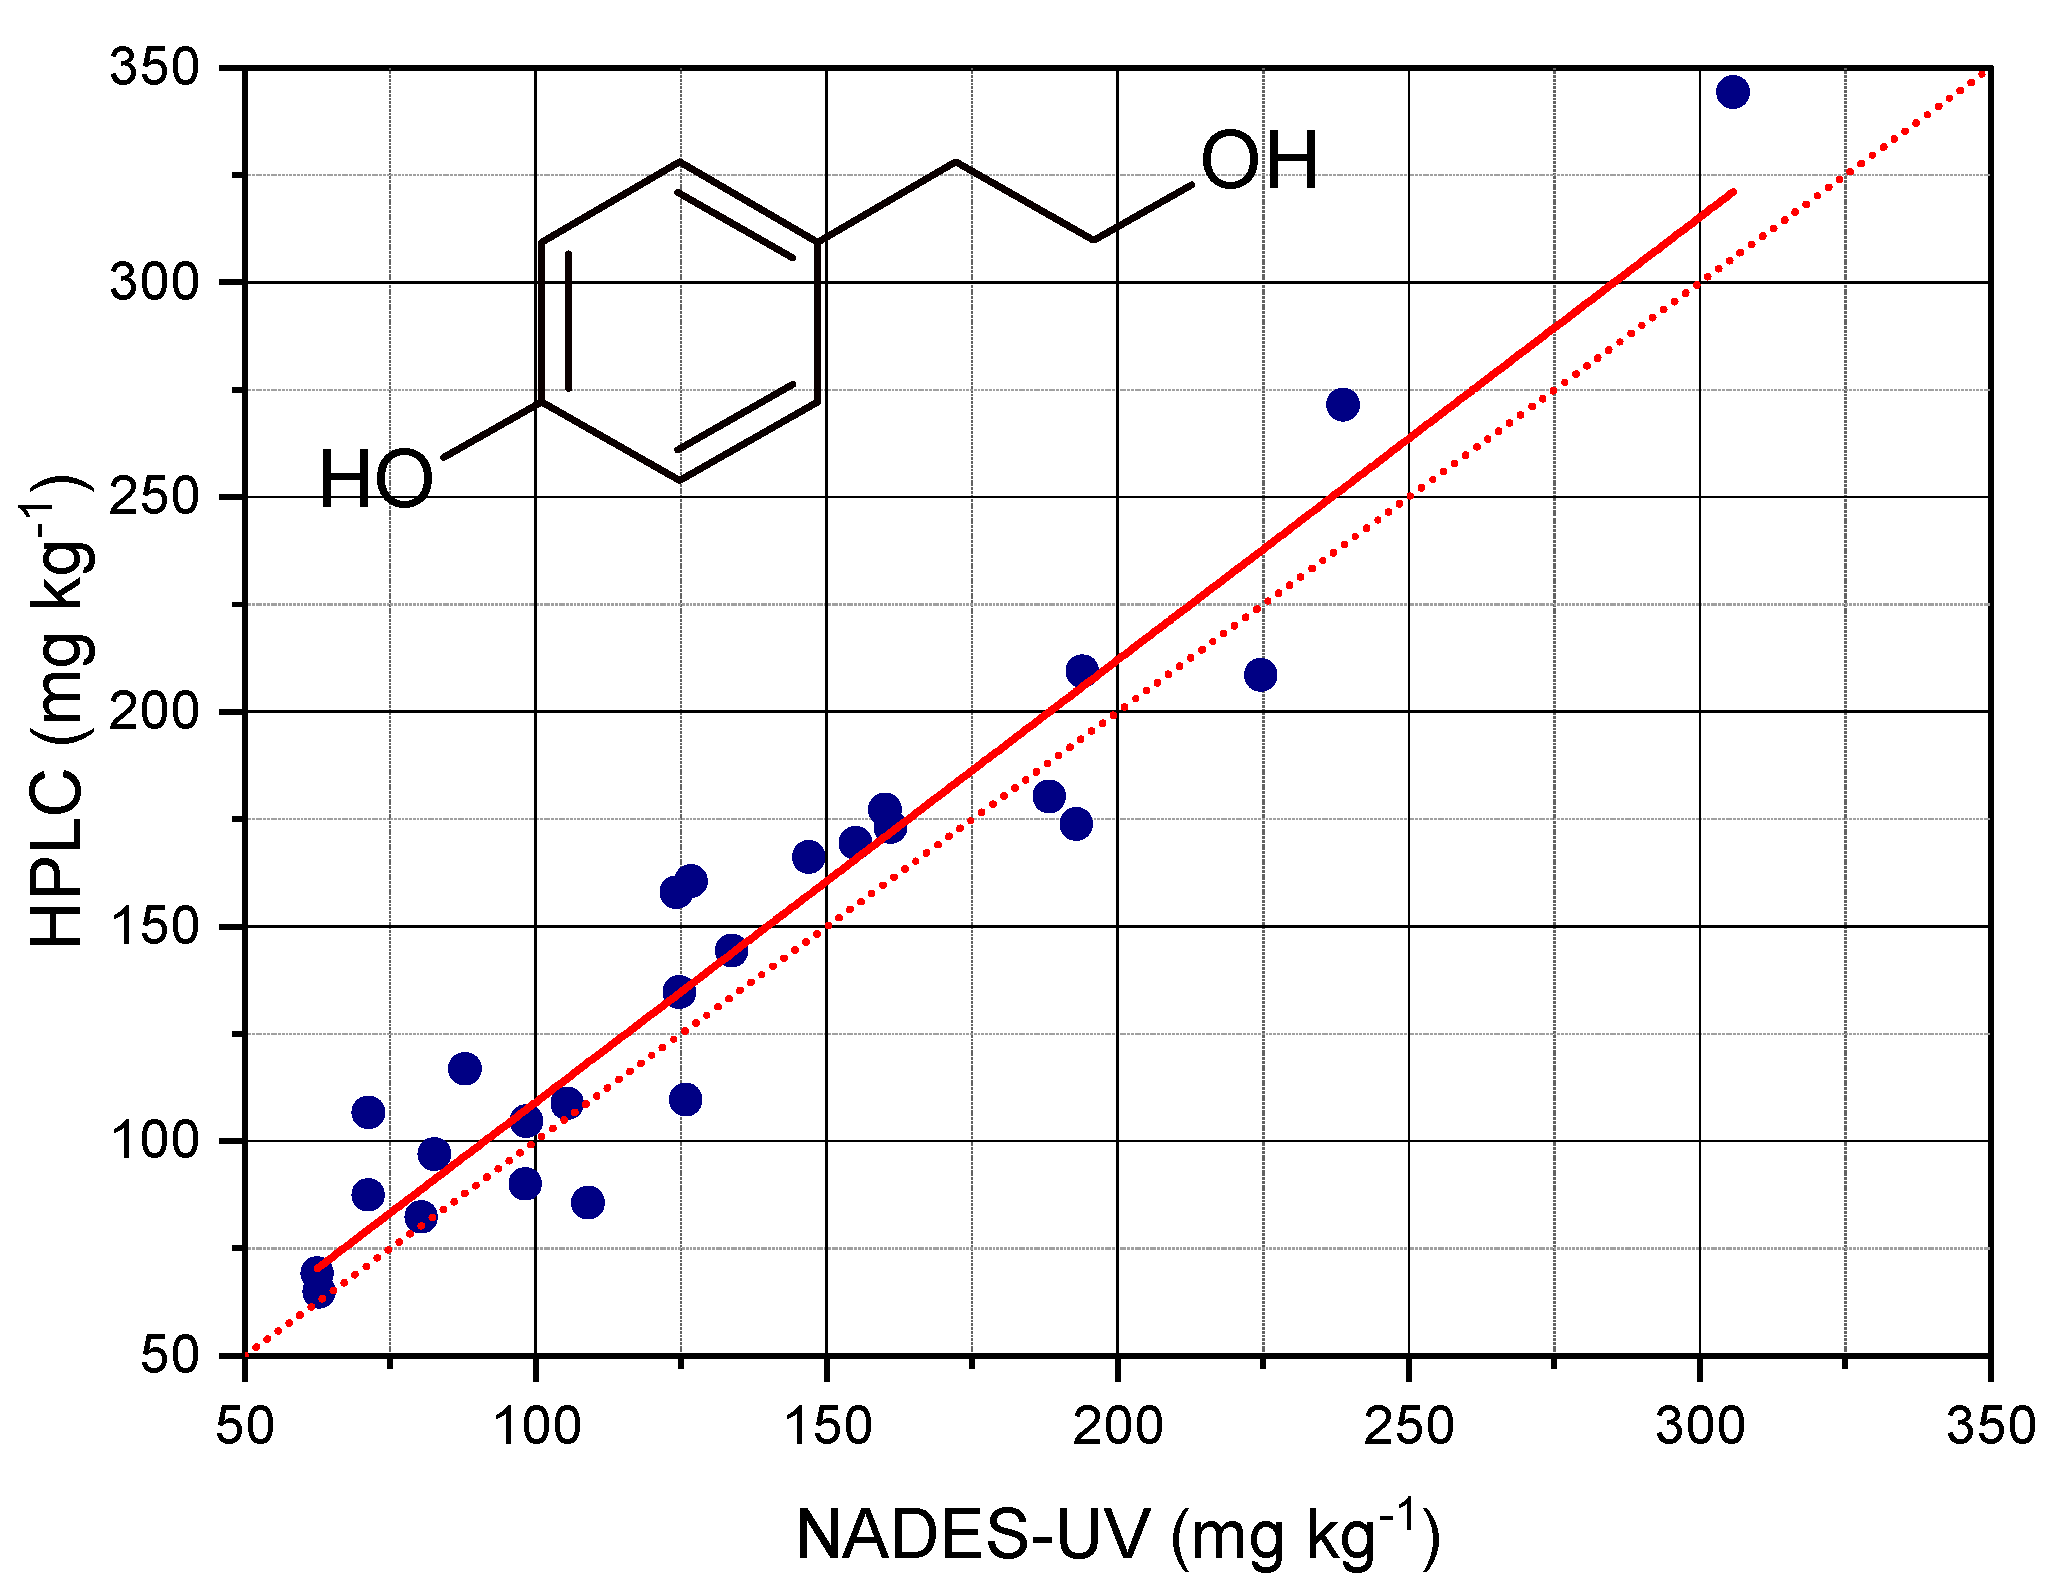
Figure 5 reports the contents of total Tyr determined by HPLC after hydrolysis of the extracts plotted versus the contents of total Tyr determined by NADES extraction and UV analysis.
The analysis of regression showed that the contents of Tyr determined by the NADES-UV method allowed predicting the contents determined by acid hydrolysis and HPLC with an accuracy corresponding to a R
2 value of 0.925. The parameters of the regression are reported in
Table 2. The prediction performance of the method was clearly better compared to those observed in our previous works [
10,
17]. The root mean square error (RMSE) was 18 mg kg
−1, corresponding to a RMSE% of 5.8%. The improved performance of this method could be due to the use of derivative processing of the spectra. Moreover, the comparison with the method of determination of total Tyr after hydrolysis could highlight the sensitivity of the NADES-UV method towards specific structural features in the phenolic pattern of EVOO. The slope of the curve was very near to 1; the amounts determined nu NADES- UV were very close to those determined by acid hydrolysis and HPLC analysis.
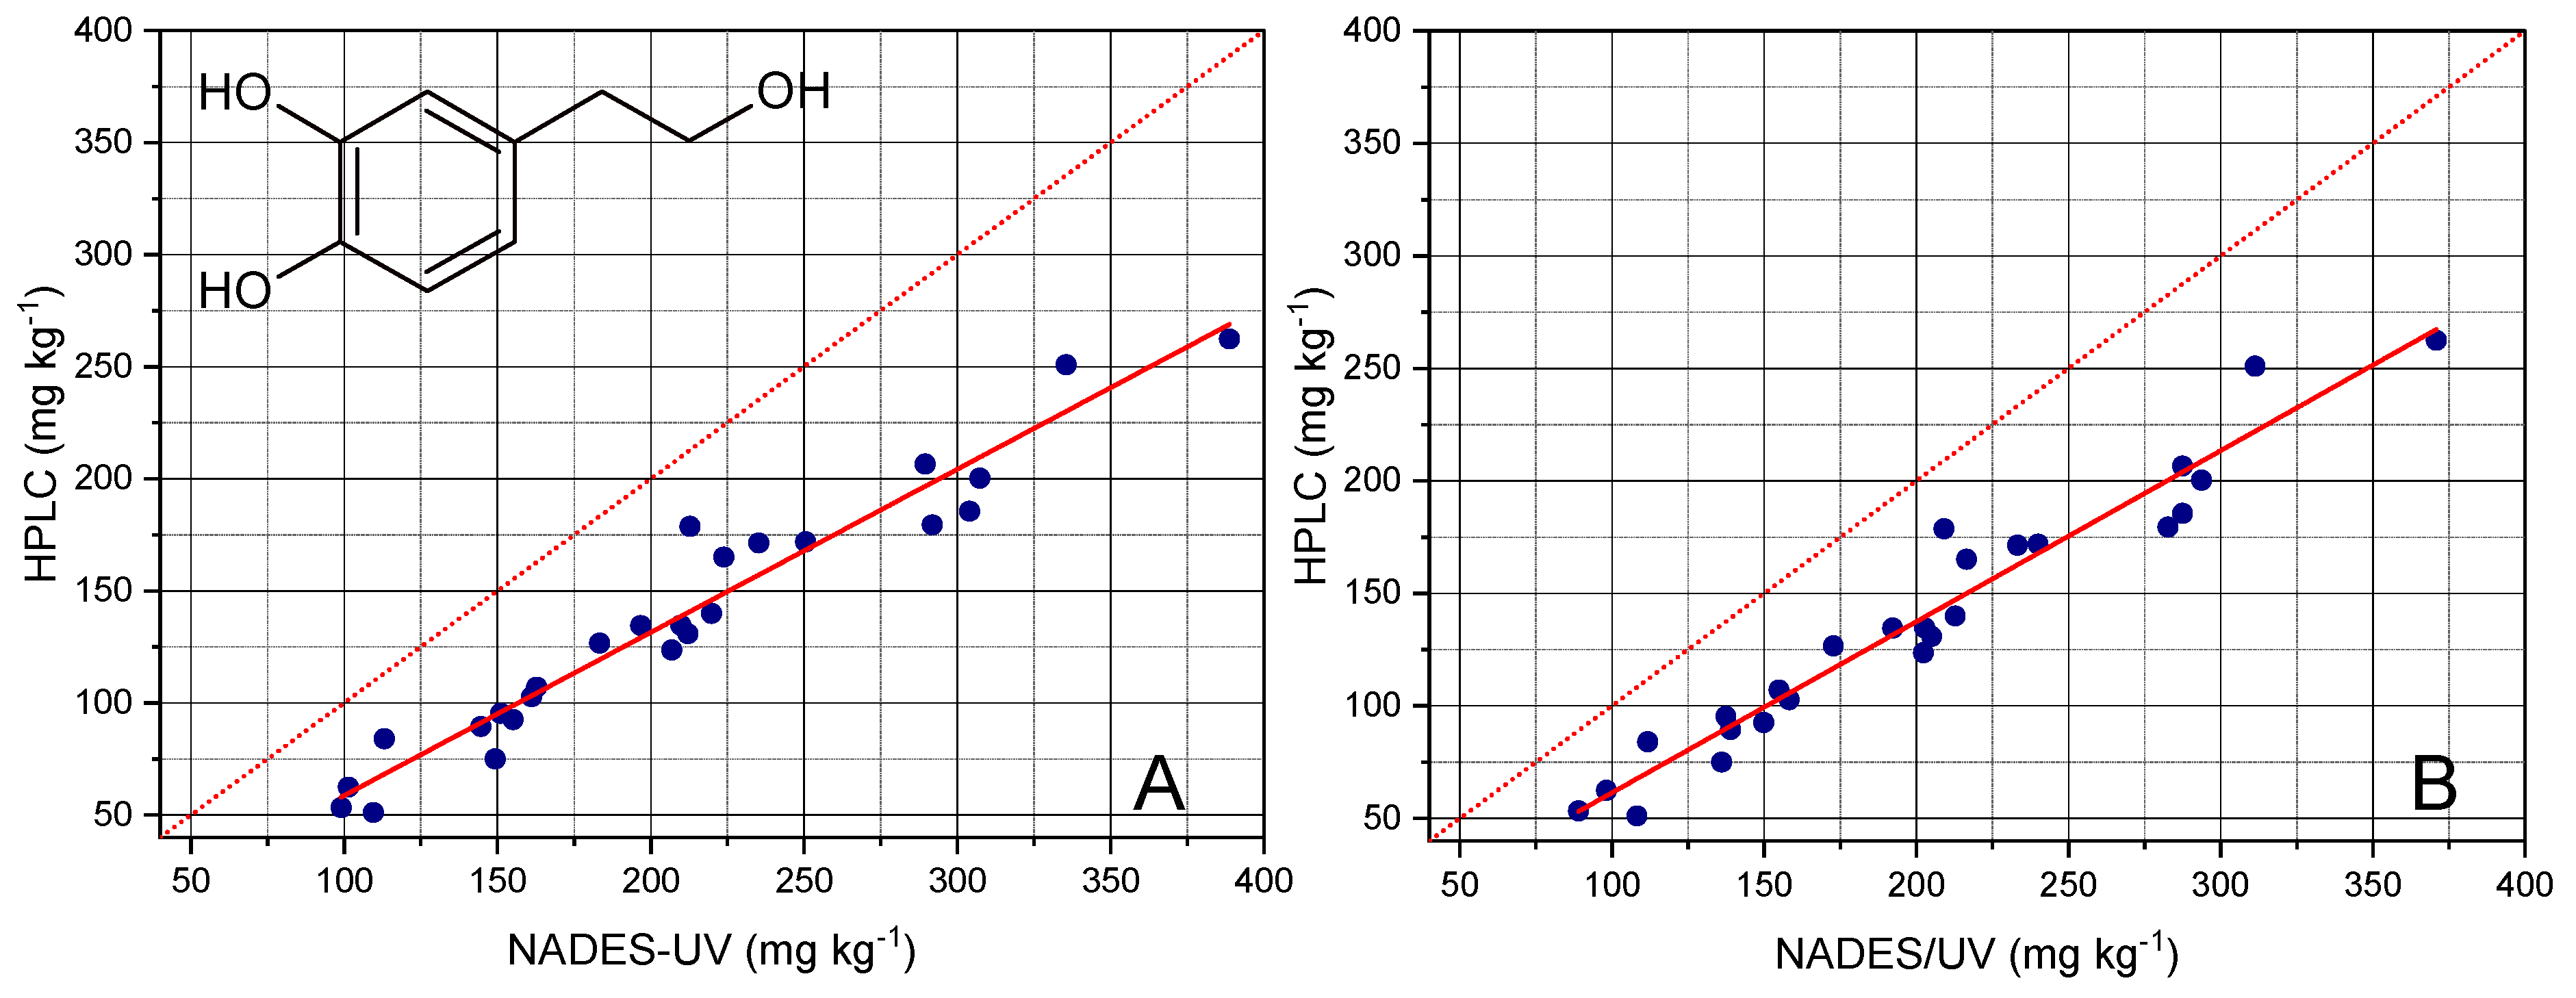
The quantitation of OHTyr provided the results reported in
Figure 6 and
Table 3. The analysis of regression showed the possibility of predicting the content of total OHTyr in EVOO with an accuracy corresponding to a
R2 value of 0.942, a RMSE of 14 mg kg
−1, and a RMSE% of 5.0%. It should be noted that the NADES-UV method provided an overestimation of total OHTyr, as showed by the slope value of about 0.73. However, the good fitting performance allowed satisfactorily correcting the obtained value and predicting the result of the HPLC analysis.
A possible explanation for such overestimation could be related to the matrix effects attributable to the phenolic pattern of EVOO; the NADES-UV method implies the direct analysis of the extract, without chromatographic separation. Therefore, a possible interference of Tyr, as well as possible differences in absorptivity of the esterified forms with respect to free forms could have occurred. This hypothesis seems to be confirmed by the fact that total Tyr was also correlated with the 299 nm wavelength (r = 0.95); this would indicate a contribution of Tyr to the absorbance at that wavelength.
Therefore, in order to reduce the total Tyr contribution, the values of the second derivative at 299 nm were corrected as follows, prior to applying the parameters of the calibration curve of OHTyr: A calibration curve for Tyr was built at 299 nm; then, the contents of Tyr determined using the calibration curve built at 290 nm were applied to calculate the corresponding value of the second derivative at 299 nm; the value calculated was then subtracted to the value measured; the difference was finally used to determine the content of OHTyr.
As shown in
Figure 6B, even if a slight decrease of the overestimation and a contemporary slight improvement of the fitting was obtained after correction, a not negligible overestimation of OHTyr was still observed, suggesting the hypothesis of a matrix effect as the basis of the overestimation of OHTyr.
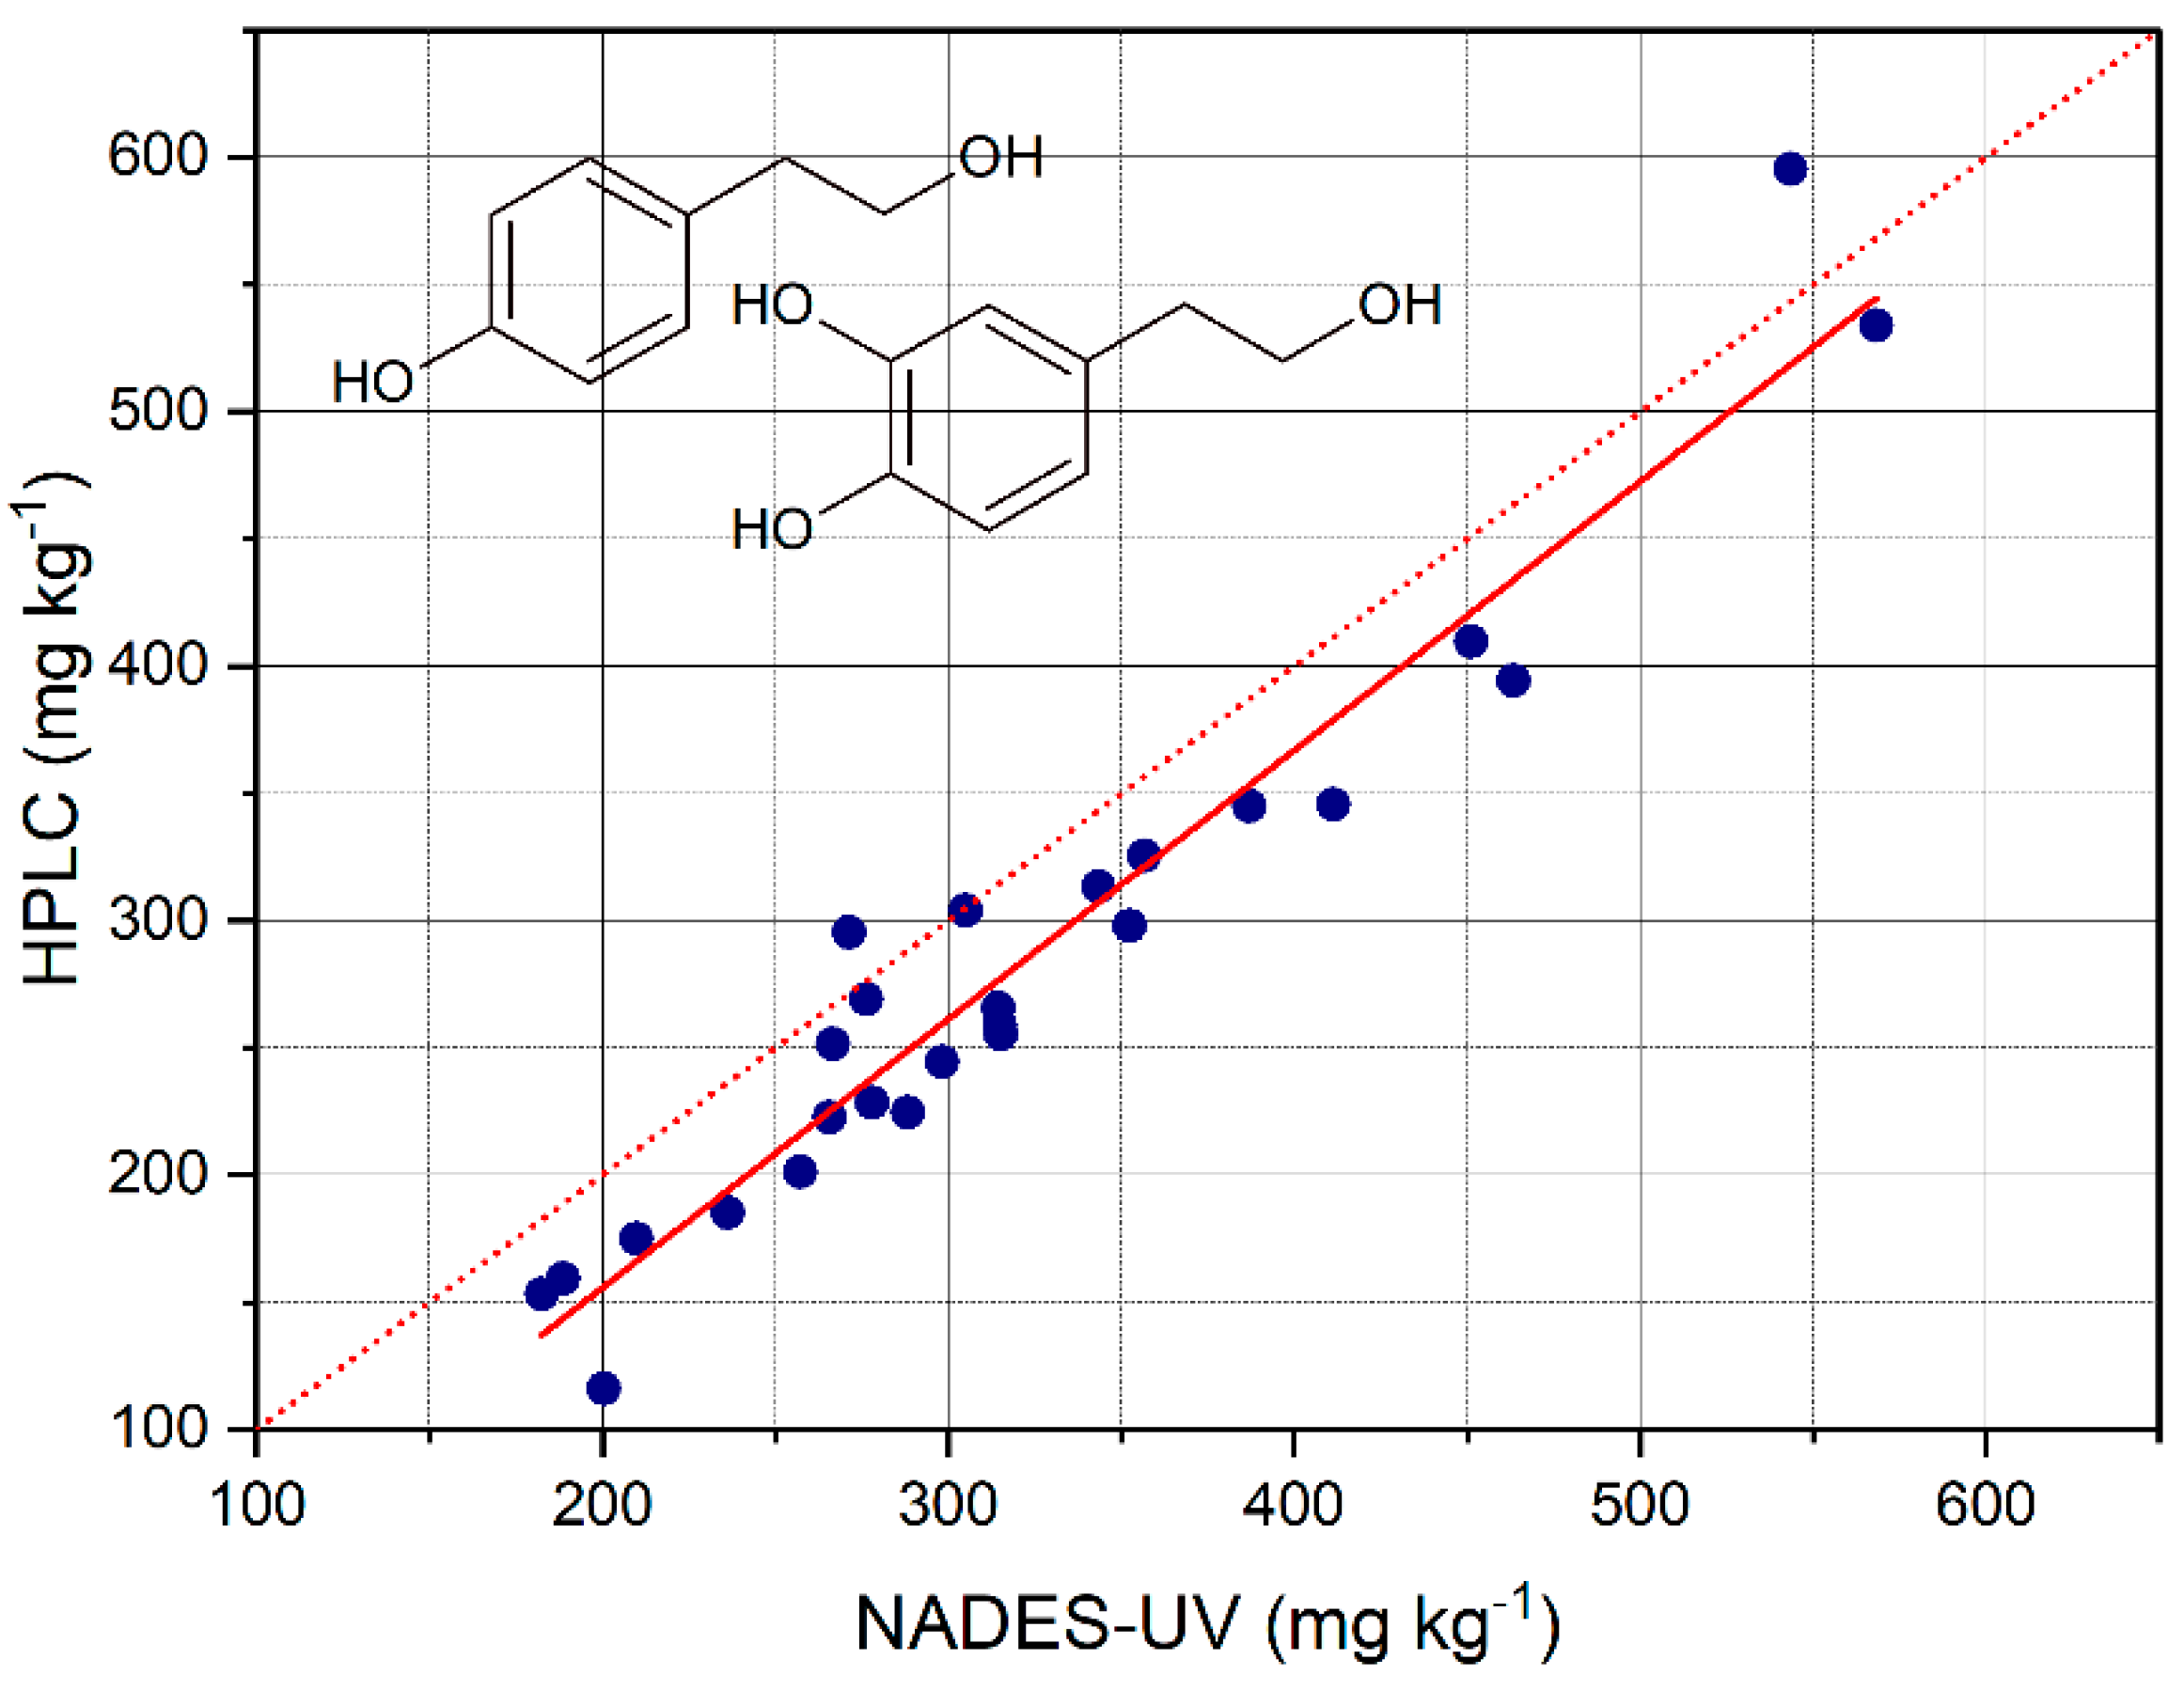
3.5. Sum of OHTyr and Tyr
An attempt to determine the sum of total OHTyr and Tyr was made by building a calibration curve with mixtures of OHTyr and Tyr. OHTyr and Tyr were solubilized in te NADES in different concentrations, with a total range of 8 to 70 mg L
−1. Analysis of correlation (data not shown) indicated 282 nm as the wavelength with the highest correlation with the content of total OHTyr + Tyr. This agrees with the results of the correlation analysis of the spectra of the NADES extracts with the contents of OHTyr and Tyr in EVOOs. The calibration curve built with the second derivative of the absorption at 282 nm as a function of total OHTyr + Tyr showed the parameters reported in
Table 4.
The total content of OHTyr + Tyr in the EVOO samples was measured based on the calibration curve and on the second derivative of the absorption at 282 of the NADES extracts. The values determined were plotted against the values obtained by HPLC after acid hydrolysis of the methanolic extracts, and a regression analysis was carried out. The results are reported in
Figure 7 and
Table 5. The contents of OHTyr + Tyr were, also in this case, overestimated with respect to the method by HPLC, with a mean residual of 37 mg L
−1. The mean recovery was 117 ± 15%. The R
2 value of the regression was 0.931, confirming a satisfactory predictive capacity of the NADES-UV method with respect to the method by HPLC. The overestimation was confirmed by the regression analysis with the significance of the intercept. On the other hand, the slope of the regression was very close to 1.
Therefore, the wavelength 282 nm resulted in a common wavelength of absorption of both OHTyr and Tyr, unlike 299 nm and 290 nm that were specific spectral features. The values of RMSE and RMSE% were 29.5 mg kg
−1 and 5.6%, respectively. Compared to the performance of SVM regression applied to the whole spectra of NADES extract to determine the sum of OHTyr and Tyr derivatives assessed by HPLC, as reported in our previous work [
10], the RMSE of prediction resulted lower (29.5 vs. 35.5 mg kg
−1), while it reached even higher levels when considering the single wavelength of 283 nm (58.7 mg kg
−1). As regards the R
2 value, it increased to 0.931 from the 0.84 and 0.64 of SVM and linear regression, respectively, of our previous work.
Table 6 reports the figures of merit of the method. The LOD and LOQ were respectively 3.9 and 11.8 mg kg
−1. As regards repeatability, the CV% of the method remained around or below 5%.
The proposed analytical approach can be considered as a screening method applicable to assess the levels of total OHTyr and Tyr, as determined by the emerging hydrolysis methods [
6]. Some key aspects could support their use as a tool with complementary functions to the more accurate and precise chromatographic methods:
Use of environment- and operator-friendly solvents;
Use of low-cost equipment;
Easy analytical procedure;
Short analysis time.
Due to these features, this analytical method could be applied to the field (e.g., oil mills, bottling plants, storage plants) and allow the monitoring of the levels of phenolic compounds related to the health claim. A continuous monitoring of this parameter and its trends during storage before bottling, as well as after bottling, could make operators aware of the evolving quality of individual EVOO batches, and therefore more confident in the use of the health claim on labels [
27,
28]. The appropriate adoption of the health claim on labels could also support focused communication and be considered for possible its effects on consumer perception and choices and the segment the trade category of EVOO, with eventual benefits for the EVOO value chain [
29,
30].
To the best of our knowledge, there are few alternative screening methods with the same aim. Reboredo-Rodríguez et al. [
11] previously showed that the traditional Folin–Ciocalteu assay provided, for a sample set of 12 EVOOs, results comparable to the amounts of total OHTyr and Tyr determined by acid hydrolysis and HPLC. Nevertheless, the performance of this approach, compared to the reference method, was lower (
r = 0.94). Moreover, the analytical reagents are not environment friendly.
Shabani et al. [
16] recently proposed the electrochemical detection of EVOO phenolic compounds extracted with the same NADES used in our previous work [
17]. The method proposed by the authors was easy and environment- and user-friendly, though the analytical target includes all the phenolic compounds contained in EVOO and not only those accounting for the health claim.
The method presented in this paper, could provide, therefore, a feasible opportunity for operators of the EVOO chain to access relevant chemical information. The NADES adopted, composed of lactic acid, glucose, and water, could pave the way for a new category of green analytical chemistry: food grade analytical chemistry. It is not simply a paradox: after sustainable reagents, can we move towards edible reagents?


 ,
, 

