
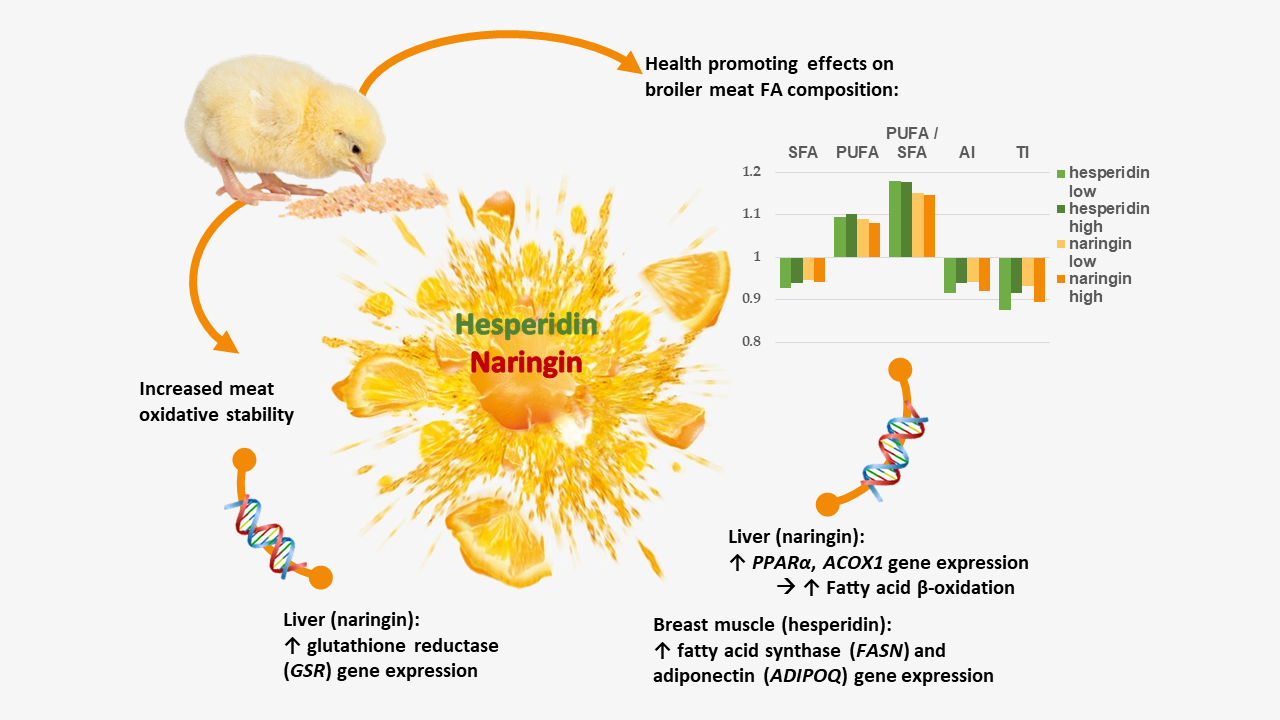
Hesperidin and Naringin Improve Broiler Meat Fatty Acid Profile and Modulate the Expression of Genes Involved in Fatty Acid β-oxidation and Antioxidant Defense in a Dose Dependent Manner

 , , ,
, , ,  , , , and
Abstract

1. Introduction
2. Materials and Methods
2.1. Animals and Experimental Design
2.2. Fatty Acid Profile Analysis
2.2.1. Lipid Extraction
2.2.2. Transesterification and Gas Chromatographic Analysis
2.3. RNA Extraction and cDNA Synthesis
2.4. Quantitative (q)PCR and PCR Arrays
2.5. Statistical Analysis
2.6. Ethics Statement
3. Results
3.1. Effects of Hesperidin, Naringin and Vitamin E on the Fatty Acid Profiles of Breast and Leg Muscle and Fat Pad
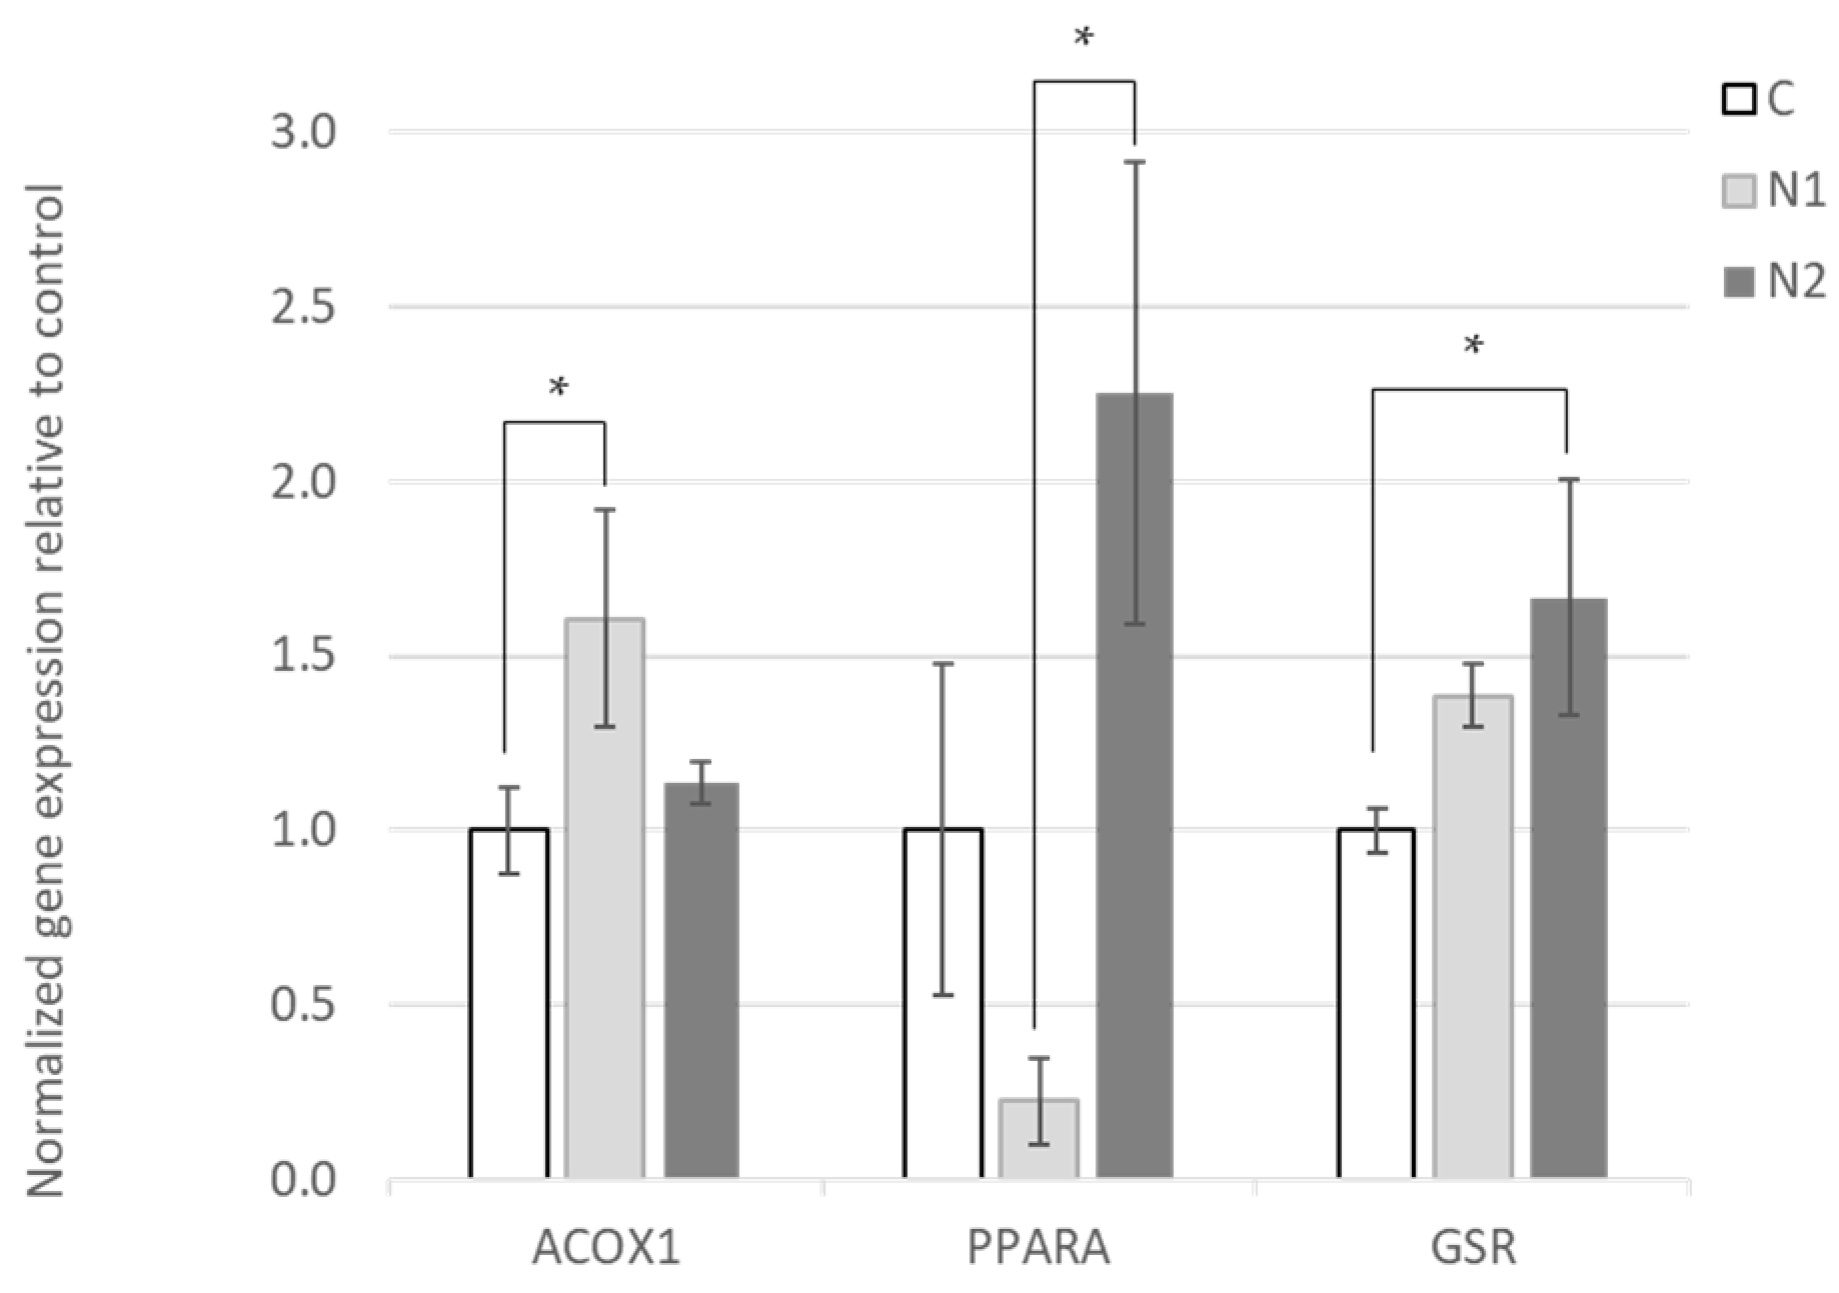
3.2. Effects of Hesperidin and Naringin on Gene Expression in the Liver
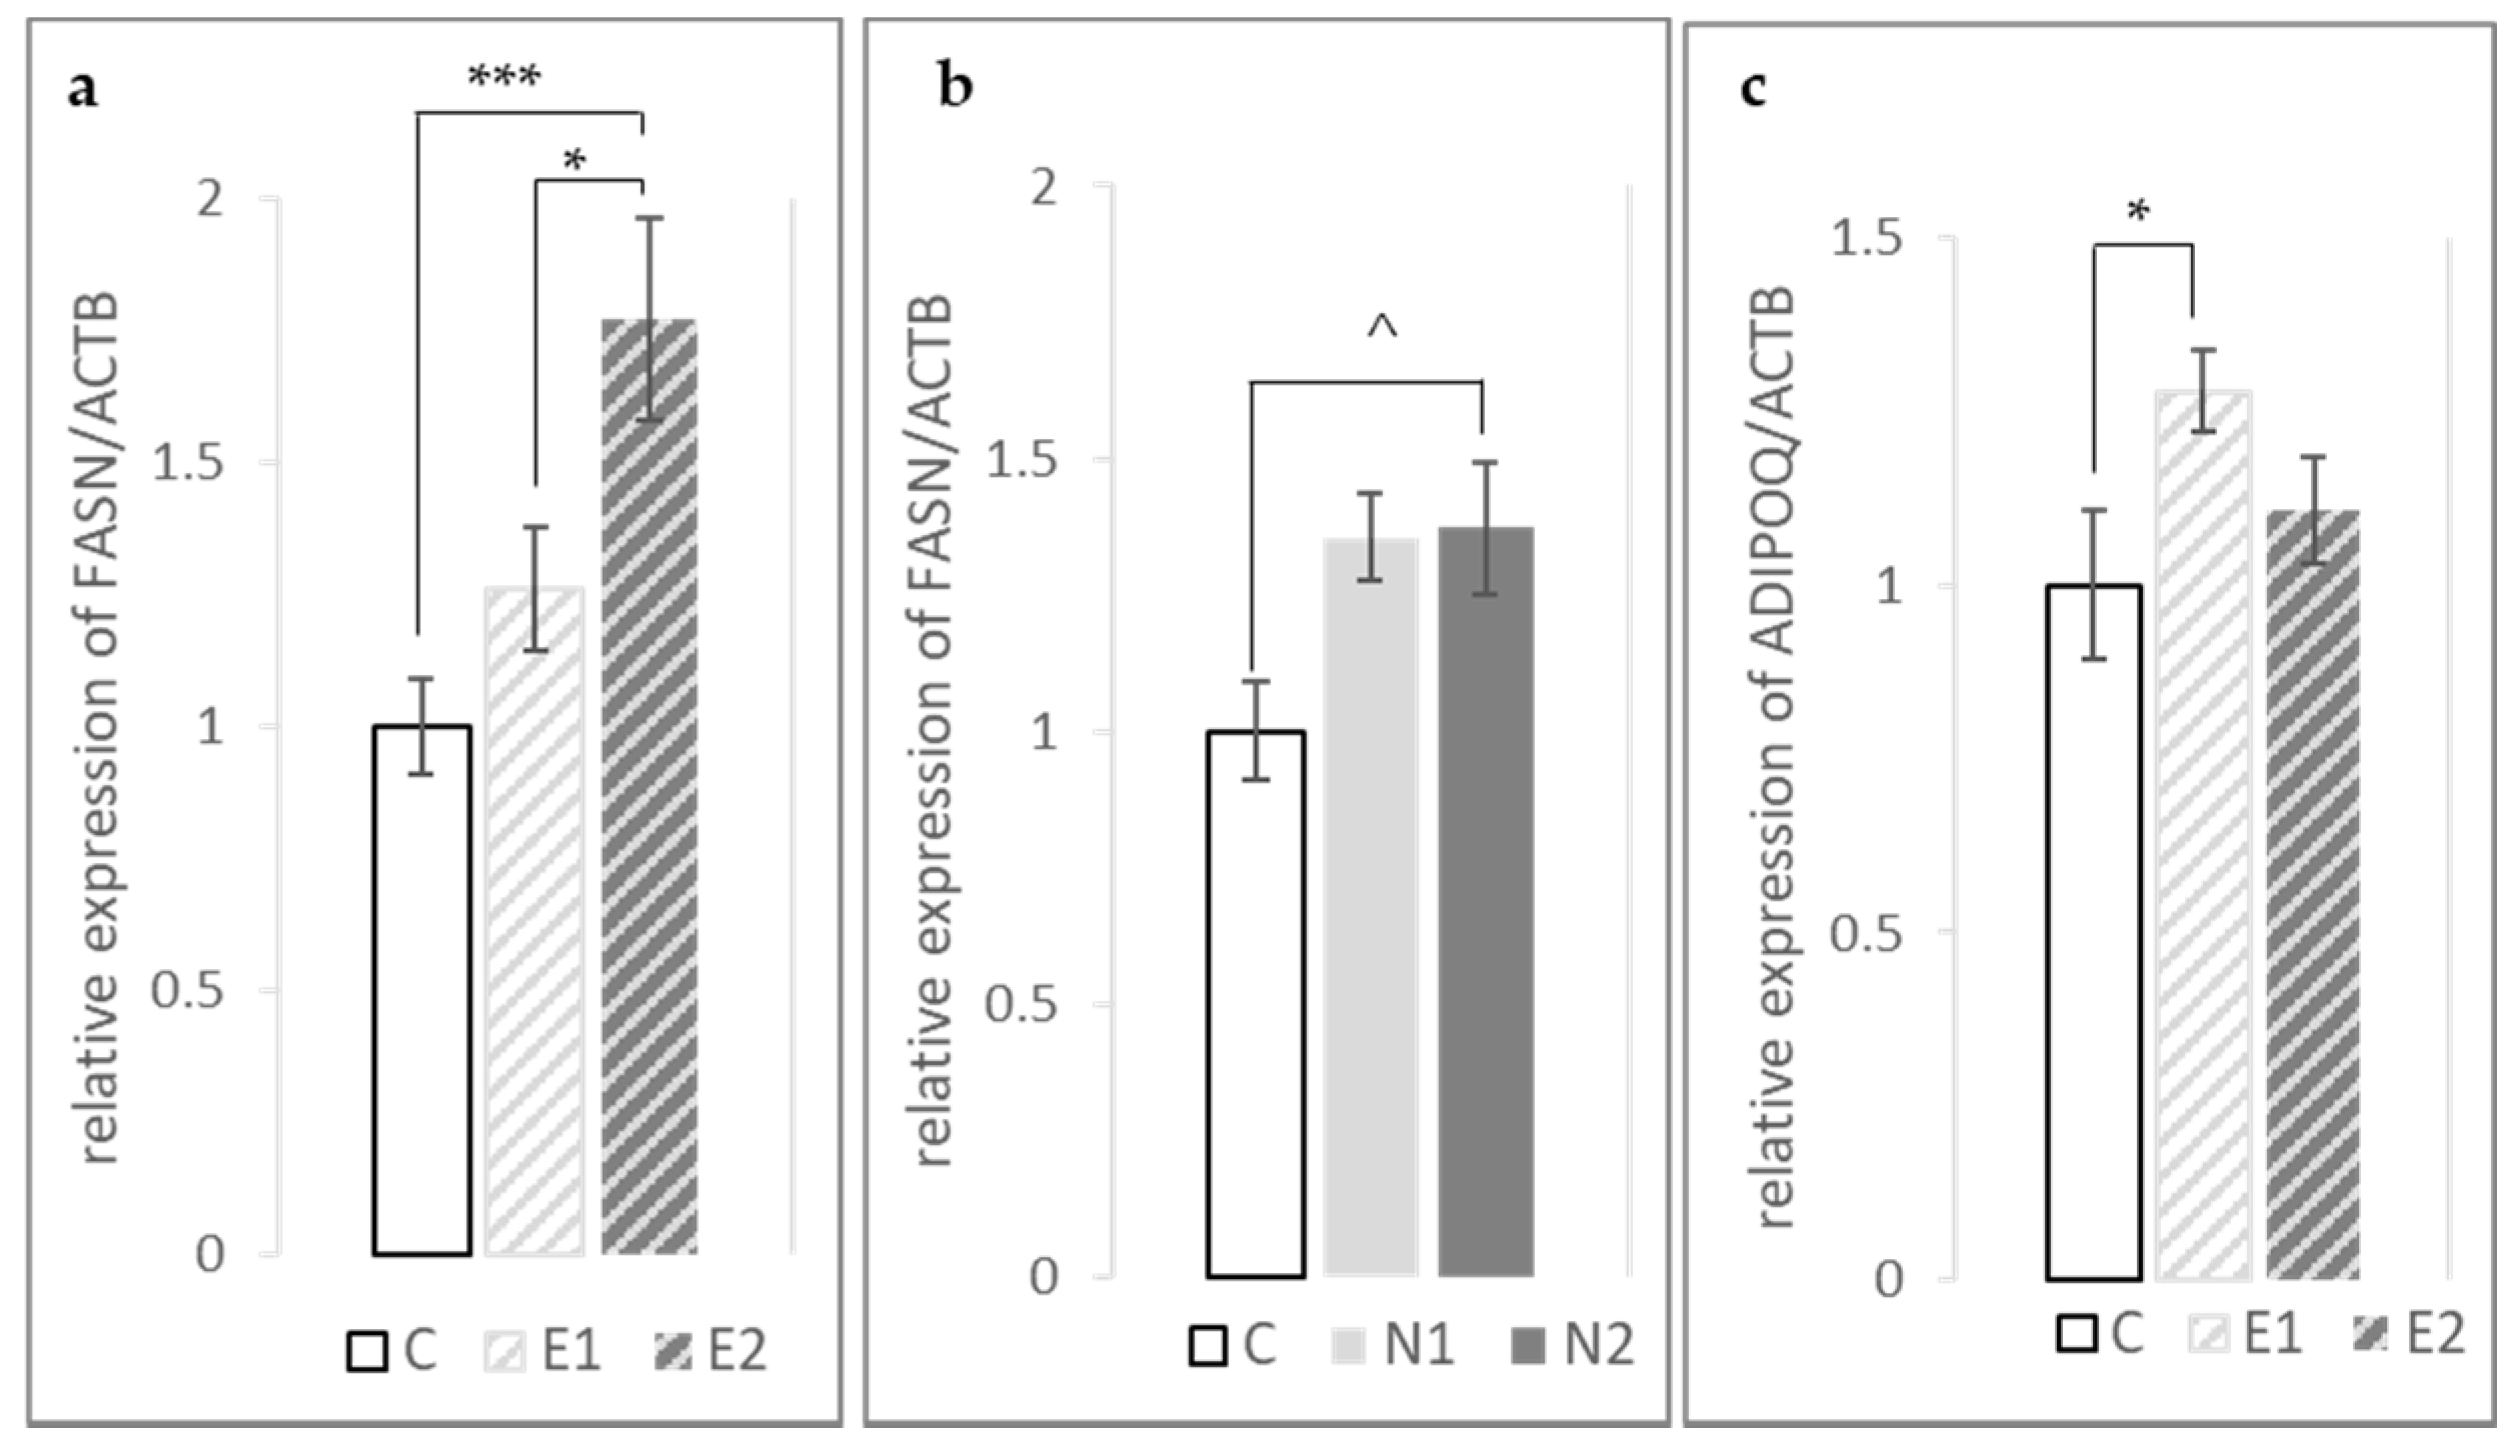
3.3. Expression of FASN, PPARγ and ADIPOQ Genes in the Fat Pad and Breast Muscle
4. Discussion
5. Conclusions
Supplementary Materials
Author Contributions
Funding
Institutional Review Board Statement
Acknowledgments
Conflicts of Interest
References
- Kamboh, A.A.; Leghari, R.A.; Khan, M.A.; Kaka, U.; Naseer, M.; Sazili, A.Q.; Malhi, K.K. Flavonoids supplementation-An ideal approach to improve quality of poultry products. World Poult. Sci. J. 2019, 75, 115–126. [Google Scholar] [CrossRef]
- Barreca, D.; Gattuso, G.; Bellocco, E.; Calderaro, A.; Trombetta, D.; Smeriglio, A.; Laganà, G.; Daglia, M.; Meneghini, S.; Nabavi, S.M. Flavanones: Citrus phytochemical with health-promoting properties. BioFactors 2017, 43, 495–506. [Google Scholar] [CrossRef]
- Kamboh, A.A.; Memon, A.M.; Mughal, M.J.; Memon, J.; Bakhetgul, M. Dietary effects of soy and citrus flavonoid on antioxidation and microbial quality of meat in broilers. J. Animal Physiol. Anim. Nutr. 2018, 102, 235–240. [Google Scholar] [CrossRef] [PubMed]
- Kamboh, A.A.; Zhu, W.Y. Effect of increasing levels of bioflavonoids in broiler feed on plasma anti-oxidative potential, lipid metabolites, and fatty acid composition of meat. Poult. Sci. 2013, 92, 454–461. [Google Scholar] [CrossRef] [PubMed]
- Iskender, H.; Yenice, G.; Dokumacioglu, E.; Kaynar, O.; Hayirli, A.; Kaya, A. Comparison of the effects of dietary supplementation of flavonoids on laying hen performance, egg quality and egg nutrient profile. Br. Poult. Sci. 2017, 58, 550–556. [Google Scholar] [CrossRef]
- Lien, T.F.; Yeh, H.S.; Su, W.T. Effect of adding extracted hesperetin, naringenin and pectin on egg cholesterol, serum traits and antioxidant activity in laying hens. Arch. Anim. Nutr. 2008, 62, 33–43. [Google Scholar] [CrossRef]
- Ting, S.; Yeh, H.S.; Lien, T.F. Effects of supplemental levels of hesperetin and naringenin on egg quality, serum traits and antioxidant activity of laying hens. Anim. Feed Sci. Technol. 2011, 163, 59–66. [Google Scholar] [CrossRef]
- Amiot, M.J.; Riva, C.; Vinet, A. Effects of dietary polyphenols on metabolic syndrome features in humans: A systematic review. Obes. Rev. 2016, 17, 573–586. [Google Scholar] [CrossRef]
- Fellenberg, M.A.; Speisky, H. Antioxidants: Their effects on broiler oxidative stress and its meat oxidative stability. World Poult. Sci. J. 2006, 62, 53–70. [Google Scholar] [CrossRef]
- Simitzis, P.E.; Symeon, G.K.; Charismiadou, M.A.; Ayoutanti, A.G.; Deligeorgis, S.G. The effects of dietary hesperidin supplementation on broiler performance and chicken meat characteristics. Can. J. Anim. Sci. 2011, 91, 275–282. [Google Scholar] [CrossRef]
- Goliomytis, M.; Kartsonas, N.; Charismiadou, M.A.; Symeon, G.K.; Simitzis, P.E.; Deligeorgis, S.G. The influence of naringin or hesperidin dietary supplementation on broiler meat quality and oxidative stability. PLoS ONE 2015, 10, e0141652. [Google Scholar] [CrossRef] [PubMed]
- Marzoni, M.; Chiarini, R.; Castillo, A.; Romboli, I.; De Marco, M.; Schiavone, A. Effects of dietary natural antioxidant supplementation on broiler chicken and Muscovy duck meat quality. Anim. Sci. Pap. Rep. 2014, 32, 359–368. [Google Scholar]
- Kamboh, A.A.; Zhu, W.Y. Individual and combined effects of genistein and hesperidin supplementation on meat quality in meat-type broiler chickens. J. Sci. Food Agric. 2013, 93, 3362–3367. [Google Scholar] [CrossRef]
- Hu, L.; Li, L.; Xu, D.; Xia, X.; Pi, R.; Wang, W.; Du, H.; Song, E.; Song, Y. Protective effects of neohesperidin dihydrochalcone against carbon tetrachloride-induced oxidative damage in vivo and in vitro. Chem. Biol. Interact. 2014, 213, 51–59. [Google Scholar] [CrossRef]
- Chen, X.J.; Wang, C.; Shu, K.G.; Lei, J.; Nie, H.; Zhang, Y.X.; Gong, Q. Effect of hesperidin pretreatment on the expression of apoptosis-related genes in the liver of mice with acetaminophen-induced acute liver injury. World Chin. J. Dig. 2013, 21, 1278–1285. [Google Scholar] [CrossRef]
- Chen, M.C.; Ye, Y.-Y.; Ji, G.; Liu, J.-W. Hesperidin upregulates heme oxygenase-1 to attenuate hydrogen peroxide-induced cell damage in hepatic L02 cells. J. Agric. Food Chem. 2010, 58, 3330–3335. [Google Scholar] [CrossRef] [PubMed]
- Jeon, S.M.; Bok, S.H.; Jang, M.K.; Lee, M.K.; Nam, K.T.; Park, Y.B.; Rhee, S.J.; Choi, M.S. Antioxidative activity of naringin and lovastatin in high cholesterol-fed rabbits. Life Sci. 2001, 69, 2855–2866. [Google Scholar] [CrossRef]
- Jeon, S.M.; Bok, S.H.; Jang, M.K.; Kim, Y.H.; Nam, K.T.; Jeong, T.S.; Park, Y.B.; Choi, M.S. Comparison of antioxidant effects of naringin and probucol in cholesterol-fed rabbits. Clin. Chim. Acta 2002, 317, 181–190. [Google Scholar] [CrossRef]
- Kapoor, R.; Kakkar, P. Naringenin accords hepatoprotection from streptozotocin induced diabetes in vivo by modulating mitochondrial dysfunction and apoptotic signaling cascade. Toxicol. Rep. 2014, 1, 569–581. [Google Scholar] [CrossRef]
- Kannappan, S.; Palanisamy, N.; Anuradha, C.V. Suppression of hepatic oxidative events and regulation of eNOS expression in the liver by naringenin in fructose-administered rats. Eur. J. Pharmacol. 2010, 645, 177–184. [Google Scholar] [CrossRef]
- Dhanya, R.; Jayamurthy, P. In vitro evaluation of antidiabetic potential of hesperidin and its aglycone hesperetin under oxidative stress in skeletal muscle cell line. Cell Biochem. Funct. 2020, 38, 419–427. [Google Scholar] [CrossRef]
- Rathee, P.; Chaudhary, H.; Rathee, S.; Rathee, D.; Kumar, V.; Kohli, K. Mechanism of action of flavonoids as anti-inflammatory agents: A review. Inflamm. Allergy Drug Targets 2009, 8, 229–235. [Google Scholar] [CrossRef]
- Kamboh, A.A.; Khan, M.A.; Kaka, U.; Awad, E.A.; Memon, A.M.; Saeed, M.; Korejo, N.A.; Bakhetgul, M.; Kumar, C. Effect of dietary supplementation of phytochemicals on immunity and haematology of growing broiler chickens. Ital. J. Anim. Sci. 2018, 1–6. [Google Scholar] [CrossRef]
- Kamboh, A.A.; Zhu, W.Y. Individual and combined effects of genistein and hesperidin on immunity and intestinal morphometry in lipopolysacharide-challenged broiler chickens. Poult. Sci. 2014, 93, 2175–2183. [Google Scholar] [CrossRef] [PubMed]
- Parhiz, H.; Roohbakhsh, A.; Soltani, F.; Rezaee, R.; Iranshahi, M. Antioxidant and anti-inflammatory properties of the citrus flavonoids hesperidin and hesperetin: An updated review of their molecular mechanisms and experimental models. Phytother. Res. 2015, 29, 323–331. [Google Scholar] [CrossRef]
- Alam, M.A.; Subhan, N.; Rahman, M.M.; Uddin, S.J.; Reza, H.M.; Sarker, S.D. Effect of citrus flavonoids, naringin and naringenin, on metabolic syndrome and their mechanisms of action. Adv. Nutr. 2014, 5, 404–417. [Google Scholar] [CrossRef] [PubMed]
- Mahmoud, A.M.; Hernández Bautista, R.J.; Sandhu, M.A.; Hussein, O.E. Beneficial effects of citrus flavonoids on cardiovascular and metabolic health. Oxidative Med. Cell. Longev. 2019, 2019. [Google Scholar] [CrossRef]
- Botsoglou, N.A.; Florou-Paneri, P.; Christaki, E.; Fletouris, D.J.; Spais, A.B. Effect of dietary oregano essential oil on performance of chickens and on iron-induced lipid oxidation of breast, thigh and abdominal fat tissues. Br. Poult. Sci. 2002, 43, 223–230. [Google Scholar] [CrossRef]
- Folch, J.; Lees, M.; Sloane Stanley, G.H. A simple method for the isolation and purification of total lipides from animal tissues. J. Biol. Chem. 1957, 226, 497–509. [Google Scholar] [CrossRef]
- Massouras, T.; Triantaphyllopoulos, K.A.; Theodossiou, I. Chemical composition, protein fraction and fatty acid profile of donkey milk during lactation. Int. Dairy J. 2017, 75, 83–90. [Google Scholar] [CrossRef]
- Ulbricht, T.L.V.; Southgate, D.A.T. Coronary heart disease: Seven dietary factors. Lancet 1991, 338, 985–992. [Google Scholar] [CrossRef]
- Vlaicu, P.A.; Untea, A.E.; Panaite, T.D.; Turcu, R.P. Effect of dietary orange and grapefruit peel on growth performance, health status, meat quality and intestinal microflora of broiler chickens. Ital. J. Anim. Sci. 2020, 19, 1394–1405. [Google Scholar] [CrossRef]
- Fouad, A.M.; El-Senousey, H.K. Nutritional Factors Affecting Abdominal Fat Deposition in Poultry: A Review. Asian Australas. J. Anim. Sci. 2014, 27, 1057–1068. [Google Scholar] [CrossRef] [PubMed]
- Nir, I.; Nitsan, Z.; Keren-Zvi, S. Chapter 15—Fat deposition in birds. In Leanness in Domestic Birds; Leclercq, B., Whitehead, C.C., Eds.; Butterworth-Heinemann: Oxford, UK, 1988; pp. 141–174. [Google Scholar]
- Mourão, J.L.; Pinheiro, V.M.; Prates, J.A.M.; Bessa, R.J.B.; Ferreira, L.M.A.; Fontes, C.M.G.A.; Ponte, P.I.P. Effect of dietary dehydrated pasture and citrus pulp on the performance and meat quality of broiler chickens. Poult. Sci. 2008, 87, 733–743. [Google Scholar] [CrossRef]
- Moussavi Javardi, M.S.; Madani, Z.; Movahedi, A.; Karandish, M.; Abbasi, B. The correlation between dietary fat quality indices and lipid profile with Atherogenic index of plasma in obese and non-obese volunteers: A cross-sectional descriptive-analytic case-control study. Lipids Health Dis. 2020, 19, 213. [Google Scholar] [CrossRef]
- Dobiášová, M.; Frohlich, J. The plasma parameter log (TG/HDL-C) as an atherogenic index: Correlation with lipoprotein particle size and esterification rate inapob-lipoprotein-depleted plasma (FERHDL). Clin. Biochem. 2001, 34, 583–588. [Google Scholar] [CrossRef]
- Zdanowska-Sąsiadek, Ż.; Michalczuk, M.; Poławska, E.; Damaziak, K.; Niemiec, J.; Radzik-Rant, A. Dietary vitamin E supplementation on cholesterol, vitamin E content, and fatty acid profile in chicken muscles. Can. J. Anim. Sci. 2016, 96, 114–120. [Google Scholar] [CrossRef]
- Rebolé, A.; Rodríguez, M.L.; Ortiz, L.T.; Alzueta, C.; Centeno, C.; Viveros, A.; Brenes, A.; Arija, I. Effect of dietary high-oleic acid sunflower seed, palm oil and vitamin E supplementation on broiler performance, fatty acid composition and oxidation susceptibility of meat. Br. Poult. Sci. 2006, 47, 581–591. [Google Scholar] [CrossRef] [PubMed]
- Nguyen, P.; Leray, V.; Diez, M.; Serisier, S.; Bloc’h, J.L.; Siliart, B.; Dumon, H. Liver lipid metabolism. J. Anim. Physiol. Anim. Nutr. 2008, 92, 272–283. [Google Scholar] [CrossRef]
- Liu, Y.; Zhou, J.; Musa, B.B.; Khawar, H.; Yang, X.; Cao, Y.; Yang, X. Developmental changes in hepatic lipid metabolism of chicks during the embryonic periods and the first week of posthatch. Poult. Sci. 2020, 99, 1655–1662. [Google Scholar] [CrossRef] [PubMed]
- Kersten, S. Integrated physiology and systems biology of PPARα. Mol. Metab. 2014, 3, 354–371. [Google Scholar] [CrossRef] [PubMed]
- Wang, M.; Xiao, F.L.; Mao, Y.J.; Ying, L.L.; Zhou, B.; Li, Y. Quercetin decreases the triglyceride content through the PPAR signalling pathway in primary hepatocytes of broiler chickens. Biotechnol. Biotechnol. Equip. 2019, 33, 1000–1010. [Google Scholar] [CrossRef]
- Pu, P.; Gao, D.M.; Mohamed, S.; Chen, J.; Zhang, J.; Zhou, X.Y.; Zhou, N.J.; Xie, J.; Jiang, H. Naringin ameliorates metabolic syndrome by activating AMP-activated protein kinase in mice fed a high-fat diet. Arch. Biochem. Biophys. 2012, 518, 61–70. [Google Scholar] [CrossRef] [PubMed]
- Ke, J.Y.; Kliewer, K.L.; Hamad, E.M.; Cole, R.M.; Powell, K.A.; Andridge, R.R.; Straka, S.R.; Yee, L.D.; Belury, M.A. The flavonoid, naringenin, decreases adipose tissue mass and attenuates ovariectomy-associated metabolic disturbances in mice. Nutr. Metab. 2015, 12. [Google Scholar] [CrossRef]
- Zar Kalai, F.; Han, J.; Ksouri, R.; El Omri, A.; Abdelly, C.; Isoda, H. Antiobesity effects of an edible halophyte Nitraria retusa Forssk in 3T3-L1 preadipocyte differentiation and in C57B6J/L mice fed a high fat diet-induced obesity. Evid. Based Complementary Altern. Med. 2013, 2013. [Google Scholar] [CrossRef]
- Huong, D.T.T.; Takahashi, Y.; Ide, T. Activity and mRNA levels of enzymes involved in hepatic fatty acid oxidation in mice fed citrus flavonoids. Nutrition 2006, 22, 546–552. [Google Scholar] [CrossRef]
- Cho, K.W.; Kim, Y.O.; Andrade, J.E.; Burgess, J.R.; Kim, Y.C. Dietary naringenin increases hepatic peroxisome proliferators-activated receptor α protein expression and decreases plasma triglyceride and adiposity in rats. Eur. J. Nutr. 2011, 50, 81–88. [Google Scholar] [CrossRef]
- Goldwasser, J.; Cohen, P.Y.; Yang, E.; Balaguer, P.; Yarmush, M.L.; Nahmias, Y. Transcriptional regulation of human and rat hepatic lipid metabolism by the grapefruit flavonoid naringenin: Role of PPARα, PPARγ and LXRα. PLoS ONE 2010, 5, e12399. [Google Scholar] [CrossRef]
- Ohara, T.; Muroyama, K.; Yamamoto, Y.; Murosaki, S. A combination of glucosyl hesperidin and caffeine exhibits an anti-obesity effect by inhibition of hepatic lipogenesis in mice. Phytother. Res. 2015, 29, 310–316. [Google Scholar] [CrossRef] [PubMed]
- Lu, Y.; Xi, W.; Ding, X.; Fan, S.; Zhang, Y.; Jiang, D.; Li, Y.; Huang, C.; Zhou, Z. Citrange fruit extracts alleviate obesity-associated metabolic disorder in high-fat diet-induced obese C57BL/6 mouse. Int. J. Mol. Sci. 2013, 14, 23736–23750. [Google Scholar] [CrossRef]
- Mitsuzumi, H.; Yasuda, A.; Arai, N.; Sadakiyo, T.; Kubota, M. Glucosyl hesperidin lowers serum triglyceride level in the rats fed a high-fat diet through the reduction of hepatic triglyceride and cholesteryl ester. Jpn. Pharmacol. Ther. 2011, 39, 727–740. [Google Scholar]
- Saleh, A.A.; Eid, Y.Z.; Ebeid, T.A.; Ohtsuka, A.; Hioki, K.; Yamamoto, M.; Hayashi, K. The modification of the muscle fatty acid profile by dietary supplementation with Aspergillus awamori in broiler chickens. Br. J. Nutr. 2012, 108, 1596–1602. [Google Scholar] [CrossRef]
- Semenkovich, C.F.; Coleman, T.; Fiedorek Jr, F.T. Human fatty acid synthase mRNA: Tissue distribution, genetic mapping, and kinetics of decay after glucose deprivation. J. Lipid Res. 1995, 36, 1507–1521. [Google Scholar] [CrossRef]
- Fhu, C.W.; Ali, A. Fatty Acid Synthase: An Emerging Target in Cancer. Molecules 2020, 25, 3935. [Google Scholar] [CrossRef] [PubMed]
- Martinez-Huenchullan, S.F.; Tam, C.S.; Ban, L.A.; Ehrenfeld-Slater, P.; McLennan, S.V.; Twigg, S.M. Skeletal muscle adiponectin induction in obesity and exercise. Metab. Clin. Exp. 2020, 102. [Google Scholar] [CrossRef] [PubMed]
- Ali, A.M.; Gabbar, M.A.; Abdel-Twab, S.M.; Fahmy, E.M.; Ebaid, H.; Alhazza, I.M.; Ahmed, O.M. Antidiabetic Potency, Antioxidant Effects, and Mode of Actions of Citrus reticulata Fruit Peel Hydroethanolic Extract, Hesperidin, and Quercetin in Nicotinamide/Streptozotocin-Induced Wistar Diabetic Rats. Oxidative Med. Cell. Longev. 2020, 2020. [Google Scholar] [CrossRef]
- Haidari, F.; Heybar, H.; Jalali, M.T.; Ahmadi Engali, K.; Helli, B.; Shirbeigi, E. Hesperidin Supplementation Modulates Inflammatory Responses Following Myocardial Infarction. J. Am. Coll. Nutr. 2015, 34, 205–211. [Google Scholar] [CrossRef] [PubMed]
- Liu, L.; Shan, S.; Zhang, K.; Ning, Z.Q.; Lu, X.P.; Cheng, Y.Y. Naringenin and Hesperetin, Two Flavonoids Derived from Citrus aurantium Up-regulate Transcription of Adiponectin. Phytother. Res. 2008, 22, 1400–1403. [Google Scholar] [CrossRef]
- Zoidis, E.; Seremelis, I.; Kontopoulos, N.; Danezis, G.P. Selenium-dependent antioxidant enzymes: Actions and properties of selenoproteins. Antioxidants 2018, 7, 66. [Google Scholar] [CrossRef] [PubMed]
- Forman, H.J.; Davies, K.J.A.; Ursini, F. How do nutritional antioxidants really work: Nucleophilic tone and para-hormesis versus free radical scavenging in vivo. Free Radic. Biol. Med. 2014, 66, 24–35. [Google Scholar] [CrossRef]
- Poljsak, B.; Šuput, D.; Milisav, I. Achieving the balance between ROS and antioxidants: When to use the synthetic antioxidants. Oxidative Med. Cell. Longev. 2013. [Google Scholar] [CrossRef]
- Kurutas, E.B. The importance of antioxidants which play the role in cellular response against oxidative/nitrosative stress: Current state. Nutr. J. 2016, 15. [Google Scholar] [CrossRef]
- Nielsen, J.H.; Sørensen, B.; Skibsted, L.H.; Bertelsen, G. Oxidation in pre-cooked minced pork as influenced by chill storage of raw muscle. Meat Sci. 1997, 46, 191–197. [Google Scholar] [CrossRef]
- Mercier, Y.; Gatellier, P.; Renerre, M. Lipid and protein oxidation in vitro, and antioxidant potential in meat from Charolais cows finished on pasture or mixed diet. Meat Sci. 2004, 66, 467–473. [Google Scholar] [CrossRef]
- Rowe, L.J.; Maddock, K.R.; Lonergan, S.M.; Huff-Lonergan, E. Influence of early postmortem protein oxidation on beef quality. J. Anim. Sci. 2004, 82, 785–793. [Google Scholar] [CrossRef] [PubMed]
- Guo, S.; Ma, J.; Xing, Y.; Xu, Y.; Jin, X.; Yan, S.; Shi, B. Artemisia annua L. aqueous extract as an alternative to antibiotics improving growth performance and antioxidant function in broilers. Ital. J. Anim. Sci. 2020, 19, 399–409. [Google Scholar] [CrossRef]
- Liu, S.M.; Eady, S.J. Glutathione: Its implications for animal health, meat quality, and health benefits of consumers. Australian J. Agric. Res. 2005, 56, 775–780. [Google Scholar] [CrossRef]
- Kapoor, R.; Rizvi, F.; Kakkar, P. Naringenin prevents high glucose-induced mitochondria-mediated apoptosis involving AIF, Endo-G and caspases. Apoptosis 2013, 18, 9–27. [Google Scholar] [CrossRef] [PubMed]


| Gene/Assay Symbol | Gene/Assay Description | Unigene | GeneBank | Gene Function |
|---|---|---|---|---|
| CAT | Catalase | Gga.1183 | NM_001031215 | Antioxidant |
| DIO1 | Deiodinase, Iodothyronine deiodinase Type I | Gga.553 | NM_001097614 | |
| DIO2 | Deiodinase, Iodothyronine deiodinase Type II | Gga.51485 | NM_204114 | |
| GPX1 | Glutathione peroxidase 1 | Gga.1465 | NM_001277853 | |
| GPX4 | Glutathione peroxidase 4 | Gga.107 | XM_003642871 | |
| GSR | Glutathione Reductase | Gga.34900 | XM_001235016 | |
| SOD1 | CuZn Superoxide Dismutase | Gga.3346 | NM_205064 | |
| SOD2 | Mn Superoxide Dismutase | Gga.937 | NM_204211 | |
| SOD3 | extracellular Cu-Zn-Superoxide Dismutase | Gga.1128 | XM_420760 | |
| TXNRD1 | Thioredoxin reductase Type I | Gga.4380 | NM_001030762 | |
| TXNRD2 | Thioredoxin reductase Type II | Gga.29425 | NM_001122691 | |
| BCL2 | B-cell CLL/lymphoma 2 | Gga.42172 | NM_205339 | Apoptosis |
| CASP3 | Caspase 3, apoptosis-related cysteine peptidase | Gga.4346 | NM_204725 | |
| CASP8 | Caspase 8, apoptosis-related cysteine peptidase | Gga.2451 | NM_204592 | |
| CASP9 | Caspase 9, apoptosis-related cysteine peptidase | Gga.4116 | XM_424580 | |
| TMBIM1 | Transmembrane BAX inhibitor motif containing 1 | Gga.7211 | XM_422067 | |
| ACOX1 | Acyl-CoA oxidase 1, palmitoyl | Gga.39153 | NM_001006205 | Fatty Acid Metabolism |
| CPT1A | Carnitine palmitoyltransferase 1A (liver) | Gga.9299 | NM_001012898 | |
| FASN | Fatty acid synthase | Gga.8951 | NM_205155 | |
| PPARA | Peroxisome proliferator-activated receptor alpha | Gga.4006 | NM_001001464 | |
| PPARG | Peroxisome proliferator-activated receptor gamma | Gga.3858 | NM_001001460 | |
| PPARGC1A | Peroxisome proliferator-activated receptor gamma, coactivator 1 alpha | Gga.22894 | NM_001006457 | |
| SCD | Stearoyl-CoA desaturase | Gga.17055 | NM_204890 | |
| SREBF1 | Sterol regulatory element binding transcription factor 1 | Gga.51495 | NM_204126 | |
| LDLR | Low density lipoprotein receptor | Gga.8517 | NM_204452 | Lipid metabolism |
| LPL | Lipoprotein lipase | Gga.1152 | NM_205282 | |
| ACACA | acetyl-CoA carboxylase alpha | Gga.1480 | NM_205505 | Metabolism |
| GCK | Similar to glucokinase | Gga.48051 | XM_004949993 | |
| IL10 | Interleukin 10 | Gga.46641 | NM_001004414 | pro-inflammatory |
| IL1B | Interleukin 1, beta | Gga.19 | NM_204524 | |
| IL2 | Interleukin 2 | Gga.4946 | NM_204153 | |
| IL6 | Interleukin 6 (interferon, beta 2) | Gga.2769 | NM_204628 | |
| LITAF | lipopolysaccharide-induced tumor necrosis factor-alpha factor homolog | Gga.3383 | NM_204267 | |
| NOS2 | Inducible Nitric Oxide synthase | Gga.3327 | NM_204961 | |
| PTGS2 | Prostaglandin-endoperoxide synthase 2 | Gga.4401 | NM_001167718 | |
| SMAD3 | SMAD family member 3 | Gga.28197 | NM_204475 | |
| ACTB | Actin, beta | Gga.43416 | NM_205518 | Housekeeping |
| H6PD | Hexose-6-phosphate dehydrogenase | Gga.50291 | XM_425746 | |
| HMBS | Hydroxymethylbilane synthase | Gga.8480 | XM_417846 | |
| RPL4 | Ribosomal protein L4 | Gga.4523 | NM_001007479 | |
| UBC | Ubiquitin C | Gga.39142 | XM_001234599 | |
| GGDC | genomic DNA contamination negative control | |||
| RTC | reverse transcription positive control | |||
| PPC | PCR-positive control |
| Treatment | p-Value | p-Linear | ||||||||
|---|---|---|---|---|---|---|---|---|---|---|
| % Intramuscular Fat | C | E1 | E2 | N1 | N2 | VE | SEM | C-E1-E2 | C-N1-N2 | |
| Breast | 1.52 | 1.38 | 1.68 | 1.15 | 1.42 | 1.17 | 0.15 | NS | NS | NS |
| Thigh | 5.24 | 5.22 | 4.85 | 4.55 | 5.12 | 5.24 | 0.34 | NS | NS | NS |
| Tissue: Breast | Treatment (LSM) | p-Linear | ||||||||
|---|---|---|---|---|---|---|---|---|---|---|
| Parameter | C | E1 | E2 | N1 | N2 | VE | SEM | p-Value | C-E1-E2 | C-N1-N2 |
| FA (% of Total) | ||||||||||
| C6:0 | 0.018 | 0.006 C | 0.014 | 0.007 | 0.011 | 0.012 | 0.0027 | * | NS | NS |
| C10:0 | 0.016 | 0.017 | 0.018 | 0.012 | 0.011 | 0.017 | 0.0032 | NS | NS | NS |
| C12:0 | 0.018 | 0.015 | 0.021 | 0.014 | 0.017 | 0.020 | 0.0030 | NS | NS | NS |
| C14:0 | 0.45 | 0.44 | 0.44 | 0.42 | 0.43 | 0.42 | 0.01 | NS | NS | NS |
| C14:1 | 0.071 | 0.072 | 0.064 | 0.061 | 0.070 | 0.060 | 0.0044 | NS | NS | NS |
| C15:0 | 0.080 | 0.076 | 0.082 | 0.082 | 0.080 | 0.079 | 0.0028 | NS | NS | NS |
| C16:0 | 25.60 | 24.33 C | 24.74 | 24.81 | 24.29 C | 24.24 C | 0.28 | ** | * | ** |
| C16:1 | 3.22 | 3.29 | 3.01 | 2.91 | 3.05 | 2.93 | 0.16 | NS | NS | NS |
| C17:0 | 0.112 | 0.102 | 0.113 | 0.114 | 0.110 | 0.114 | 0.005 | NS | NS | NS |
| C17:1 | 0.071 | 0.070 | 0.070 | 0.068 | 0.069 | 0.065 | 0.004 | NS | NS | NS |
| C18:0 | 8.14 | 6.98 C,VE | 6.88 C,VE | 7.14 C,VE | 7.48 | 7.87 | 0.17 | **** | **** | * |
| C18:1 | 33.68 | 33.45 | 33.12 | 33.28 | 33.53 | 33.88 | 0.36 | NS | NS | NS |
| C18:2n-6 | 22.89 | 25.06 C | 25.69 C,VE | 25.39 C,VE | 24.65 C | 23.66 | 0.38 | **** | **** | ** |
| C18:3n-3 | 1.71 | 1.81 VE | 1.79 | 1.74 | 1.76 | 1.65 | 0.04 | * | 0.1 | NS |
| C20:3n-6 | 0.435 | 0.352 | 0.417 | 0.437 | 0.410 | 0.395 | 0.038 | NS | NS | NS |
| C20:4n-6 | 0.202 | 0.230 | 0.203 | 0.215 | 0.193 | 0.193 | 0.009 | * | NS | NS |
| C20:5n-3 | 2.03 | 2.15 VE | 2.17 VE | 2.17 VE | 2.53 | 3.08 C | 0.20 | ** | NS | 0.07 |
| C22:5n-3 | 0.028 | 0.251 C,VE | 0.022 | 0.006 | 0.003 | 0.054 | 0.019 | **** | NS | * |
| C22:6 n-3 | 1.29 | 1.42 | 1.17 | 1.15 | 1.32 | 1.32 | 0.10 | NS | NS | NS |
| SFA | 34.42 | 31.95 C | 32.29 C | 32.59 C | 32.42 C | 32.76 C | 0.34 | **** | *** | ** |
| MUFA | 37.04 | 36.88 | 36.26 | 36.32 | 36.72 | 36.94 | 0.45 | NS | NS | NS |
| PUFA | 28.57 | 31.26 C | 31.46 C | 31.11 C | 30.87 C | 30.35 | 0.48 | *** | *** | ** |
| PUFA/SFA | 0.831 | 0.980 C | 0.977 C | 0.956 C | 0.953 C | 0.927 C | 0.021 | **** | **** | ** |
| n-6 | 23.09 | 25.29 C | 25.89 C,VE | 25.61 C,VE | 24.84 C | 23.85 | 0.37 | **** | **** | ** |
| n-3 | 5.05 | 5.62 | 5.15 VE | 5.06 VE | 5.62 | 6.10 C | 0.21 | ** | NS | NS |
| n-6/n-3 | 4.62 | 4.54 | 5.10 VE | 5.14 VE | 4.44 | 3.98 | 0.18 | **** | NS | NS |
| AI | 0.418 | 0.383 C | 0.392 | 0.393 C | 0.385 C | 0.386 C | 0.006 | ** | ** | ** |
| TI | 0.753 | 0.660 C | 0.689 C | 0.701 | 0.674 C | 0.667 C | 0.015 | *** | ** | ** |
| Tissue: Thigh | Treatment | p-Linear | ||||||||
|---|---|---|---|---|---|---|---|---|---|---|
| Parameter | C | E1 | E2 | N1 | N2 | VE | SEM | p-Value | C-E1-E2 | C-N1-N2 |
| FA (% of Total) | ||||||||||
| C6:0 | 0.004 | 0.010 C | 0.005 | 0.004 | 0.007 | 0.006 | 0.001 | * | NS | NS |
| C10:0 | 0.008 | 0.008 | 0.007 | 0.008 | 0.008 | 0.007 | 0.001 | NS | NS | NS |
| C12:0 | 0.022 | 0.022 | 0.021 | 0.022 | 0.022 | 0.020 | 0.001 | NS | NS | NS |
| C14:0 | 0.468 | 0.481 | 0.467 | 0.466 | 0.486 VE | 0.442 | 0.010 | * | NS | NS |
| C14:1 | 0.088 | 0.091 | 0.080 | 0.079 | 0.091 | 0.077 | 0.005 | NS | NS | NS |
| C15:0 | 0.075 | 0.079 | 0.080 | 0.082 | 0.080 | 0.078 | 0.003 | NS | NS | NS |
| C16:0 | 23.97 | 23.94 | 24.24 | 24.06 | 23.89 | 23.27 | 0.28 | NS | NS | NS |
| C16:1 | 4.250 | 4.403 | 3.943 | 3.956 | 4.509 | 3.956 | 0.198 | NS | NS | NS |
| C17:0 | 0.080 | 0.083 | 0.090 | 0.089 | 0.083 | 0.087 | 0.006 | NS | NS | NS |
| C17:1 | 0.107 | 0.106 | 0.102 | 0.110 | 0.112 | 0.106 | 0.005 | NS | NS | NS |
| C18:0 | 5.438 | 5.413 | 5.599 | 5.038 | 5.324 | 5.649 | 0.225 | NS | NS | NS |
| C18:1 | 35.89 | 36.14 | 35.46 | 35.15 | 35.91 | 37.34 | 0.54 | ^ | NS | NS |
| C18:2n-6 | 25.34 | 25.41 | 25.77 | 26.85 | 25.64 | 25.16 | 0.54 | NS | NS | NS |
| C18:3n-3 | 2.094 | 2.083 | 2.135 | 2.151 | 2.118 | 2.064 | 0.035 | NS | NS | NS |
| C20:3n-6 | 0.139 | 0.148 | 0.159 | 0.163 | 0.155 | 0.143 | 0.010 | NS | NS | NS |
| C20:4n-6 | 0.228 | 0.225 | 0.222 | 0.224 | 0.225 | 0.221 | 0.008 | NS | NS | NS |
| C20:5n-3 | 0.963 | 0.956 | 1.057 | 1.146 | 1.007 | 1.046 | 0.081 | NS | NS | NS |
| C22:5n-3 | 0.046 | 0.057 | 0.046 | 0.004 | 0.009 | 0.020 | 0.010 | ** | NS | ** |
| C22:6n-3 | 0.821 | 0.374 C | 0.567 C,VE | 0.403 C | 0.331 C | 0.315 C | 0.041 | **** | ** | **** |
| SFA | 30.06 | 30.03 | 30.51 | 29.76 | 29.89 | 29.55 | 0.32 | NS | NS | NS |
| MUFA | 40.33 | 40.74 | 39.59 | 39.29 | 40.62 | 41.48 | 0.63 | NS | NS | NS |
| PUFA | 29.63 | 29.25 | 29.96 | 30.94 | 29.48 | 28.97 | 0.64 | NS | NS | NS |
| PUFA/SFA | 0.988 | 0.975 | 0.984 | 1.040 | 0.988 | 0.983 | 0.027 | NS | NS | NS |
| n-6 | 25.56 | 25.63 | 25.99 | 27.07 | 25.86 | 25.38 | 0.54 | NS | NS | NS |
| n-3 | 3.923 | 3.470 | 3.805 | 3.704 | 3.464 | 3.446 | 0.118 | * | NS | ^ |
| n-6/n-3 | 6.578 | 7.412 C | 6.859 | 7.329 C | 7.500 C | 7.400 C | 0.156 | *** | NS | ** |
| AI | 0.370 | 0.370 | 0.376 | 0.370 | 0.369 | 0.356 | 0.006 | NS | NS | NS |
| TI | 0.667 | 0.683 | 0.684 | 0.666 | 0.679 | 0.670 | 0.012 | NS | NS | NS |
| Tissue: Fat Pad | Treatment (LSM) | p-Value | p-Linear | |||||||
|---|---|---|---|---|---|---|---|---|---|---|
| Parameter | C | E1 | E2 | N1 | N2 | VE | SEM | Treatment | C-E1-E2 | C-N1-N2 |
| FA (% of Total) | ||||||||||
| C10:0 | 0.006 | 0.008 | 0.007 | 0.008 | 0.008 | 0.008 | 0.001 | NS | NS | NS |
| C12:0 | 0.021 | 0.023 | 0.022 | 0.027 | 0.022 | 0.021 | 0.002 | NS | NS | NS |
| C14:0 | 0.471 | 0.481 | 0.475 | 0.488 | 0.479 | 0.447 | 0.016 | NS | NS | NS |
| C14:1 | 0.096 | 0.096 | 0.087 | 0.082 | 0.096 | 0.082 | 0.007 | NS | NS | NS |
| C15:0 | 0.076 | 0.074 | 0.074 | 0.073 | 0.065 | 0.071 | 0.005 | NS | NS | NS |
| C16:0 | 24.16 | 23.22 | 23.03 | 22.94 | 23.15 | 23.41 | 0.35 | NS | ^ | ^ |
| C16:1 | 4.756 | 4.548 | 4.109 | 4.406 | 4.536 | 4.083 | 0.269 | NS | NS | NS |
| C17:0 | 0.069 | 0.072 | 0.079 | 0.074 | 0.071 | 0.075 | 0.007 | NS | NS | NS |
| C17:1 | 0.108 | 0.115 | 0.108 | 0.109 | 0.119 | 0.122 | 0.006 | NS | NS | NS |
| C18:0 | 4.348 | 4.406 | 4.500 | 4.492 | 4.290 | 4.213 | 0.269 | NS | NS | NS |
| C18:1 | 38.88 | 37.16 C | 37.57 C | 37.56 C | 37.81 | 36.90 C | 0.31 | *** | * | ^ |
| C18:2n-6 | 23.73 | 25.64 C | 26.06 C | 26.17 C | 25.93 C | 26.94 C | 0.42 | **** | ** | ** |
| C18:3n-3 | 2.164 | 2.227 | 2.518 C | 2.307 | 2.306 | 2.323 | 0.062 | ** | *** | * |
| C20:3n-6 | 0.078 | 0.104 | 0.190 | 0.086 | 0.112 | 0.097 | 0.029 | NS | ** | NS |
| C20:4n-6 | 0.230 | 0.467 C,VE | 0.284 | 0.236 | 0.213 | 0.242 | 0.046 | ** | NS | NS |
| C20:5n-3 | 0.299 | 0.615 | 0.323 | 0.498 | 0.278 | 0.447 | 0.107 | NS | NS | NS |
| C22:5n-3 | 0.235 | 0.242 | 0.332 | 0.224 | 0.283 | 0.262 | 0.046 | NS | ^ | NS |
| C22:6n-3 | 0.279 | 0.480 | 0.262 | 0.238 | 0.220 | 0.247 | 0.079 | NS | NS | NS |
| SFA | 29.15 | 28.29 | 28.19 | 28.10 | 28.09 | 28.24 | 0.38 | NS | NS | ^ |
| MUFA | 43.84 | 41.92 C | 41.87 C | 42.15 | 42.56 | 41.19 C | 0.46 | ** | ** | NS |
| PUFA | 27.01 | 29.77 C | 29.97 C | 29.76 C | 29.34 C | 30.56 C | 0.46 | **** | *** | ** |
| PUFA/SFA | 0.931 | 1.055 C | 1.065 C | 1.061 C | 1.048 C | 1.084 C | 0.025 | ** | ** | ** |
| n-6 | 23.97 | 26.10 C | 26.34 C | 26.40 C | 26.14 C | 27.18 C | 0.43 | **** | ** | ** |
| n-3 | 2.978 | 3.564 | 3.434 | 3.267 | 3.088 | 3.279 | 0.164 | NS | ^ | NS |
| n-6/n-3 | 8.245 | 7.718 | 7.731 | 8.136 | 8.586 | 8.399 | 0.382 | NS | NS | NS |
| AI | 0.368 | 0.351 | 0.347 | 0.347 | 0.349 | 0.352 | 0.007 | NS | ^ | ^ |
| TI | 0.676 | 0.629 | 0.630 | 0.632 | 0.640 | 0.637 | 0.014 | NS | * | NS |
| Treatment Mean ± SEM | p-Value | p-Linear | |||||||||
|---|---|---|---|---|---|---|---|---|---|---|---|
| C | E1 | E2 | N1 | N2 | VE | E | N | VE | C-E1-E2 | C-N1-N2 | |
| Breast muscle | |||||||||||
| ADIPOQ | 1 ± 0.11 | 1.28 ± 0.06 | 1.11 ± 0.08 | 1.13 ± 0.08 | 0.87 ± 0.04 | 1.00 ± 0.09 | * | ^ | NS | NS | NS |
| FASN | 1 ± 0.09 | 1.26 ± 0.12 | 1.77 ± 0.19 | 1.36 ± 0.08 | 1.37 ± 0.12 | 1.09 ± 0.07 | *** | ^ | NS | **** | ** |
| PPARγ | 1 ± 0.12 | 0.98 ± 0.09 | 1.09 ± 0.17 | 1.05 ± 0.07 | 0.93 ± 0.07 | 0.92 ± 0.09 | NS | NS | NS | NS | NS |
| Fat pad | |||||||||||
| ADIPOQ | 1 ± 0.08 | 0.96 ± 0.25 | 1.46 ± 0.29 | 1.11 ± 0.32 | 1.06 ± 0.3 | 1.09 ± 0.18 | NS | NS | NS | NS | NS |
| FASN | 1 ± 0.06 | 1.82 ± 0.56 | 1.15 ± 0.19 | 1.29 ± 0.27 | 1.09 ± 0.22 | 1.33 ± 0.18 | ^ | NS | NS | NS | NS |
| PPARγ | 1 ± 0.17 | 1.27 ± 0.47 | 1.33 ± 0.17 | 0.8 ± 0.22 | 0.74 ± 0.17 | 1.01 ± 0.28 | NS | NS | NS | NS | NS |
Publisher’s Note: MDPI stays neutral with regard to jurisdictional claims in published maps and institutional affiliations. |
© 2021 by the authors. Licensee MDPI, Basel, Switzerland. This article is an open access article distributed under the terms and conditions of the Creative Commons Attribution (CC BY) license (https://creativecommons.org/licenses/by/4.0/).
Share and Cite
Hager-Theodorides, A.L.; Massouras, T.; Simitzis, P.E.; Moschou, K.; Zoidis, E.; Sfakianaki, E.; Politi, K.; Charismiadou, M.; Goliomytis, M.; Deligeorgis, S. Hesperidin and Naringin Improve Broiler Meat Fatty Acid Profile and Modulate the Expression of Genes Involved in Fatty Acid β-oxidation and Antioxidant Defense in a Dose Dependent Manner. Foods 2021, 10, 739. https://doi.org/10.3390/foods10040739
Hager-Theodorides AL, Massouras T, Simitzis PE, Moschou K, Zoidis E, Sfakianaki E, Politi K, Charismiadou M, Goliomytis M, Deligeorgis S. Hesperidin and Naringin Improve Broiler Meat Fatty Acid Profile and Modulate the Expression of Genes Involved in Fatty Acid β-oxidation and Antioxidant Defense in a Dose Dependent Manner. Foods. 2021; 10(4):739. https://doi.org/10.3390/foods10040739
Chicago/Turabian StyleHager-Theodorides, Ariadne L., Theofilos Massouras, Panagiotis E. Simitzis, Katerina Moschou, Evangelos Zoidis, Eleni Sfakianaki, Katerina Politi, Maria Charismiadou, Michael Goliomytis, and Stelios Deligeorgis. 2021. "Hesperidin and Naringin Improve Broiler Meat Fatty Acid Profile and Modulate the Expression of Genes Involved in Fatty Acid β-oxidation and Antioxidant Defense in a Dose Dependent Manner" Foods 10, no. 4: 739. https://doi.org/10.3390/foods10040739
APA StyleHager-Theodorides, A. L., Massouras, T., Simitzis, P. E., Moschou, K., Zoidis, E., Sfakianaki, E., Politi, K., Charismiadou, M., Goliomytis, M., & Deligeorgis, S. (2021). Hesperidin and Naringin Improve Broiler Meat Fatty Acid Profile and Modulate the Expression of Genes Involved in Fatty Acid β-oxidation and Antioxidant Defense in a Dose Dependent Manner. Foods, 10(4), 739. https://doi.org/10.3390/foods10040739