1. Introduction
Potatoes, as one of the most important agricultural products in the world, play an important role in providing food. Since potato is nutrient-rich, it can be easily attacked by pests and diseases [
1]. Potatoes are susceptible to various diseases, some of which are widespread, and others have a limited diffusion and are local. The origins of these infectious diseases include bacteria, fungi, viruses, mycoplasmas, viroids, and nematodes [
2,
3]. Another group called physiological, non-infectious, diseases include complications due to adverse weather conditions, nutrient deficiencies, or other non-living factors [
4,
5]. The applications of common methods for diagnosing some of these internal diseases is destructive, difficult, or even impossible, because the diseases do not have any visible symptoms. Early detection of defects and diseases, in order to separate the products before storage leads to the prevention of disease transmission and increased marketability [
6].
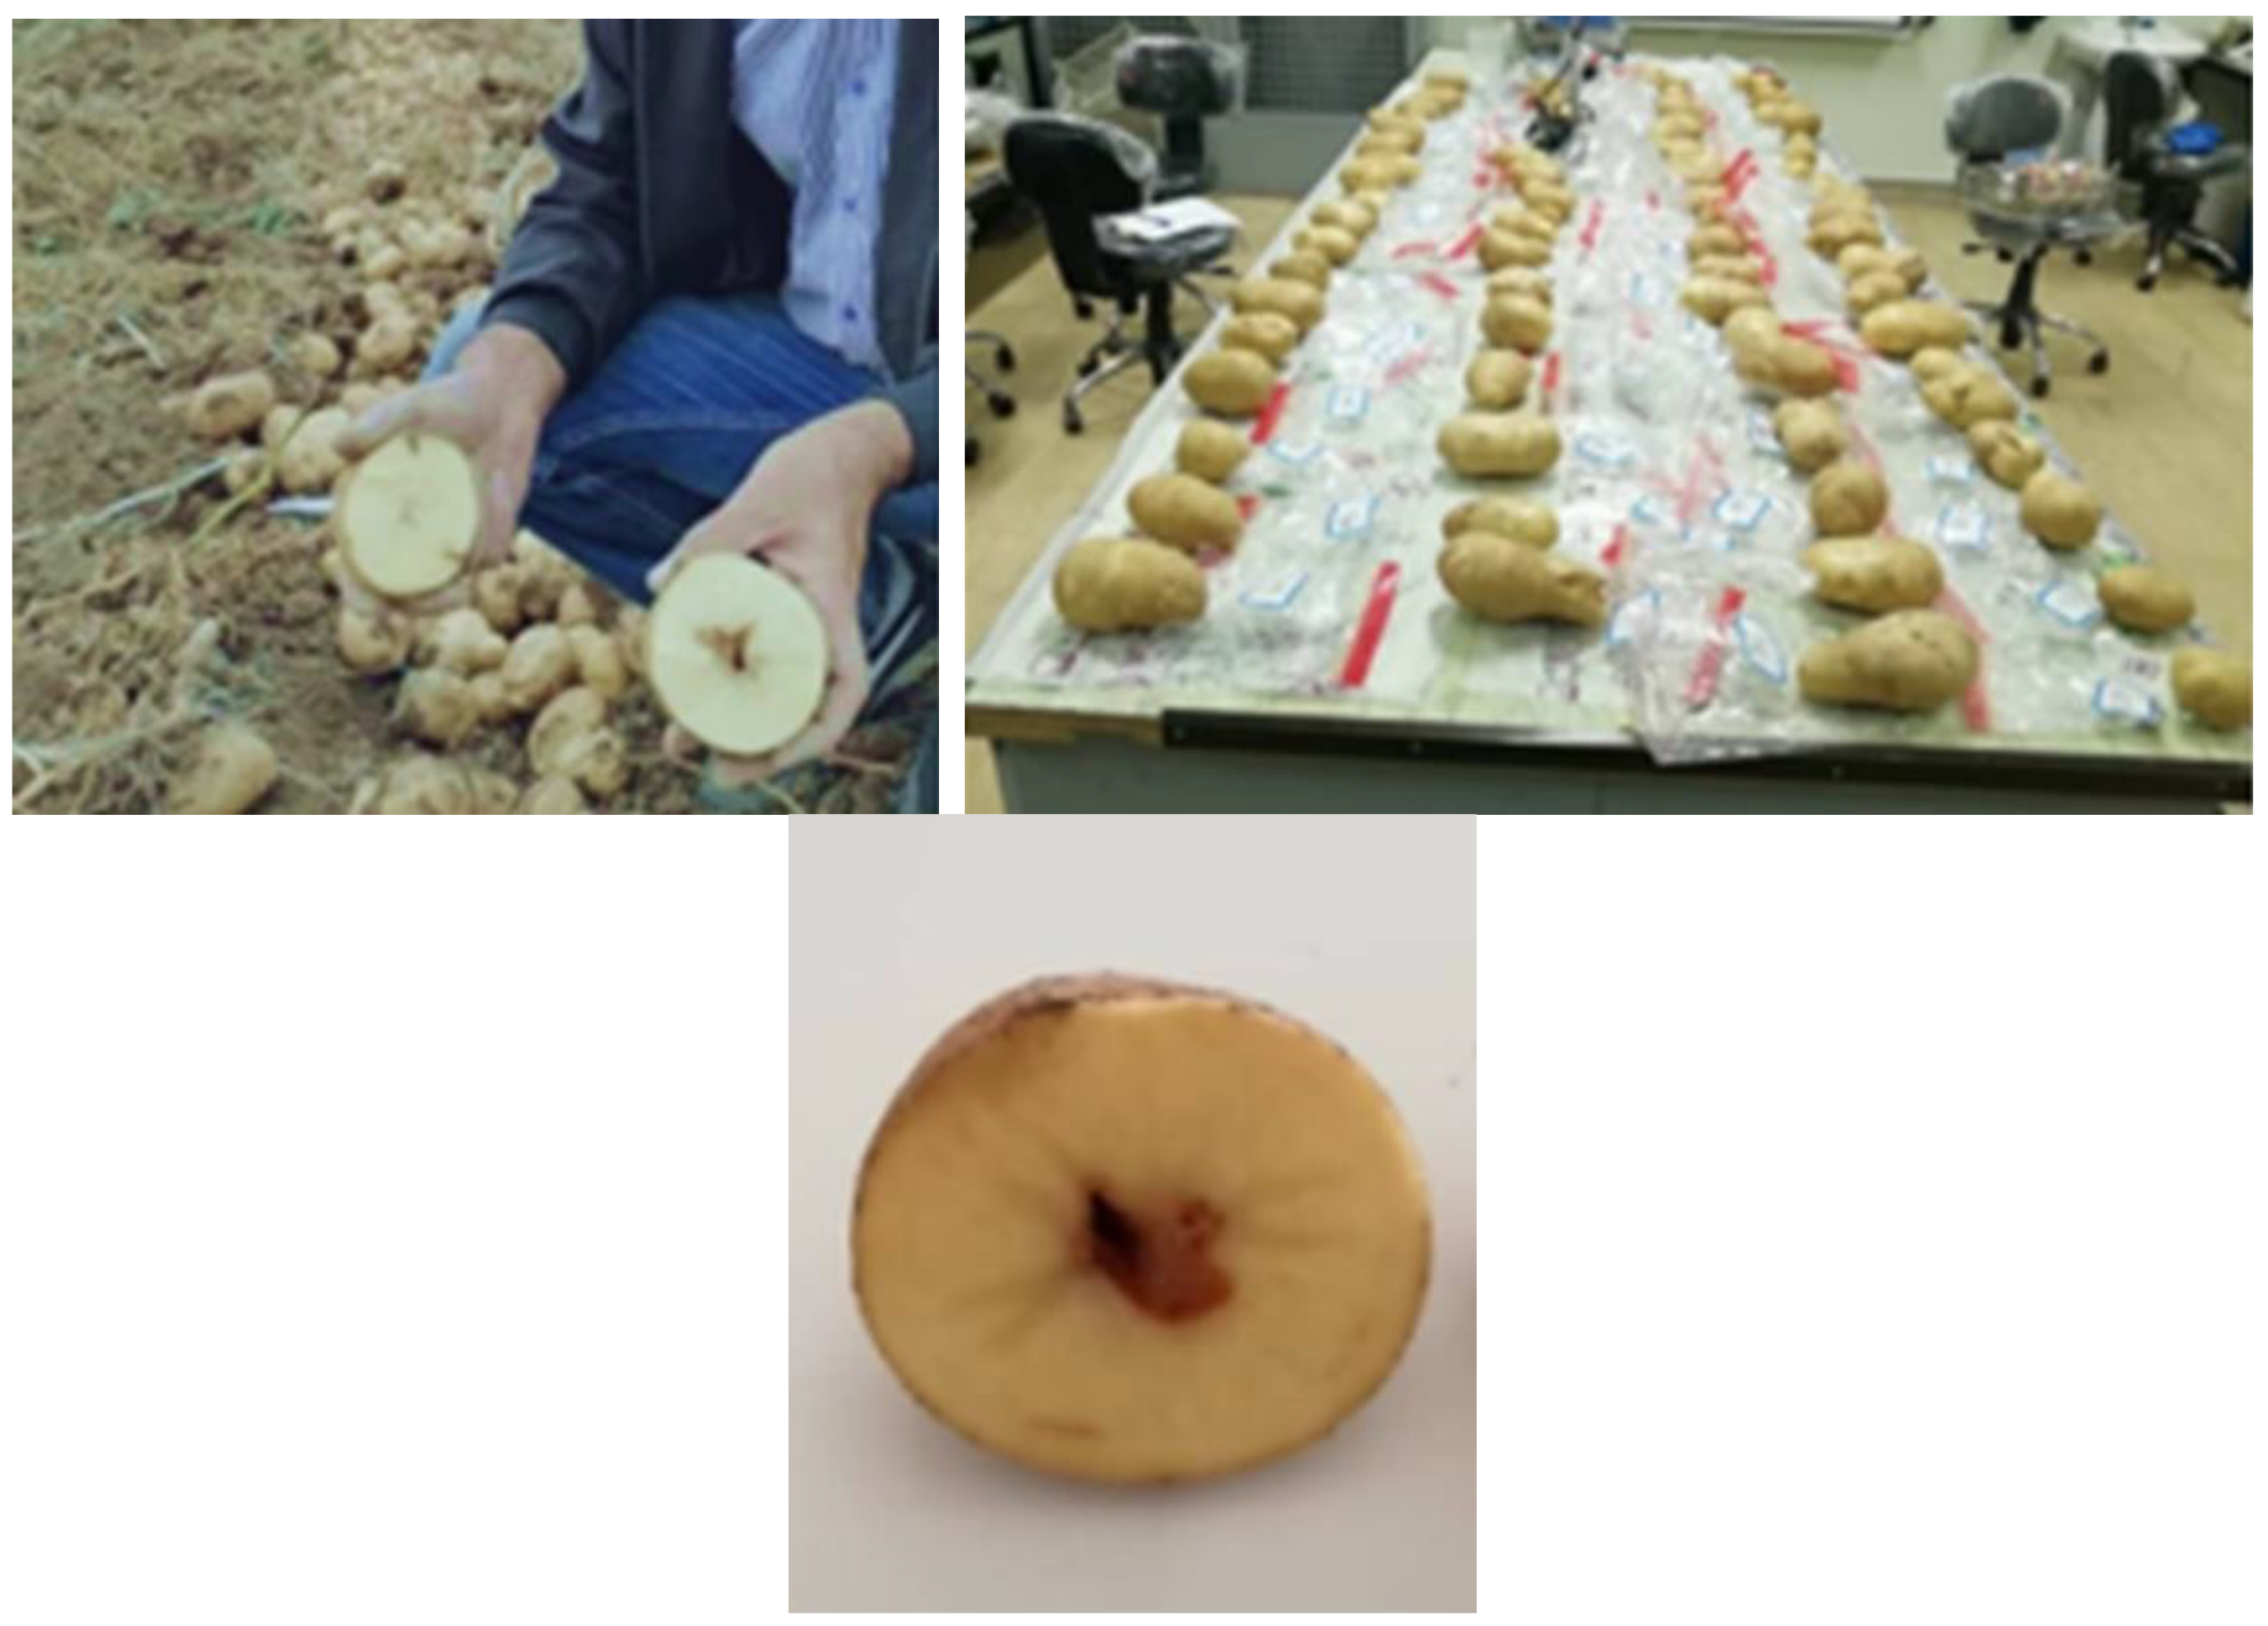
The study area of the present paper, in the West of Iran, is one of the most susceptible areas for potato production due to its temperate climate. However, its export value is decreasing due to the decline in product quality owing to several factors: lack of access to healthy tubers for cultivation; lack of crop rotation leading to increasing pests, diseases, and weeds; and lack of storage with favorable conditions, etc. Most of the observed defects are not externally visible, such as brown rot, hollow heart, black heart and flesh discoloration.
Non-destructive analysis experiments use methods without destructive effects of photo-physical, thermal, chemical, mechanical, and photochemical nature [
7,
8]. Numerous methods have been developed so far to assess the quality of agricultural products, but only some of them have been able to meet the demand and were technically and industrially justified. Among these non-destructive methods, magnetic resonance imaging (MRI) has the highest accuracy, but one of its major disadvantages is the impact of measurement speed on the accuracy, in addition to its high cost. Moreover, it is not recommended for fruits with low moisture content [
9]. The application of x-rays in the online inspection of agricultural products has been reported, since this method is sensitive to the mass density of the substance, not to chemical compounds [
10]. Ultrasonic waves are also used for measuring the quality of crops, but its development faces serious challenges because it requires measuring the ultrasonic properties of different agricultural products.
Among the non-destructive methods for quality control of products, machine vision and spectroscopy techniques have a promising prospect in agricultural science. These technologies are used in various fields such as analysis of ground and aerial mapping of natural resources, crop monitoring, precision agriculture, robotics, automated guidance, non-destructive inspection of products, quality control, predicting the chemical properties of products, and so on [
11]. Therefore, they can be used to quickly determine the quality of agricultural products both on a laboratory scale and in online processing [
12,
13,
14].
Phytochemical, morphological, and physiological processes can lead to changes in the natural spectral behavior of the plants [
15,
16]. For example, Haase [
17] investigated raw potatoes using near-infrared spectroscopy at the range of 850–2500 nm. The properties of dry matter, sugar, and starch were predicted. The results revealed that coefficients of determination, R
2, were about 0.99, 0.66, and 0.96 for dry matter, sugar, and starch, respectively. Zhou et al. [
18] assessed the possibility of classifying potatoes with blackheart using partial least squares-linear discriminant analysis (PLS-LDA) and visible (Vis)/near-infrared (NIR) spectroscopy at the range of 513–850 nm. According to the analysis, wavelengths of 698, 711, 741, 817, and 839 nm were determined as the most effective for the identification of potatoes with blackheart; the total correct classification rate obtained was 96.82%. Moslemkhani et al. [
19] used a spectroscopy technique to detect tomatoes infected by the Y virus (PVY) at the range of visible and a part of NIR. They concluded that wavelengths of 900–1100 nm were strongly sensitive to the PVY infection. The linear discriminant analysis was modeled, and the results showed a suitable potential to detect virus-infected plants. Escuredo et al. [
20] studied the physicochemical properties of potatoes, including their soluble solid content (SSC), dry matter, phenols, antioxidant, texture, and color features at L*a*b* color space using NIR spectrum. A strong relationship between the color features and the antioxidant components was identified by Spearman correlations. Modified partial least squares (MPLS) regression and principal component analysis (PCA) were used to model the best equations for predicting the mentioned properties. Their results indicated that NIR technology was able to rapidly predict the quality parameters of potatoes. Sanchez et al. [
21] conducted a review on assessing the quality of raw and sweet potato using imaging and spectroscopy. They concluded that spectroscopic techniques were more reliable and economical than conventional analytical methods. Moreover, according to the reviewed research, potato and sweet potato were physiologically similar; therefore, challenges should be faced for online classification of sweet potato, and it is necessary to develop advanced non-invasive techniques since the quality of food is considered highly more important than the cost. Marino et al. [
22] classified potatoes based on external defects, including black dot, damaged, black scurf, greening, and common scab using a supervised learning method. A new labeled dataset was created. Then, a convolutional neural network (CNN) was trained to conduct the classification task based on coarse-to-fine segmentation. The results revealed that CNN was able to classify potatoes with a recall of 0.90 and precision of 0.91.
According to previous research, it is found that many studies have been accomplished on potatoes, most of them focused on the detection of visible defects and normally using a single detection algorithm. The innovation of the present study is the proposal, development, and validation of an ensemble classifier, combined with the majority voting rule [
23] that includes hybrid artificial neural networks (ANN) and imperialist competitive algorithm (ANN-ICA), hybrid ANN and harmony search algorithm (ANN-HS), linear discriminant analysis (LDA), and k-nearest neighbors algorithm (KNN), to identify internal defects of potatoes that have no visible symptoms.
3. Results and Discussion
3.1. Optimal Wavelengths for Classifying Healthy/Defective Potatoes
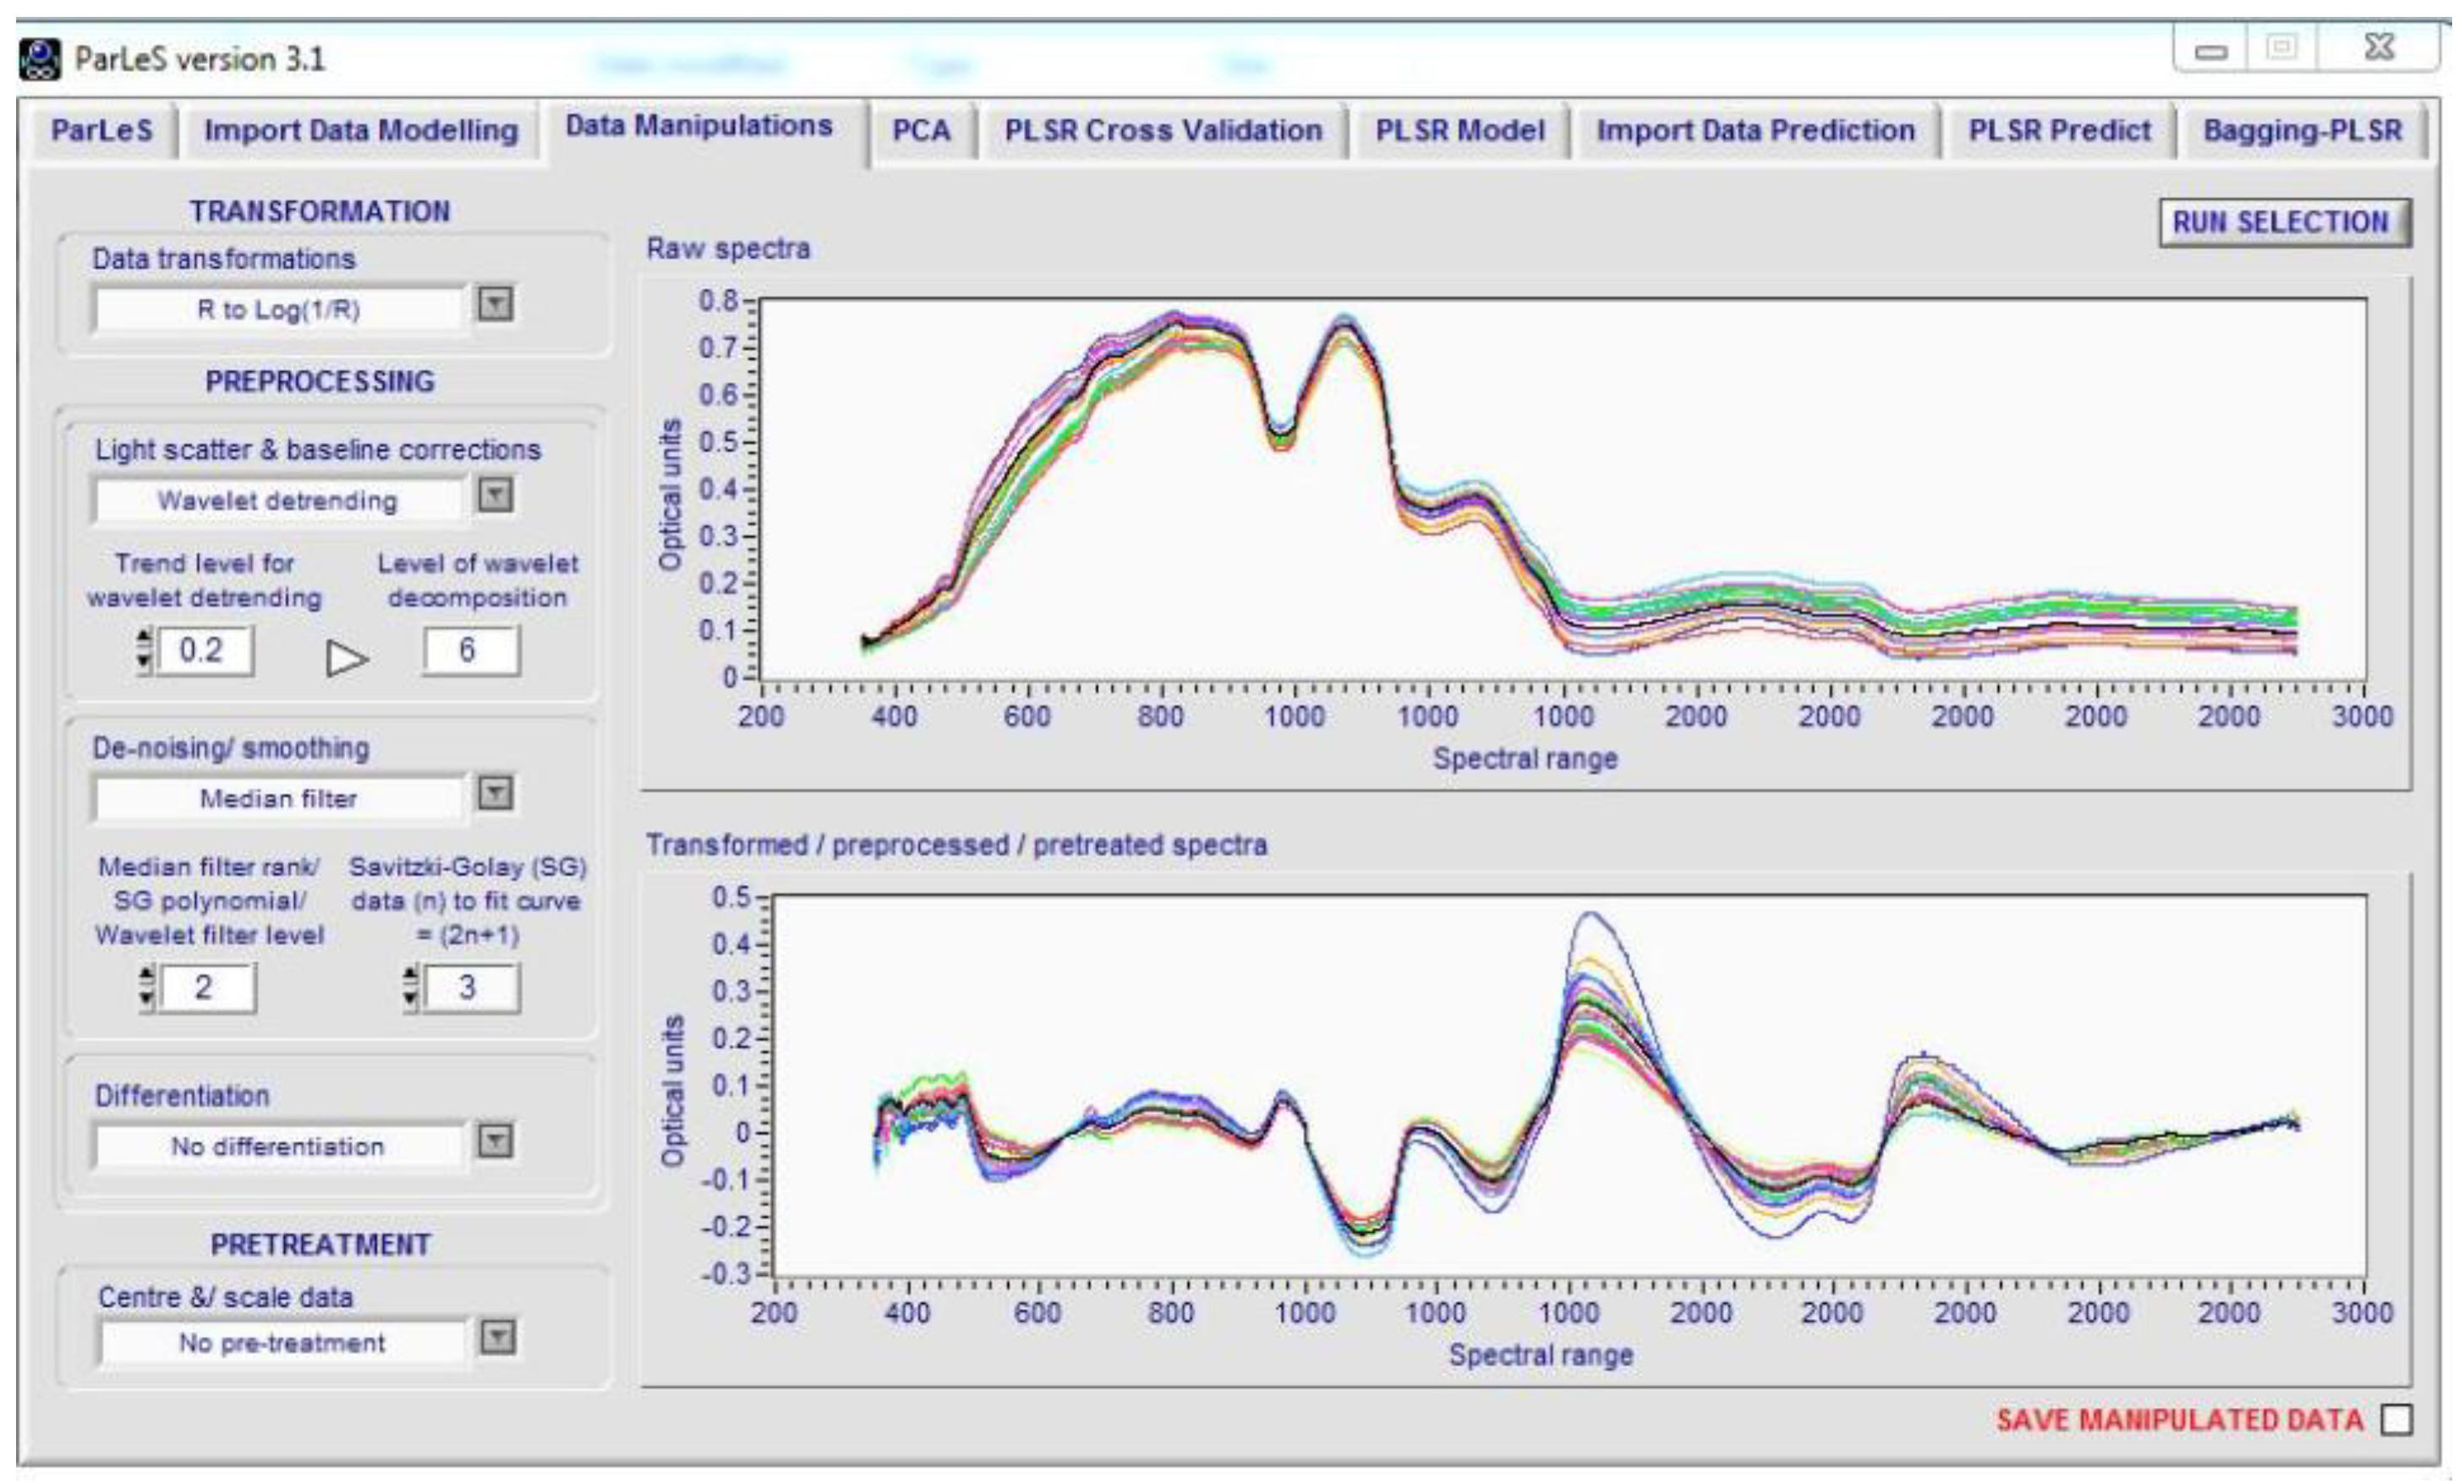
As presented in
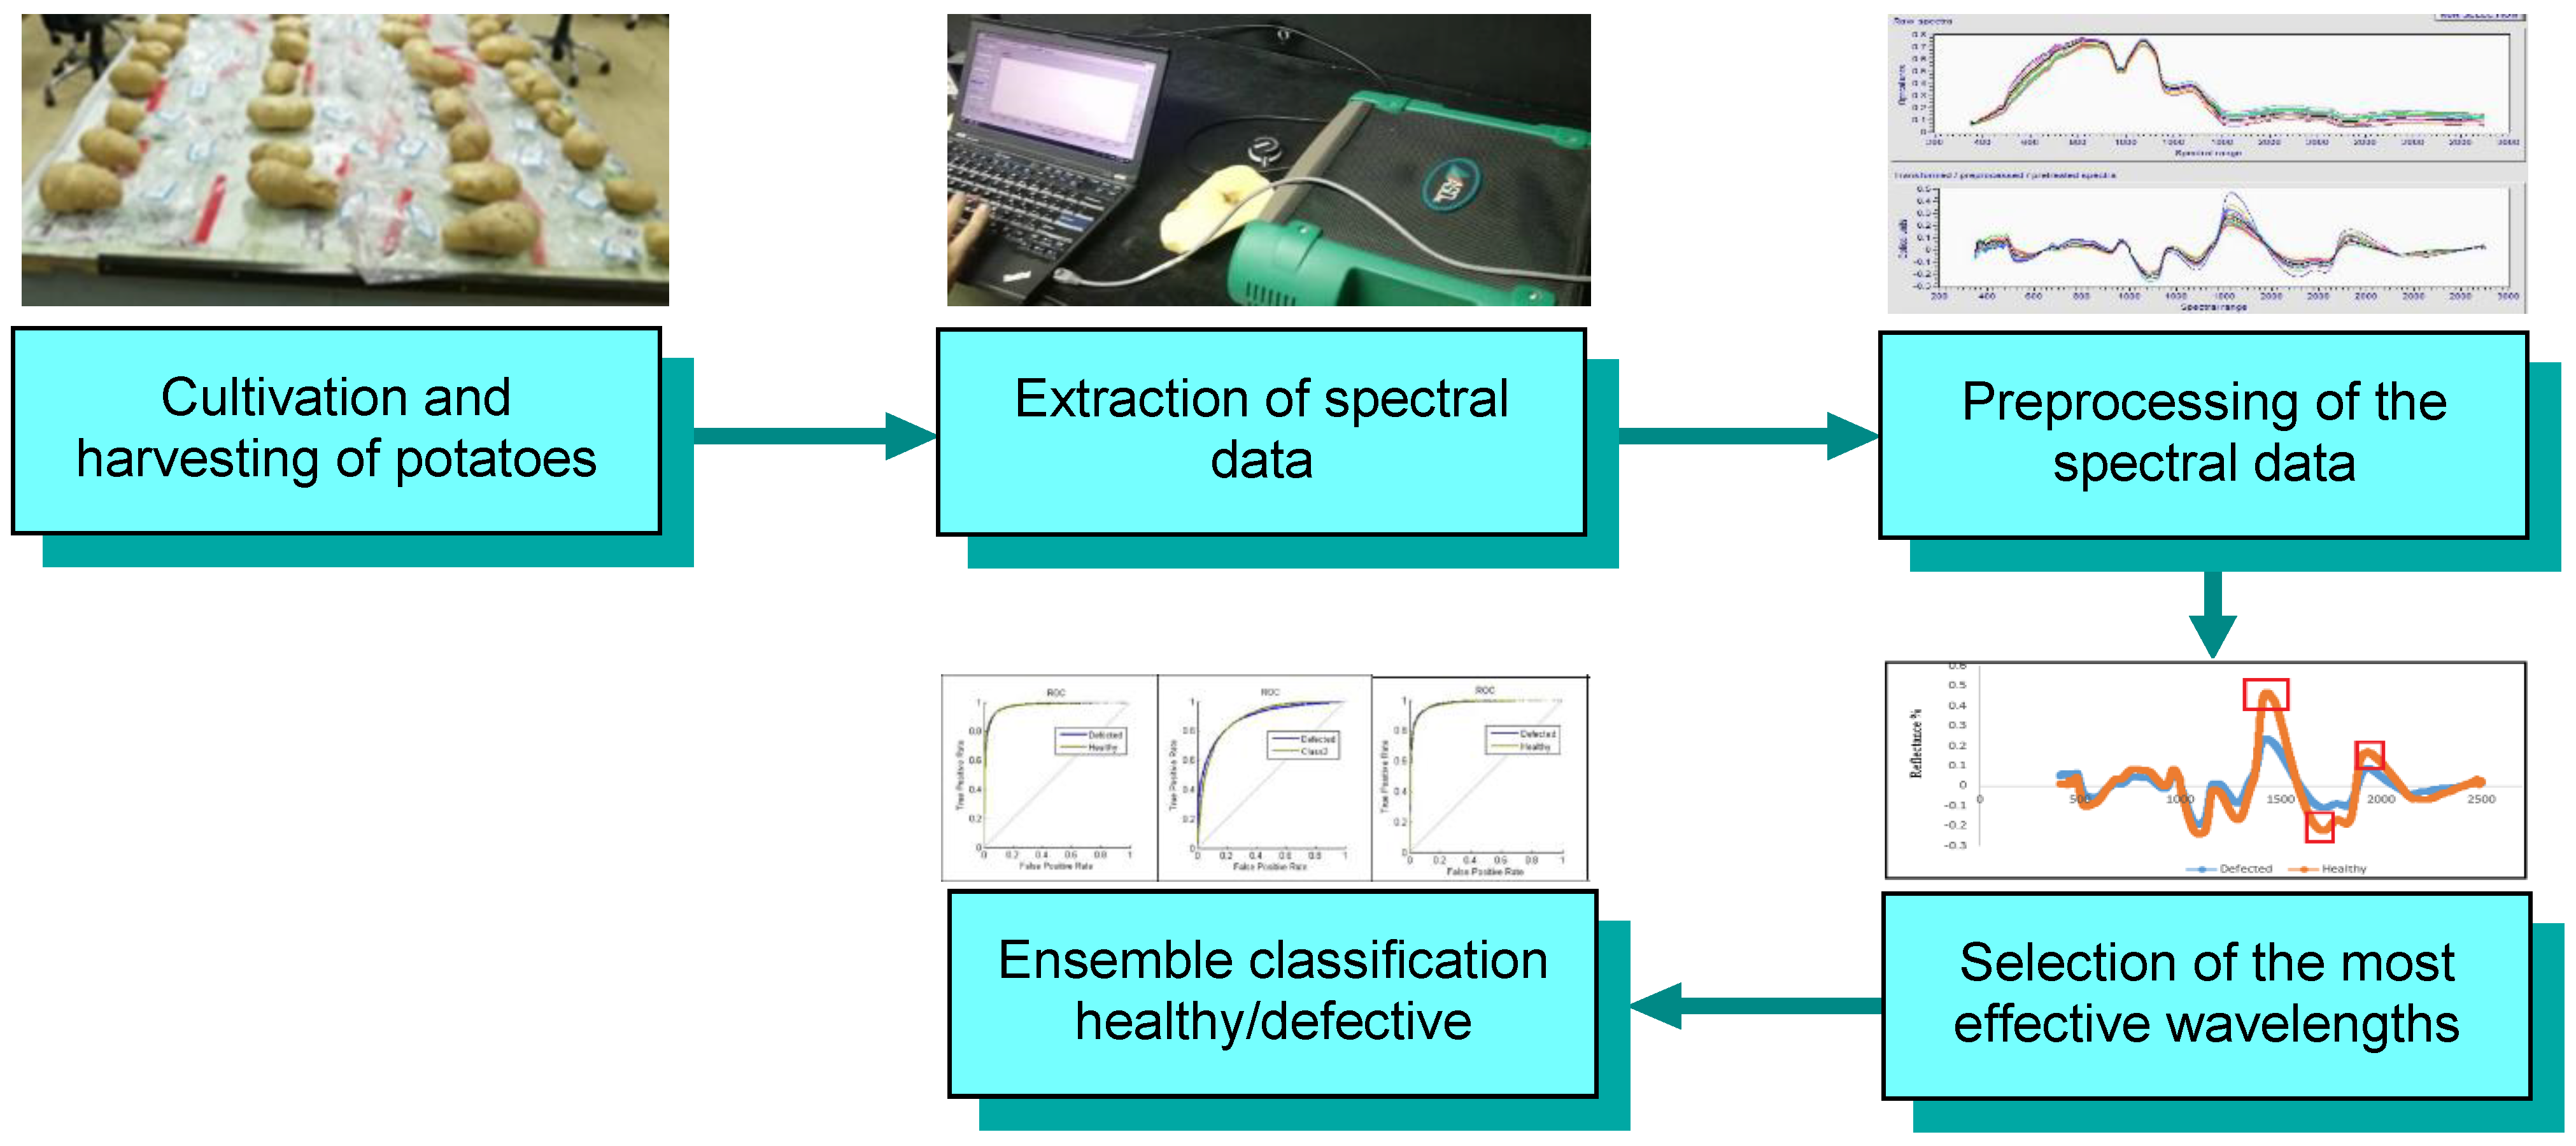
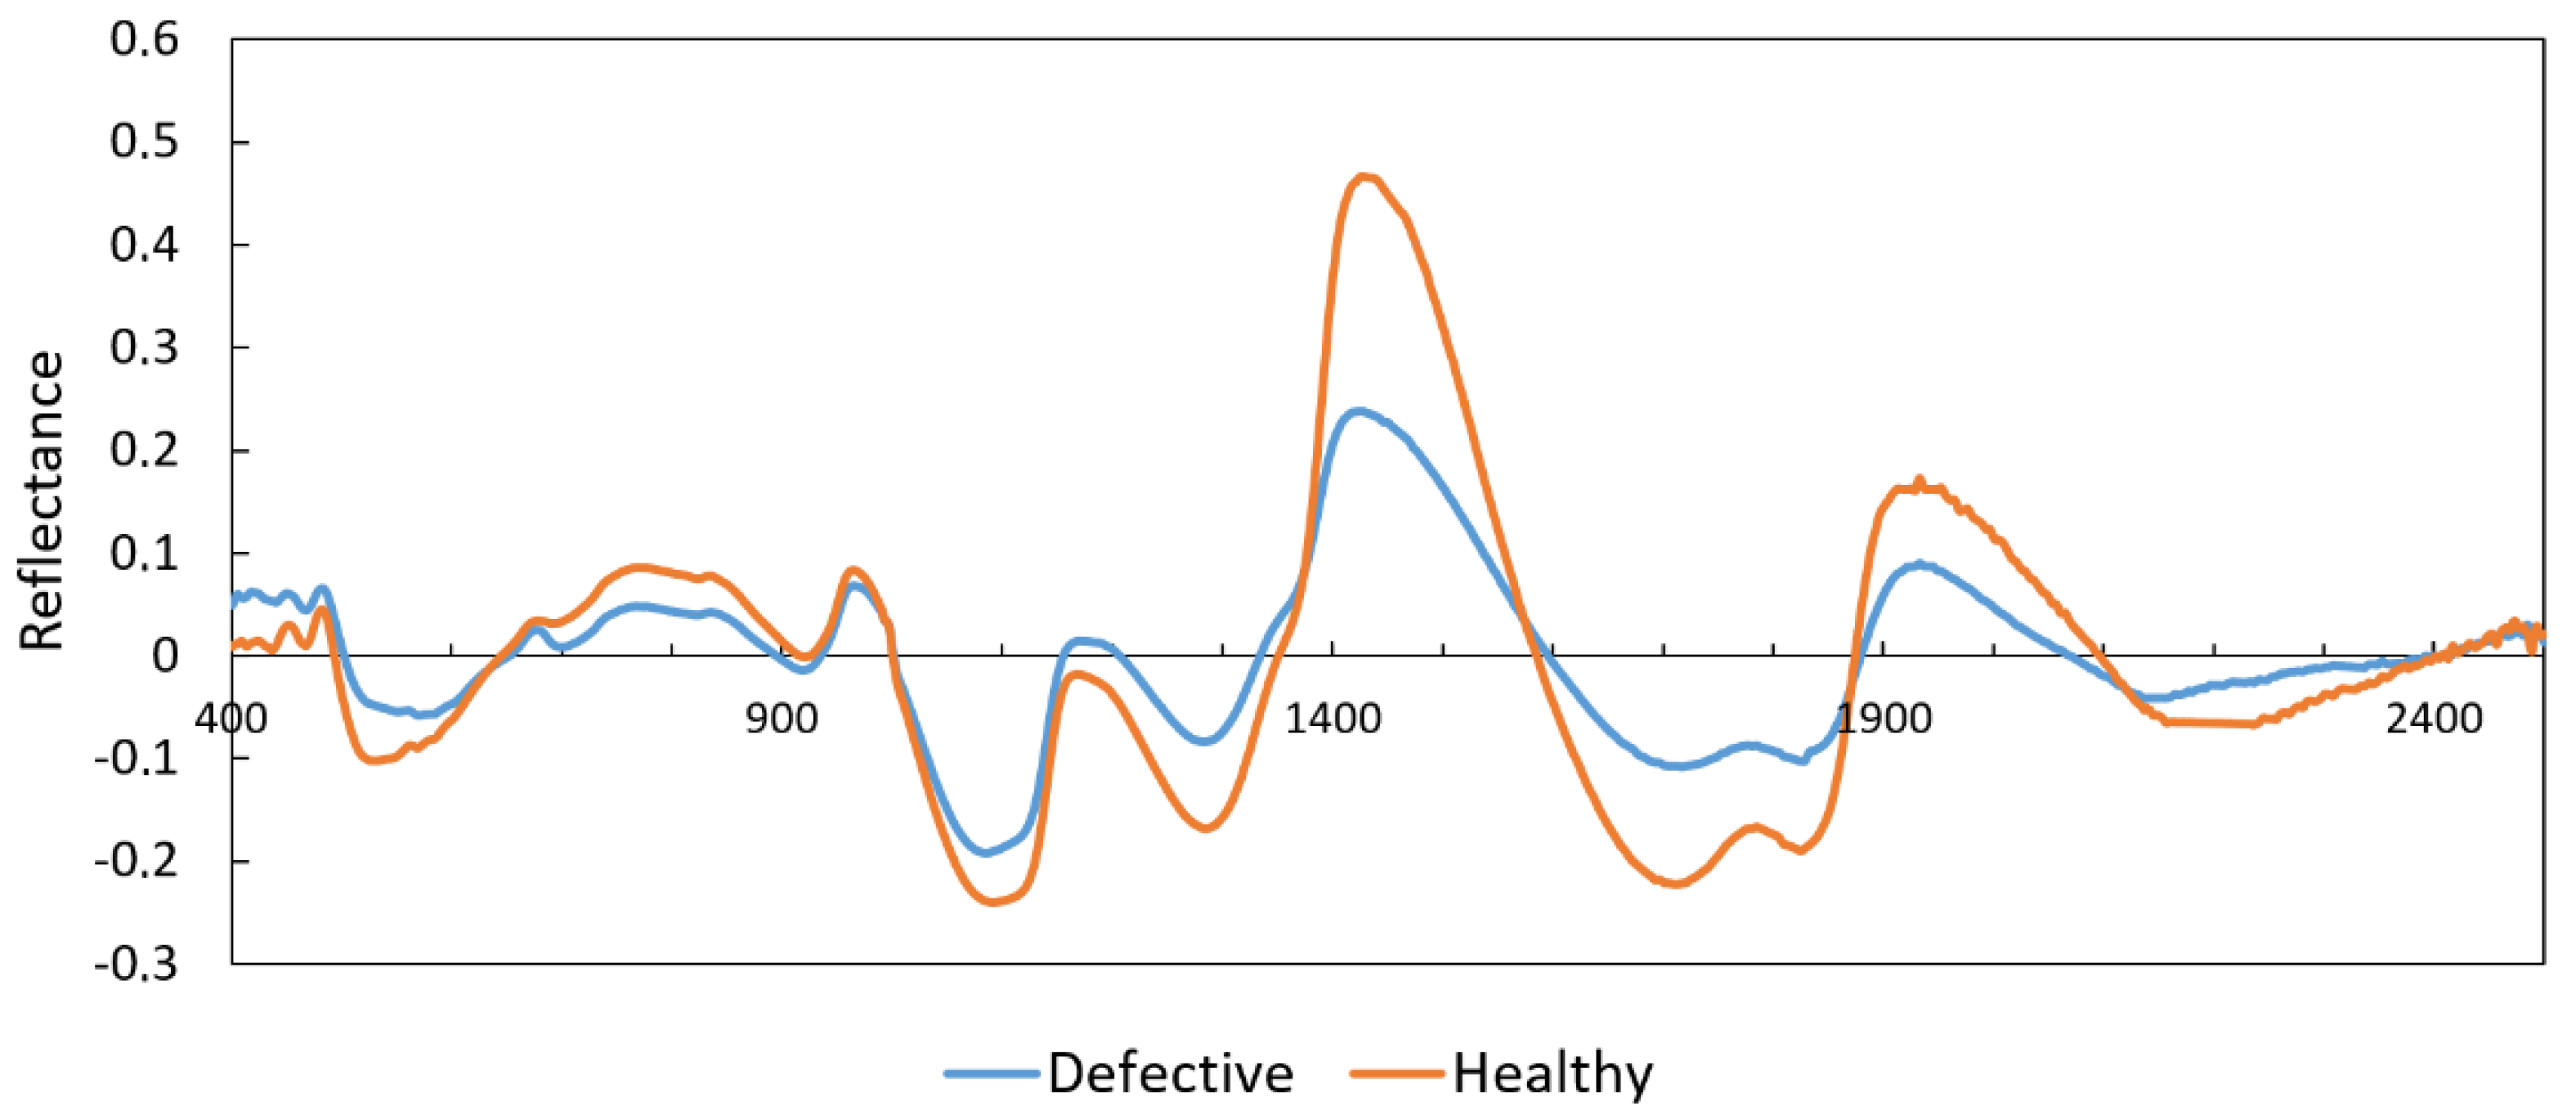
Section 2, the selection of the most effective wavelengths was carried out using ANN-CA. The spectrum was divided into Vis/NIR (350–1100 nm) and SWIR (1100–2500 nm) regions. The ANN-CA process was configured to test different selections of three wavelengths, which evolved according to the CA strategy. This process was repeated until reaching convergence. Finally, the three most effective wavelengths of Vis/NIR region were 861, 883, and 998 nm, and the most effective at the SWIR region were 1539, 1858, and 1896 nm. These values correspond to some of the peaks depicted in
Figure 5, where the differences between healthy and defective samples are higher.
3.2. Performance of the MV Classifier
Table 2 presents the performance of the MV classifier using the confusion matrix, the total CCR, and the classification error per class after 200 iterations of the experiment.
A total of 852 out of the 14,400 samples were incorrectly classified using SWIR, and 2395 using Vis/NIR. These number of incorrectly classified samples resulted in CCRs of 94.1% and 83.4%, respectively. This indicated that SWIR information was clearly more useful to detect the internal defects of the potatoes, obtaining a high accuracy that could be adequate for practical uses, while the high error using Vis/NIR could make it unpractical. It can also be observed that in both cases, the technique tended to produce an over-classification in the healthy class. For this reason, the errors in the defective class were higher than those in the healthy one. The sensitivity of the classifiers should be adjusted to produce a more balanced accuracy in the classes, if necessary.
Table 3 shows the five performance criteria of the MV classifier computed from the confusion matrix for the 200 iterations. The first evident fact is that the classification in the SWIR range was able to achieve better results than those in Vis/NIR. The accuracy in SWIR was more than 10% better, which was a considerable value. The best accuracy of 94% was feasible for practical use, while the 83% of Vis/NIR could be unpractical. Both cases tend to over-classify the samples in the healthy class, so the classification error is higher for the defective class (about 50% higher).
In both spectral ranges, the accuracy of the two classes was very similar, and therefore the results of both classes were closer to the actual value of the same class. But the precision of the healthy class was greater than the defective one in SWIR and Vis/NIR, indicating the classifier’s ability to correctly identify defective potatoes. In other words, it reveals how many of the defective samples were correctly detected (positive test result). On the other hand, the specificity of the healthy class was greater than that of the defective class, which indicated the ability of the classifier to recognize the healthy class. These results were also derived from the trend of the methods to over-classify in the healthy class.
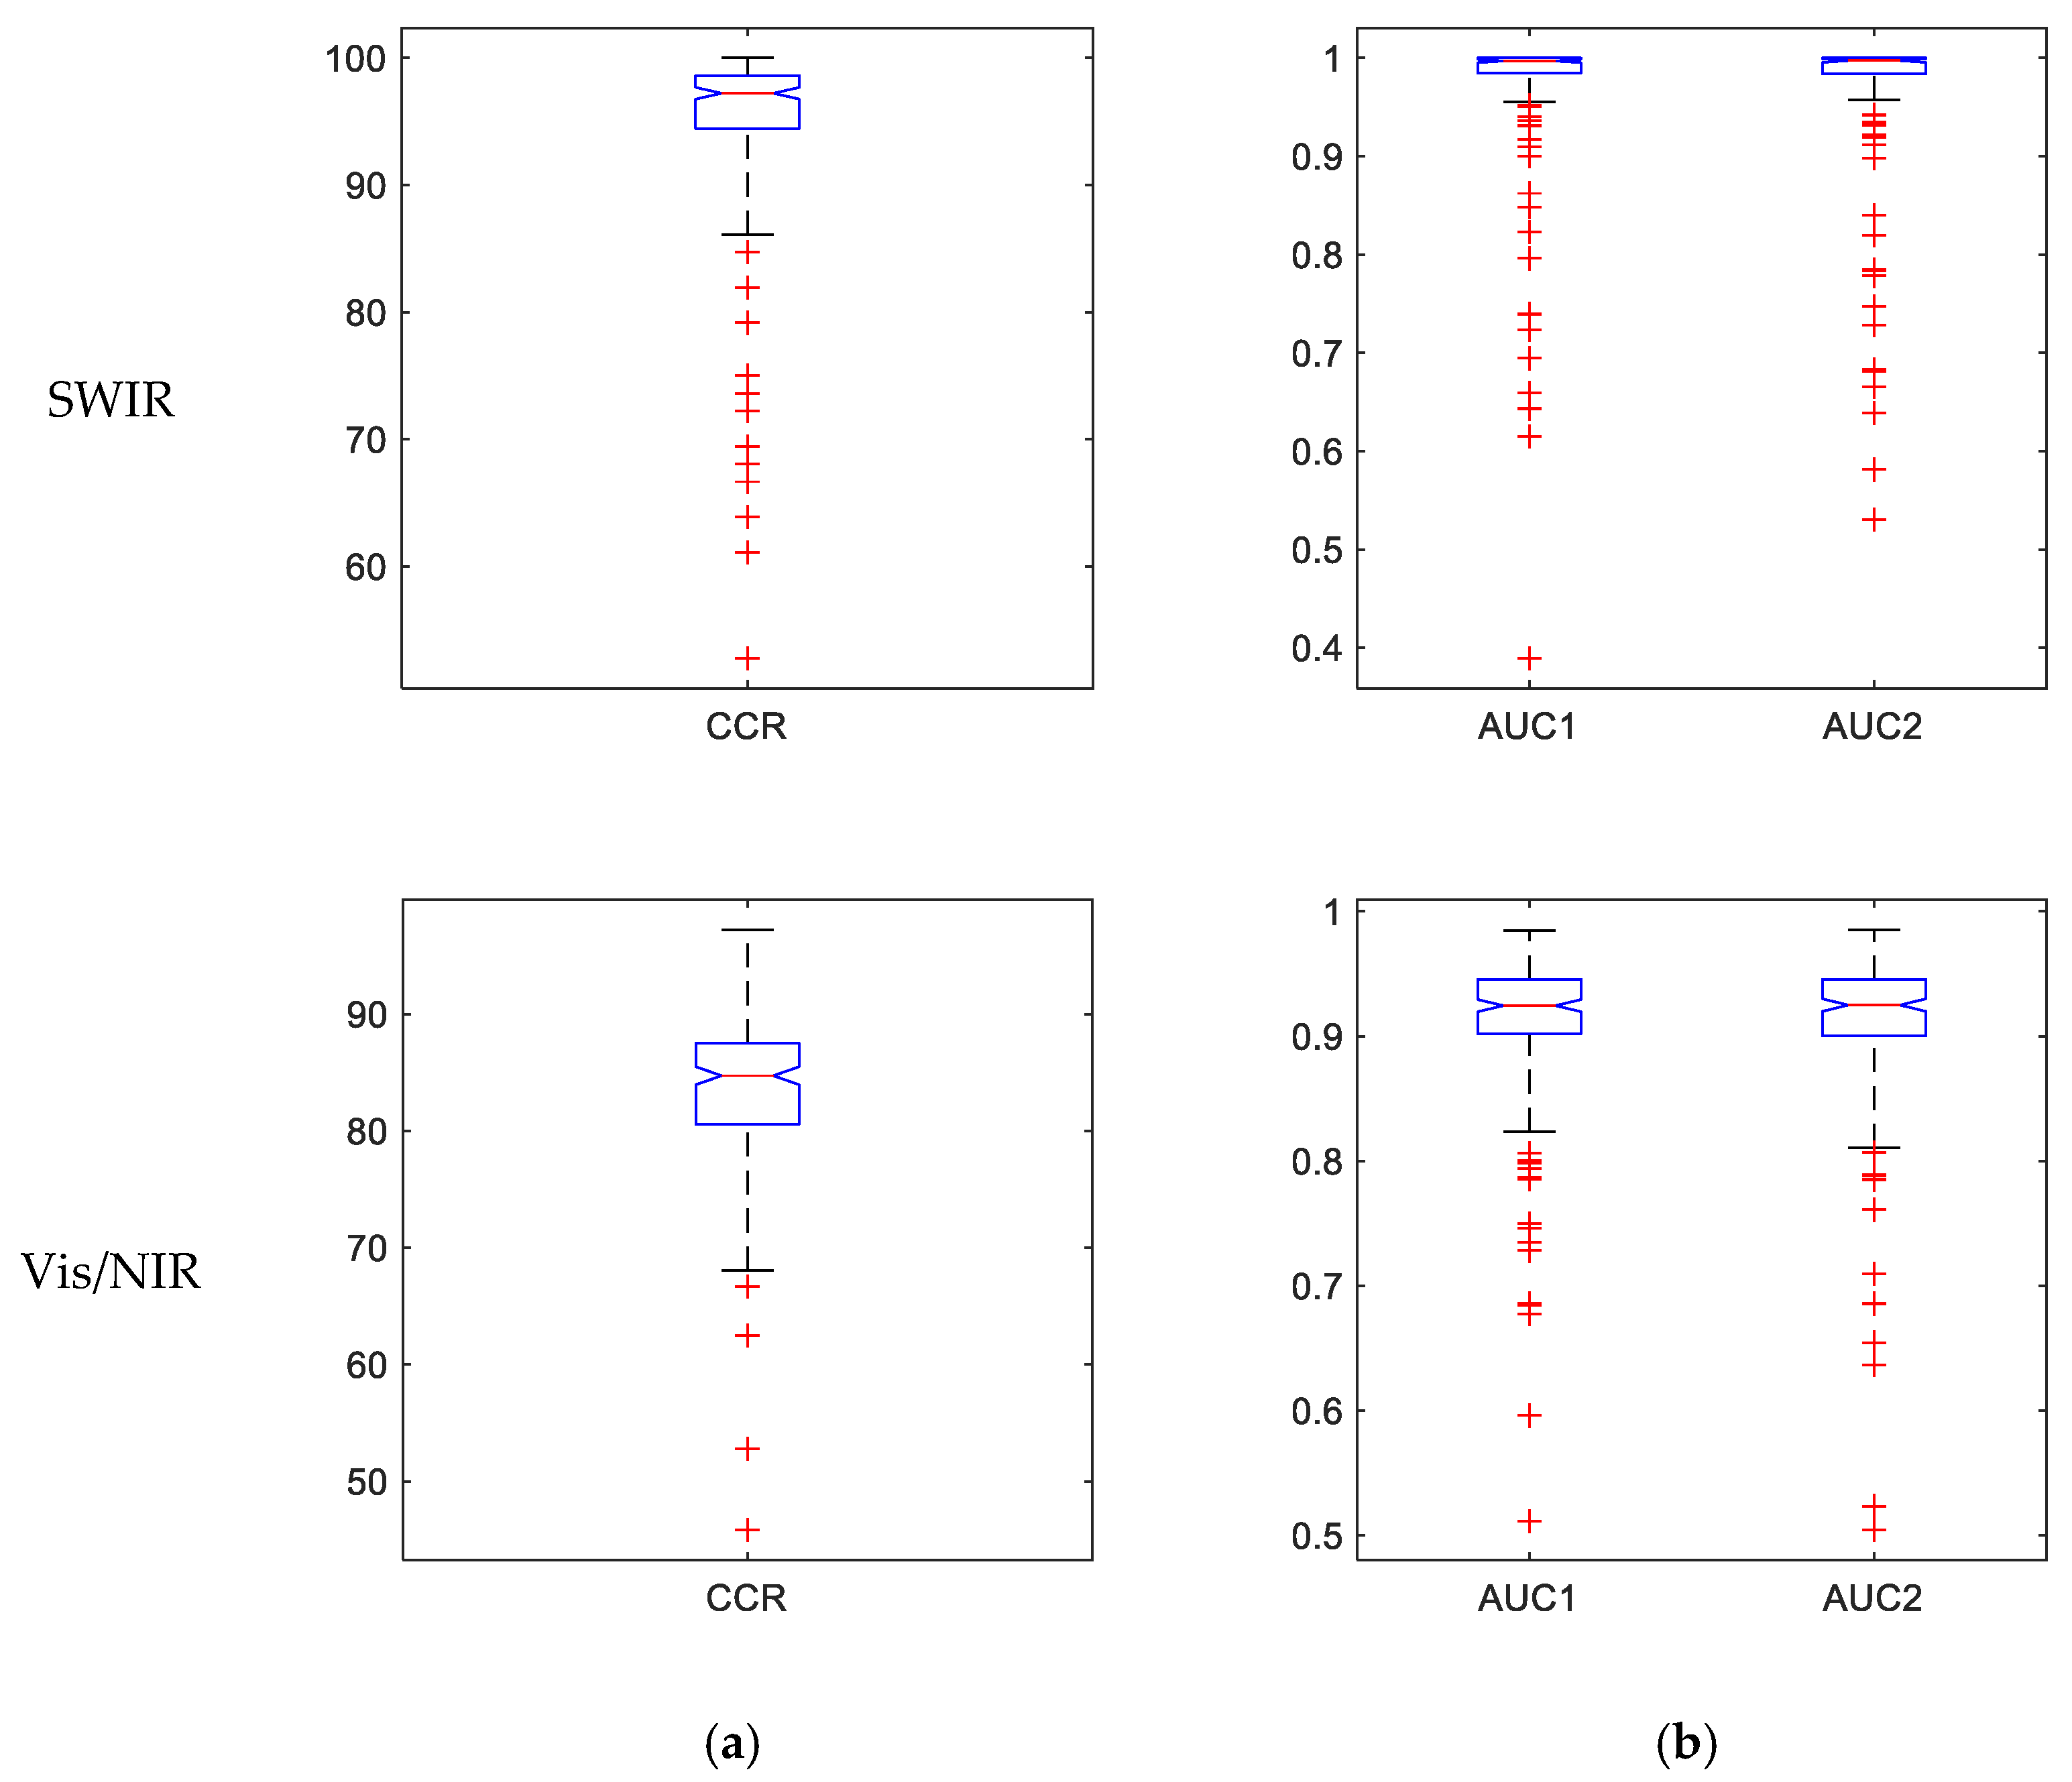
Figure 6 represents the performance of the ensemble classifier using boxplots of CCR and the areas under the ROC curve (AUC) for the 200 iterations. The compactness of these boxplots indicates the high stability of the classifiers, especially in SWIR.
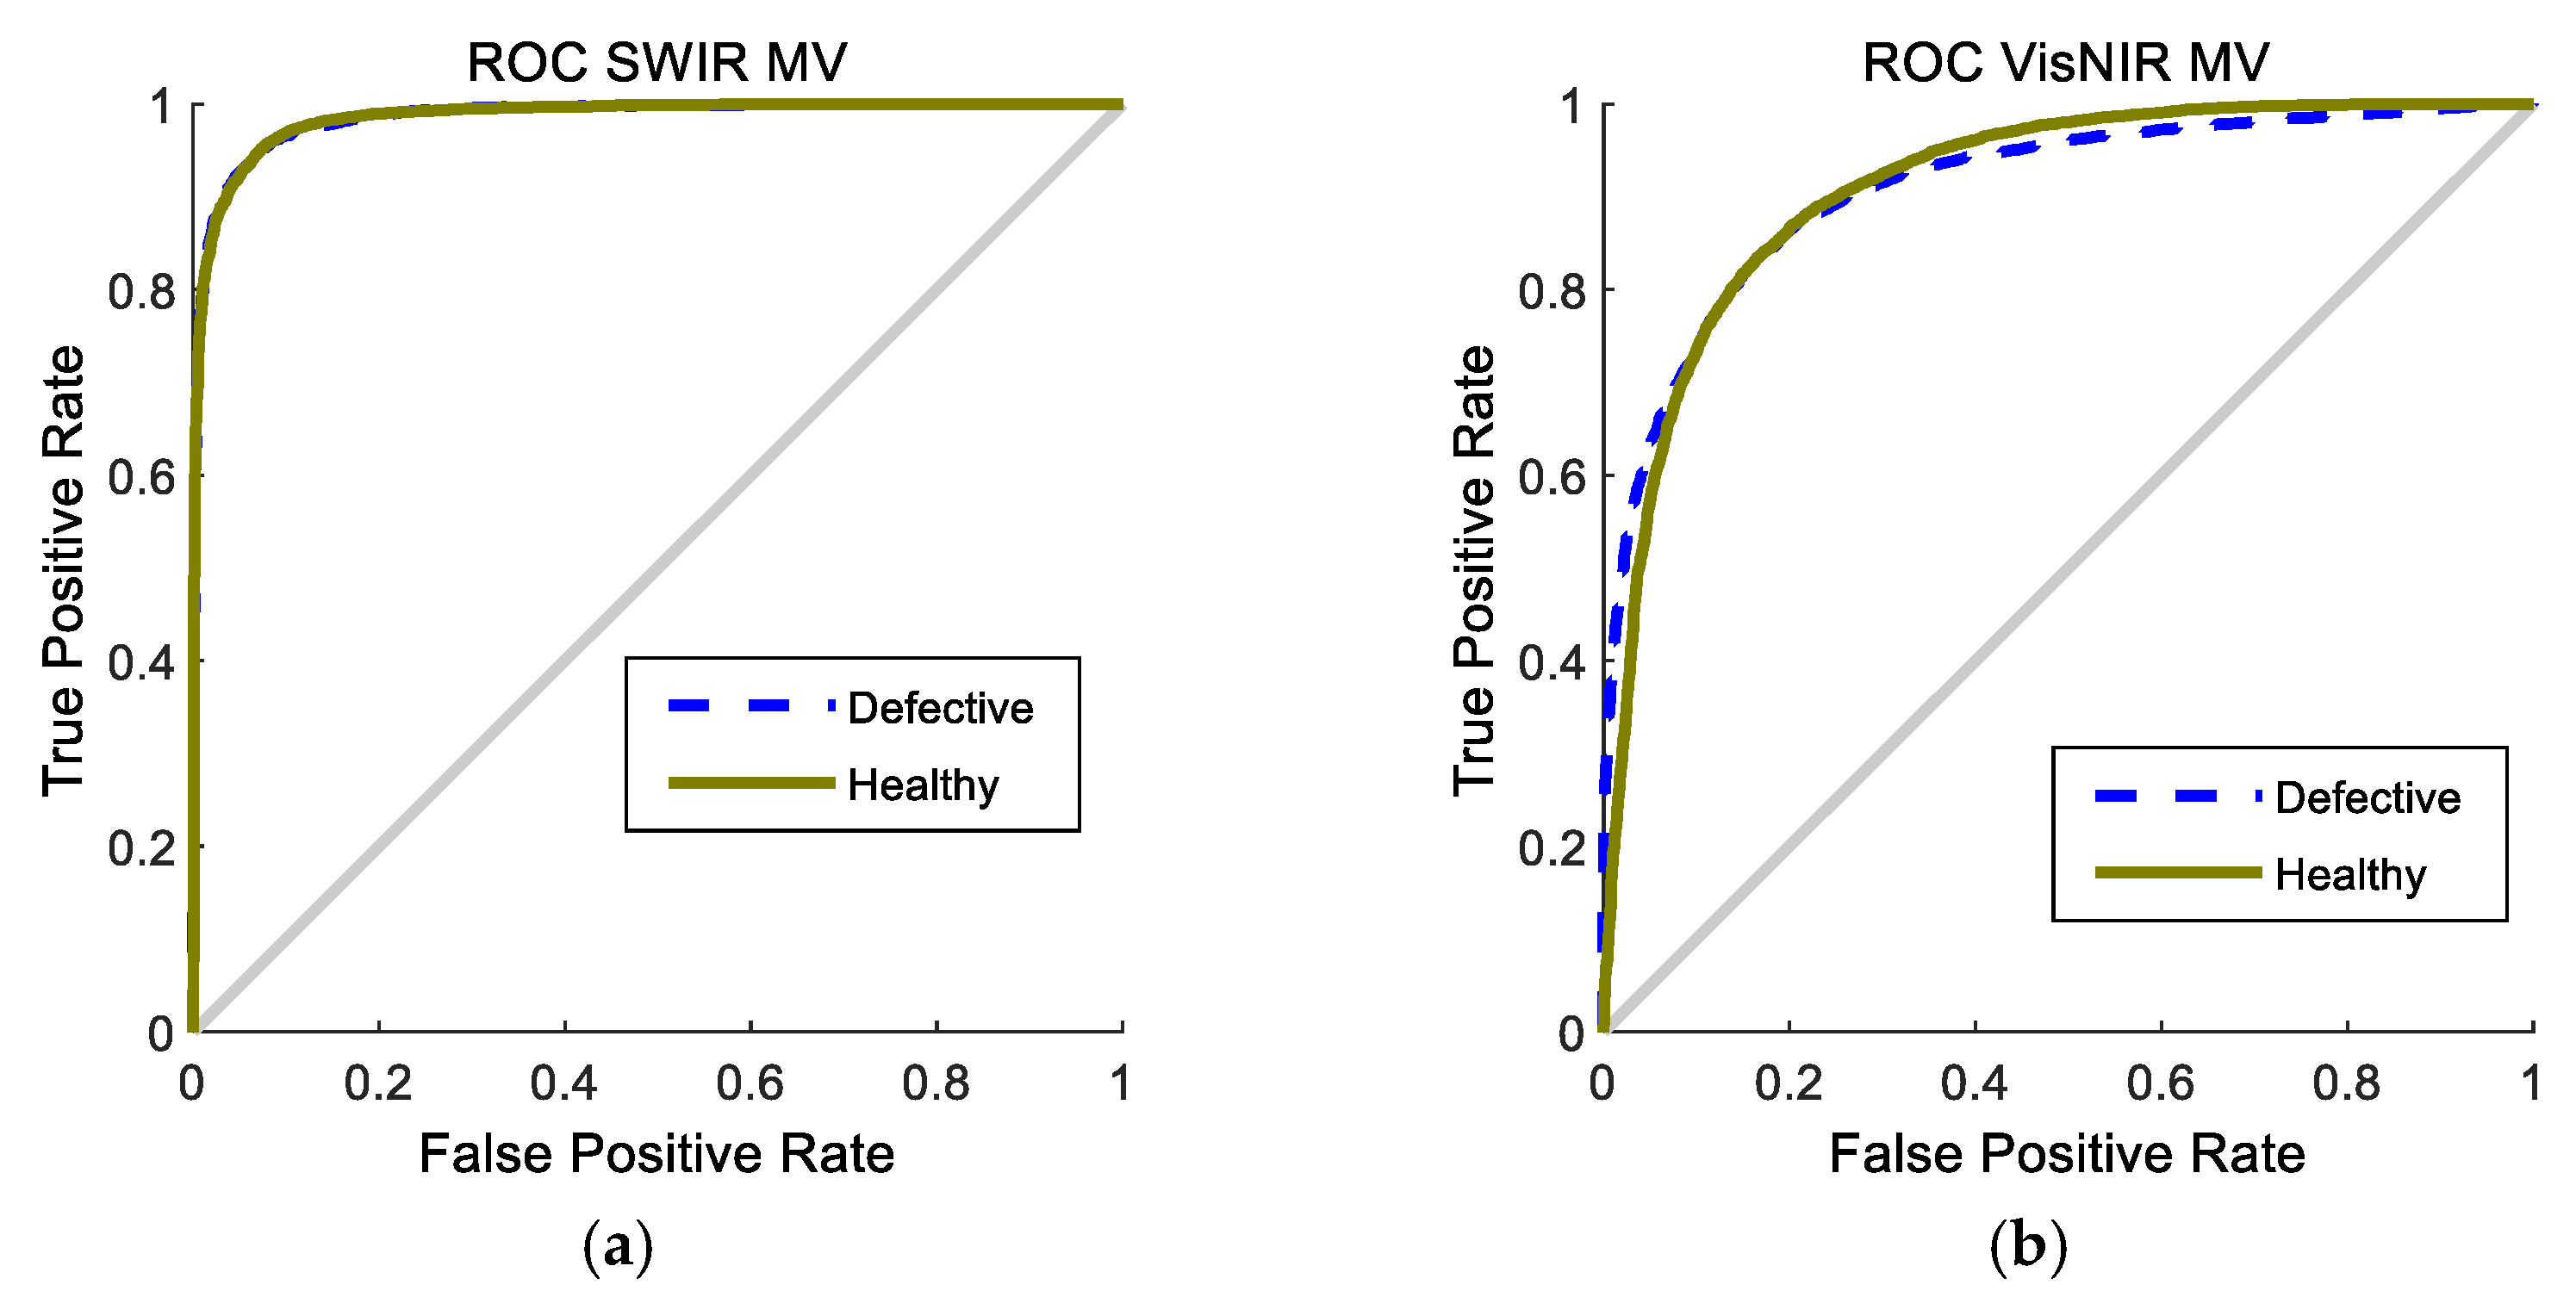
Figure 7 represents the ROC curve of the ensemble classifier for the 200 iterations. As it is clear, the graphs of both classes are far from the bisector line and closer to the vertical, indicating the high performance of the classifier in the corresponding class.
Again, it can be observed that the classification in SWIR is more precise than in Vis/NIR, presenting the former a sharper curve, nearer the ideal curve. Both ROC curves in SWIR are very similar. Thus, the classifier can be conveniently adjusted to produce similar values of the false positives and false negatives. In this way, the over-classification in the healthy class could be avoided.
The average and standard deviation of the CCR and AUCs of the 200 iterations are contained in
Table 4. This information can be related with the boxplots in
Figure 6, indicating a good stability of the proposed classifiers in both ranges. There are only several iterations that fall far from the typical values, as shown in the red crosses in
Figure 6.
3.3. Comparison of Different Classifiers Used for Majority Voting
Since the proposed method is a combination of four basic classifiers, it is also interesting to analyze the individual effectivity of these constituent methods. The confusion matrices, classification errors by class, and accuracies obtained by these four methods for the 200 iterations are given in
Table 5, while
Table 6 contains the performance criteria derived from the confusion matrices. The results obtained by the different methods are very varied, from a CCR of 70.8% for KNN using Vis/NIR, to 97.7% for LDA using SWIR.
It is notable that the maximum accuracy may not be achieved using the majority voting method, but a reliable result can be achieved using only the LDA classifier. This fact can be due to the reduction of dimensionality of the original problem after the selection of the three most effective wavelengths in SWIR and Vis/NIR. In this way, although the classes could not be linearly separable with the full spectral data, they become separable after reducing the problem to a low dimensionality. LDA is not only better than the MV method in SWIR, but also in Vis/NIR.
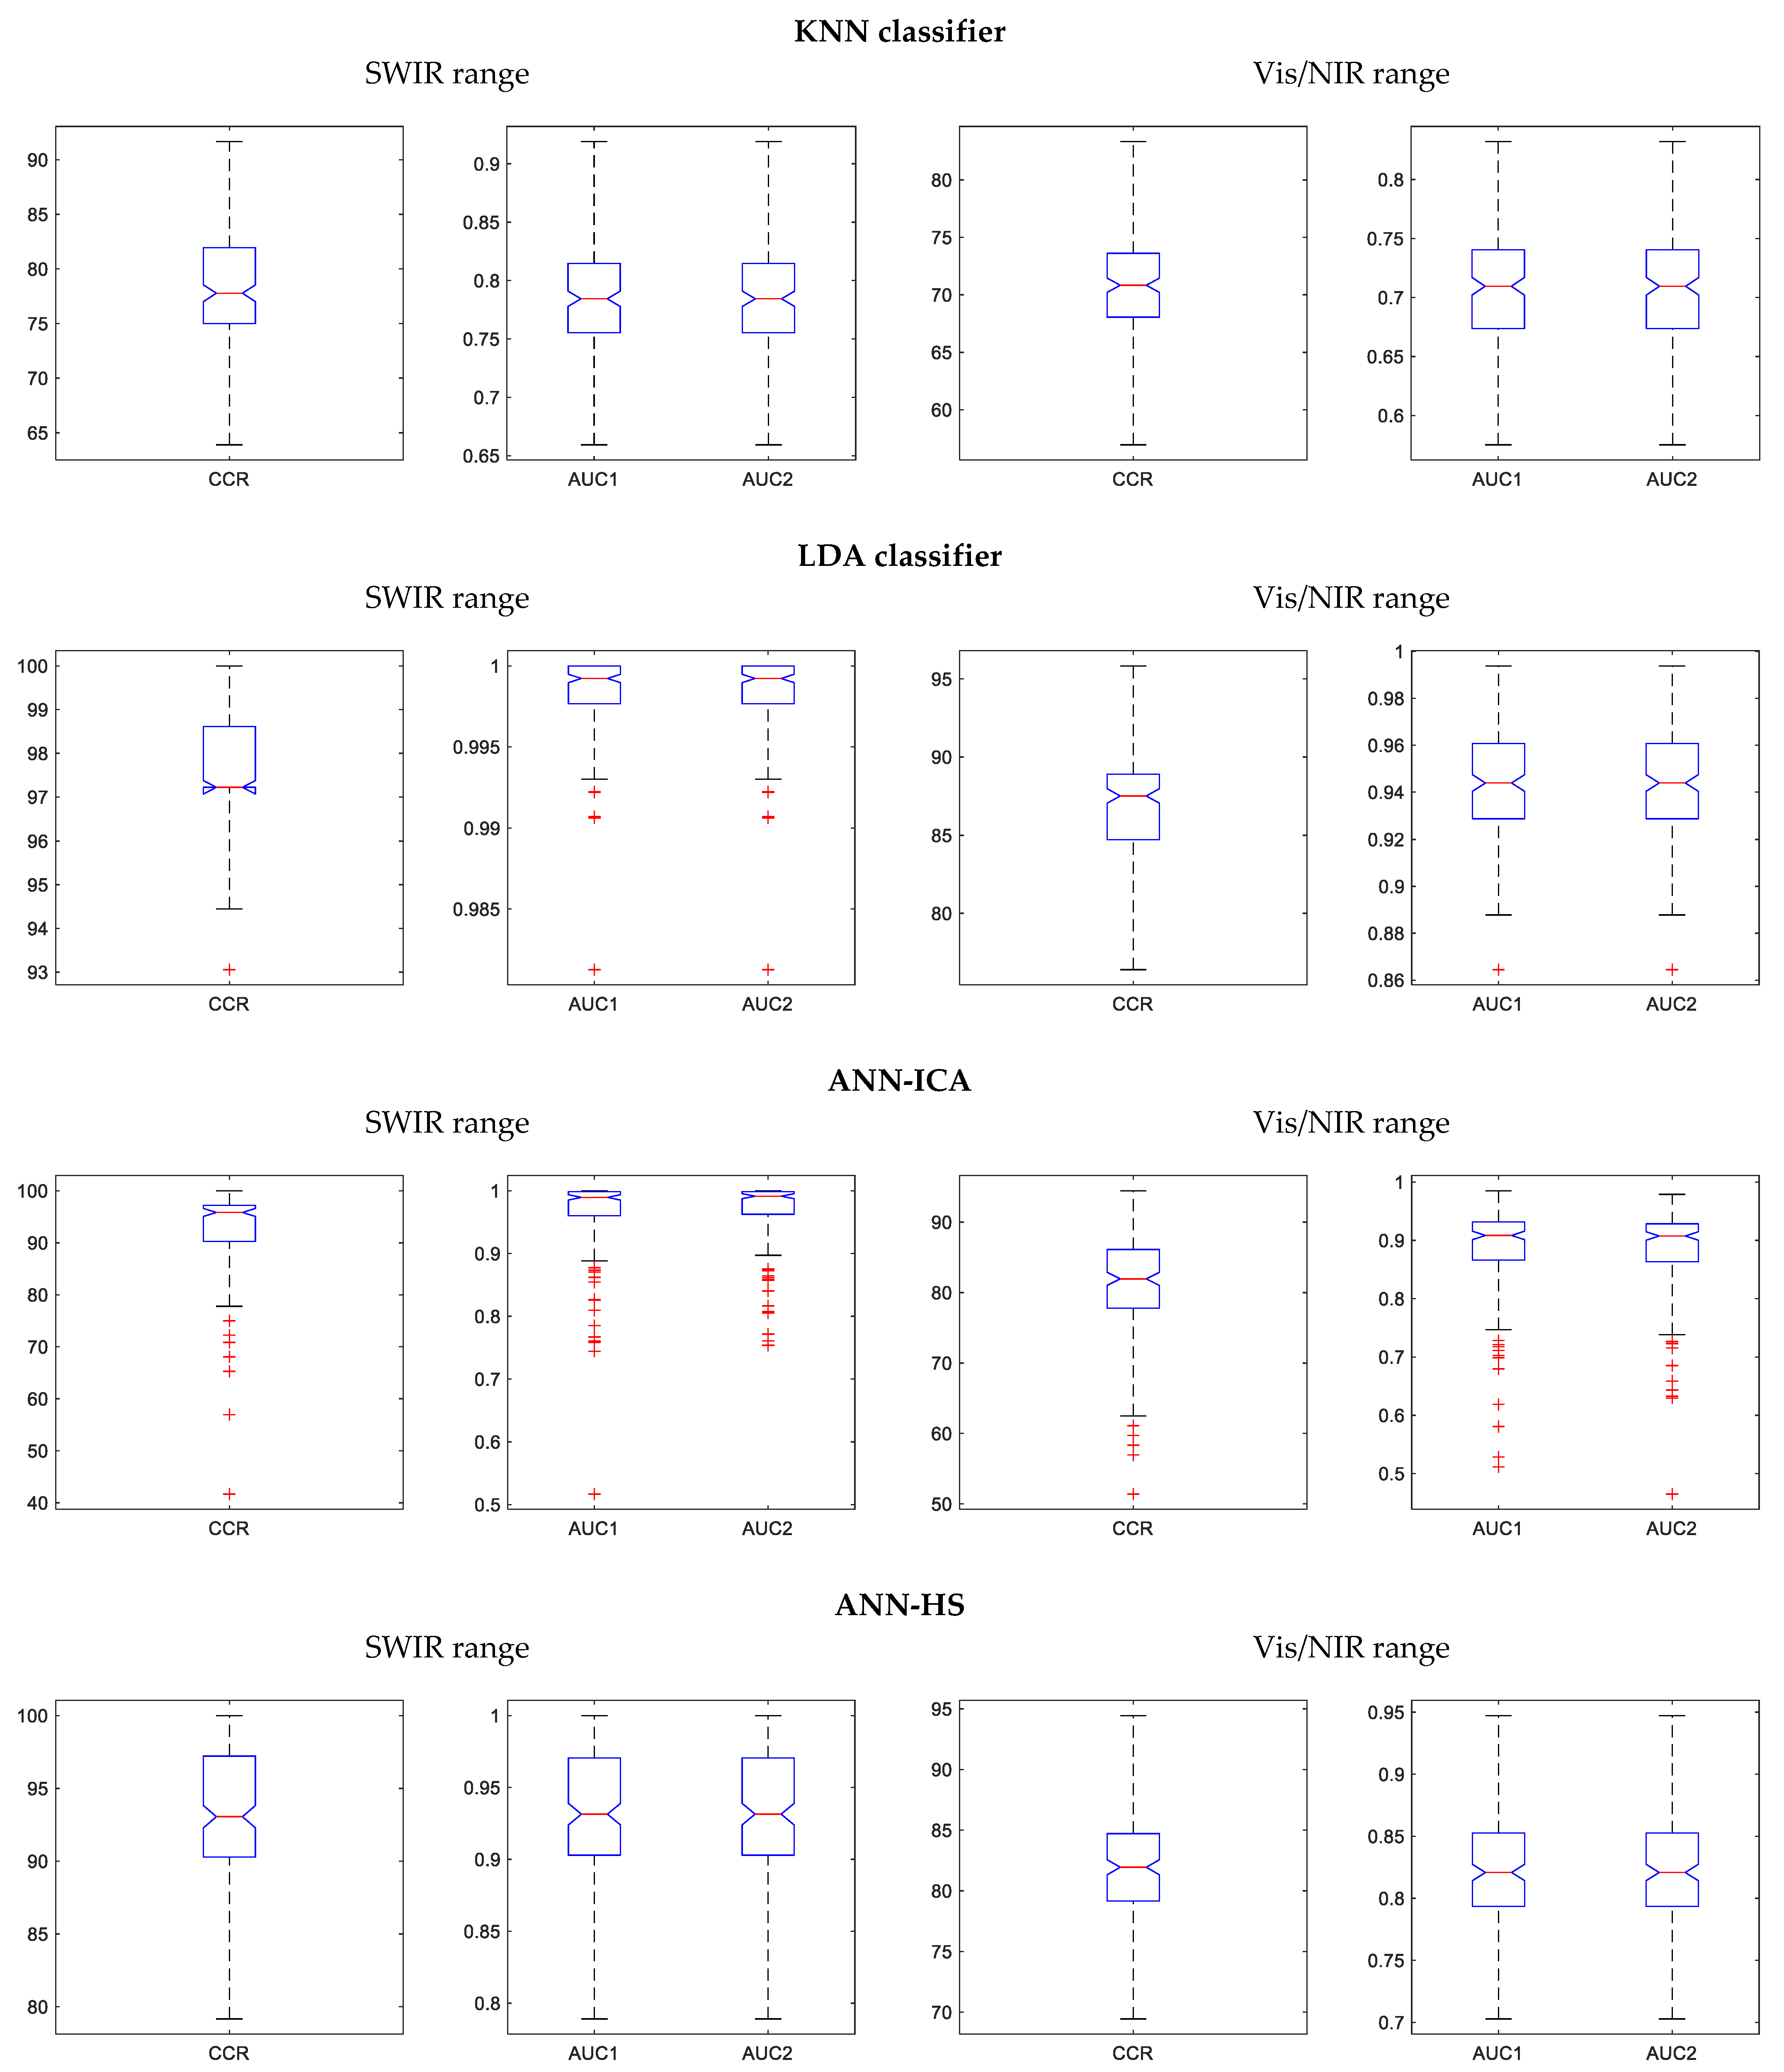
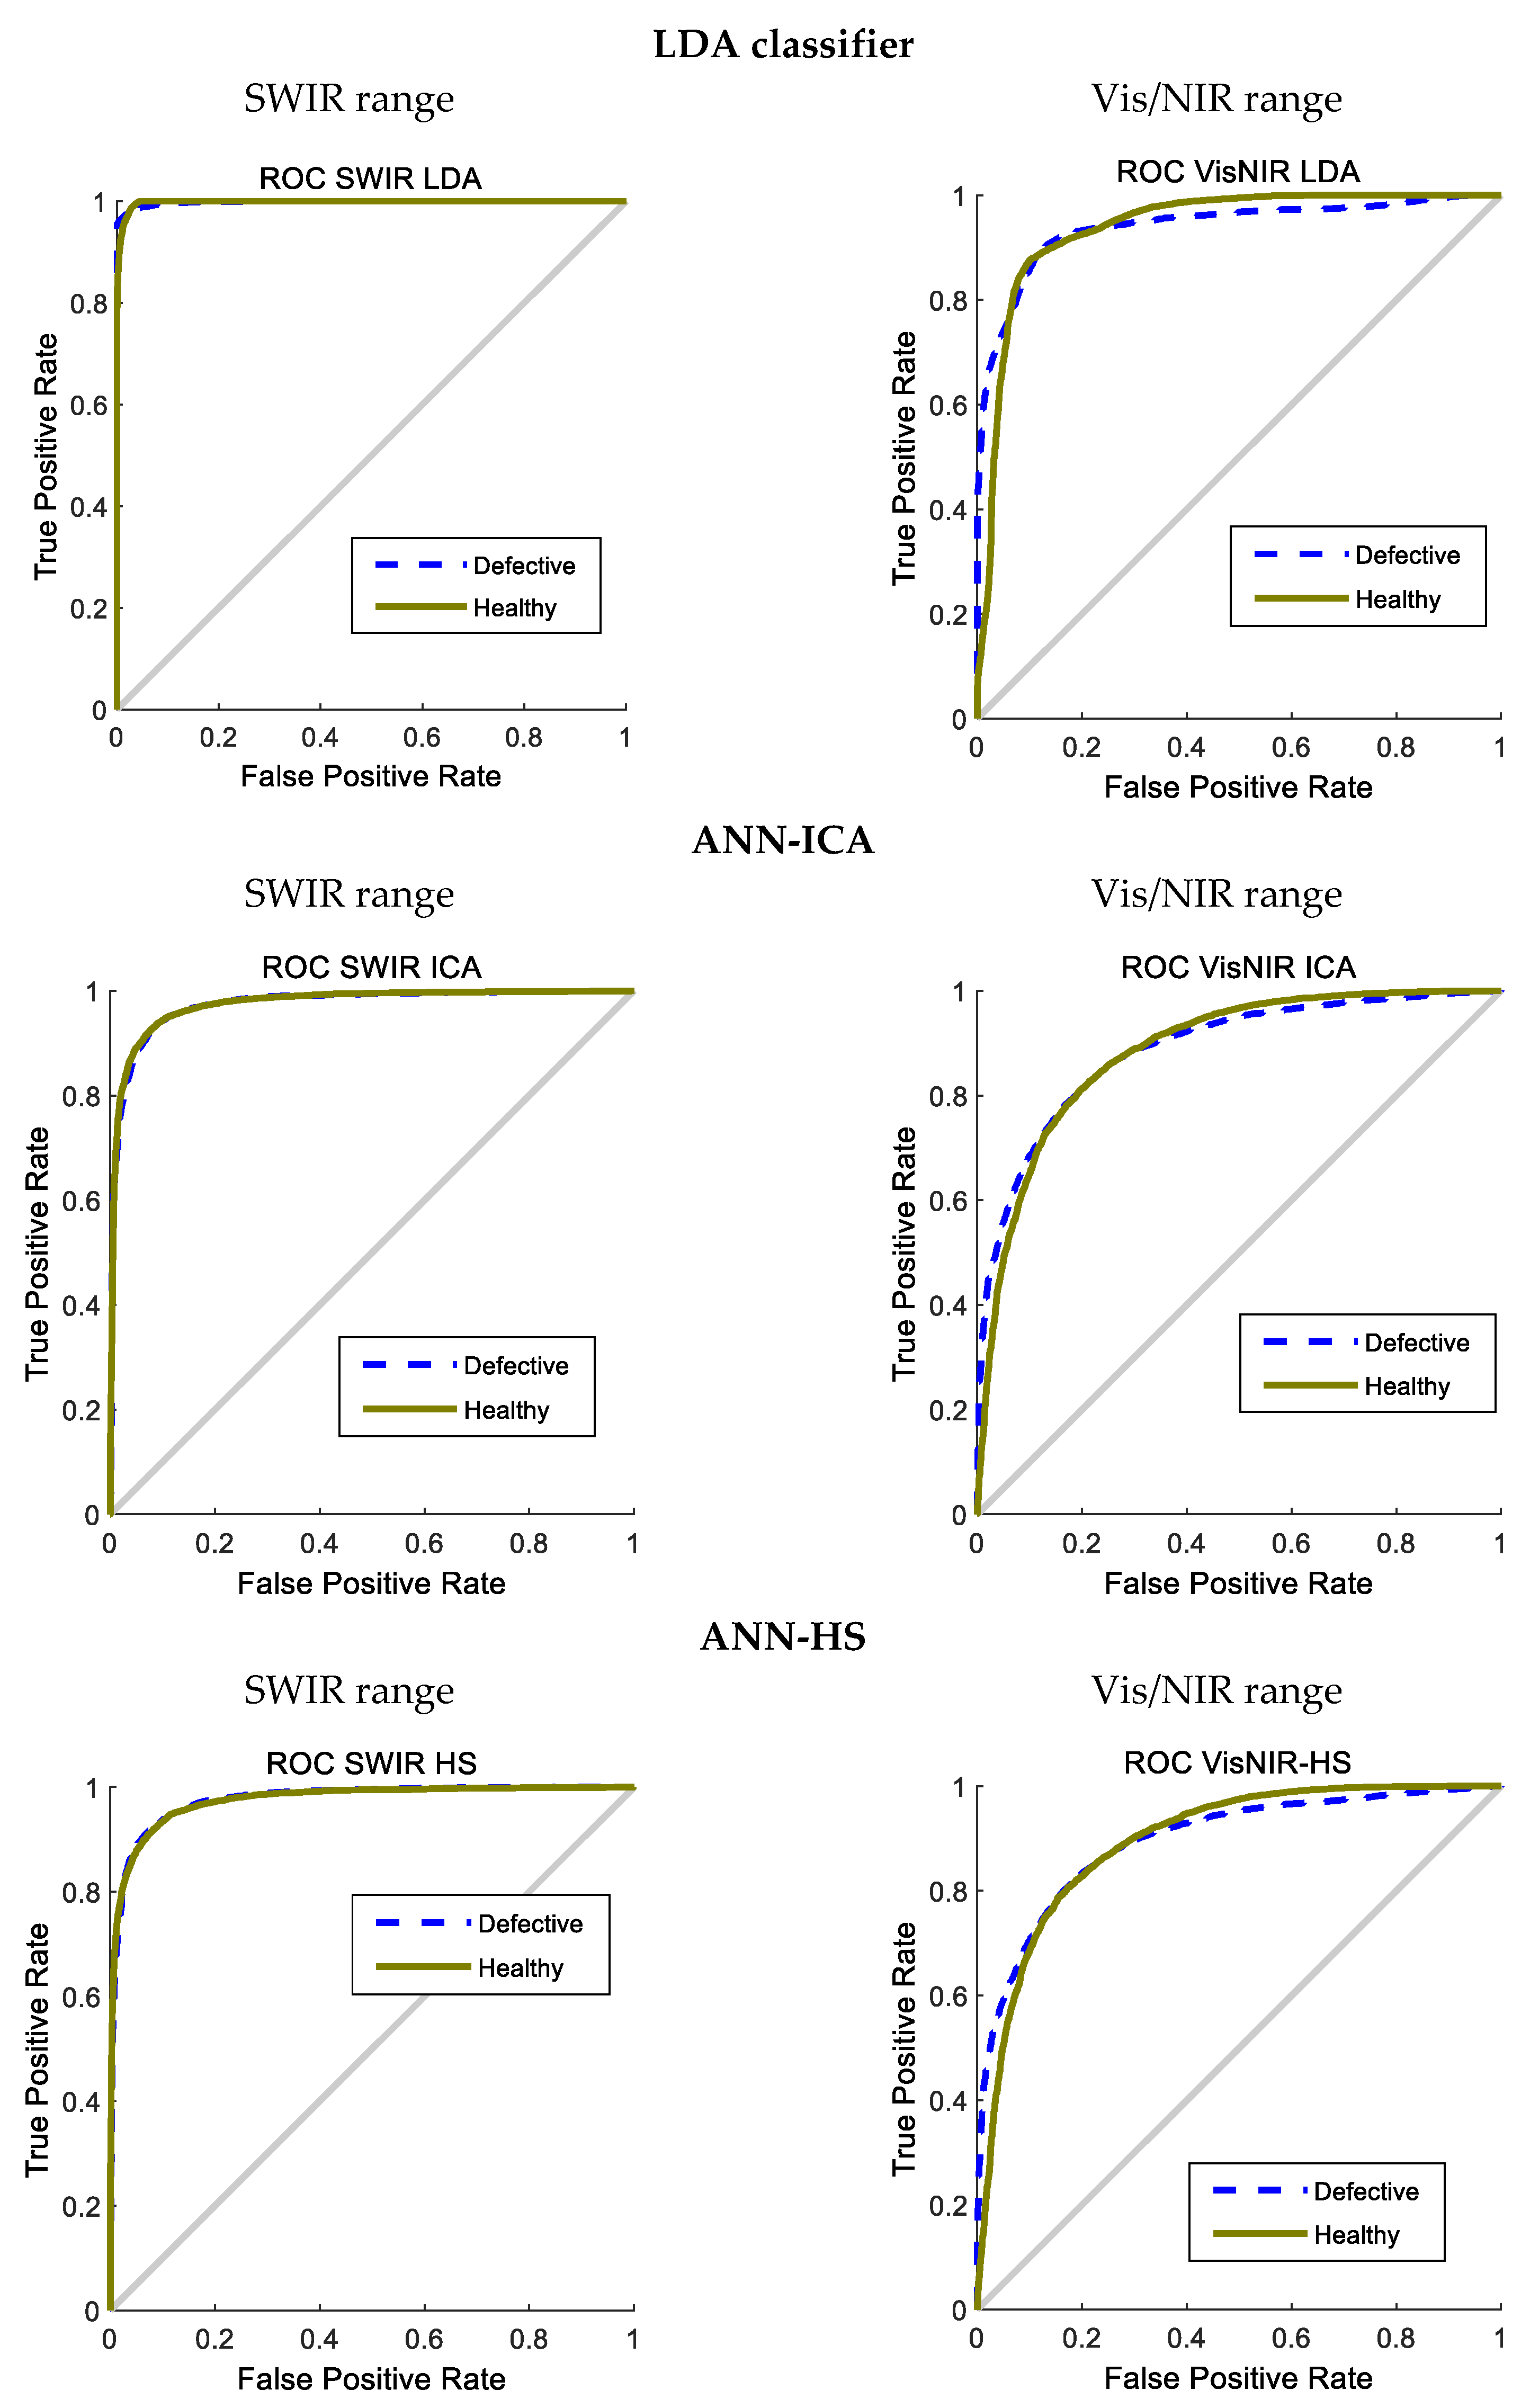
On the other hand, the two hybrid methods based on ANN present very similar results, with accuracies near 93%; the differences are not significant. It is also interesting to observe that SWIR consistently offers better results than Vis/NIR. This insists on the idea that the internal defects are not apparent in the visible range, but more spectral information is required. In fact, the three wavelengths selected in Vis/NIR (861, 883, and 998 nm) correspond to the NIR range. More information on the results of the basic classifiers is presented in
Figure 8 and
Figure 9, containing boxplots and ROC curves after the 200 iterations.
Since the KNN classifier only has a working mode and cannot be configured to be more tolerant or restrictive (unlike the other methods), its ROC curve only has one point. For this reason, the ROC curve of KNN is not included in
Figure 9. Again, the superiority of LDA over the rest of the methods is evident, although it is not able to achieve good results in Vis/NIR.
3.4. Comparison of Either Using the Whole Spectral Range or the Selected Wavelengths
As discussed above, to develop an inexpensive capture device and a high-speed classifier, it is necessary to identify the most effective wavelengths for the problem of study. This would allow the development of simplified spectral cameras that capture only a specific range of the spectrum, and the latter analysis in a portable device. For this reason, it is interesting to analyze the difference between using all the available spectral information or using only the selected wavelengths. So, the ensemble classifier was applied on the same dataset of potatoes using all the spectral information of the samples, with the same constituent methods and partition of the samples in train/test/validation disjoint sets.
The results of the classification using all the wavelengths and the most effective ones are compared in
Table 7.
These results show that, although the detection rate obtained by using all the spectral information is slightly higher, the standard deviation produced is also large. In fact, the difference in the best case (using SWIR) is only about 2%, much lower than the standard deviations of both methods (above 7%). To study the statistical significance of this fact in more detail, a two-tailed t-test method was used to analyze the given differences. The null hypothesis (H
0) is that the mean CCRs obtained using all the spectral data and using only the most effective wavelengths are equal, and the alternative hypothesis (H
a) is that they are different. The results of the test are presented in
Table 8.
The test shows that there is no statistically significant difference between the CCRs obtained for these two datasets. In consequence, the option of using only the three selected wavelengths in SWIR is justified. It has been considered unnecessary to compare the CCRs of SWIR and Vis/NIR, since the differences in this case are clearly larger than the observed standard deviations.
Finally, the obtained results have been compared with other works in the literature that are similar to our study, although all of them use their own datasets. These works are specialized on certain potato diseases. This is the case in the study proposed by Liang et al. [
33], focused on the detection of zebra chip disease in potatoes using spectral information. They analyzed Vis/NIR/IR, observing that the wavelengths in the visible range were the most effective (468, 582, 680, and 720 nm), achieving an accuracy of 97%. This accuracy was similar to our findings using LDA, although in our case the Vis range was not found to be effective. This supports the idea that different diseases could have spectral signatures in different parts of the spectrum. Additional multi-disease experiments in potatoes would be required to validate this hypothesis.
Another closely related work is the method proposed by Zhou et al. [
18], where the detection of blackheart disease in potatoes was studied using spectroscopy and machine learning. They observed that the most effective values were located in the Vis/NIR range, between 678 and 839 nm, selecting six optimal wavelengths. The authors centered their attention on the morphological corrections, for example, with respect to the height of the tubers. The accuracy obtained ranged between 96.53% and 97.11%, which is also very close to the 97.7% in our best method. In any case, as previously stated, the results are not directly comparable since our work is not specific to a single disease and, consequently, the datasets are different. Even so, it is very interesting to observe that all the state-of-the-art methods are able to obtain high accuracies slightly above 97%.
4. Conclusions
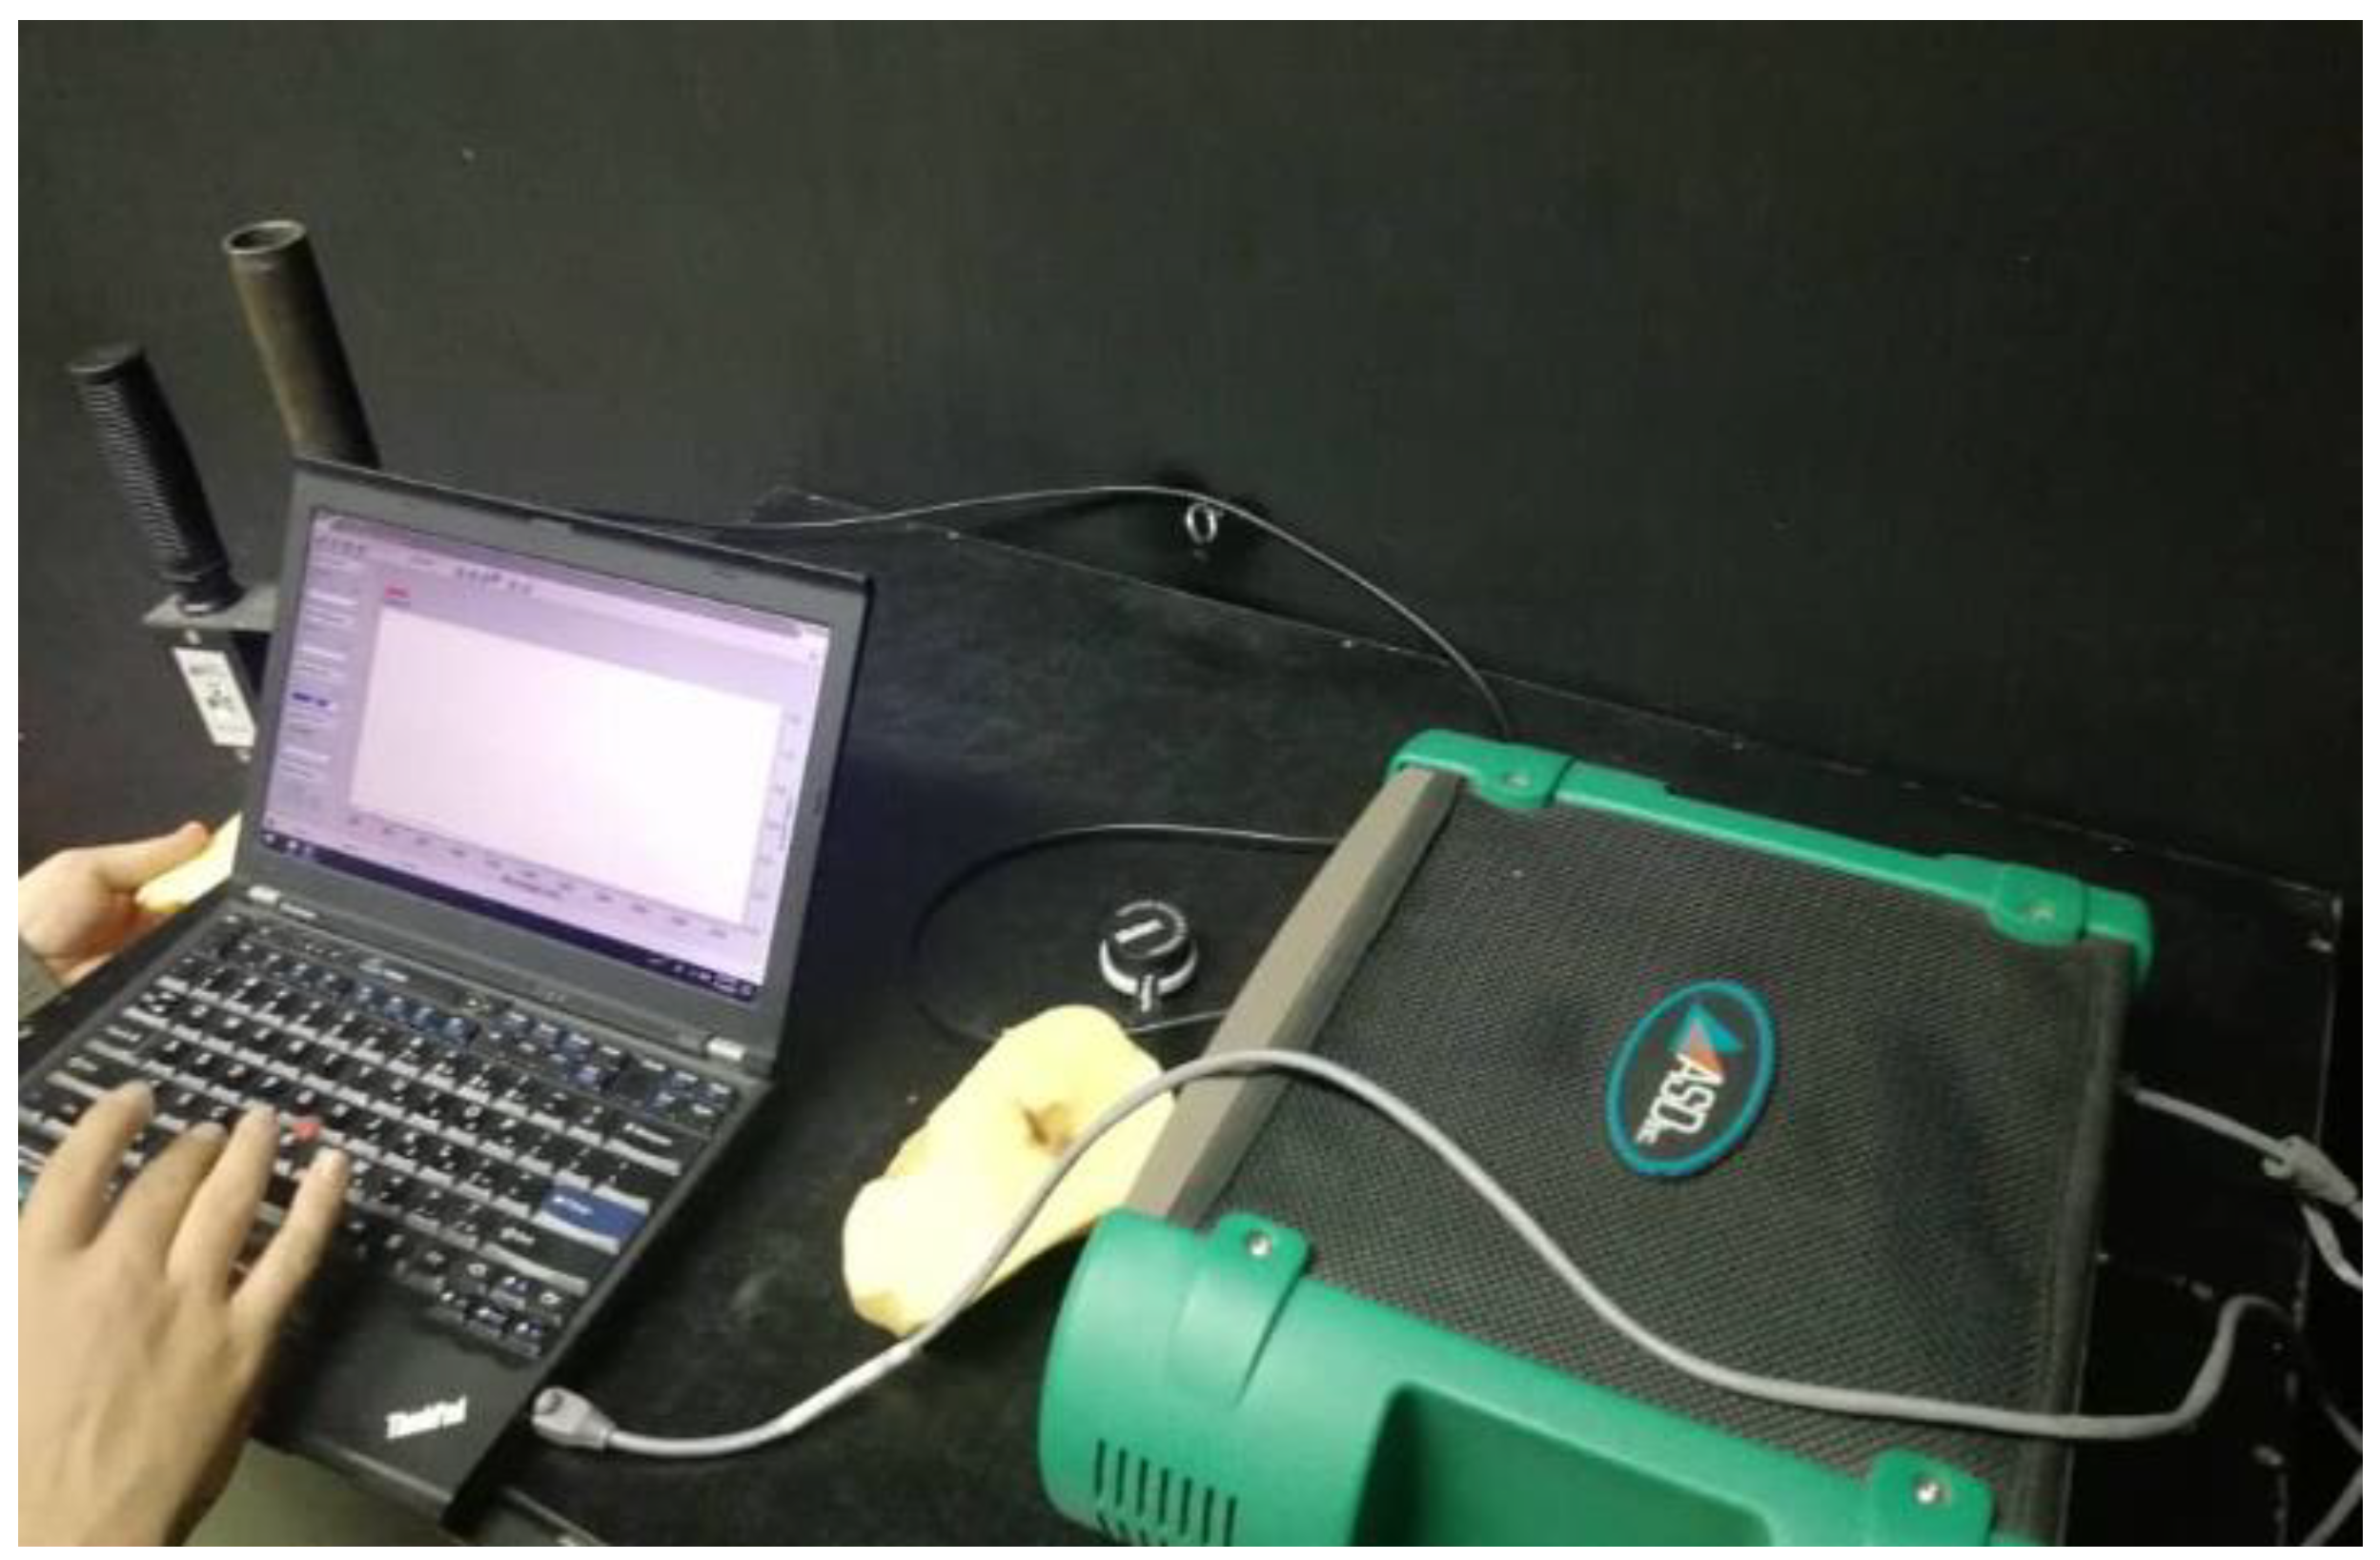
The purpose of this research was to accurately detect potatoes with internal defects, such as brown rot, hollow heart, and black heart, using simple external spectroscopy analysis. The study was conducted at the regions of Vis/NIR (350–1100 nm) and SWIR (1100–2500 nm) of the spectrum. First, the most effective wavelengths were determined for each region using a hybrid ANN-CA approach. Then, an ensemble classifier was proposed using the majority voting rule on four constituent methods: ANN-ICA, ANN-HS, LDA, and KNN. The results of the ensemble classifier showed that the correct classification rate of the samples was 94.1% for the SWIR range, and 83.4% for the Vis/NIR range. SWIR region was found to be the most appropriate for detecting internal potato defects. Interestingly, one of the constituent methods, LDA, was able to achieve the best classification results, with 97.7% accuracy in SWIR. This method would be preferable over the ensemble classifier, due to its precision and simplicity. The effectivity of using only the three best wavelengths was also compared with respect to the use of the whole spectrum. In this case, it was observed that there were not statistically significant differences between both methods, so obviously, the best option would be to use only the selected wavelengths.
These findings will help to develop new capture devices that could be more simplified and practical to use, since only the wavelengths of interest would be captured. With the development of simplified portable devices, the detection technology could be applied either in the field or in factories at their handling processes. In the field, it can be used to perform random sampling of the tubers to carry out an early detection of possible plant diseases. Inside the factory, it can be used in a processing line for quality inspection, where the defective potatoes would be discarded. Both the capture of just three wavelengths and classification times using LDA allows potential real-time processing in practice. Another future line of research is to analyze how the different diseases affect potato spectral signatures at various wavelengths. Further experiments would be needed to classify the defective samples according to the types of diseases observed.


 ,
, 


