
The Use of Sodium Benzoate on Shelf-Life and Quality Attributes of Dried Chili Fish Paste Stored in Different Packaging Containers


Abstract
:1. Introduction
2. Materials and Methods
2.1. Preparation of Dried Chili Fish Paste
2.2. Chemical and Microbiological Characteristics of Dried Chili Fish Paste
2.2.1. Physical and Chemical Analysis
2.2.2. Microbiological Analysis
2.2.3. Sensory Evaluation
2.3. Effect of Different Packaging Materials Incorporation with Sodium Benzoate (SB) on Quality and Shelf Life of Dried Chili Fish Paste during Storage
- (1)
- Polypropylene (PP) container with red screw cap;
- (2)
- Airtight, clear polyethylene-terephthalate (PET) container with aluminum easy-open lid; and
- (3)
- Translucent LLDPE-aluminum Ziplock bag (ZL) (14 × 20 cm).
2.3.1. Physical and Chemical Analysis
- -
- Moisture content, pH, water activity (Aw), and color (as described in Section 2.2.1)
- -
- Browning index (A420)
- -
- Lipid oxidation products
2.3.2. Microbial Analysis
2.3.3. Sensory Evaluation
2.4. Statistical Analysis
3. Results and Discussion
3.1. Chemical Composition, Physical Properties, Microbial Population, and Sensory Evaluation of Dried Chili Fish Paste
3.1.1. Physical and Chemical Characteristics
3.1.2. Microbial Population
3.1.3. Sensory Evaluation
3.2. Effect of Different Packaging Materials’ Incorporation with Sodium Benzoate (SB) on Quality and Shelf Life of Dried Chili Fish Paste during Storage
3.2.1. Changes in Physical and Chemical Characteristics
Changes in Moisture Content, Aw, pH, and Color
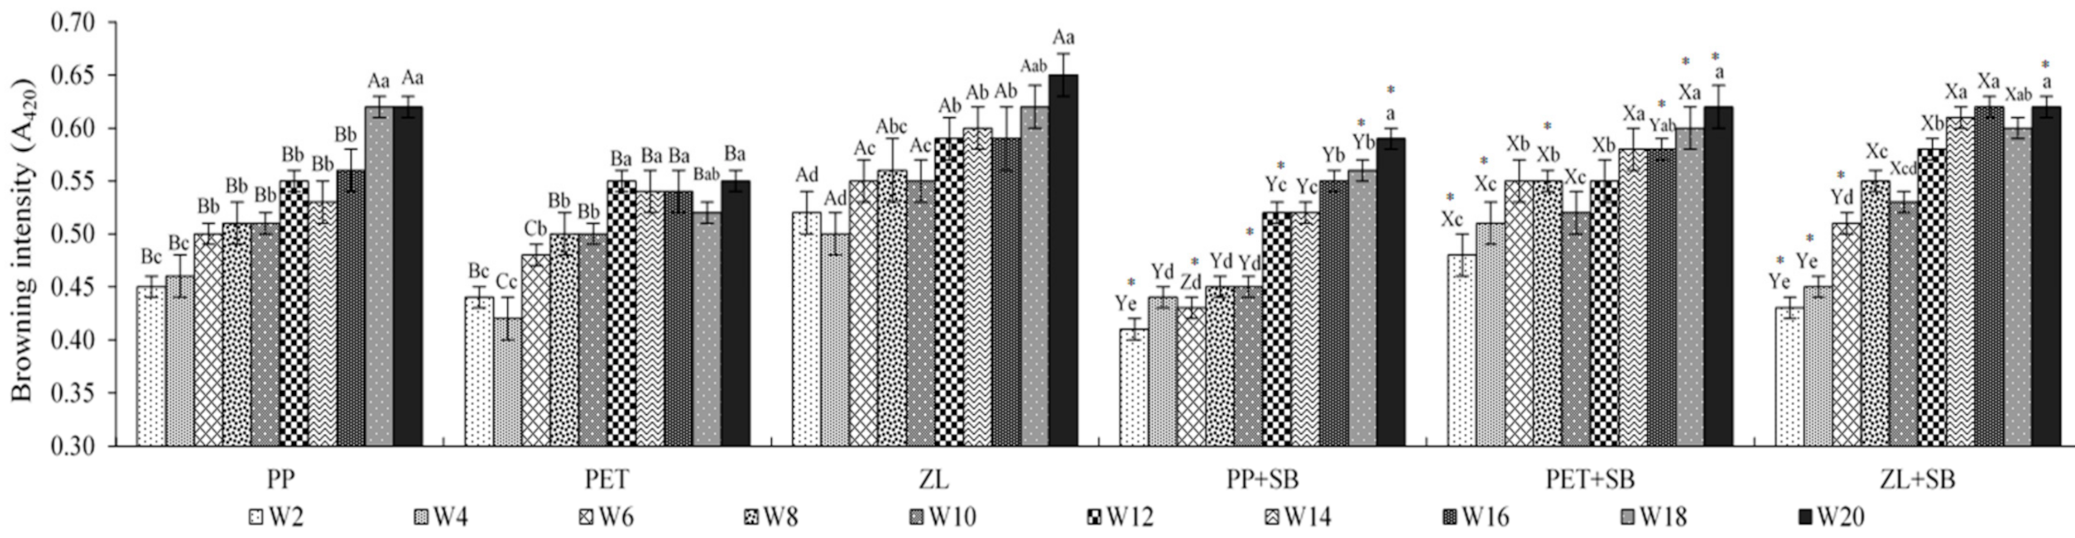
Changes in Browning Index (A420)
Changes in Lipid Oxidation Products
3.2.2. Changes in Microbial Population
3.2.3. Sensory Evaluation
3.2.4. Inorganic Contaminants/Aflatoxin and Pathogens of Dried Chili Fish Paste at the 20th Week of Room-Temperature Storage (25 °C)
4. Conclusions
Author Contributions
Funding
Conflicts of Interest
References
- Chaveesuk, R.; Jitareetep, C. Chili Paste Culture in Bangkok Metropolis. In Proceedings of the 3rd International Conference on Agro-Industry 2016: Competitive & Sustainable Agro-Industry: Value Creation in Agribusiness (ICoA Conference Proceedings), Bangkok, Thailand, 9–11 November 2016. [Google Scholar]
- Rotsatchakul, P.; Chaiseri, S.; Cadwallader, K.R. Identification of Characteristic Aroma Components of Thai Fried Chili Paste. J. Agric. Food Chem. 2008, 56, 528–536. [Google Scholar] [CrossRef] [PubMed]
- Kedar, J.G.; Pagarkar, A.U.; Shingare, P.E.; Bhosale, B.P.; Shinde, K.M.; Kulkarni, G.N. Effect of sodium benzoate on the shelf life of vacuum packed Catla fish steaks stored at chilled temperature. Biosci. Biotechnol. Res. Commun. 2016, 9, 421–427. [Google Scholar]
- CFR. Food and Drugs. In Code of Federal Regulations; Special Edition of the Federal Register; Office of the Federal Register National Archives and Records Administration: Washington, DC, USA; pp. 564–565.
- Sara, P.L.; Takehiko, K.; Norio, I.; Haruo, S. Sardine immersed storage at 150 °C in brine containing sodium benzoate. In Bulletin–Faculty of Fisheries; Hokkaido University: Hokkaido, Japan, 1994; Volume 45, pp. 19–25. [Google Scholar]
- Omojowo, F.S.; Omojasola, P.F.; Idris, G.L.; Ihuahi, J.A. Evaluation of citric acid and potassium sorbate as preservatives on the safety and shelf-life of smoked catfish. Nat. Sci. J. 2009, 7, 1–8. [Google Scholar]
- AOAC International. Official Methods of Analysis of AOAC International, 17th ed.; Association of Official Analytical Chemists: Gaithersburg, MD, USA, 2002. [Google Scholar]
- Pongsetkul, J.; Benjakul, S.; Vongkamjan, K.; Sumpavapol, P.; Osako, K.; Faithong, N. Changes in volatile compounds, ATP-related compounds and antioxidative properties of Kapi, produced from Acetes vulgaris, during processing and fermentation. Food Biosci. 2017, 19, 49–56. [Google Scholar] [CrossRef]
- Morgano, M.A.; Rabonato, L.C.; Milani, R.F.; Miyagusku, L.; Balian, S.C. Assessment of trace elements in fishes of Japanese foods marketed in São Paulo (Brazil). Food Control. 2011, 22, 778–785. [Google Scholar] [CrossRef]
- Erkmen, E.S. The aflatoxin contamination of ground red pepper and pistachio nuts sold in Turkey. Food Chem. Toxicol. 2010, 48, 2532–2537. [Google Scholar]
- BAM. Aerobic plate count. In Bacteriological Analytical Manual; Bryce, J., Ed.; Food and Drug Administration, Econ Publishing: New York, NY, USA, 2001; pp. 53–67. [Google Scholar]
- TCPS. Thai Community Product Standard No. TCPS 130/2013; Thai Industrial Standards Institute: Bangkok, Thailand, 2013. [Google Scholar]
- Mellgard, M.C.; Civille, G.V.; Carr, B.T. Principle of standard sensory evolution. In Sensory Evaluation Techniques, 4th ed; Morten, M.C., Ed.; CRC Press: New York, NY, USA, 2007; pp. 82–88. [Google Scholar]
- Takeungwongtrakul, S.; Benjakul, S. Oxidative stability of shrimp oil-in-water emulsions as affected by antioxidant incorporation. Int. Aquat. Res. 2013, 5, 14. [Google Scholar] [CrossRef] [Green Version]
- Steel, R.G.D.; Torrie, J.H.; Dickey, D.A. Principle and Procedure of Statistics; Steel, R.G.D., Ed.; McGraw-Hill: New York, NY, USA, 1980; pp. 457–490. [Google Scholar]
- Thanonkaew, A.; Chantachote, T.; Tangwatcharin, P.; Ranungrat, W.; Auksornnieum, A. Effect of drying and fermentation on changes of catfish lipid. In Proceedings of the 99th AOCS Annual Meeting and Expo, Seattle, WA, USA, 18–21 May 2008. [Google Scholar]
- Goulas, A.E.; Kontominas, M.G. Effect of salting and smoking-method on the keeping quality of chub mackerel (Scomber japonicus): Biochemical and sensory attributes. Food Chem. 2005, 93, 511–520. [Google Scholar] [CrossRef]
- Rahman, M.S.; Labuza, T.P. Water activity and Food Preservation. In Handbook of Food Preservation; Rahman, M.S., Ed.; Marcel Dekker, Inc.: New York, NY, USA, 1999; pp. 339–398. [Google Scholar]
- Bassey, F.; Chinnan, M.; Ebenso, E.E.; Edem, C.; Iwegbue, C. Colour Change: An Indicator of the Extent of Maillard Browning Reaction in Food System. Asian J. Chem. 2013, 25, 9325–9328. [Google Scholar] [CrossRef]
- Freire, F.D.C.O.; Kozakiewicz, Z.; Paterson, R.R.M. Mycoflora and mycotoxins in Brazilian black pepper, white pepper and Brazil nuts. Mycopathology 2000, 149, 13–19. [Google Scholar] [CrossRef] [PubMed]
- Felland, S.; Koehler, P. Sensory, Chemical, and Physical Changes in Increased Water Activity Peanut Butter Products. J. Food Qual. 1997, 20, 145–156. [Google Scholar] [CrossRef]
- Keller, P.E.; Kouzes, R. Water Vapor Permeation in Plastics; Pacific Northwest National Laboratory: Richland, WA, USA, 2017; pp. 1–29. [Google Scholar]
- Chuon, M.R.; Shiomoto, M.; Koyanagi, T.; Sasaki, T.; Michihata, T.; Chan, S.; Mao, S.; Enomoto, T. Microbial and chemical properties of Cambodian traditional fermented fish products. J. Sci. Food Agric. 2013, 94, 1124–1131. [Google Scholar] [CrossRef] [PubMed]
- Pomsa, P.; Sukprasert, B.; Fuangpaiboon, N.; Pongsetkul, J.; Takeungwongtrakul, S. Development of roasted chili paste mixed with mung bean hull. Burapha Sci. J. 2020, 25, 1094–1104. [Google Scholar]
- Ajandouz, E.; Tchiakpe, L.; Ore, F.D.; Benajiba, A.; Puigserver, A. Effects of pH on Caramelization and Maillard Reaction Kinetics in Fructose-Lysine Model Systems. J. Food Sci. 2001, 66, 926–931. [Google Scholar] [CrossRef]
- Muego-Gnanasekharan, K.F.; Resurreccion, A.V.A. Physicochemical and Sensory Characteristics of Peanut Paste Stored at Different Temperatures. J. Food Sci. 1992, 57, 1385–1389. [Google Scholar] [CrossRef]
- Guerra-Hernandez, E.; Leon, C.; Corzo, N.; Garcia-Villanova, B.; Romera, J.M. Chemical changes in powdered infant formulas during storage. Int. J. Dairy Technol. 2002, 55, 171–176. [Google Scholar] [CrossRef]
- Debnath, S.; Rastogi, N.; Krishna, A.G.; Lokesh, B. Effect of frying cycles on physical, chemical and heat transfer quality of rice bran oil during deep-fat frying of poori: An Indian traditional fried food. Food Bioprod. Process. 2012, 90, 249–256. [Google Scholar] [CrossRef]
- Gonzalez, J. The color of meat and poultry. In USDA Food Safety and Inspection Service (FSIS); (USFDA Website); 2014. Available online: http://www.fsis.usda.gov/wps/portal/fsis/topics/food-safety-education/get-answers/food-safety-fact-sheets/meat-preparation/the-color-of-meat-and-poultry/the-color-of-meat-and-poultry/CT_Index (accessed on 27 May 2021).


| Parameters | Values | Parameters | Values |
|---|---|---|---|
| Physical/Chemical composition | Aflatoxin | ||
| Moisture (%) | 17.45 ± 0.24 | Aflatoxin B1 (μg/kg) | ND |
| Protein (%) | 37.63 ± 2.21 | Aflatoxin B2 (μg/kg) | ND |
| Fat (%) | 11.12 ± 2.32 | Aflatoxin G1 (μg/kg) | ND |
| Ash (%) | 15.61 ± 0.86 | Aflatoxin G2 (μg/kg) | ND |
| Carbohydrate (%) | 18.19 ± 1.84 | Microbial population * | |
| Salt (%) | 3.02 ± 0.19 | Total viable count (TVC) | 4.58 × 10² |
| pH | 5.72 ± 0.17 | Yeast and Mold count | <10 |
| Water activity (Aw) | 0.72 ± 0.06 | Salmonella spp. | ND |
| Color | S. aureus | ND | |
| L* | 27.55 ± 0.64 | B. cereus | <10 |
| a* | 14.49 ± 0.37 | C. perfrigens | <10 |
| b* | 26.50 ± 0.57 | E. coli | <10 |
| Inorganic contaminants | Sensory evaluation ** | ||
| Pb (mg/kg) | ND | Appearance | 7.69 ± 0.28 |
| As (mg/kg) | ND | Color | 7.01 ± 0.32 |
| Cd (mg/kg) | <0.60 | Flavor | 8.23 ± 0.29 |
| Hg (mg/kg) | 0.27 ± 0.29 | Texture | 7.88 ± 0.41 |
| Overall | 8.01 ± 0.24 |
| Week | PP | PET | ZL | PP+SB | PET+SB | ZL + SB |
|---|---|---|---|---|---|---|
| 2 | 18.68 ± 0.26 Ac | 18.34 ± 0.39 Ad | 18.15 ± 0.14 Be | 17.46 ± 0.11 Ye* | 17.75 ± 0.12 Yd* | 18.55 ± 0.12 Xd* |
| 4 | 18.72 ± 0.40 Ac | 19.04 ± 0.32 Ac | 18.16 ± 0.09 Be | 17.88 ± 0.10 Yd* | 17.88 ± 0.33 Yd* | 19.02 ± 0.10 Xc* |
| 6 | 18.77 ± 0.09 Bc | 19.60 ± 0.18 Ac | 18.77 ± 0.32 Bd | 17.93 ± 0.26 Yd* | 18.14 ± 0.09 Yc* | 18.92 ± 0.24 Xc |
| 8 | 18.69 ± 0.11 Bc | 19.79 ± 0.15 Ac | 18.92 ± 0.29 Bd | 18.35 ± 0.33 Yc* | 18.10 ± 0.10 Yc* | 19.06 ± 0.12 Xc |
| 10 | 19.24 ± 0.23 Bb | 19.65 ± 0.22 Ac | 18.78 ± 0.21 Cd | 18.22 ± 0.21 Yc* | 18.22 ± 0.14 Yc* | 19.44 ± 0.17 Xb* |
| 12 | 19.30 ± 0.25 Bb | 20.03 ± 0.30 Ab | 19.15 ± 0.17 Bc | 18.32 ± 0.09 Zc* | 18.76 ± 0.12 Yb* | 19.35 ± 0.09 Xb |
| 14 | 20.09 ± 0.14 Aa | 20.11 ± 0.23 Ab | 19.23 ± 0.07 Bc | 18.99 ± 0.14 Yb* | 18.67 ± 0.28 Yb* | 19.62 ± 0.06 Xab* |
| 16 | 20.14 ± 0.30 Aa | 20.15 ± 0.09 Ab | 19.42 ± 0.09 Bb | 19.07 ± 0.14 Yb* | 18.69 ± 0.30 Zb* | 19.55 ± 0.15 Xb |
| 18 | 20.02 ± 0.15 Ba | 20.54 ± 0.16 Aa | 19.68 ± 0.17 Cb | 19.69 ± 0.29 Xa* | 19.12 ± 0.24 Ya* | 19.56 ± 0.28 Xb |
| 20 | 20.01 ± 0.11 Ba | 20.65 ± 0.22 Aa | 20.02 ± 0.23 Ba | 19.78 ± 0.10 Xa* | 19.25 ± 0.16 Ya* | 19.87 ± 0.15 Xa* |
| Week | PP | PET | ZL | PP+SB | PET+SB | ZL+SB |
|---|---|---|---|---|---|---|
| L* | ||||||
| 2 | 26.02 ± 0.27 Ba | 28.42 ± 0.18 Aa | 25.92 ± 0.30 Ba | 26.42 ± 0.44 Ya | 27.86 ± 0.41 Xa | 27.23 ± 0.22 Xa* |
| 4 | 24.34 ± 0.65 Bb | 27.97 ± 0.44 Aab | 25.88 ± 0.22 Ba | 25.47 ± 0.18 Yb* | 28.01 ± 0.34 Xa | 27.65 ± 0.51 Xa* |
| 6 | 24.88 ± 0.06 Bb | 26.63 ± 0.29 Ab | 26.06 ± 0.69 Aa | 25.39 ± 0.23 Yb* | 26.96 ± 0.30 Xb | 25.31 ± 0.25 Yb* |
| 8 | 23.91 ± 0.51 Bb | 26.61 ± 0.20 Ab | 24.21 ± 0.15 Bb | 25.26 ± 0.51 Zb* | 26.88 ± 0.40 Xb | 25.98 ± 0.09 Yb* |
| 10 | 22.06 ± 0.33 Cc | 25.52 ± 0.16 Ac | 24.67 ± 0.20 Bb | 25.64 ± 0.26 Yb* | 26.01 ± 0.27 Xc* | 25.66 ± 0.36 Yb* |
| 12 | 22.48 ± 0.20 Cc | 25.66 ± 0.32 Ac | 24.35 ± 0.19 Bb | 24.05 ± 0.29 Yc* | 26.41 ± 0.32 Xbc* | 24.86 ± 0.22 Yc* |
| 14 | 22.15 ± 0.19 Cc | 26.02 ± 0.33 Abc | 23.92 ± 0.41 Bc | 24.12 ± 0.42 Zc* | 25.89 ± 0.29 Xd* | 24.92 ± 0.23 Yc* |
| 16 | 20.66 ± 0.11 Bd | 24.97 ± 0.42 Ad | 24.01 ± 0.33 Abc | 23.99 ± 0.42 Yc* | 26.21 ± 0.55 Xbc* | 23.05 ± 0.60 Yd* |
| 18 | 19.59 ± 0.25 Ce | 24.00 ± 0.19 Ae | 23.25 ± 0.30 Bc | 23.65 ± 0.33 Yc* | 25.13 ± 0.42 Xe* | 23.21 ± 0.13 Yd |
| 20 | 19.63 ± 0.42 Ce | 24.08 ± 0.33 Ae | 22.96 ± 0.25 Bd | 23.81 ± 0.49 Yc* | 25.22 ± 0.31 Xe* | 23.26 ± 0.44 Yd* |
| a* | ||||||
| 2 | 14.61 ± 0.32 Ba | 14.20 ± 0.41 Ba | 16.02 ± 0.23 Aa | 15.33 ± 0.23 Xa* | 15.24 ± 0.26 Xa* | 14.79 ± 0.32 Ya* |
| 4 | 14.28 ± 0.11 Bb | 13.60 ± 0.16 Cab | 15.31 ± 0.16 Ab | 15.20 ± 0.33 Xa* | 15.20 ± 0.24 Xa* | 14.65 ± 0.22 Ya* |
| 6 | 14.99 ± 0.26 Ba | 13.23 ± 0.21 Cb | 15.88 ± 0.45 Aa | 14.27 ± 0.18 Ybc* | 15.03 ± 0.30 Xa* | 14.39 ± 0.11 Yb* |
| 8 | 13.02 ± 0.12 Cd | 14.39 ± 0.41 Ba | 15.92 ± 0.22 Aa | 14.55 ± 0.29 Yb* | 15.11 ± 0.23 Xa* | 14.27 ± 0.08 Yb* |
| 10 | 13.25 ± 0.49 Cd | 14.09 ± 0.30 Ba | 15.43 ± 0.22 Ab | 14.49 ± 0.25 Yb* | 14.99 ± 0.20 Xa* | 14.20 ± 0.35 Yb* |
| 12 | 13.98 ± 0.25 Bb | 14.11 ± 0.22 Ba | 15.44 ± 0.16 Ab | 14.02 ± 0.22 Zc | 14.25 ± 0.15 Yb | 14.89 ± 0.18 Xa* |
| 14 | 13.92 ± 0.22 Bb | 14.54 ± 0.20 Aa | 14.97 ± 0.20 Ac | 14.11 ± 0.14 Yc | 14.22 ± 0.22 Yb* | 14.76 ± 0.19 Xa* |
| 16 | 14.01 ± 0.19 Bb | 13.18 ± 0.33 Cb | 15.16 ± 0.33 Abc | 13.99 ± 0.33 Zc | 14.53 ± 0.14 Yab* | 14.72 ± 0.14 Xa* |
| 18 | 13.68 ± 0.20 Bc | 14.15 ± 0.34 Ba | 15.22 ± 0.52 Abc | 13.97 ± 0.07 Yc* | 14.66 ± 0.31 Xab* | 14.88 ± 0.22 Xa* |
| 20 | 14.88 ± 0.44 Ba | 13.88 ± 0.25 Cab | 15.28 ± 0.15 Abc | 14.25 ± 0.32 Ybc* | 15.05 ± 0.21 Xa* | 14.49 ± 0.39 Yab* |
| b* | ||||||
| 2 | 26.22 ± 0.10 e | 26.31 ± 0.20 d | 26.07 ± 0.22 c | 26.15 ± 0.14 Xd | 26.00 ± 0.25 Xd* | 25.43 ± 0.20 Ye* |
| 4 | 26.25 ± 0.20 Ae | 26.55 ± 0.18 Ad | 25.90 ± 0.18 Bc | 26.40 ± 0.22 Xcd | 25.95 ± 0.22 Yd* | 26.22 ± 0.19 Xcd* |
| 6 | 26.07 ± 0.18 Be | 26.70 ± 0.16 Ad | 26.55 ± 0.19 Ab | 26.22 ± 0.07 Xd | 26.04 ± 0.32 Yd* | 26.09 ± 0.13 Yd* |
| 8 | 26.90 ± 0.33 Bd | 28.24 ± 0.09 Ac | 26.56 ± 0.24 Bb | 26.42 ± 0.13 Ycd* | 27.55 ± 0.40 Xbc* | 26.65 ± 0.16 Yc |
| 10 | 26.82 ± 0.24 Bd | 28.09 ± 0.22 Ac | 26.49 ± 0.22 Bb | 26.20 ± 0.15 Zd* | 27.30 ± 0.09 Xc* | 26.61 ± 0.24 Yc |
| 12 | 27.14 ± 0.36 Bc | 28.99 ± 0.20 Ab | 27.22 ± 0.15 Ba | 26.88 ± 0.20 Ybc* | 28.01 ± 0.17 Xb* | 27.88 ± 0.32 Xab* |
| 14 | 27.34 ± 0.18 Bc | 29.11 ± 0.30 Ab | 27.03 ± 0.16 Ba | 26.75 ± 0.31 Ybc* | 27.97 ± 0.29 Xb* | 27.81 ± 0.22 Xab* |
| 16 | 27.99 ± 0.29 Bb | 29.40 ± 0.33 Aa | 27.00 ± 0.21 Ba | 27.04 ± 0.44 Zb* | 28.04 ± 0.26 Xb* | 27.59 ± 0.09 Yb* |
| 18 | 30.15 ± 0.45 Aa | 29.41 ± 0.24 Ba | 27.20 ± 0.39 Ca | 27.04 ± 0.29 Zb* | 28.65 ± 0.12 Xa* | 28.02 ± 0.31 Ya* |
| 20 | 30.77 ± 0.29 Aa | 29.28 ± 0.17 Ba | 27.15 ± 0.26 Ca | 28.11 ± 0.13 Ya* | 28.70 ± 0.09 Xa* | 27.89 ± 0.20 Zab* |
| Week | Total Viable Count (TVC) * | |||||
|---|---|---|---|---|---|---|
| PP | PET | ZL | PP+SB | PET+SB | ZL+SB | |
| 2 | 2.08 × 10³ | 9.25 × 10² | 7.11 × 10² | 2.87 × 10² | 3.12 × 10² | 7.02 × 10² |
| 4 | 5.22 × 10³ | 2.09 × 10³ | 9.97 × 10² | 3.03 × 10² | 5.69 × 10² | 9.01 × 10² |
| 6 | 1.05 × 10⁴ | 8.34 × 10³ | 5.42 × 10³ | 6.09 × 10² | 9.09 × 10² | 9.59 × 10² |
| 8 | 5.23 × 10⁴ | 7.99 × 10³ | 9.34 × 10³ | 6.55 × 10² | 9.26 × 10² | 1.22 × 10³ |
| 10 | - | 2.98 × 10⁴ | 1.22 × 10⁴ | 9.02 × 10² | 1.08 × 10³ | 1.18 × 10³ |
| 12 | - | - | - | 1.11 × 10³ | 1.25 × 10³ | 3.35 × 10³ |
| 14 | - | - | - | 2.63 × 10³ | 5.18 × 10³ | 7.44 × 10³ |
| 16 | - | - | - | 6.06 × 10³ | 5.99 × 10³ | 7.29 × 10³ |
| 18 | - | - | - | 6.03 × 10³ | 8.01 × 10³ | 8.67 × 10³ |
| 20 | - | - | - | 6.41 × 10³ | 8.29 × 10³ | 8.60 × 10³ |
| Yeast and Mold count * | ||||||
| 2 | 35 | 22 | 33 | <10 | <10 | <10 |
| 4 | 78 | 45 | 50 | <10 | <10 | 18 |
| 6 | 106 | 87 | 52 | 22 | <10 | 15 |
| 8 | 130 | 88 | 77 | 44 | 12 | 20 |
| 10 | - | 90 | 82 | 50 | 30 | 42 |
| 12 | - | 102 | 88 | 78 | 65 | 56 |
| 14 | - | - | 115 | 74 | 71 | 63 |
| 16 | - | - | - | 80 | 77 | 79 |
| 18 | - | - | - | 78 | 78 | 75 |
| 20 | - | - | - | 82 | 80 | 77 |
| Week of Storage | Appearance | |||||
|---|---|---|---|---|---|---|
| PP | PET | ZL | PP+SB | PET+SB | ZL+SB | |
| 4 | 7.28 ± 0.31 B | 7.43 ± 0.20 B | 7.62 ± 0.15 A | 7.62 ± 0.22 * | 7.60 ± 0.22 | 7.73 ± 0.18 |
| 8 | - | 7.39 ± 0.15 B | 7.58 ± 0.16 A | 7.60 ± 0.13 | 7.61 ± 0.13 * | 7.67 ± 0.13 |
| 12 | - | - | - | 7.66 ± 0.14 | 7.52 ± 0.18 | 7.64 ± 0.16 |
| 16 | - | - | - | 7.55 ± 0.20 | 7.54 ± 0.20 | 7.50 ± 0.12 |
| 20 | - | - | - | 7.60 ± 0.31 | 7.63 ± 0.31 | 7.62 ± 0.36 |
| Color | ||||||
| 4 | 7.01 ± 0.19 B | 7.21 ± 0.16 A | 7.26 ± 0.09 A | 7.25 ± 0.29 | 7.20 ± 0.17 | 7.01. ± 0.23 |
| 8 | - | 7.26 ± 0.22 | 7.33 ± 0.25 | 7.15 ± 0.22 | 7.20 ± 0.27 | 7.04 ± 0.24 |
| 12 | - | - | - | 7.29 ± 0.12 | 7.25 ± 0.19 | 7.19 ± 0.10 |
| 16 | - | - | - | 7.01 ± 0.29 | 7.24 ± 0.14 | 7.06 ± 0.22 |
| 20 | - | - | - | 7.17 ± 0.21 | 7.01 ± 0.06 | 7.12 ± 0.10 |
| Flavor | ||||||
| 4 | 7.19 ± 0.32 | 7.35 ± 0.23 a | 7.39 ± 0.33 a | 7.78 ± 0.17 a* | 7.82 ± 0.10 a* | 7.78 ± 0.17 a* |
| 8 | - | 6.92 ± 0.26 b | 7.06 ± 0.24 b | 7.42 ± 0.20 Bb | 7.86 ± 0.29 Aa* | 7.82 ± 0.20 Aa* |
| 12 | - | - | - | 7.41 ± 0.16 Bb | 7.52 ± 0.22 Bb | 7.81 ± 0.16 Aa |
| 16 | - | - | - | 7.18 ± 0.18 Cc | 7.43 ± 0.16 Bb | 7.63 ± 0.18 Ab |
| 20 | - | - | - | 7.22 ± 0.23 Bc | 7.39 ± 0.19 Bb | 7.65 ± 0.23 Ab |
| Texture | ||||||
| 4 | 7.82 ± 0.19 | 7.79 ± 0.20 | 7.84 ± 0.17 | 7.73 ± 0.16 | 7.80 ± 0.13 | 7.78 ± 0.16 |
| 8 | - | 7.83 ± 0.19 | 7.79 ± 0.23 | 7.77 ± 0.14 | 7.74 ± 0.12 | 7.80 ± 0.14 |
| 12 | - | - | - | 7.65 ± 0.29 | 7.70 ± 0.22 | 7.65 ± 0.20 |
| 16 | - | - | - | 7.60 ± 0.22 | 7.75 ± 0.15 | 7.67 ± 0.19 |
| 20 | - | - | - | 7.62 ± 0.26 | 7.70 ± 0.16 | 7.60 ± 0.22 |
| Overall | ||||||
| 4 | 7.34 ± 0.22 | 7.29 ± 0.11 a | 7.01 ± 0.09 a | 7.92 ± 0.22 Aa* | 7.83 ± 0.14 AB* | 7.72 ± 0.16 B* |
| 8 | - | 7.03 ± 0.27 Ab | 6.78 ± 0.21 Bb | 7.79 ± 0.15 a | 7.84 ± 0.13 * | 7.80 ± 0.13 * |
| 12 | - | - | - | 7.80 ± 0.13 a | 7.70 ± 0.20 | 7.65 ± 0.29 |
| 16 | - | - | - | 7.82 ± 0.21 a | 7.62 ± 0.27 | 7.60 ± 0.21 |
| 20 | - | - | - | 7.39 ± 0.30 Bb | 7.65 ± 0.17 A | 7.71 ± 0.29 A |
| Parameters | PP+SB | PET+SB | ZL+SB |
|---|---|---|---|
| Inorganic contaminants | |||
| Pb (mg/kg) | ND | ND | ND |
| As (mg/kg) | ND | ND | ND |
| Cd (mg/kg) | <0.45 | <1.12 | <0.66 |
| Hg (mg/kg) | 0.18 ± 0.02 | 0.29 ± 0.19 | 0.32 ± 0.14 |
| Aflatoxin | |||
| Aflatoxin B1 (μg/kg) | ND | ND | ND |
| Aflatoxin B2 (μg/kg) | ND | ND | ND |
| Aflatoxin G1 (μg/kg) | ND | ND | ND |
| Aflatoxin G2 (μg/kg) | ND | ND | ND |
| Pathogen | |||
| Salmonella spp. | ND | ND | ND |
| S. aureus | ND | ND | ND |
| B. cereus | <10 | 12 | <10 |
| C. perfringens | ND | 15 | 20 |
| E. coli | <10 | <10 | <10 |
Publisher’s Note: MDPI stays neutral with regard to jurisdictional claims in published maps and institutional affiliations. |
© 2021 by the authors. Licensee MDPI, Basel, Switzerland. This article is an open access article distributed under the terms and conditions of the Creative Commons Attribution (CC BY) license (https://creativecommons.org/licenses/by/4.0/).
Share and Cite
Pongsetkul, J.; Benjakul, S. The Use of Sodium Benzoate on Shelf-Life and Quality Attributes of Dried Chili Fish Paste Stored in Different Packaging Containers. Foods 2021, 10, 1802. https://doi.org/10.3390/foods10081802
Pongsetkul J, Benjakul S. The Use of Sodium Benzoate on Shelf-Life and Quality Attributes of Dried Chili Fish Paste Stored in Different Packaging Containers. Foods. 2021; 10(8):1802. https://doi.org/10.3390/foods10081802
Chicago/Turabian StylePongsetkul, Jaksuma, and Soottawat Benjakul. 2021. "The Use of Sodium Benzoate on Shelf-Life and Quality Attributes of Dried Chili Fish Paste Stored in Different Packaging Containers" Foods 10, no. 8: 1802. https://doi.org/10.3390/foods10081802
APA StylePongsetkul, J., & Benjakul, S. (2021). The Use of Sodium Benzoate on Shelf-Life and Quality Attributes of Dried Chili Fish Paste Stored in Different Packaging Containers. Foods, 10(8), 1802. https://doi.org/10.3390/foods10081802