
Changes of the Microbiota Composition on the Surface of Pig Carcasses during Chilling and Its Associations with Alterations in Chiller’s Temperature and Air Humidity


Abstract
:1. Introduction
2. Materials and Methods
2.1. Chiller Selection
2.2. Simulation of Wind Speed, Temperature and Humidity in the Chiller
- (1)
- Turbulent pulsating kinetic energy ;
- (2)
- Pulsation energy dissipation ;
2.3. Microbiological Sampling in the Air and on the Surface of Pig Carcasses
2.4. 16S rRNA Sequencing
2.5. Detection of Drug-Resistant Genes in Microbial Samples
2.6. Data Analysis
3. Results
3.1. Fluid Simulation Modeling for Chilling Process of Pig Carcasses
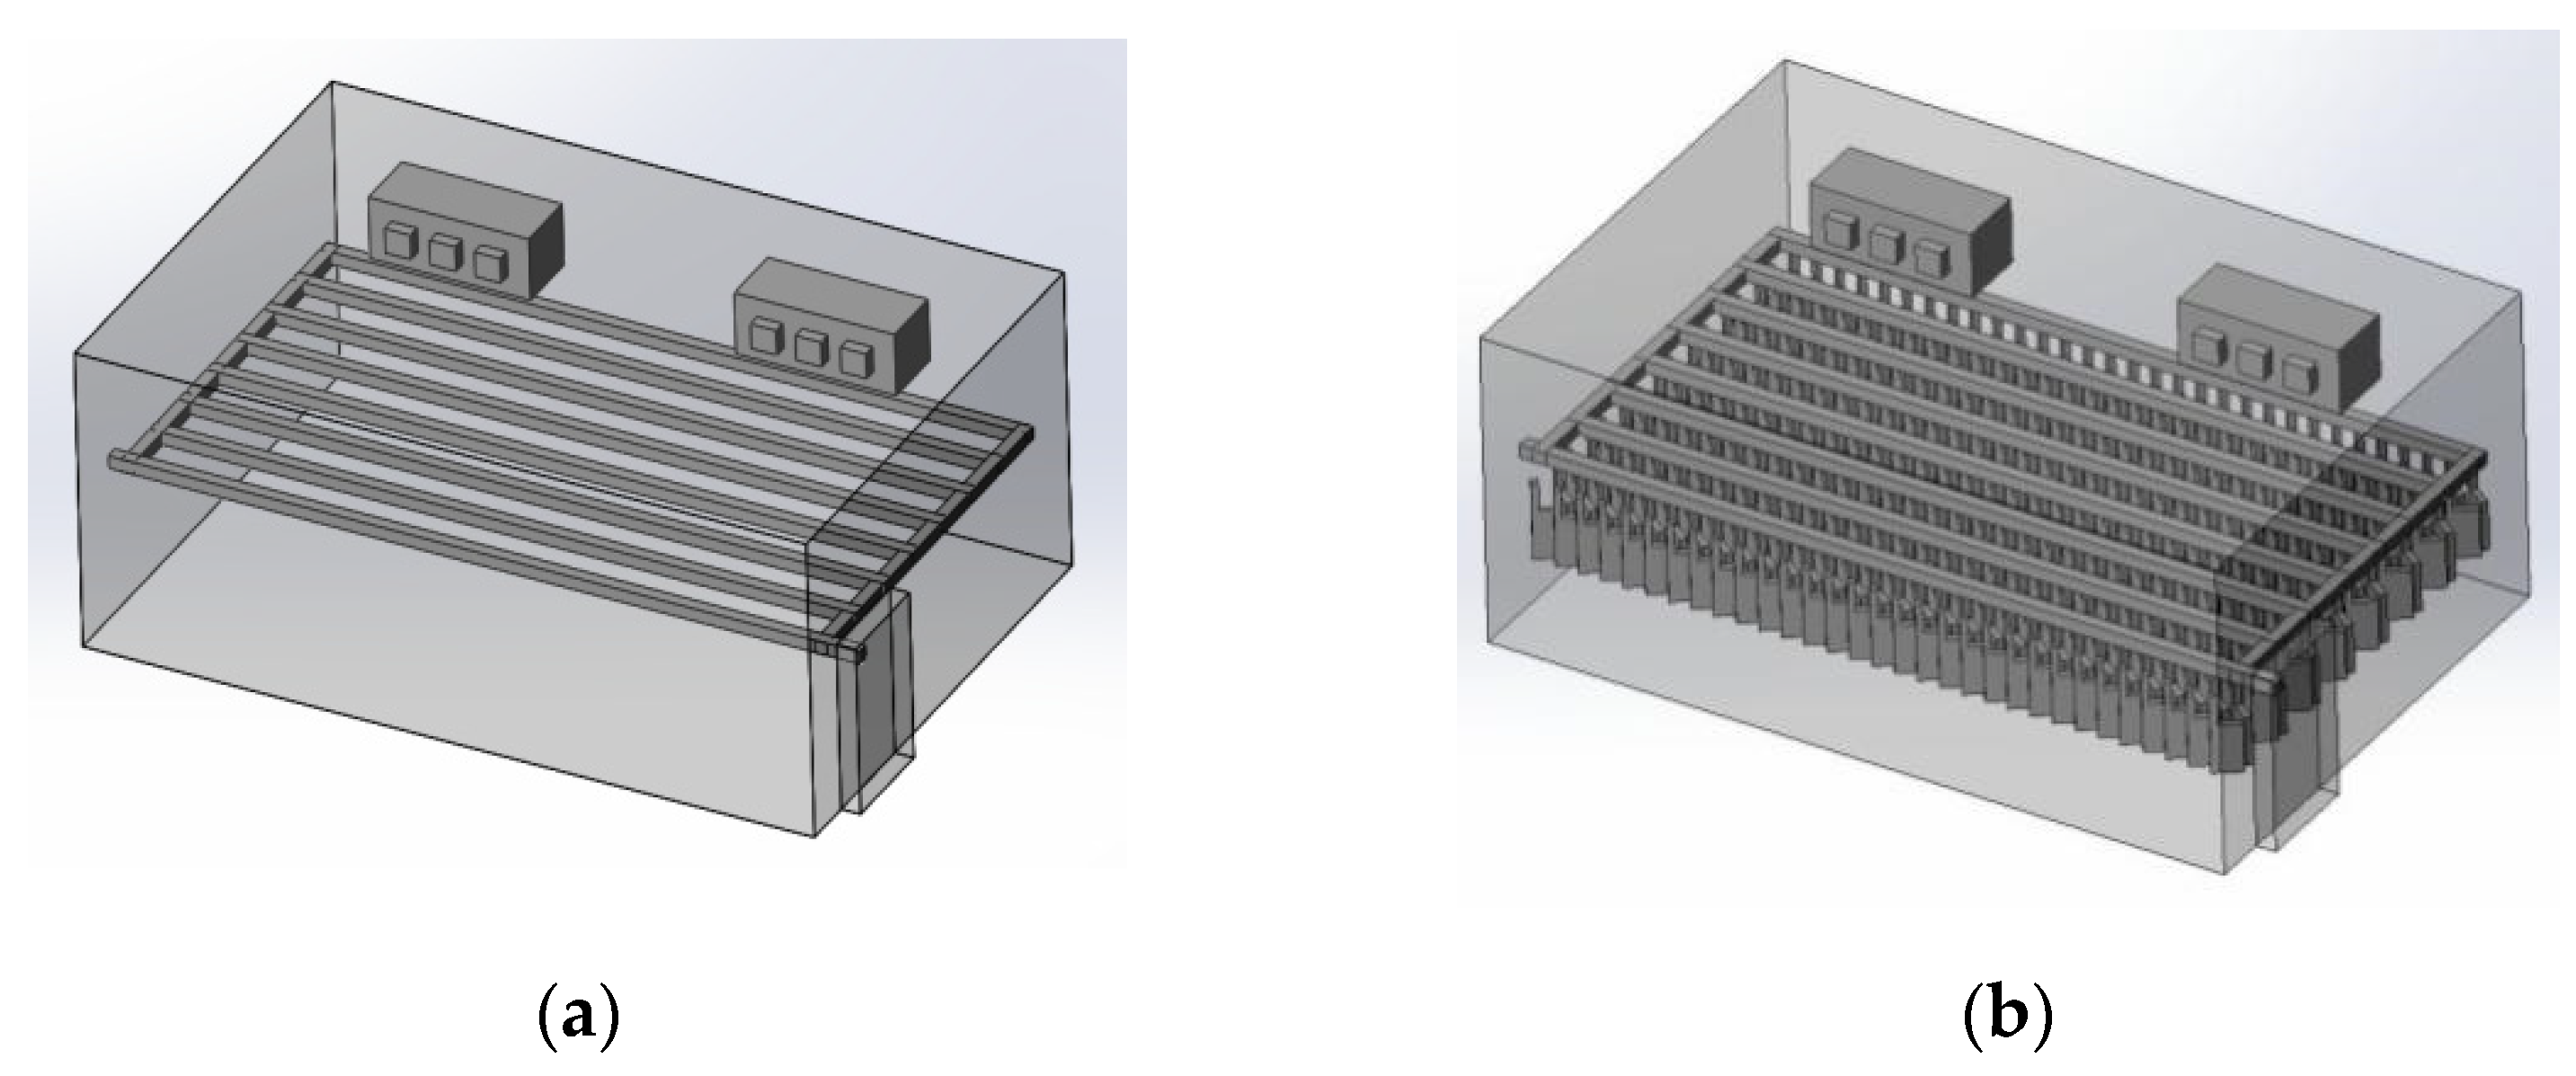
3.1.1. 3D Modeling of a Chiller
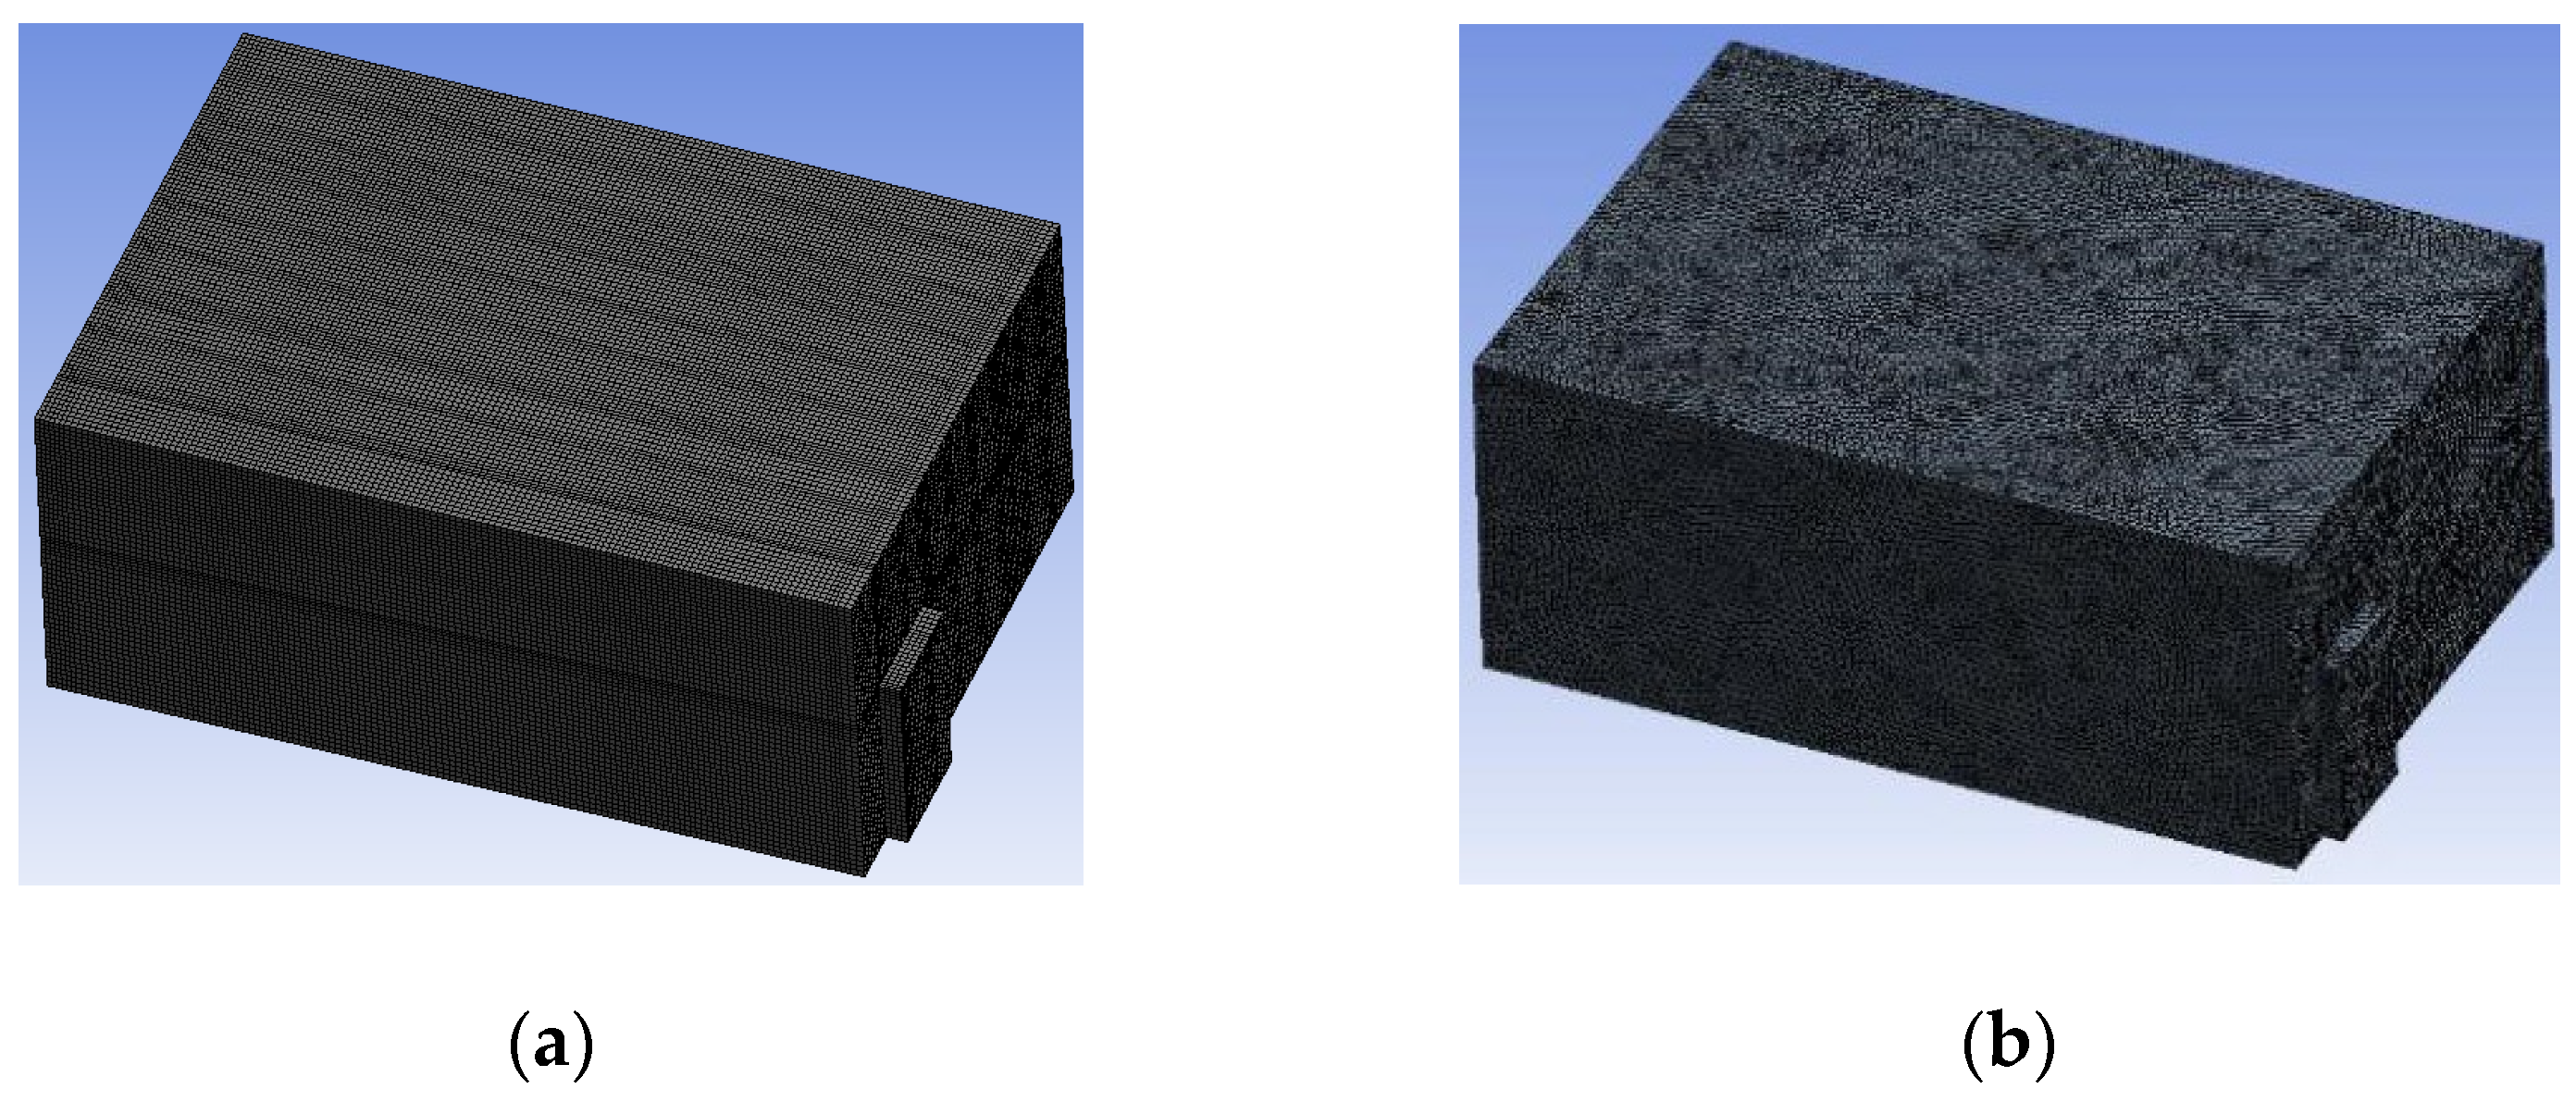
3.1.2. Simulating Changes of Temperature, Humidity, and Wind Speed and Grid Division
3.1.3. Simulation Results
3.2. The Microbiota Composition in the Air and on the Surface of Pig Carcasses Changed Greatly during Chilling
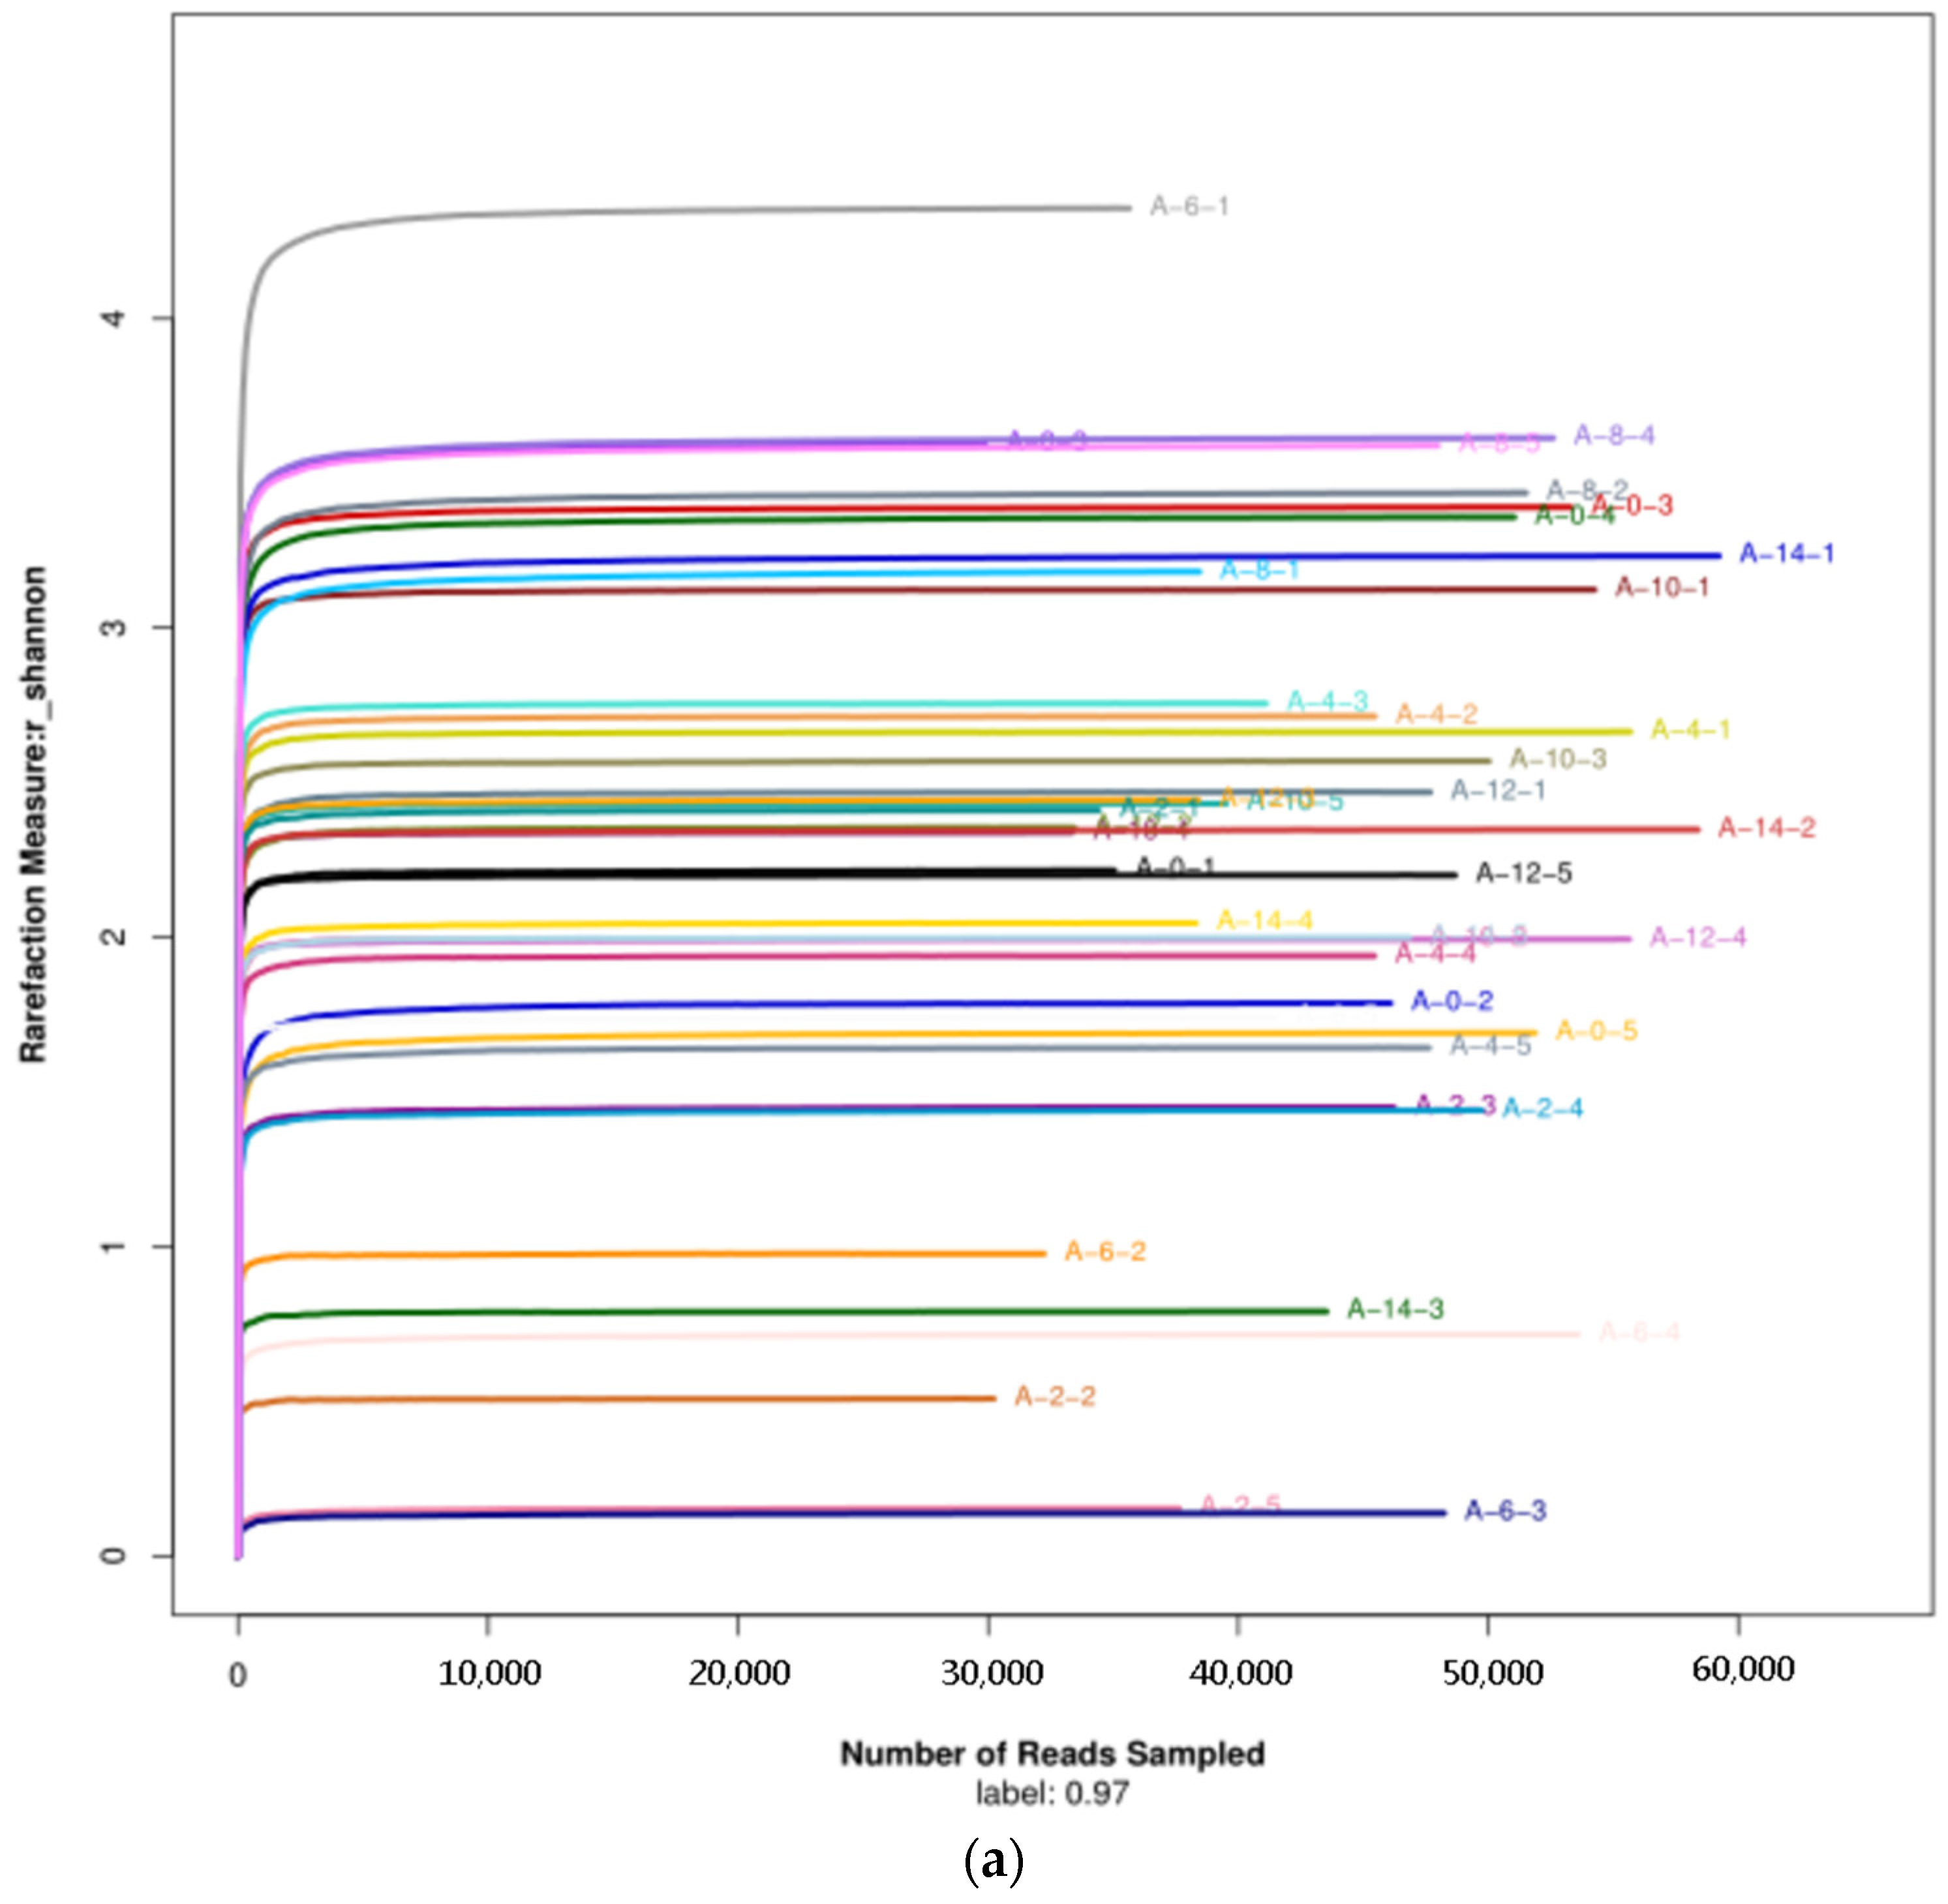
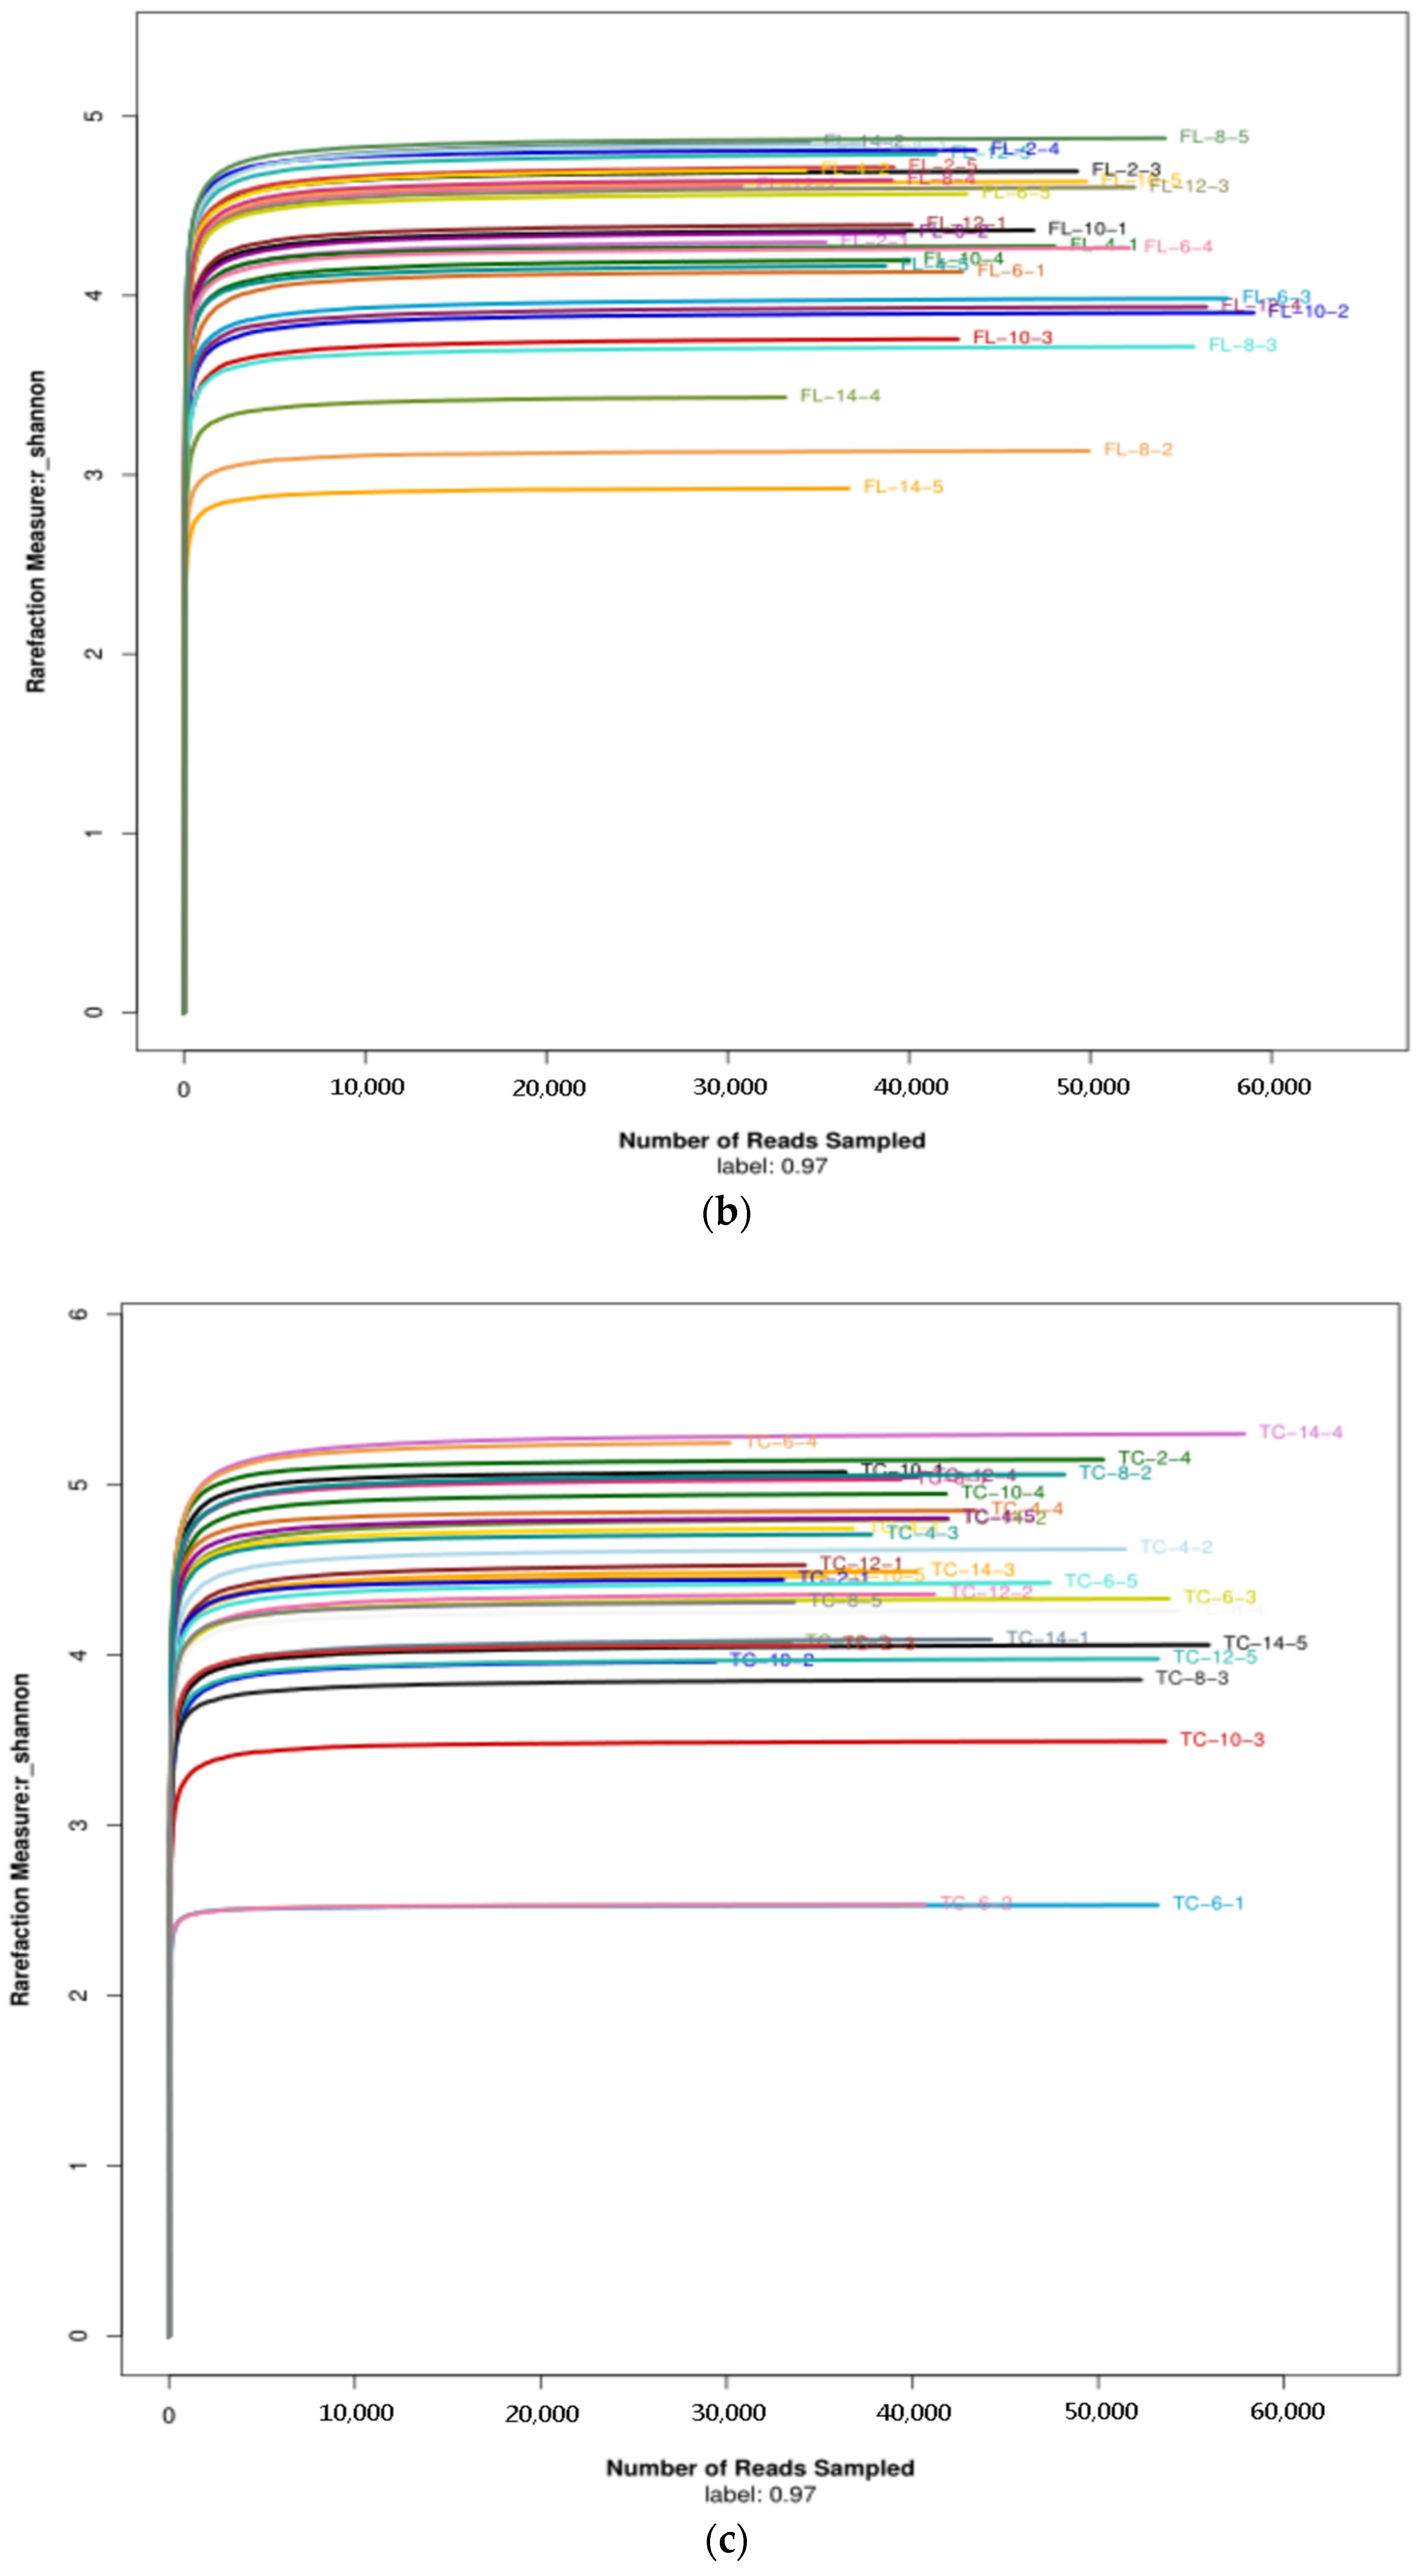
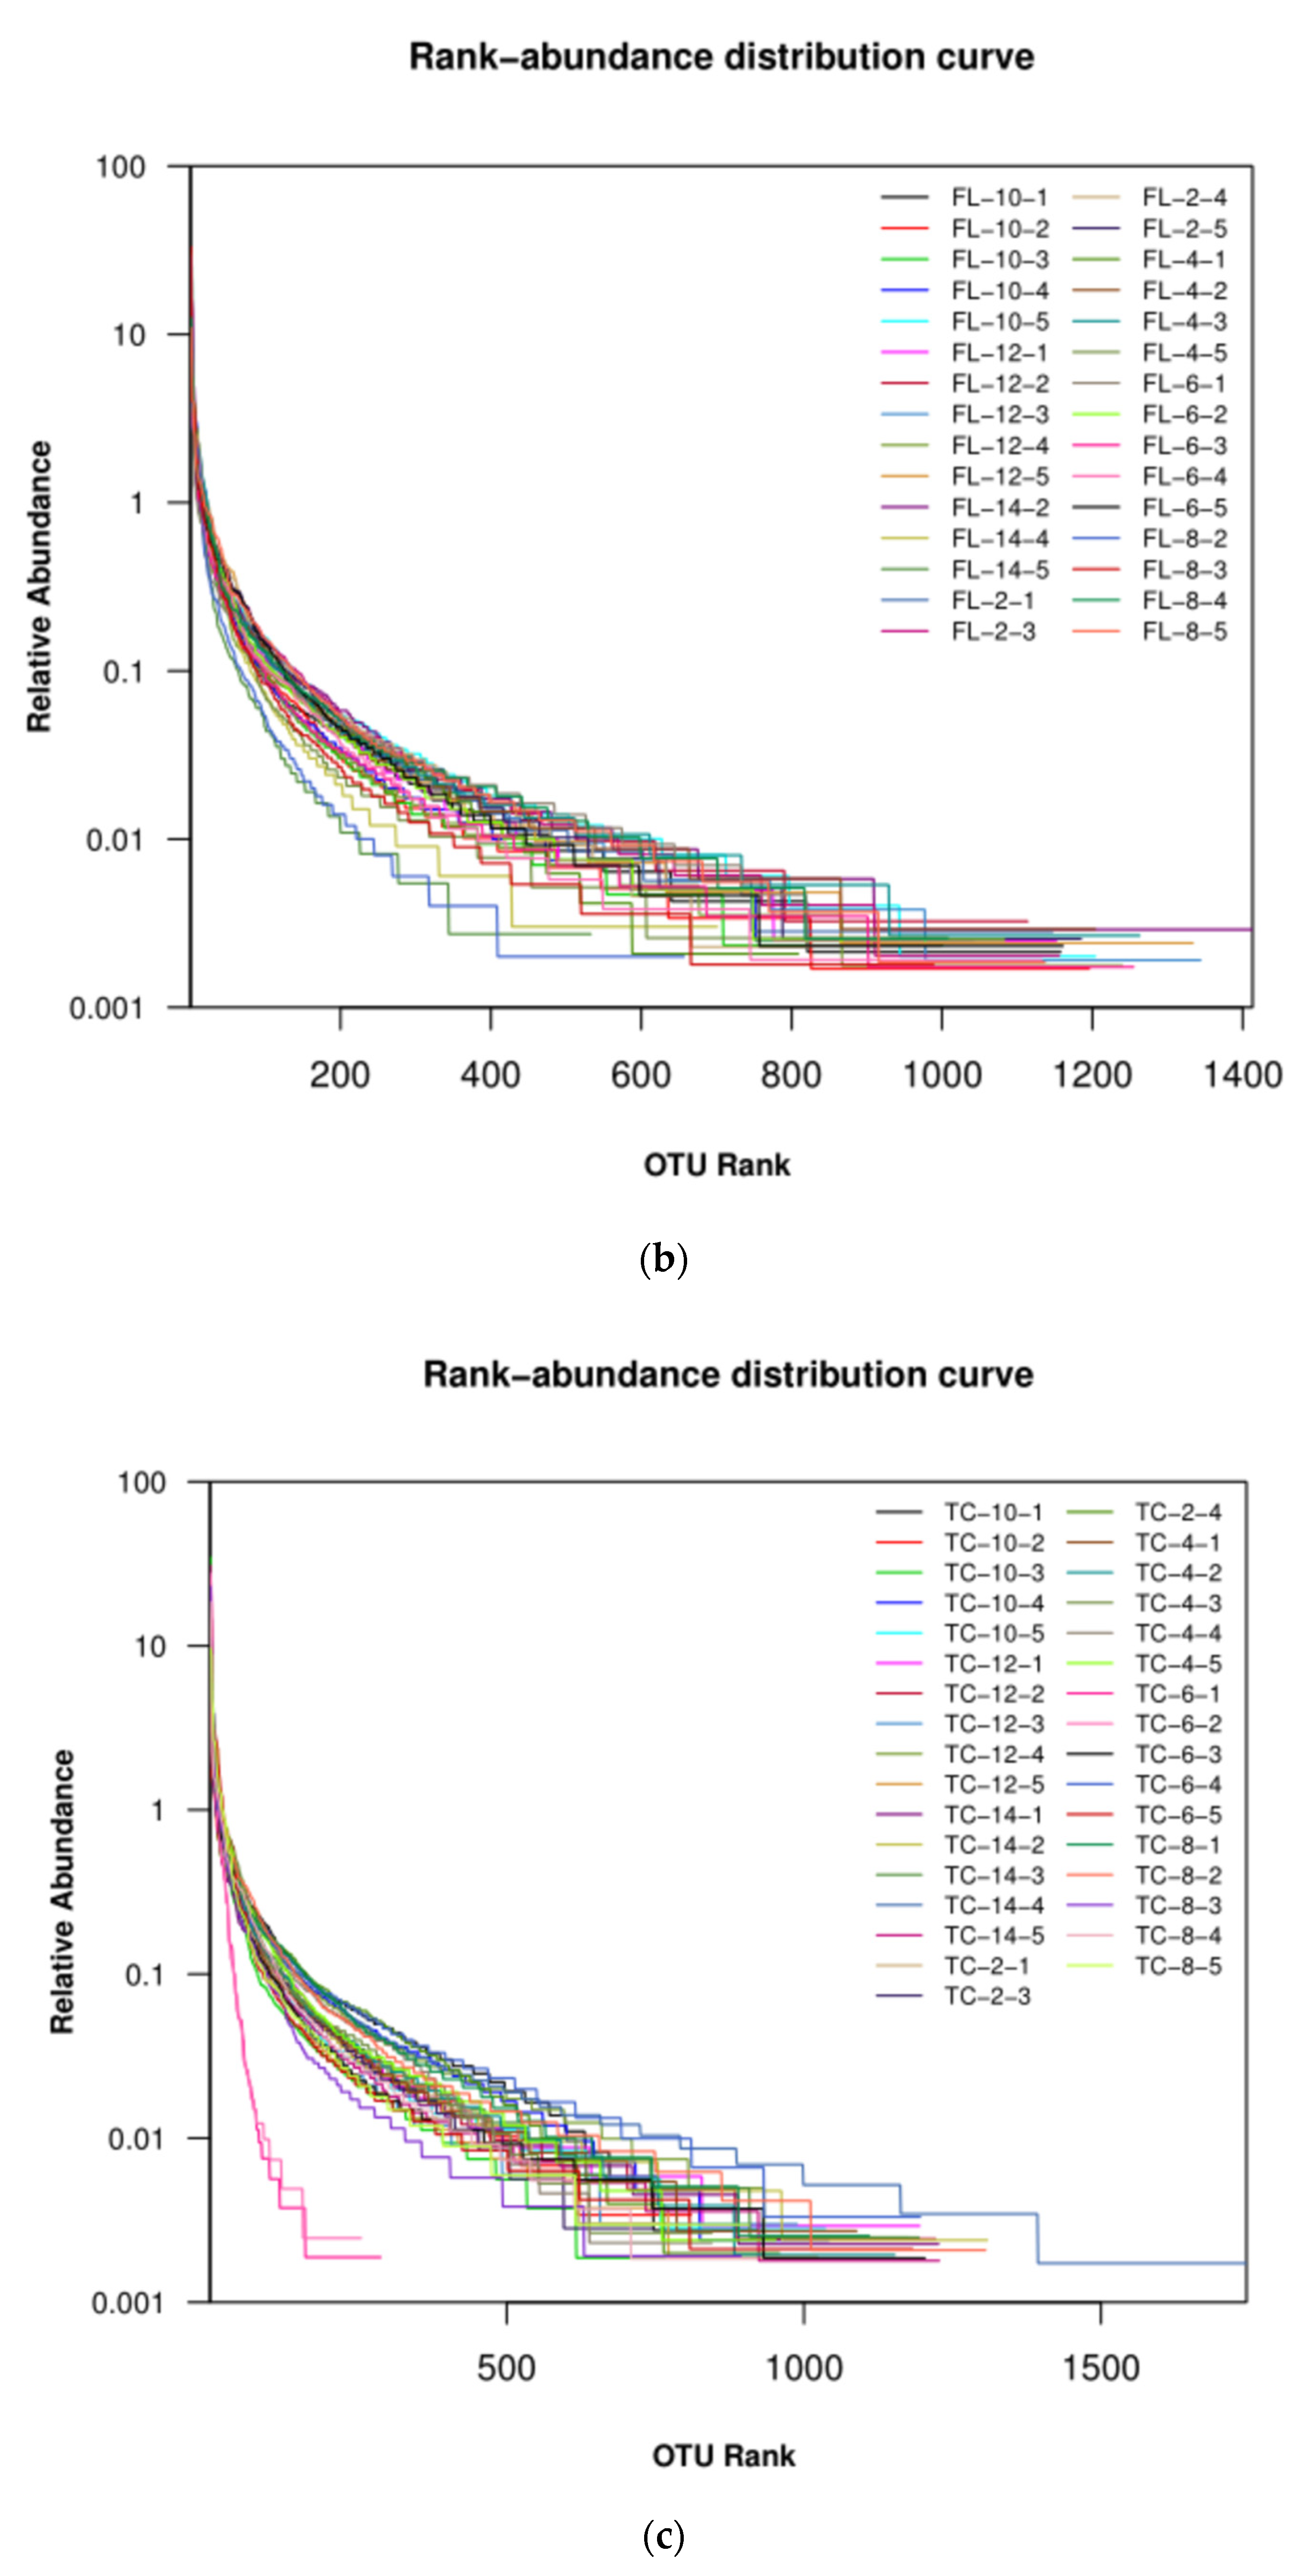
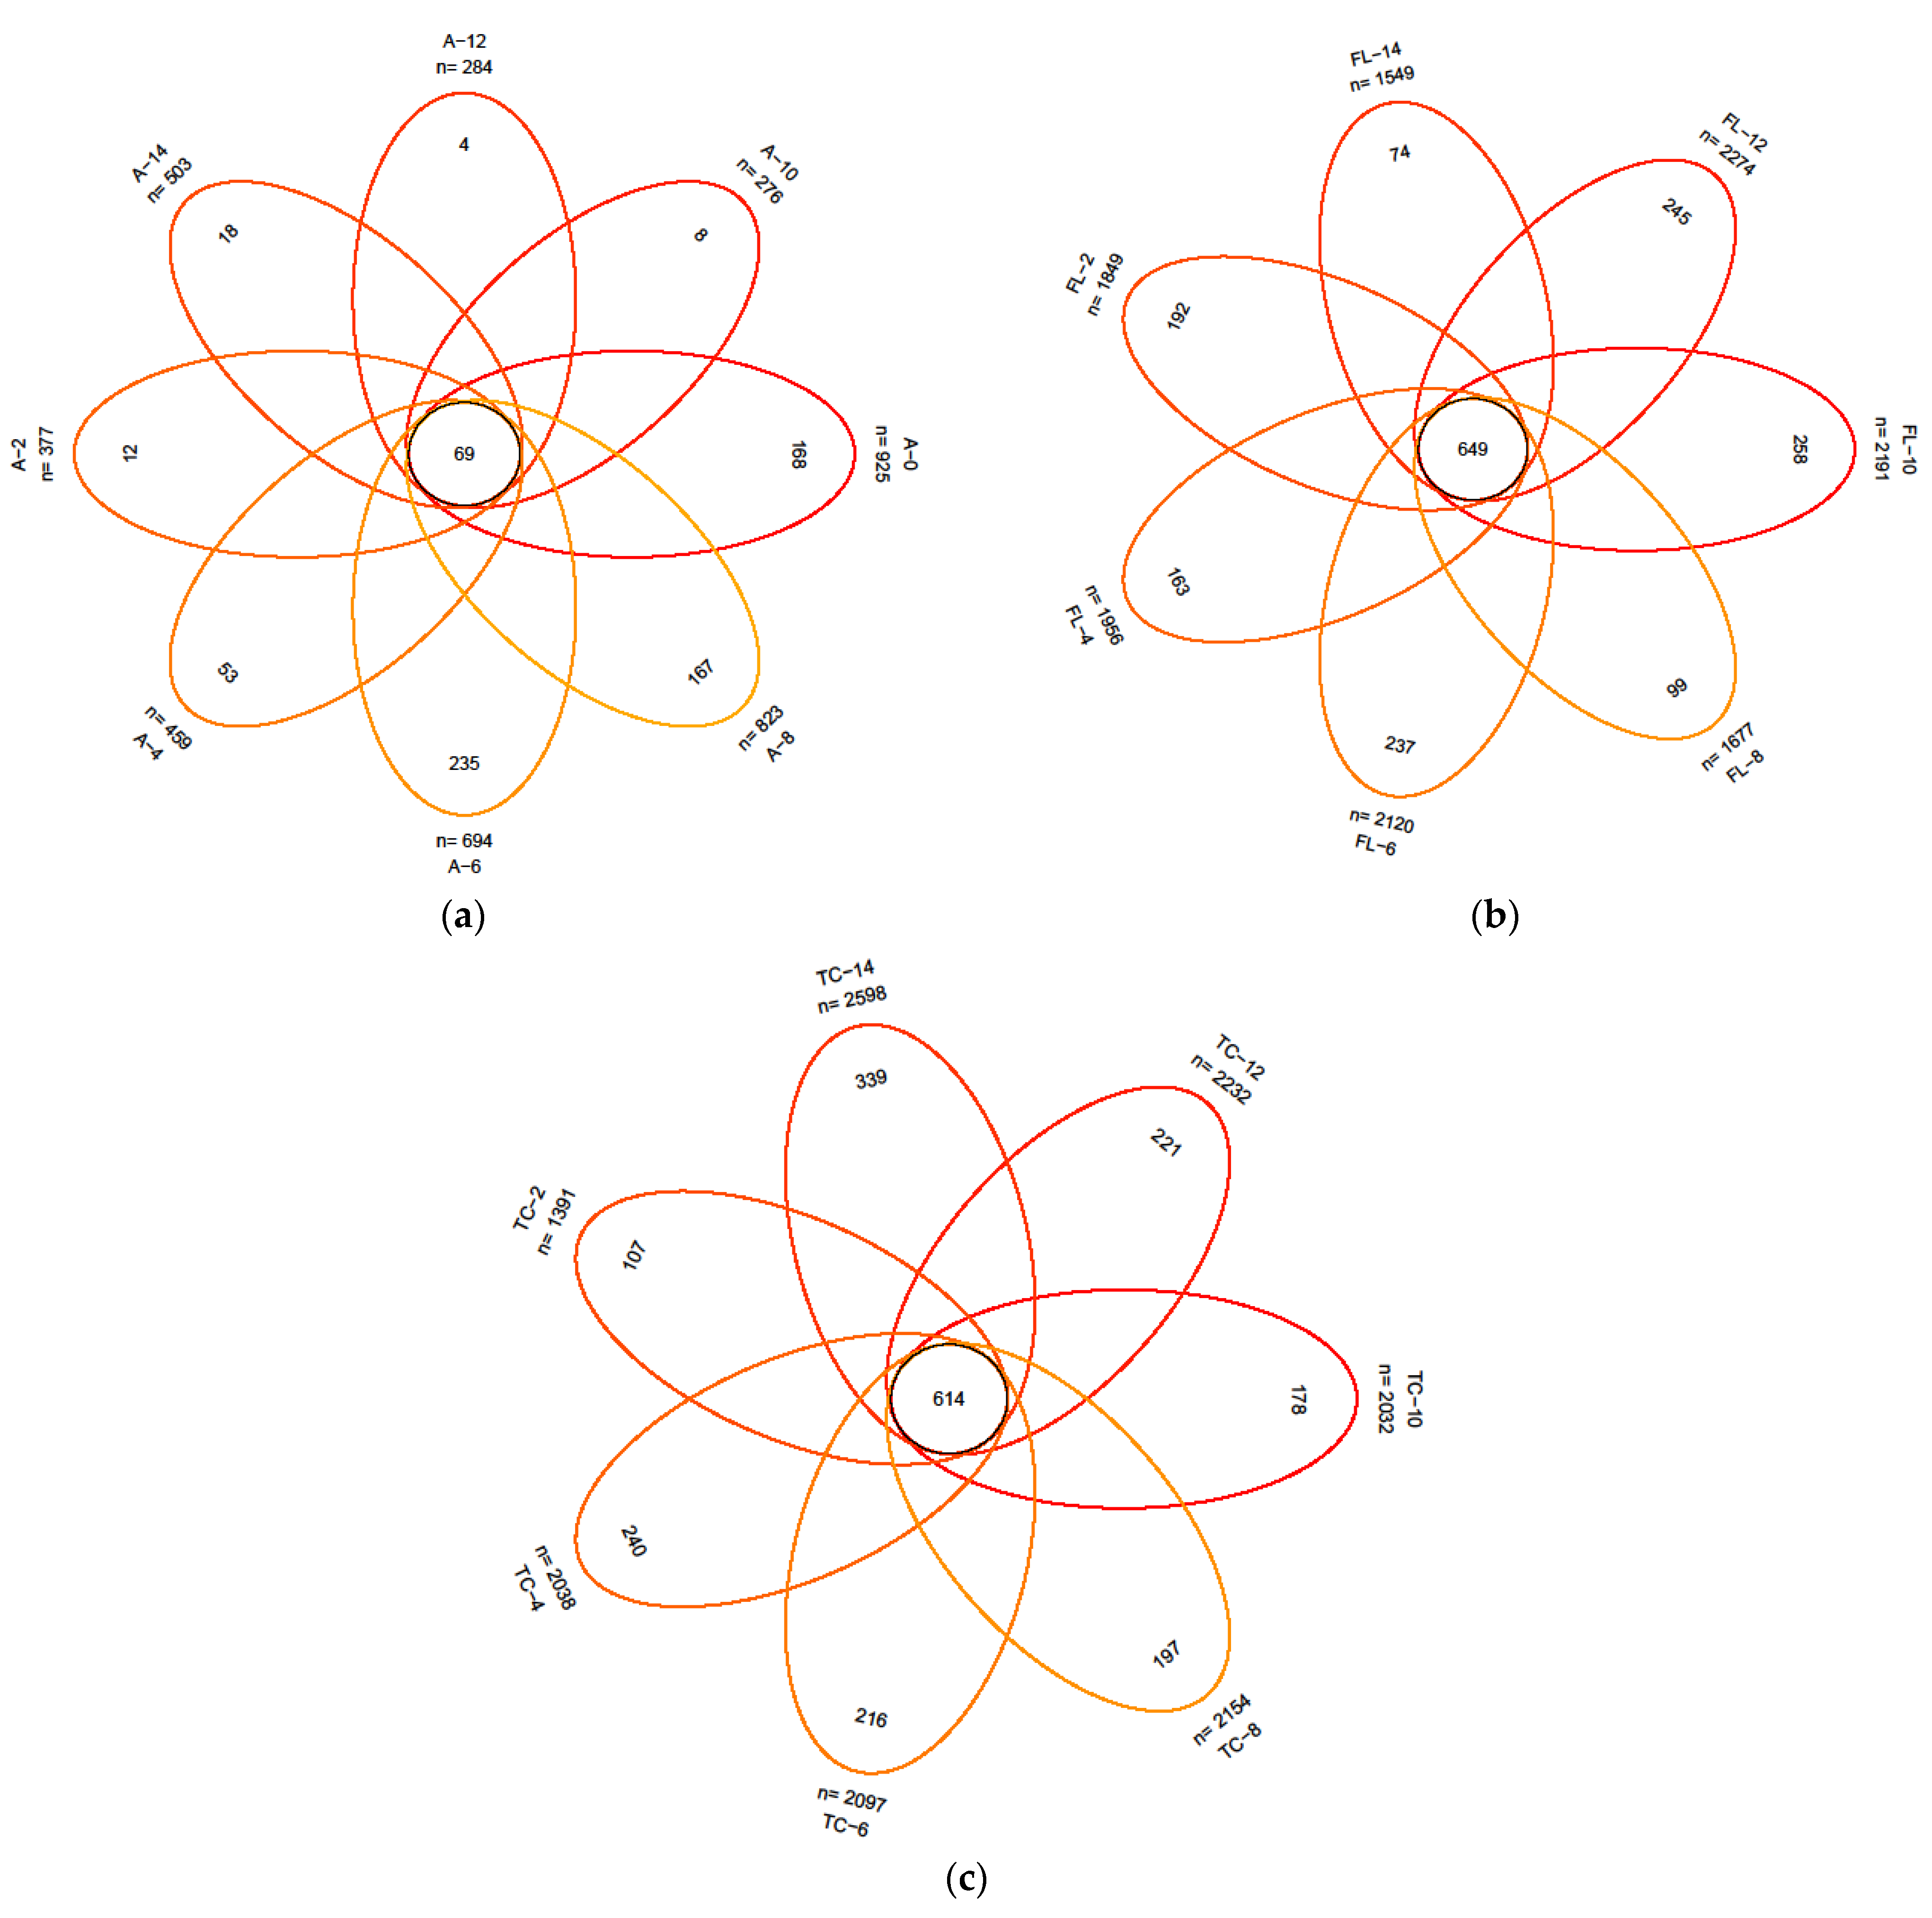
3.2.1. Diversity of the Microbiota
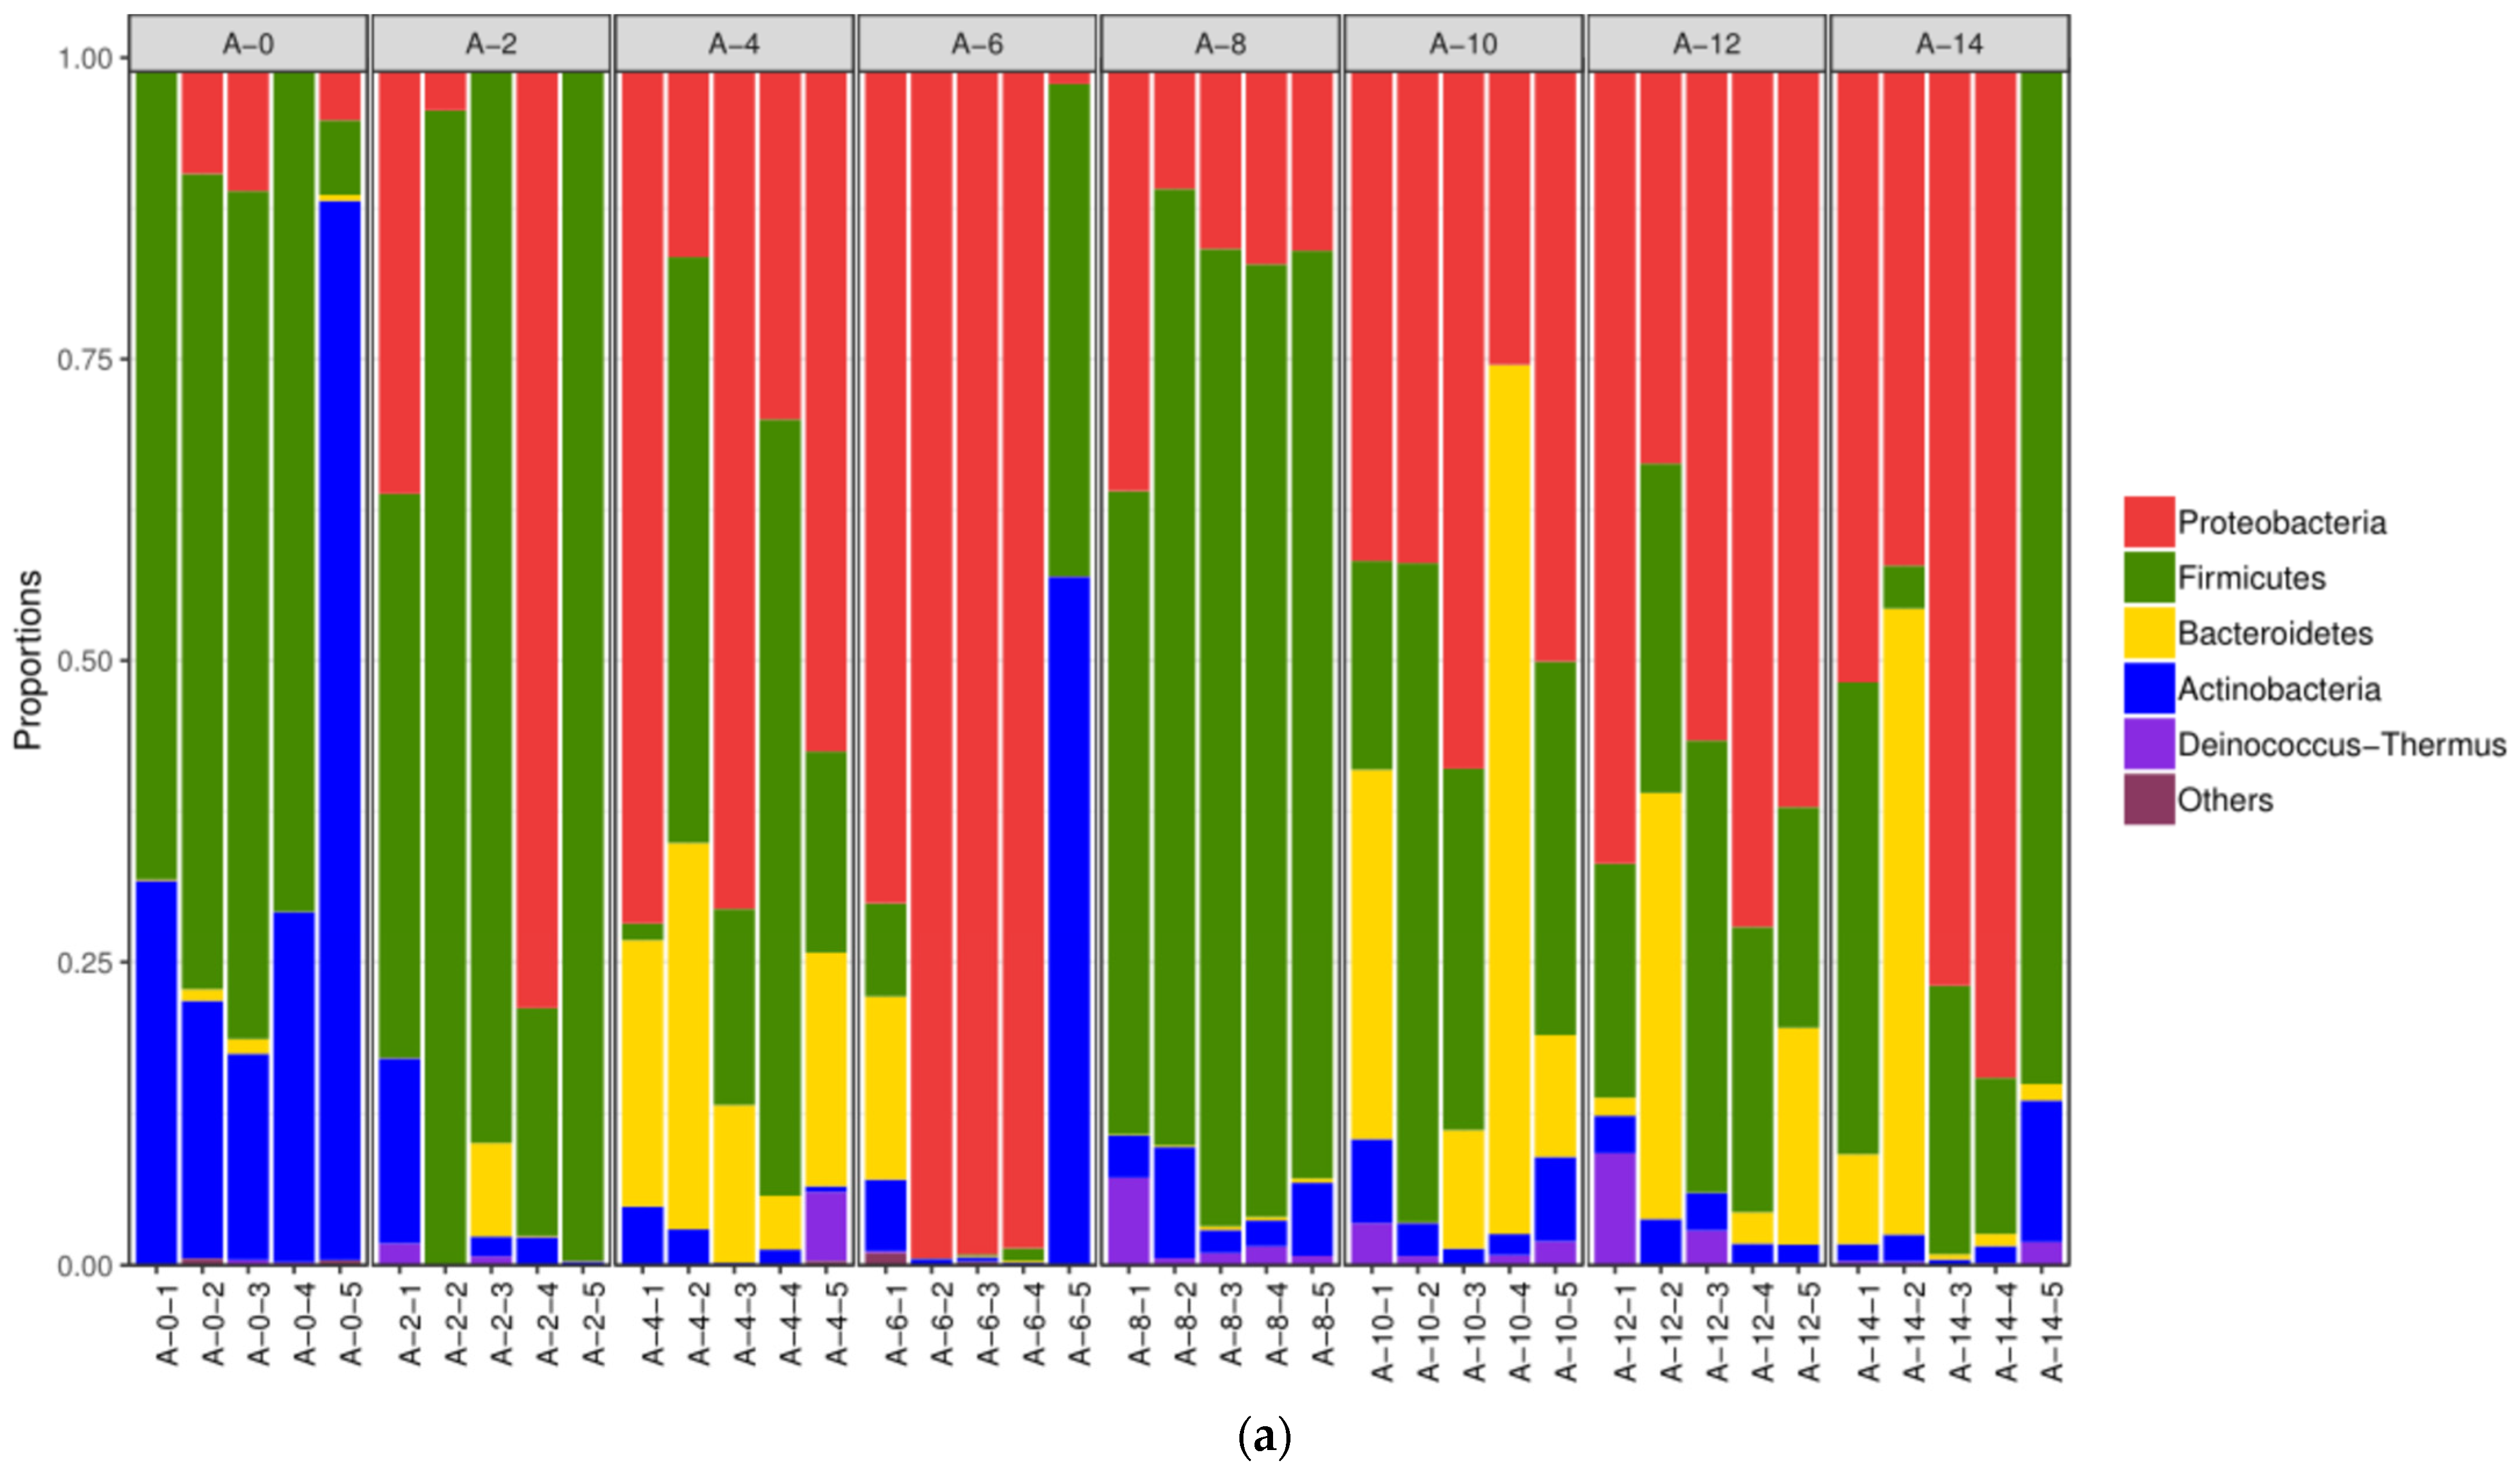
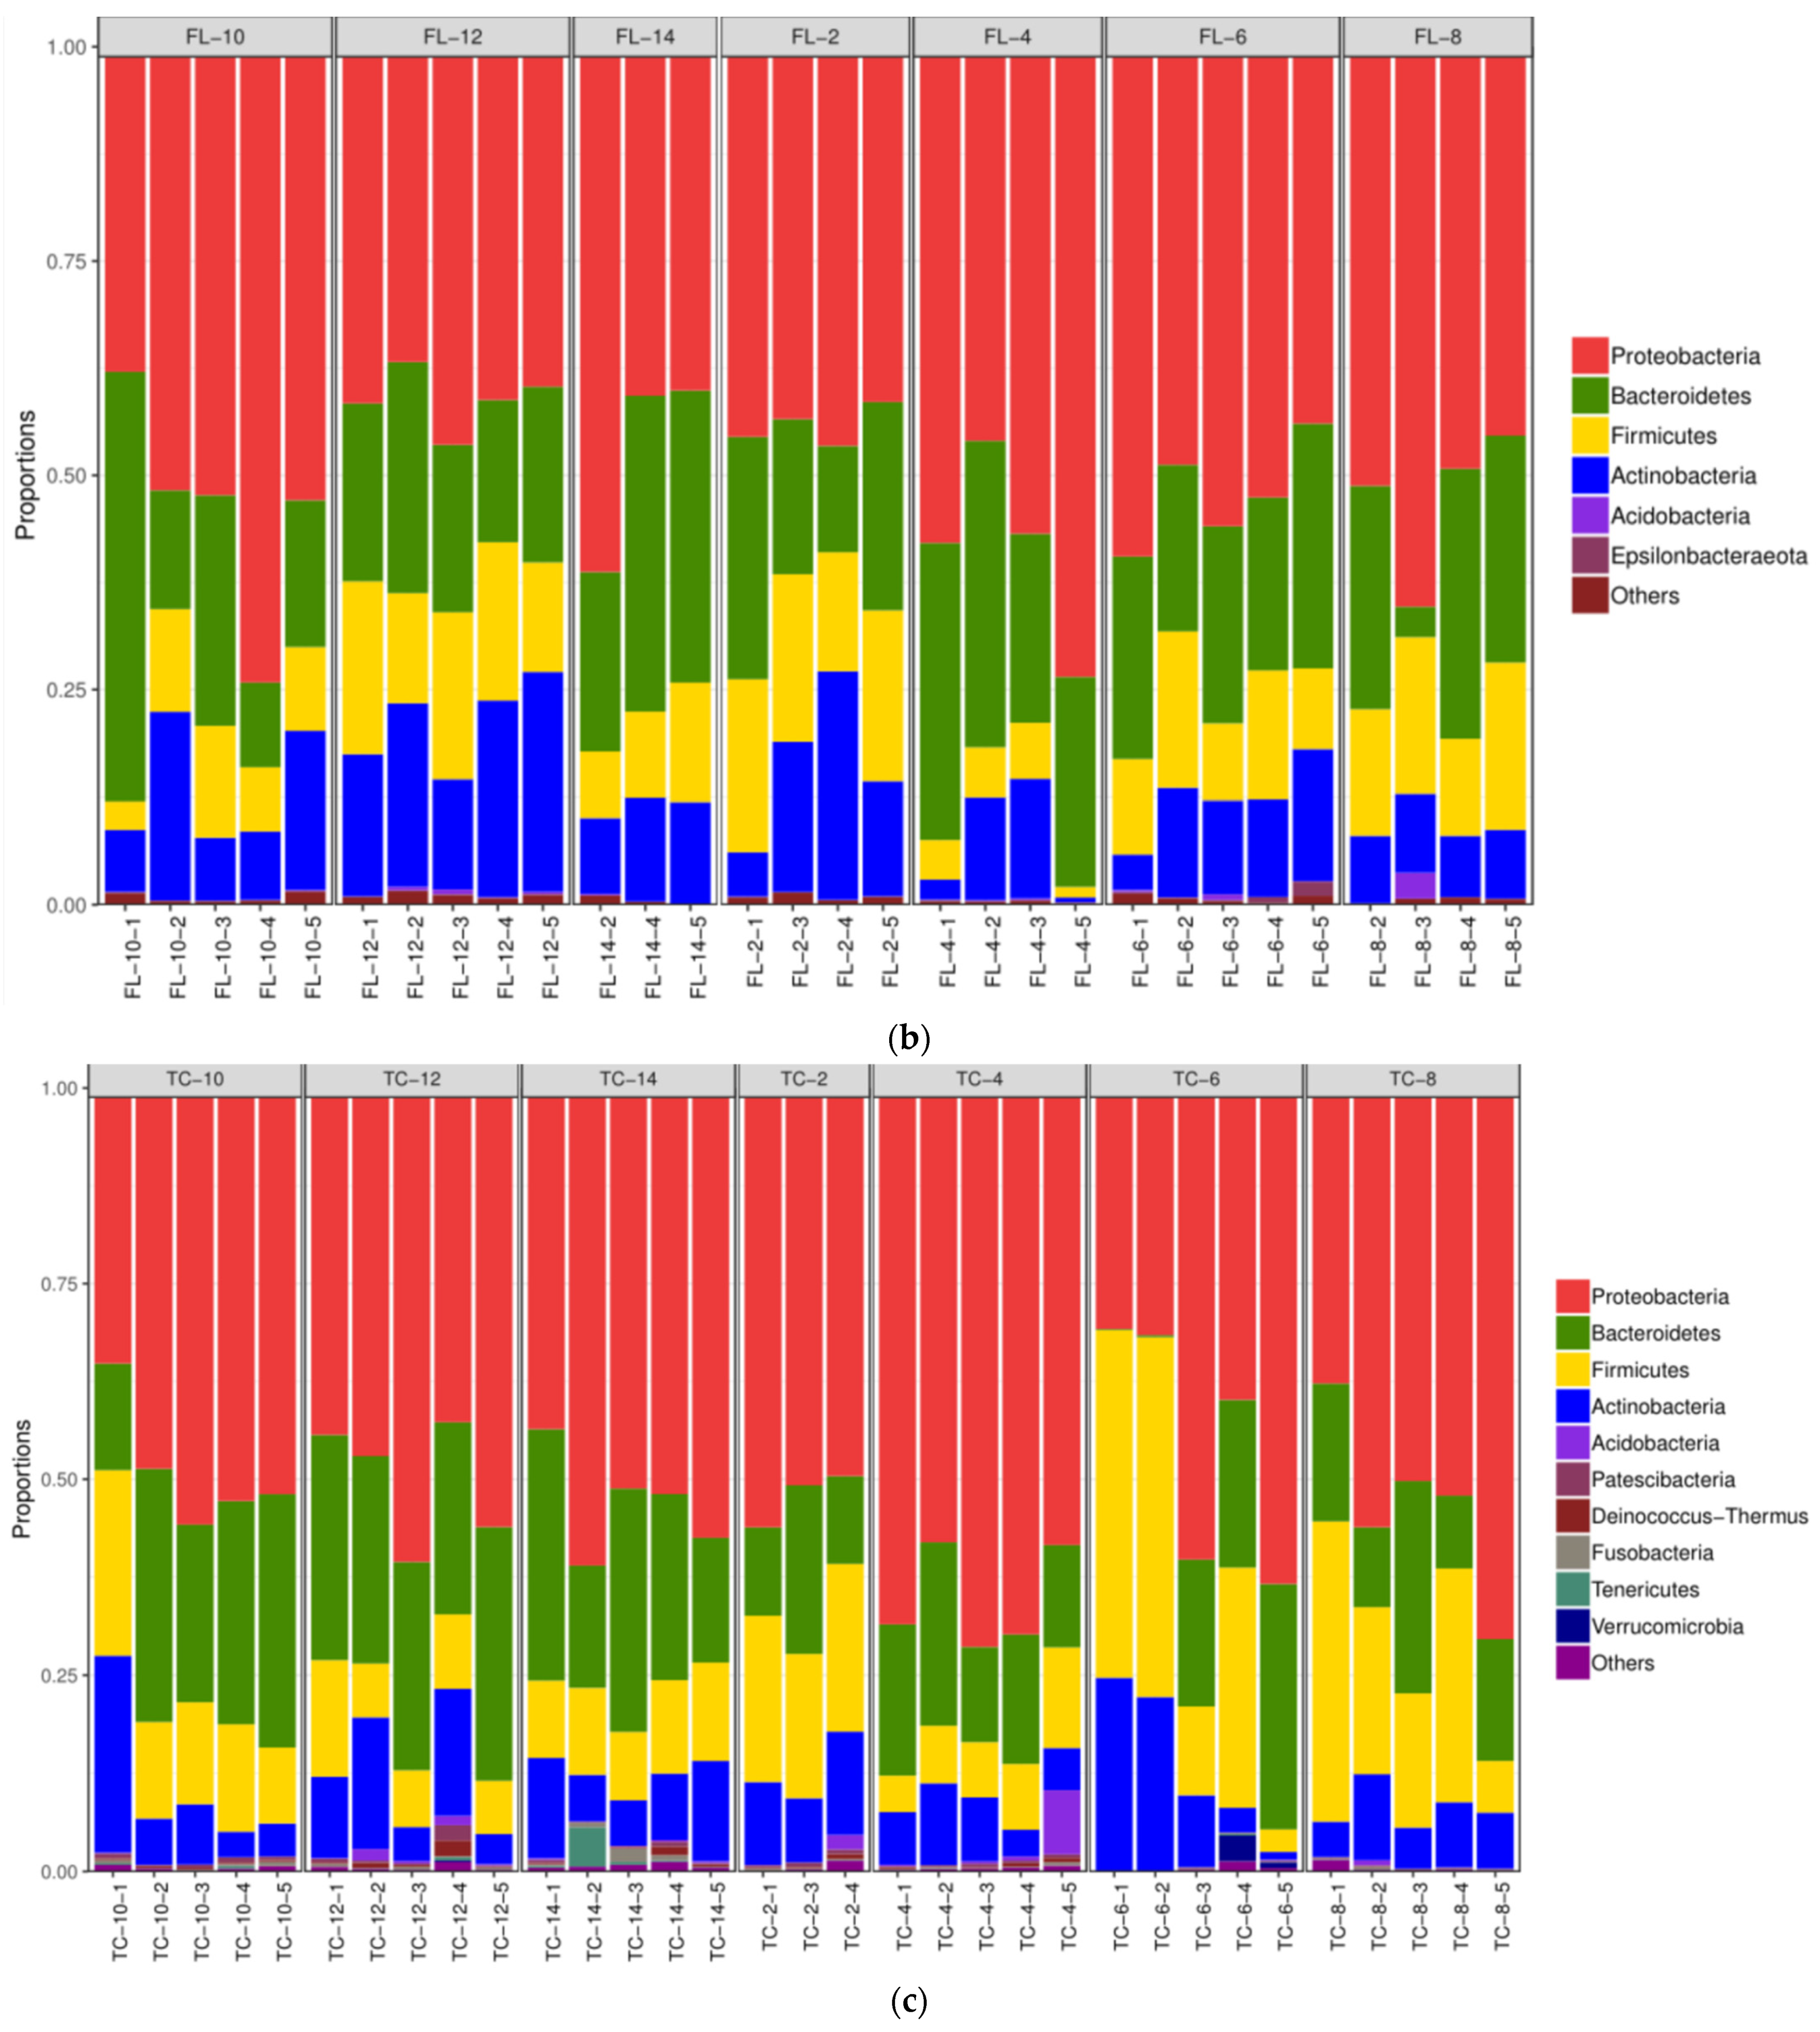
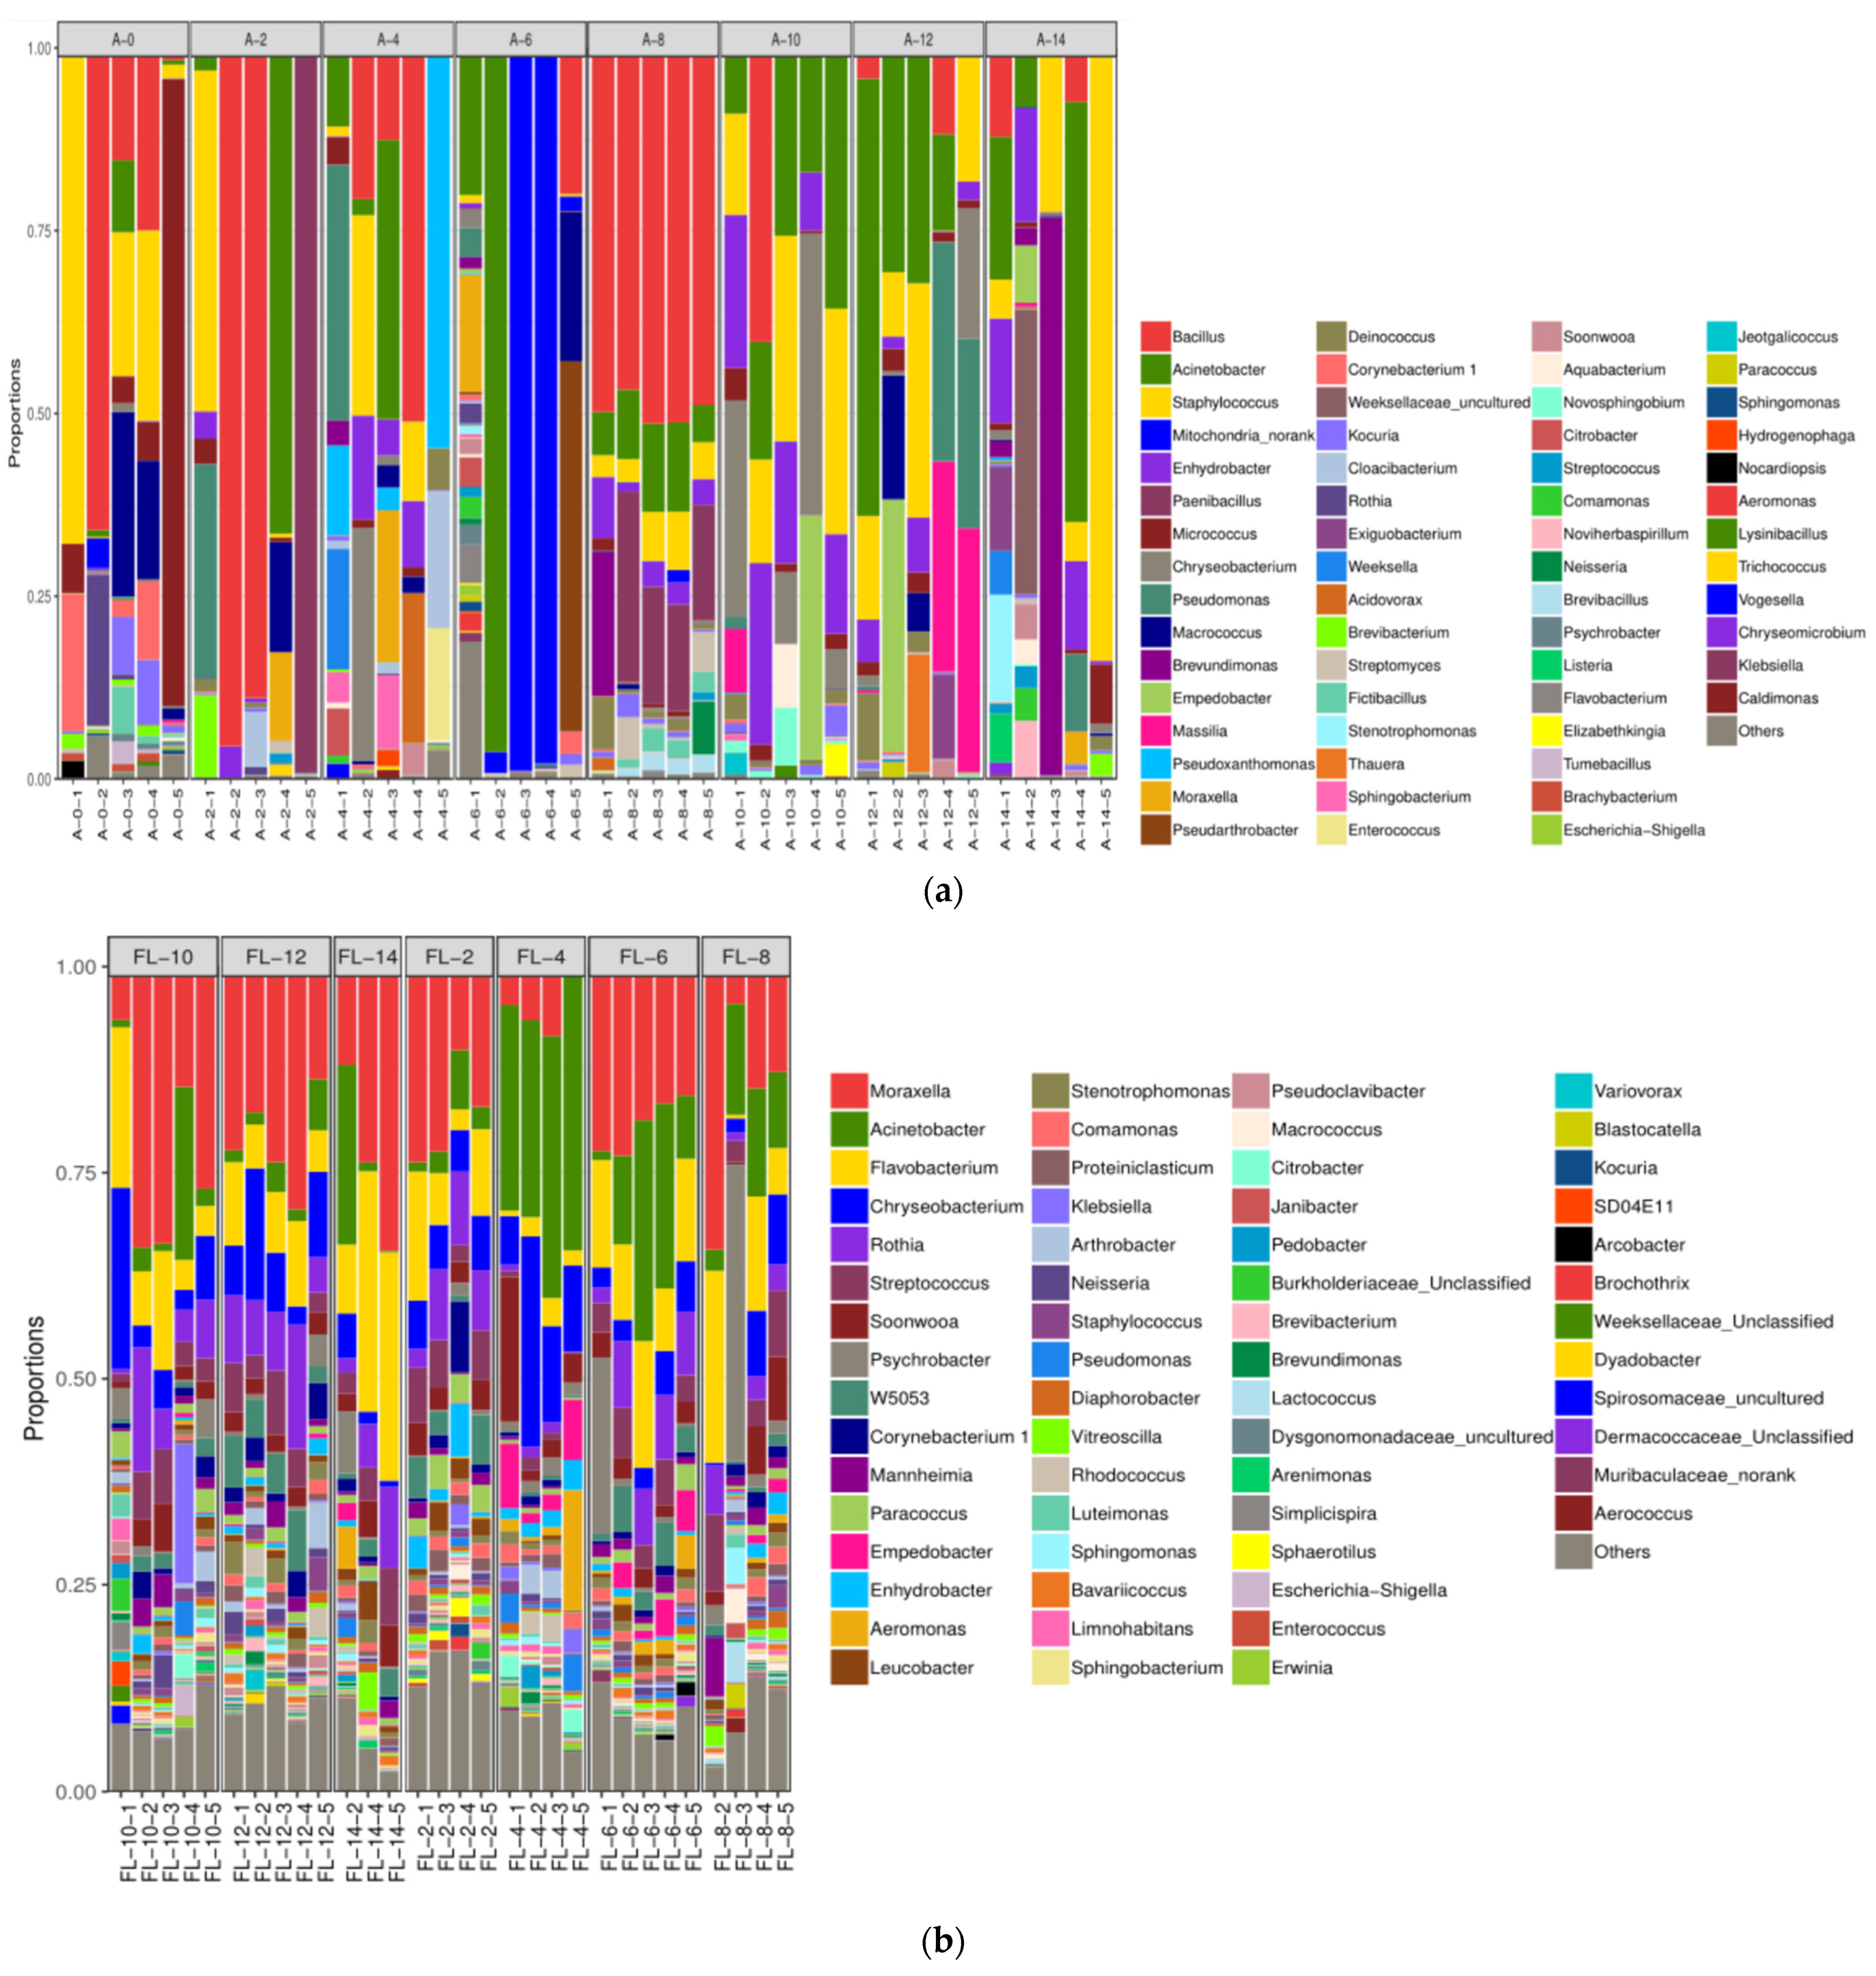
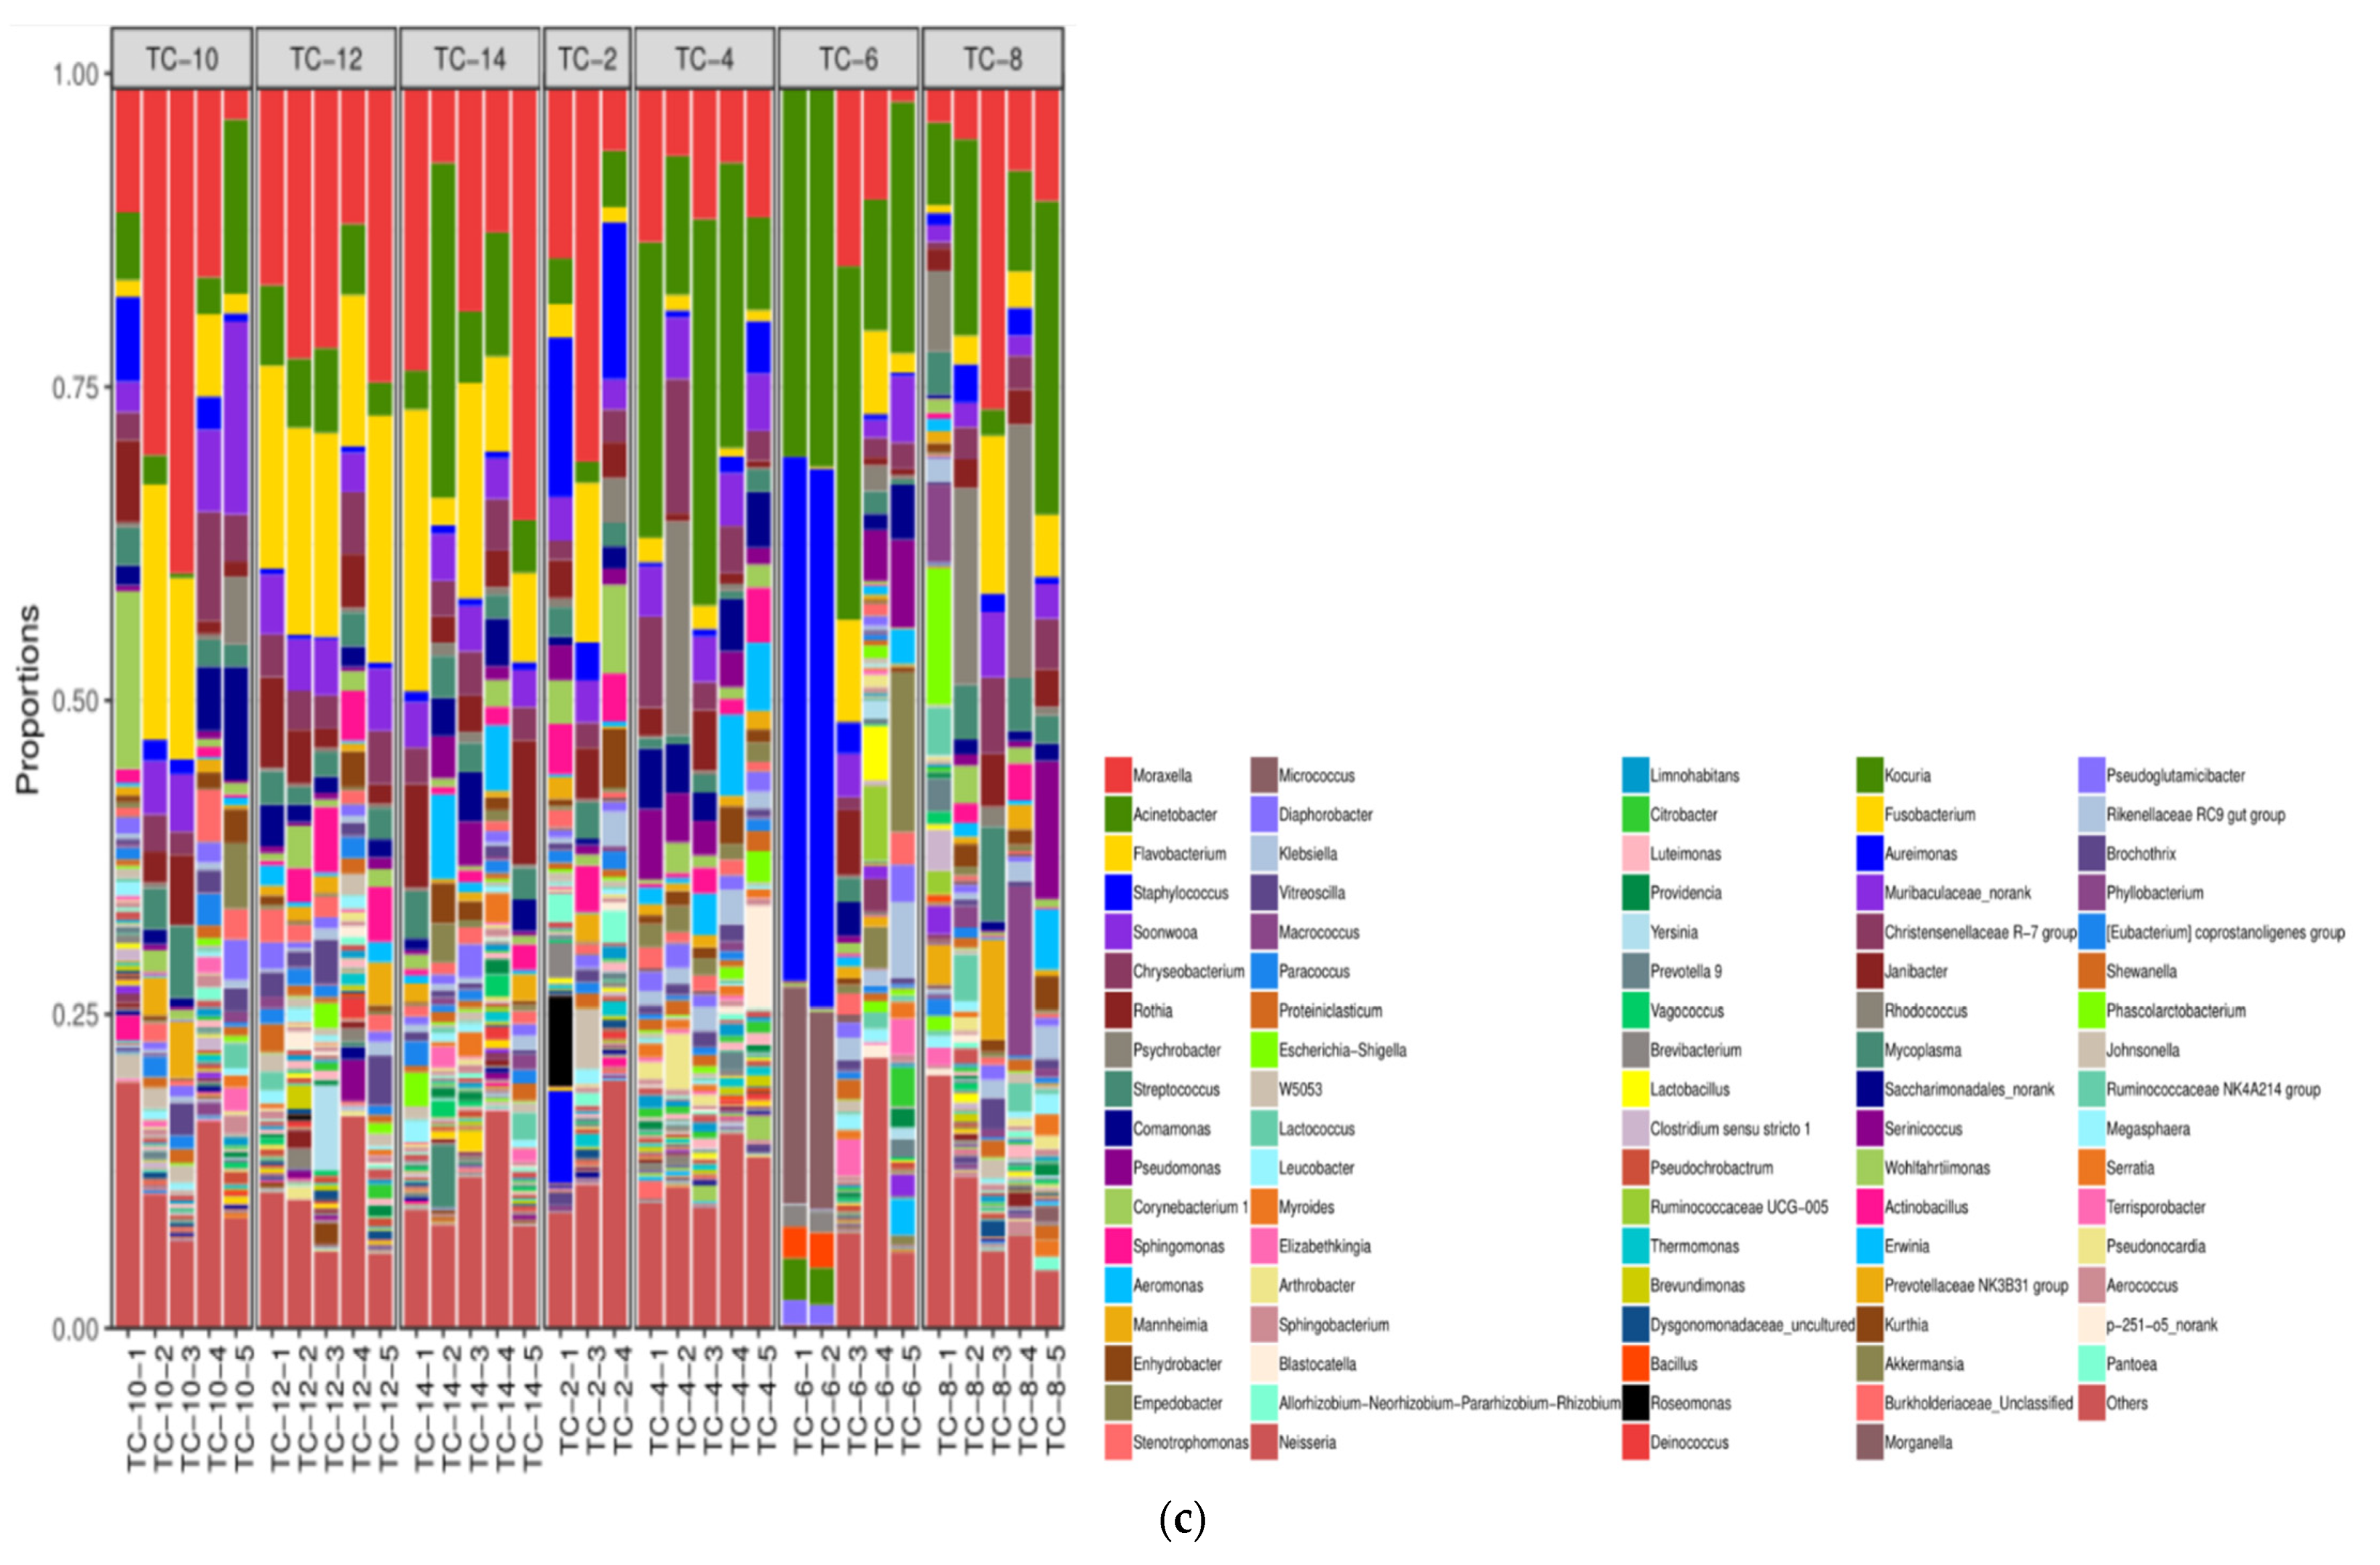
3.2.2. The Alterations in Microbiota Composition during Chilling
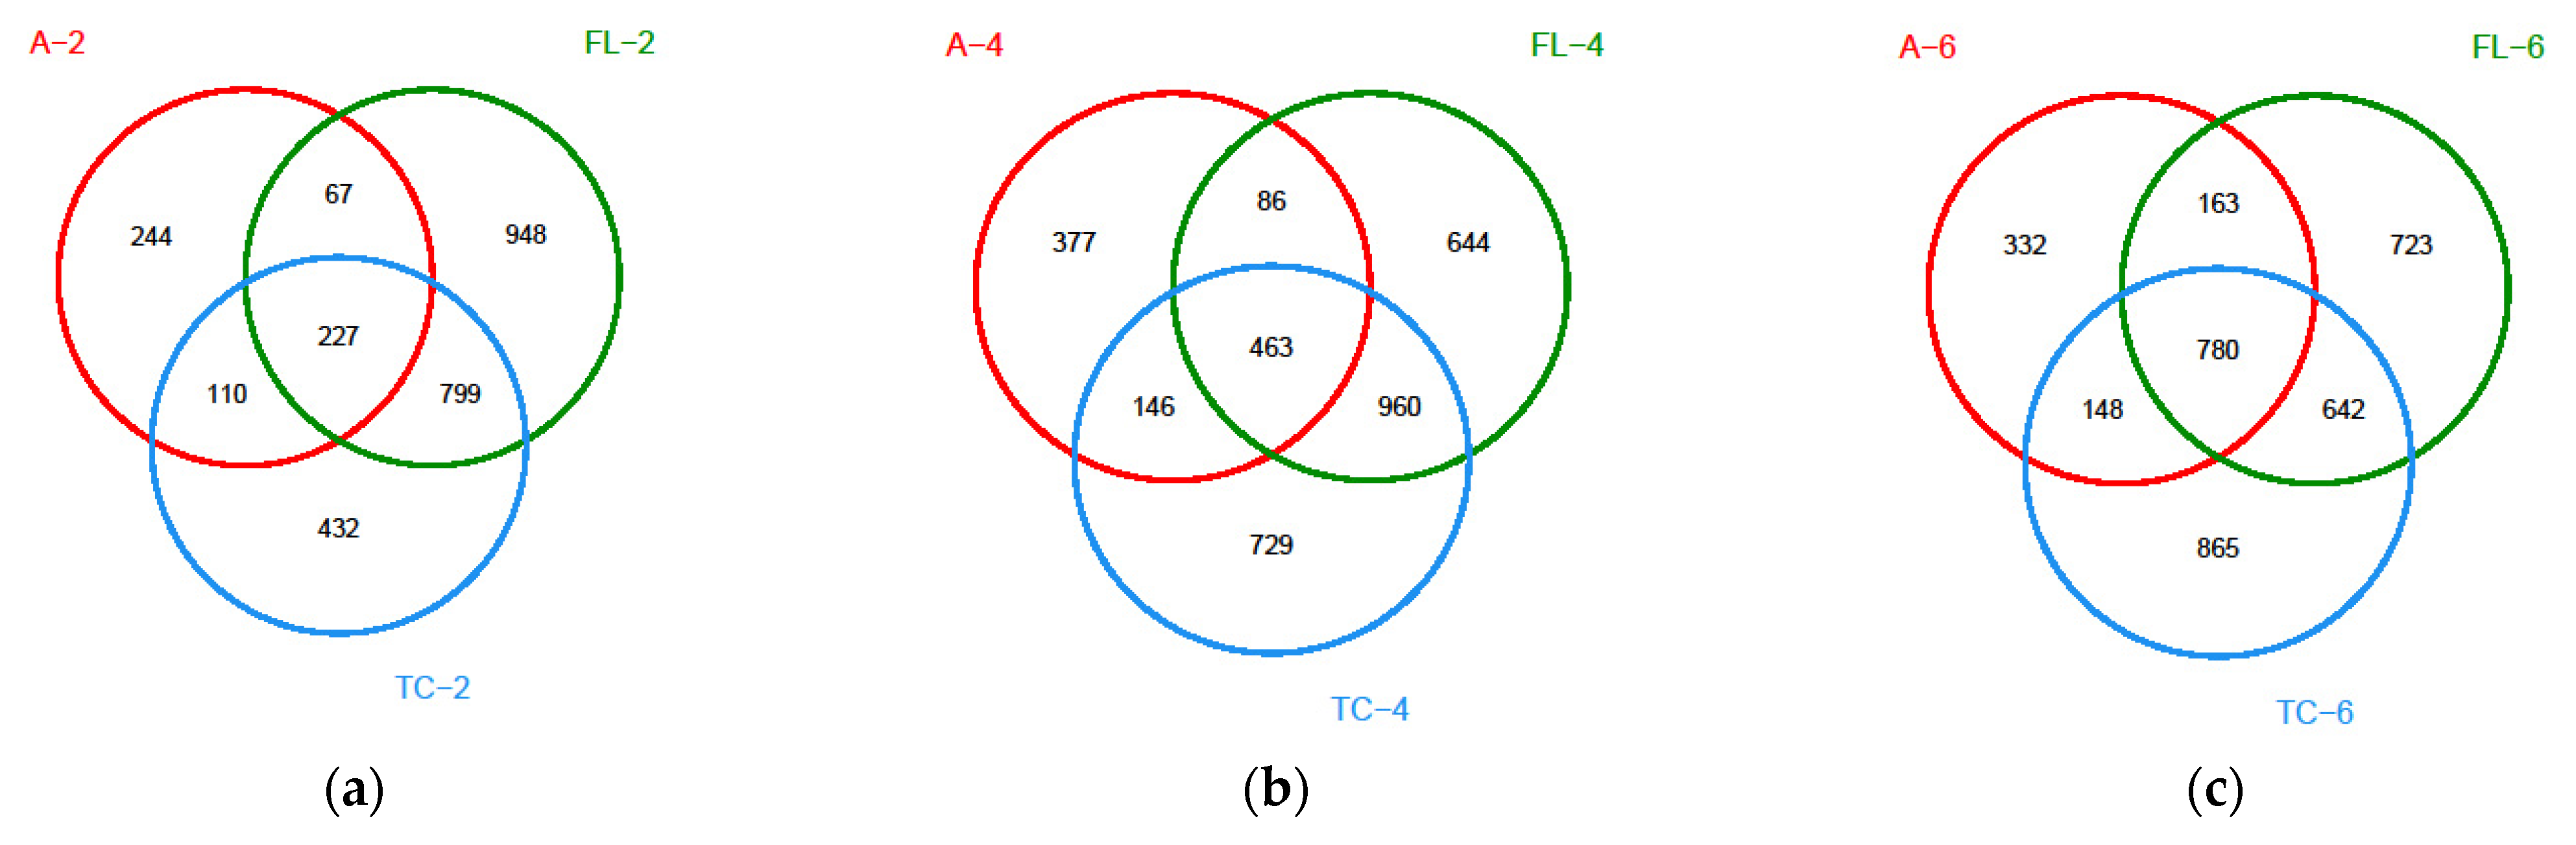
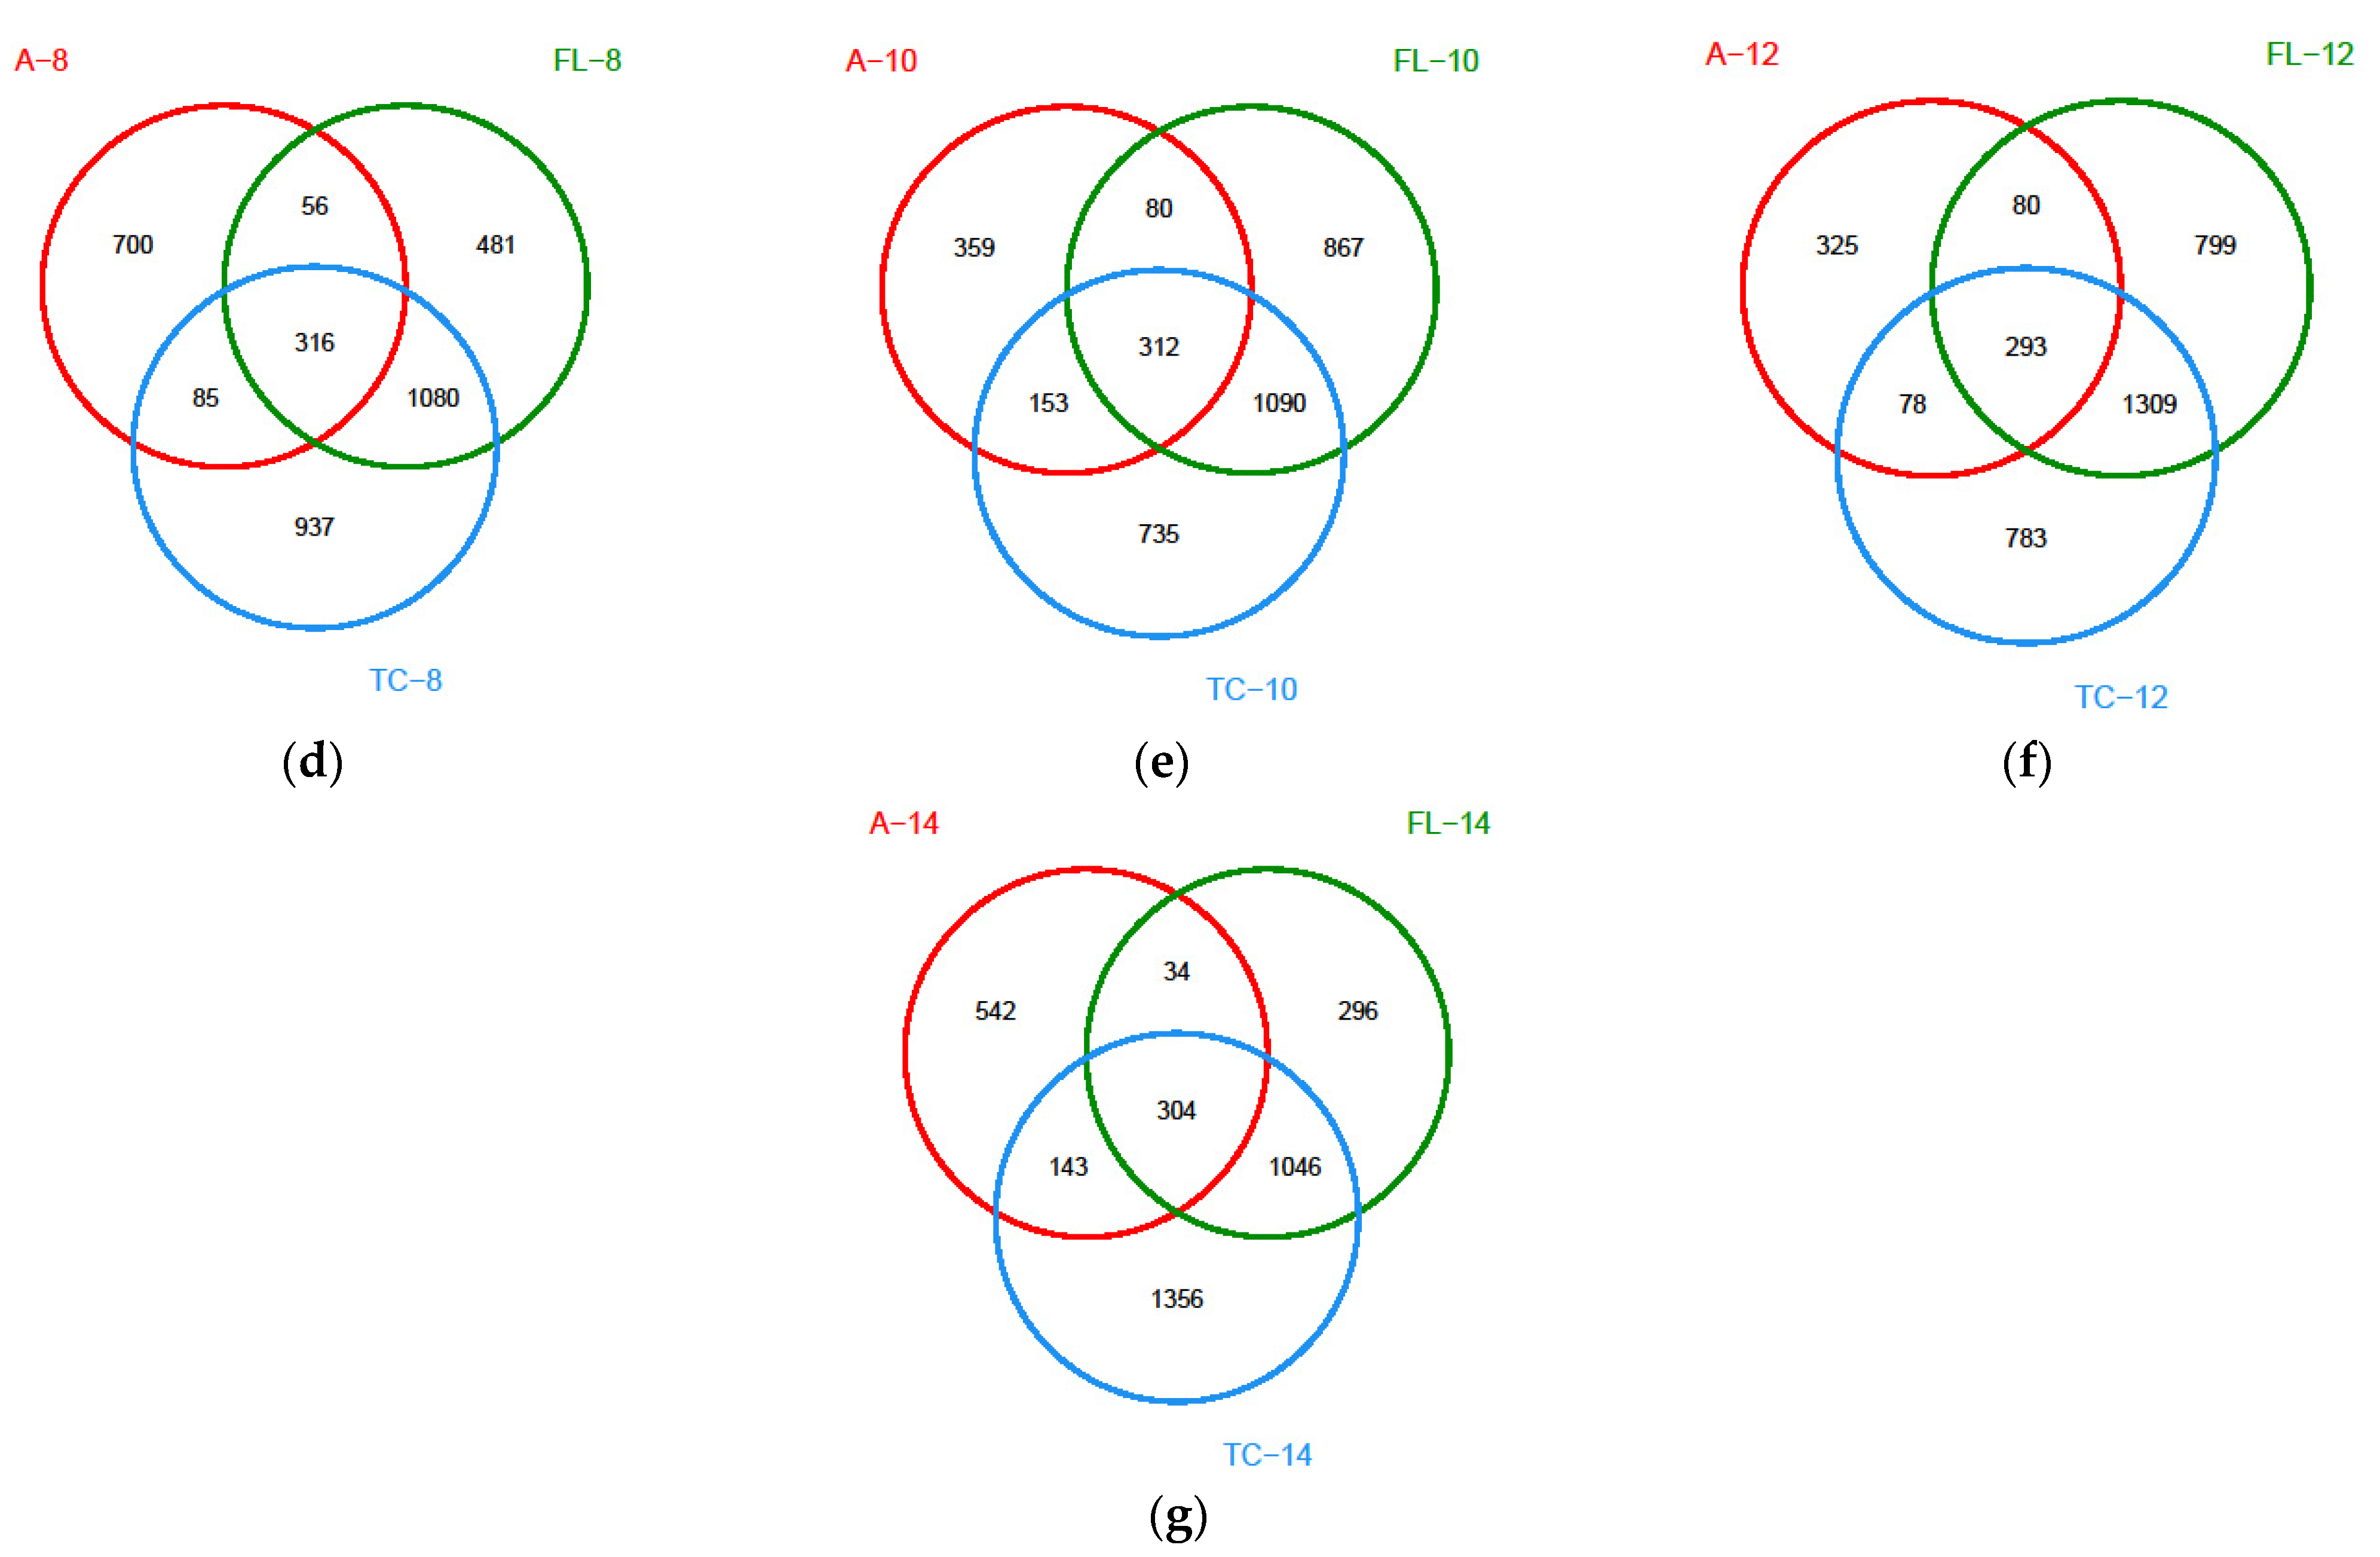
3.2.3. The Difference in the Microbiota Composition among Sampling Places
3.3. Drug-Resistant Genes in Microbiota Samples from the Air and the Surface of Pleural Cavity and Foreleg
3.3.1. Effect on the Number of Drug-Resistant Genes
3.3.2. Effect on the Abundance of Drug-Resistant Genes
4. Discussion
5. Conclusions
Author Contributions
Funding
Data Availability Statement
Acknowledgments
Conflicts of Interest
References
- Mccarthy, Z.; Smith, B.; Fazil, A.; Wu, J.; Ryan, S.D.; Munther, D. Individual based modeling and analysis of pathogen levels in poultry chilling process. Math. Biosci. 2017, 294, 172–180. [Google Scholar] [CrossRef] [PubMed] [Green Version]
- Liu, K.J.; Liu, G.H.; Tang, H.Y. Research and comparison of air supply for fan and fiber fabric. Refrig. Air Cond. 2019, 19, 19–23. [Google Scholar]
- Rui, W.Q. Flow Field and Numerical Simulation of the Mini-Panel Assembled Cold Storage. Master’s Thesis, North China Electric Power University, Beijing, China, 2012. [Google Scholar]
- Hu, Z.X.; Huang, S.; Gao, X. Influence of different air outlet on the cold storage temperature distribution. J. Guizhou Univ. 2016, 33, 39–41. [Google Scholar]
- Stephen, S.J.; James, C. Advances in the cold chain to improve food safety, food quality and the food supply chain. In Delivering Performance in Food Supply Chains; Mena, C., Stevens, G., Eds.; Woodhead Publishing: Sawston, UK, 2010; pp. 366–386. [Google Scholar]
- Stahl, V.; Ndoye, F.T.; El Jabri, M.; Le Page, J.F.; Hezard, B.; Lintz, A.; Geeraerd, A.; Alvarez, G.; Thuault, D. Safety and quality assessment of ready-to-eat pork products in the cold chain. J. Food Eng. 2015, 148, 43–52. [Google Scholar] [CrossRef]
- Che, H.; Li, C.; Zhu, L.; Zhou, G. Effects of chilling condition and time on evaporative loss of pork carcasses during chilling. Food Sci. 2016, 37, 242–246. [Google Scholar]
- McMullen, L.M.; Stiles, M.E. Potential for use of bacteriocin-producing lactic acid bacteria in the preservation of meats. J. Food Prot. 1996, 59, 64–71. [Google Scholar] [CrossRef]
- Benson, A.K.; David, J.R.D.; Gilbreth, S.E.; Smith, G.; Nietfeldt, J.; Legge, R.; Kim, J.; Sinha, R.; Duncan, C.E.; Ma, J.; et al. Microbial successions are associated with changes in chemical profiles of a model refrigerated fresh pork sausage during an 80-day shelf life study. Appl. Environ. Microbiol. 2014, 80, 5178–5194. [Google Scholar] [CrossRef] [PubMed] [Green Version]
- Doulgeraki, A.I.; Ercolini, D.; Villani, F.; Nychas, G.J. Spoilage microbiota associated to the storage of raw meat in different conditions. Int. J. Food Microbiol. 2012, 157, 130–141. [Google Scholar] [CrossRef] [PubMed]
- Chaillou, S.; Chaulot-Talmon, A.; Caekebeke, H.; Cardinal, M.; Christieans, S.; Denis, C.; Desmonts, M.H.; Dousset, X.; Feurer, C.; Hamon, E.; et al. Origin and ecological selection of core and food-specific bacterial communities associated with meat and seafood spoilage. ISME J. 2015, 9, 1105–1118. [Google Scholar] [CrossRef] [PubMed] [Green Version]
- Li, L.; Olsen, R.H.; Ye, L.; Yan, H.; Nie, Q.; Meng, H.; Shi, L. Antimicrobial resistance and resistance genes in aerobic bacteria isolated from pork at slaughter. J. Food Prot. 2016, 79, 589–597. [Google Scholar] [CrossRef]
- Haller, M.Y.; Müller, S.R.; Mcardell, C.S.; Alder, A.C.; Suter, M.J.F. Quantification of veterinary antibiotics (sulfonamides and trimethoprim) in animal manure by liquid chromatography–mass spectrometry. J. Chromatogr A 2002, 952, 111–120. [Google Scholar] [CrossRef]
- Economou, V.; Gousia, P. Agriculture and food animals as a source of antimicrobial-resistant bacteria. Infect. Drug Resist. 2015, 8, 49–61. [Google Scholar] [CrossRef] [Green Version]
- Cheng, W.; Chen, H.; Su, C.; Yan, S. Abundance and persistence of antibiotic resistance genes in livestock farms: A comprehensive investigation in eastern China. Environ. Int. 2013, 61, 1–7. [Google Scholar] [CrossRef]
- Zhu, Y.G.; Johnson, T.A.; Su, J.Q.; Qiao, M.; Guo, G.X.; Stedtfeld, R.D.; Hashsham, S.A.; Tiedje, J.M. Diverse and abundant antibiotic resistance genes in Chinese swine farms. Proc. Natl. Acad. Sci. USA 2013, 110, 3435–3440. [Google Scholar] [CrossRef] [PubMed] [Green Version]
- Tao, C.W.; Hsu, B.M.; Ji, W.T.; Hsu, T.K.; Kao, P.M.; Hsu, C.P.; Shen, S.M.; Shen, T.Y.; Wan, T.J.; Huang, Y.L. Evaluation of five antibiotic resistance genes in wastewater treatment systems of swine farms by real-time PCR. Sci. Total Environ. 2014, 496, 116–121. [Google Scholar] [CrossRef] [PubMed]
- Ho, P.L.; Wong, R.C.; Lo, S.W.; Chow, K.H.; Wong, S.S.; Que, T.L. Genetic identity of aminoglycoside-resistance genes in Escherichia coli isolates from human and animal sources. J. Med. Microbiol. 2010, 59, 702–707. [Google Scholar] [CrossRef] [PubMed]
- Qiao, M.; Chen, W.; Su, J.; Zhang, B.; Zhang, C. Fate of tetracyclines in swine manure of three selected swine farms in China. J. Environ. Sci. 2012, 24, 1047–1052. [Google Scholar] [CrossRef]
- Martinez, J.L. Antibiotics and antibiotic resistance genes in natural environments. Science 2008, 321, 365–367. [Google Scholar] [CrossRef]
- Wright, G.D. The antibiotic resistome: The nexus of chemical and genetic diversity. Nat. Rev. Microbiol. 2007, 5, 175–186. [Google Scholar] [CrossRef] [PubMed]
- Tang, Y. Application of Computational Fluid Dynamics to Air Flow Optimization for the Cold Store. Master’s Thesis, Shanghai Ocean University, Shanghai, China, 2013. [Google Scholar]
- Xie, J.; Qu, X.H.; Xu, S.Q. Numerical simulation and verification of airflow in cold-store. Trans. Chin. Soc. Agric. Eng. 2005, 21, 11–16. [Google Scholar]
- Li, M.Y.; Zhou, G.H.; Xu, X.L.; Li, C.B.; Zhu, W.Y. Changes of bacterial diversity and main flora in chilled pork during storage using PCR-DGGE. Food Microbiol. 2006, 23, 607–611. [Google Scholar] [CrossRef]
- Gill, C.O. Extending the storage life of raw chilled meats. Meat Sci. 1996, 43, 99–109. [Google Scholar] [CrossRef]
- Backhed, F.; Ley, R.E.; Sonnenburg, J.L.; Peterson, D.A.; Gordon, J.L. Host-bacterial mutualism in the human intestine. Science 2005, 307, 1915–1920. [Google Scholar] [CrossRef] [PubMed] [Green Version]
- Caporaso, J.G.; Lauber, C.L.; Costello, E.K.; Berg-Lyons, D.; Gonzalez, A.; Stombaugh, J.; Knights, D.; Gajer, P.; Ravel, J.; Fierer, N.; et al. Moving pictures of the human microbiome. Genome Biol. 2011, 12, R50. [Google Scholar] [CrossRef] [PubMed] [Green Version]
- Costello, E.K.; Lauber, C.L.; Hamady, M.; Fierer, N.; Gordon, J.I.; Knight, R. Bacterial community variation in human body habitats across space and time. Science 2009, 326, 1694–1697. [Google Scholar] [CrossRef] [Green Version]
- Faith, J.J.; Guruge, J.L.; Charbonneau, M.; Subramanian, S.; Seedorf, H.; Goodman, A.L.; Clemente, J.C.; Knight, R.; Heath, A.C.; Leibel, R.L.; et al. The long-term stability of the human gut microbiota. Science 2013, 341, 1237439. [Google Scholar] [CrossRef] [PubMed] [Green Version]
- Li, B.; Yang, Y.; Ma, L.; Ju, F.; Guo, F.; Tiedje, J.M.; Zhang, T. Metagenomic and network analysis reveal wide distribution and co-occurrence of environmental antibiotic resistance genes. ISME J. 2015, 9, 2490–2502. [Google Scholar] [CrossRef] [Green Version]
- He, L.Y.; Ying, G.G.; Liu, Y.S.; Su, H.C.; Chen, J.; Liu, S.S.; Zhao, J.L. Discharge of swine wastes risks water quality and food safety: Antibiotics and antibiotic resistance genes, from swine sources to the receiving environments. Environ. Int. 2016, 92, 210–219. [Google Scholar] [CrossRef] [PubMed]
- Fang, H.; Han, L.; Zhang, H.; Long, Z.; Cai, L.; Yu, Y. Dissemination of antibiotic resistance genes and human pathogenic bacteria from a pig feedlot to the surrounding stream and agricultural soils. J. Hazard. Mater. 2018, 357, 53–62. [Google Scholar] [CrossRef]
- Qian, X.; Gu, J.; Sun, W.; Wang, X.J.; Su, J.Q.; Stedfeld, R. Diversity, abundance, and persistence of antibiotic resistance genes in various types of animal manure following industrial composting. J. Hazard. Mater. 2017, 344, 716–722. [Google Scholar] [CrossRef]
- Kyselková, M.; Jirout, J.; Vrchotová, N.; Schmitt, H.; Elhottova, D. Spread of tetracycline resistance genes at a conventional dairy farm. Front. Microbiol. 2015, 6, 536. [Google Scholar] [CrossRef] [Green Version]
- Ma, L.; Xia, Y.; Li, B.; Yang, Y.; Li, L.G.; Tiedje, J.M.; Zhang, T. Metagenomic assembly reveals hosts of antibiotic resistance genes and the shared resistome in pig, chicken, and human feces. Environ. Sci. Technol. 2015, 50, 420–427. [Google Scholar] [CrossRef]
- Chee-Sanford, J.C.; Aminov, R.I.; Krapac, I.; Garrigues-Jeanjean, N.; Mackie, R.I. Occurrence and diversity of tetracycline resistance genes in lagoons and groundwater underlying two swine production facilities. Appl. Environ. Microbiol. 2001, 67, 1494–1502. [Google Scholar] [CrossRef] [Green Version]
- McKinney, C.W.; Loftin, K.A.; Meyer, M.T.; Davis, J.G.; Pruden, A. Tet and sul antibiotic resistance genes in livestock lagoons of various operation type, configuration, and antibiotic occurrence. Environ. Sci. Technol. 2010, 44, 6102–6109. [Google Scholar] [CrossRef] [PubMed]
- Knapp, C.W.; Dolfing, J.; Ehlert, P.A.; Graham, D.W. Evidence of increasing antibiotic resistance gene abundances in archived soils since 1940. Environ. Sci. Technol. 2009, 44, 580–587. [Google Scholar] [CrossRef] [PubMed]
- Gillings, M.R.; Stokes, H. Are humans increasing bacterial evolvability? Trends Ecol. Evol. 2012, 27, 346–352. [Google Scholar] [CrossRef] [PubMed]


| Gene | Forward | Reverse |
|---|---|---|
| 16S rRNA | GCTCGTGTCGTGAGATGTT | TGTAGCCCAGGTCATAAGG |
| sul Ⅰ | CACCGGAAACATCGCTGCA | AAGTTCCGCCGCAAGGCT |
| sul Ⅱ | CTCCGATGGAGGCCGGTAT | GGGAATGCCATCTGCCTTGA |
| blaSHV | AGCCGCTTGAGCAAATTAAAC | ATCCCGCAGATAAATCACCAC |
| blaTEM | CATTTCCGTGTCGCCCTTATTC | CGTTCATCCATAGTTGCCTGAC |
| ermA | AAGCGGTAAAACCCCTCGAG | TCAAAGCCTGTCGGATTGG |
| ermB | GAAAAGGTACTCAACCAAATA | CATTTGTTAAATTCATGGCAATGA |
| ermC | TCAAAACATAATATAGATAAA | GCTAATATTGTTTAAATCGTCAAT |
| qepA | AACTGCTTGAGCCCGTAGAT | GTCTACGCCATGGACCTCAC |
| blaCTX-M-2 | CGTTAACGGCACGATGAC | CGATATCGTTGGTGGTRCCAT |
| aac(6′)-Ib-cr | TTGCGATGCTCTATGAGTGGCTA | CTCGAATGCCTGGCGTGTTT |
| tetA | GCTACATCCTGCTTGCCTTC | CATAGATCGCCGTGAAGAGG |
| tetC | CTTGAGAGCCTTCAACCCAG | ATGGTCGTCATCTACCTGCC |
| tetM | GTGGACAAAGGTACAACGAG | CGGTAAAGTTCGTCACACAC |
| qnrA | AGAGGATTTCTCACGCCAGG | TGCCAGGCACAGATCTTGAC |
| Chilling Time/h | Outlet Temperature/°C | Outlet Humidity/% | Door Temperature/°C | Door Humidity/% | Number of Grids/Piece | Grid Type |
|---|---|---|---|---|---|---|
| 0 h | 8 | 97 | 10 | 98 | 786,360 | Structured |
| 2 h | 10 | 94 | 12 | 99 | 1,848,737 | Unstructured |
| 4 h | 11 | 97 | 12 | 99 | 1,934,154 | Unstructured |
| 6 h | 12 | 98 | 13 | 100 | 2,424,042 | Unstructured |
| 8 h | 12 | 98 | 13 | 100 | 2,638,668 | Unstructured |
| 10 h | 10 | 86 | 10 | 86 | 2,638,668 | Unstructured |
| 12 h | 6 | 83 | 6 | 83 | 2,638,668 | Unstructured |
| 14 h | 3 | 74 | 3 | 74 | 2,638,668 | Unstructured |
| Time/h | Wind Speed (Air flow) | Temperature | Humidity |
|---|---|---|---|
| 0 h | 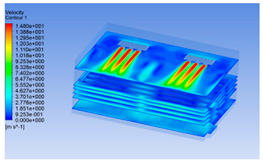 | 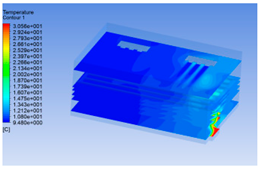 | 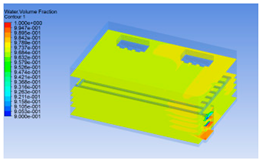 |
| 2 h |  |  |  |
| 4 h |  | 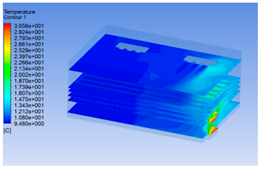 |  |
| 6 h |  |  |  |
| 8 h | 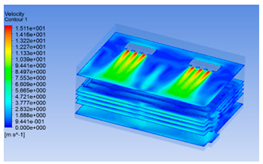 |  |  |
| 10 h | 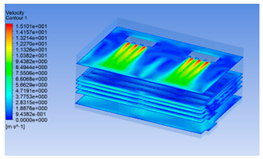 | 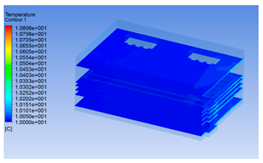 | 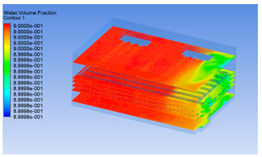 |
| 12 h | 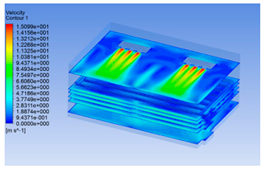 | 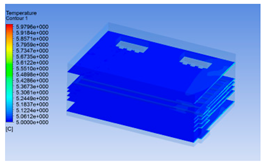 |  |
| 14 h | 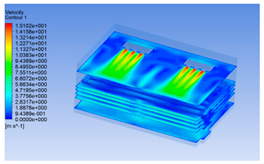 | 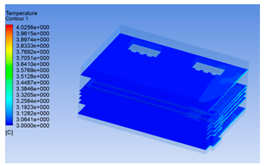 |  |
| Locations | Time/h | sul Ⅰ | sul Ⅱ | blaSHV | blaTEM | ermA | ermB | ermC | qepA | blaCTX-M-2 | aac(6′)-Ib-cr | tetA | tetC | tetM | qnrA |
|---|---|---|---|---|---|---|---|---|---|---|---|---|---|---|---|
| Airborne | 0 h | +/+/+ | +/+/+ | -/+/- | +/+/+ | -/+/+ | -/-/- | -/-/- | +/+/+ | -/+/+ | +/-/+ | +/+/+ | +/+/- | -/+/+ | +/-/+ |
| 2 h | +/+/+ | +/+/+ | +/+/- | +/+/+ | +/+/+ | -/-/- | -/-/- | +/+/+ | +/+/+ | +/+/- | +/+/+ | +/+/- | -/-/+ | +/+/+ | |
| 4 h | +/+/+ | +/+/- | -/-/- | +/+/+ | +/+/+ | -/-/- | -/-/- | +/+/+ | +/+/+ | -/-/- | +/+/+ | +/+/+ | +/-/+ | +/+/+ | |
| 6 h | +/+/+ | +/+/+ | -/+/+ | +/+/+ | +/+/+ | -/-/- | -/-/- | +/+/+ | +/+/+ | +/+/+ | +/+/+ | +/+/+ | -/+/+ | +/+/+ | |
| 8 h | +/+/+ | +/+/+ | -/+/- | +/+/+ | -/-/+ | -/+/- | -/-/- | +/+/+ | +/+/+ | +/+/+ | +/+/+ | +/+/+ | -/+/+ | +/+/+ | |
| 10 h | +/+/+ | +/+/+ | -/+/+ | +/+/+ | +/+/+ | -/-/+ | -/-/- | +/+/+ | +/+/+ | -/+/+ | +/+/+ | +/+/+ | +/+/+ | +/+/+ | |
| 12 h | +/+/+ | +/+/+ | -/-/- | -/+/+ | +/+/+ | -/-/+ | -/-/- | +/+/+ | +/+/+ | +/+/+ | +/+/+ | -/+/+ | -/+/+ | +/+/+ | |
| 14 h | +/+/+ | +/+/+ | -/+/- | -/+/- | -/-/- | -/+/- | -/-/- | +/+/+ | +/+/+ | -/+/- | +/+/+ | +/+/- | -/+/- | +/-/- | |
| Pleural cavity | 2 h | +/+/+ | +/+/+ | +/+/+ | +/-/- | +/+/+ | -/-/+ | -/-/- | +/+/- | -/+/+ | +/+/+ | +/+/+ | +/+/+ | +/+/+ | +/+/- |
| 4 h | +/+/+ | +/+/+ | +/+/- | +/+/+ | +/+/+ | -/+/- | -/-/- | +/+/+ | +/+/+ | +/+/- | +/+/+ | +/+/+ | -/+/+ | +/+/+ | |
| 6 h | +/+/+ | +/+/+ | +/+/- | +/+/+ | +/-/+ | -/-/- | -/-/- | +/+/+ | +/+/+ | +/+/+ | +/+/+ | +/+/- | +/+/- | +/+/+ | |
| 8 h | +/+/+ | +/+/+ | +/-/- | +/+/+ | +/+/+ | -/-/- | -/-/- | +/+/+ | +/+/+ | -/+/- | +/+/+ | +/+/+ | +/+/+ | +/+/+ | |
| 10 h | +/+/+ | +/+/+ | -/+/+ | +/+/+ | -/-/+ | +/-/- | -/-/- | +/+/+ | +/+/+ | +/+/- | +/+/+ | +/+/+ | +/-/+ | +/+/+ | |
| 12 h | +/+/+ | +/+/+ | -/+/- | -/+/+ | +/+/+ | -/+/- | -/-/- | +/+/+ | +/+/+ | +/+/- | +/+/+ | +/+/+ | +/+/+ | +/+/+ | |
| 14 h | +/+/+ | +/+/+ | +/-/- | +/+/+ | +/+/+ | -/-/- | -/-/- | +/-/+ | +/+/+ | -/-/+ | +/+/+ | +/+/+ | +/+/+ | +/-/+ | |
| Foreleg | 2 h | +/+/+ | +/+/+ | -/-/- | -/-/+ | -/-/+ | -/-/+ | -/-/- | -/-/- | +/-/+ | +/+/+ | +/+/+ | -/+/+ | -/-/- | +/-/- |
| 4 h | +/+/+ | +/+/+ | -/+/- | -/+/+ | +/+/+ | -/-/- | -/-/- | +/+/+ | +/+/+ | -/-/- | +/+/+ | +/-/+ | +/-/+ | +/+/+ | |
| 6 h | +/+/+ | +/+/+ | -/-/- | +/+/+ | +/+/+ | -/-/- | -/-/- | +/+/+ | +/+/+ | -/+/+ | +/+/+ | +/+/+ | +/+/+ | -/+/+ | |
| 8 h | +/+/+ | +/+/+ | -/-/- | +/+/+ | +/-/+ | +/+/+ | -/-/- | +/+/+ | +/-/+ | +/-/+ | +/+/+ | +/+/+ | +/+/+ | +/+/+ | |
| 10 h | +/+/+ | +/+/+ | -/-/+ | -/+/+ | +/+/- | -/+/- | -/-/- | +/-/+ | +/+/+ | -/-/- | +/+/+ | +/+/+ | +/+/+ | +/+/+ | |
| 12 h | +/+/+ | +/+/+ | +/-/- | -/+/- | +/+/+ | -/+/+ | -/-/- | -/+/- | +/+/+ | +/+/- | +/+/+ | +/+/+ | +/-/+ | +/+/- | |
| 14 h | +/+/+ | +/+/+ | -/+/- | -/-/- | +/-/- | -/-/+ | -/-/- | +/-/- | +/+/+ | -/-/- | +/+/+ | +/+/+ | +/-/- | -/-/+ |
| Locations | Time/h | sul Ⅰ | sul Ⅱ | blaSHV | blaTEM | ermA | qepA | blaCTX-M-2 | aac(6′)-Ib-cr | tetA | tetC | tetM | qnrA |
|---|---|---|---|---|---|---|---|---|---|---|---|---|---|
| airborne | 0 h | 1.000 Aa | 1.000 Aa | — | 1.000 Ba | 1.000 Ca | 1.000 Aa | 1.000 Aa | 1.000 Aa | 1.000 Ba | 1.000 Aa | 1.000 Aa | 1.000 Aa |
| 2 h | 0.001 Eg | 0.002 Ff | 0.001 Cg | 0.029 Ec | 0.394 Ea | 0.000 Ch | 0.001 Eg | 0.002 Df | 0.021 Fd | 0.047 Db | — | 0.008 Ee | |
| 4 h | 0.360 Ce | 0.025 Cj | — | 1.261 Ac | 3.228 Ab | 0.110 Bh | 0.076 Bi | — | 4.736 Aa | 0.375 Bd | 0.211 Bf | 0.189 Bg | |
| 6 h | 0.017 Dg | 0.002 Fj | 0.004 Bi | 0.119 Dc | 0.465 Da | 0.000 Ck | 0.013 Dh | 0.027 Be | 0.033 Ed | 0.171 Cb | 0.022 Cf | 0.022 Df | |
| 8 h | 0.000 Fd | 0.105 Ba | — | 0.005 Gb | — | 0.000 Cd | 0.000 Fd | 0.000 Fd | 0.000 Hd | 0.000 Hd | 0.000 Ed | 0.004 Fc | |
| 10 h | 0.391 Bc | 0.011 Dj | 0.006 Ak | 0.948 Cb | 2.415 Ba | 0.000 Cl | 0.020 Cg | 0.025 Cf | 0.181 Cd | 0.013 Eh | 0.012 Di | 0.085 Ce | |
| 12 h | 0.001 Eg | 0.010 Ec | — | 0.028 Fa | 0.025 Fb | 0.000 Ch | 0.001 Eg | 0.001 Eg | 0.008 Gd | 0.005 Fe | 0.000 Eh | 0.002 Gf | |
| 14 h | 0.000 Fd | 0.025 Cb | — | — | — | 0.000 Cd | 0.001 Ec | — | 0.034 Da | 0.001 Gc | — | — | |
| Pleural cavity | 2 h | 1.000 Ba | 1.000 Fa | 1.000 Aa | — | 1.000 Da | 1.000 Ba | 1.000 Aa | 1.000 Ba | 1.000 Fa | 1.000 Ba | 1.000 Ba | 1.000 Ca |
| 4 h | 0.636 Ci | 3.283 Ad | 0.879 Bh | 0.328 Al | 19.569 Aa | 0.600 Cj | 0.511 Bk | 2.333 Ae | 15.653 Ab | 12.966 Ac | 1.293 Ag | 1.761 Bf | |
| 6 h | 0.087 Fa | 0.000 Gc | 0.000 Dc | 0.000 Fc | 0.000 Fc | 0.000 Gc | 0.001 Gb | 0.000 Ec | 0.001 Gb | 0.000 Gc | 0.000 Gc | 0.001 Gb | |
| 8 h | 0.030 Gh | 1.716 Db | — | 0.022 Ei | 0.148 Ed | 0.057 Df | 0.050 Fg | — | 8.528 Ba | 0.016 Fj | 0.125 De | 0.190 Ec | |
| 10 h | 1.162 Ad | 1.874 Bc | 0.131 Ch | 0.260 Bf | — | 1.102 Ae | 0.164 Dg | 0.120 Di | 2.939 Ca | 0.049 Ek | 0.075 Fj | 2.304 Ab | |
| 12 h | 0.323 De | 1.522 Ec | — | 0.209 Cf | 1.847 Cb | 0.046 Ek | 0.108 Eh | 0.158 Cg | 1.882 Ea | 0.060 Dj | 0.092 Ei | 0.944 Dd | |
| 14 h | 0.211 Ee | 1.821 Cc | — | 0.068 Di | 5.890 Ba | 0.011 Fj | 0.207 Cf | — | 2.396 Db | 0.156 Ch | 0.313 Cd | 0.159 Fg | |
| Foreleg | 2 h | 1.000 Fa | 1.000 Ga | — | — | — | — | 1.000 Aa | 1.000 Aa | 1.000 Ea | 1.000 Aa | — | — |
| 4 h | 1.341 Cc | 5.474 Fa | — | 0.051 Ag | 0.216 Ae | — | 0.453 Cd | — | 2.674 Bb | 0.008 Bh | — | 0.085 Af | |
| 6 h | 1.131 Db | 12.416 Ba | — | 0.009 Ch | 0.160 Cd | — | 0.087 Ee | 0.018 Cf | 0.922 Fc | 0.000 Di | — | 0.011 Cg | |
| 8 h | 0.559 Gc | 7.694 Da | — | 0.001 Df | 0.003 Ed | — | 0.001 Gf | 0.001 Df | 0.675 Gb | 0.000 Dg | — | 0.002 Ee | |
| 10 h | 1.016 Ec | 14.536 Aa | — | 0.014 Bf | 0.178 Bd | — | 0.051 Fe | — | 1.856 Cb | 0.000 Dh | — | 0.006 Dg | |
| 12 h | 3.631 Ab | 9.891 Ca | — | — | 0.126 Df | — | 0.616 Bd | 0.146 Be | 1.240 Dc | 0.001 Ch | — | 0.024 Bg | |
| 14 h | 1.954 Bc | 6.620 Ea | — | — | — | — | 0.115 Dd | — | 3.131 Ab | 0.000 De | — | — |
Publisher’s Note: MDPI stays neutral with regard to jurisdictional claims in published maps and institutional affiliations. |
© 2021 by the authors. Licensee MDPI, Basel, Switzerland. This article is an open access article distributed under the terms and conditions of the Creative Commons Attribution (CC BY) license (https://creativecommons.org/licenses/by/4.0/).
Share and Cite
Jia, X.; Nian, Y.; Zhao, D.; Wu, J.; Li, C. Changes of the Microbiota Composition on the Surface of Pig Carcasses during Chilling and Its Associations with Alterations in Chiller’s Temperature and Air Humidity. Foods 2021, 10, 2195. https://doi.org/10.3390/foods10092195
Jia X, Nian Y, Zhao D, Wu J, Li C. Changes of the Microbiota Composition on the Surface of Pig Carcasses during Chilling and Its Associations with Alterations in Chiller’s Temperature and Air Humidity. Foods. 2021; 10(9):2195. https://doi.org/10.3390/foods10092195
Chicago/Turabian StyleJia, Xiaonan, Yingqun Nian, Di Zhao, Juqing Wu, and Chunbao Li. 2021. "Changes of the Microbiota Composition on the Surface of Pig Carcasses during Chilling and Its Associations with Alterations in Chiller’s Temperature and Air Humidity" Foods 10, no. 9: 2195. https://doi.org/10.3390/foods10092195