Article

Removal of Ochratoxin A from Grape Juice by Clarification: A Response Surface Methodology Study

1
Nutrition Health Research Center, Hamadan University of Medical Sciences, Hamadan 6517659947, Iran
2
Department of Food Science and Nutrition, Faculty of Food Engineering, University of Campinas (UNICAMP), Campinas 13083-862, Brazil
*
Authors to whom correspondence should be addressed.
Foods 2022, 11(10), 1432; https://doi.org/10.3390/foods11101432
Submission received: 9 April 2022 / Revised: 6 May 2022 / Accepted: 10 May 2022 / Published: 16 May 2022
(This article belongs to the Special Issue Food Mycotoxins and Related Toxicology Research)

Abstract

:
This study achieved maximum removal of ochratoxin A (OTA) during the grape juice clarification process with minimal reduction in antioxidant compounds (phenolic acid, flavonoids, and antioxidant capacity by FRAP) by the RSM method. Independent variables included three types of clarifiers—gelatin, bentonite, and diatomite (diatomaceous earth)—at a concentration level of 0.25–0.75% and clarification time of 1–3 h. OTA was measured by high-performance liquid chromatography with fluorescence detection. Clarifying agent concentration and clarification time affected the reduction amount of OTA and antioxidant compounds in grape juice. There was a direct linear correlation between the reduction amounts of OTA and antioxidant compounds and capacity with the concentration of bentonite, gelatin, and diatomite, and the clarification time. The reduction amount of OTA and antioxidant capacity followed the linear mode. However, the decreased phenolic acid and flavonoid values followed the quadratic model. The study results showed that if the concentrations of bentonite, gelatin, and diatomite and clarification time were 0.45, 0.62, 0.25%, and 1 h, respectively, the maximum amount of OTA reduction (41.67%) occurred. Furthermore, the phenolic acid, flavonoid, and antioxidant activity decrease amounts were at their lowest levels, i.e., 23.86, 7.20, and 17.27%, respectively.

1. Introduction

Fruits and vegetables are the main components of the human diet, mainly cultivated in different regions [1]. Today, the tendency to consume fruit-derived products such as grape juice is growing because they are a good source of sugars (fructose, glucose), organic acids (tartaric acid, malic acid, citric acid), minerals (Cu, Fe, Mn), phenolics (catechin, malvidin 3,5-diglucoside, Cyanidin-3,5-diglucoside), and vitamins [2,3,4,5,6]. In addition, they contain various antioxidants, which play a vital role in human health and disease risk decreases, such as cancer and cardiovascular diseases [7,8]. In 2017, the global consumption of fruit juices was estimated at 35 billion liters [9].
The high sugar levels in grapes cause this product to be spoiled by various fungi, such as mycotoxin-producing molds [5,10]. Therefore, despite the critical role of grapes in humans’ diet and health, one of the greatest concerns is the contamination of these foodstuffs with different types of mycotoxins. The different types of mycotoxin include ochratoxin A (OTA), patulin, aflatoxins, citrinin alternariol, and tenuazonic acid, and fumonisin B2 might be created during fungi growth on grapes [11]. However, OTA is the most critical mycotoxin, and its occurrence has been reported in grapes and products obtained from grapes, such as grape juice, raisins, pekmez, and wine [12,13,14,15].
OTA is a secondary metabolite produced by specific fungi species, including Aspergillus and Penicillium [16]. OTA has also been categorized as a group 2B carcinogen for humans by the International Agency for Research on Cancer [17]. Various toxic effects of OTA on human health have been reported, such as teratogenic, carcinogenic, mutagenic, neurotoxic, hepatotoxic, and immunotoxic effects [14,18]. Furthermore, OTA causes various human nephropathies, including Balkan Endemic Nephropathy (BEN) and chronic interstitial nephropathy (CIN) in humans, and increases lipid peroxidation, inhibiting macromolecular synthesis and the inhibition of mitochondrial respiration [19,20].
The presence of OTA in grape-derived products is reported in many countries, where the content is related to cultivation, transportation, and storage [13,14,17,21]. Due to the high contamination of grape OTA, the maximum level for this mycotoxin in products such as wine, wine-based drinks, and grape juice is considered 2.0 µg/kg [22]. In order to remove OTA from contaminated foodstuffs, different strategies, such as physical, chemical, and biological methods, have been suggested [23]. The physical methods are uneconomical [24]. The residue of synthetic chemicals and fungicides applied for OTA control has harmful impacts on human health [25]. In biological methods, although metabolized OTA forms created by S. cerevisiae are less toxic, they may be converted to OTA in the digestive system [26].
The application of adsorbents is the most common practice for OTA reduction [27]. The reduction of OTA by bentonite, gelatin, and diatomite was reported in previous studies [12,28,29]. In addition to OTA removal, these clarifiers might decrease antioxidant compounds [30,31,32,33]. As antioxidant compound removal could decrease the nutritional value of grape juice, it is necessary to optimize the applied clarifier level to decrease the highest level of OTA. In contrast, antioxidant compound amounts did not change or had a low loss. This study aimed to optimize bentonite, gelatin, and diatomite levels and clarify the time for obtaining the highest removal of OTA and lowest reduction in antioxidant components and capacity.

2. Materials and Methods

2.1. Materials

A grape sample (Askari cultivar) was collected from a garden in Hamadan (Iran). OTA, 2,4,6-Tris(2-pyridyl)-s-triazine (TPTZ), Folin–Ciocalteu reagent, gallic acid, and catechin were supplied by Sigma (St Louis, MO, USA). Sodium carbonate, phosphate-buffered saline (PBS), sodium nitrate, methanol, sodium acetate, aluminum chloride, ferric chloride, sodium hydroxide, hydrochloric acid, acetonitrile, ferrous sulphate, and other chemicals were supplied by Merck (Darmstadt, Germany). Immunoaffinity columns (IAC) were bought from Libios (Pontcharra-Sur-Turdine, France). Bentonite was bought from Mojallali Inc. (Tehran, Iran). Gelatin by Diaco (Tehran, Iran) and diatomite earth were supplied by Neutron (Tehran, Iran). A Millipore Milli-Q purification system (Millipore, Milford, CT, USA) was used to prepare ultra-pure water.

2.2. Grape Juice Preparation

First, the OTA concentration in collected grape samples was measured according to the method mentioned below. The OTA content of grape specimens was lower than the limit of detection (LOD). Then, grape samples were washed. For washing, grape samples (5 kg) were immersed in 10 L of tap water for 10 min. Furthermore, they were placed on a steel strainer to dry. Then, they were crushed and pressed by juicing mashing (Pars Khazar, Tehran, Iran) to obtain grape juice.
For grape skin and seed removal, grape juice was filtered through Whatman No. 2 filter paper. For this study, OTA was spiked into filtered grape juice at a concentration of 5 µg/L. The initial concentration of OTA was considered fixed based on the instrument limitation.

2.3. Addition of Clarifier to Grape Juice

As shown in Table 1, three types of clarifiers, i.e., bentonite, gelatin, and diatomite earth, were added to grape juice at different levels (0.25, 0.5, and 0.75% w/v) and agitated for 10 min by a magnetic stirrer (MTOPS, HS15-03P model, Korea). Samples were placed at ambient temperature for different times (1, 2, and 3 h). Couples were passed through Whatman filter paper (No. 2).

2.4. OTA Clean-Up and Measurement

Before analysis, unclarified grape juice and clarified grape juice samples were stirred entirely. The OTA extraction and analysis method was similar to our previous study, with slight modifications [34]. First, methanol (25 mL), deionized water (160 mL), and NaCl (2.5 g) were added to 40 mL juice samples and they were stirred for 10 min by a magnetic stirrer. Then, they were filtered through Whatman No. 1 filter paper. Twenty-five mL of filtrated sample was mixed with PBS (125 mL). Samples were centrifuged at 1252 g, for 10 min (Hettich, Tuttlingen, Germany). Fifty mL of the centrifuged specimen was passed through IAC. OTA was eluted with methanol (1 mL). The volume of collected fluid was increased to 2 mL with methanol. In the final step, 50 µL was injected into the HPLC instrument.

2.5. Apparatus of OTA Analysis

OTA’s determination and quantity measurement was performed by an HPLC system (Milford, MA, USA) equipped with a binary pump and fluorescence detector (model 2475, Milford, MA, USA). OTA separation was carried out on a reversed phase C18 column (ODC) (250 mm × 4.6 mm, i.d., 5 µm) at 25 °C. The mobile phase utilized for OTA analysis was composed of a water, acetonitrile, and methanol mixture (5:3:2, v/v/v) and delivered to HPLC at a 1 mL/min rate under isocratic elution conditions. The measurement of OTA in the fluorescence detector was carried out at the wavelength of excitation of 335 nm and the wavelength of 465 nm.

2.6. Validation of the OTA Analysis

To validate the OTA analysis method, linearity, accuracy, precision, and sensitivity were determined. The limit of detection (LOD) and the limit of quantification (LOQ) were determined to identify the method’s sensitivity. The signal-to-noise ratios of 3:1 and 10:1 were considered for LOD and LOQ estimation. To obtain the analysis method’s accuracy, the recovery of OTA was measured. At first, the blank grape juice samples were spiked with OTA at 2.5, 5, and 10 µg/kg concentration levels. Then, OTA was extracted according to the method above. The recovery was calculated according to the following equation:
Recovery (%) = found OTA concentration/spiked OTA concentration × 100
The recovery test was repeated three times, and the relative standard deviation of three runs was calculated to show intra-day precision. For inter-day precision determination, the recovery test was performed on three consecutive days, and the relative standard deviation of nine repeats was calculated. To determine the linearity of the analysis method, the calibration curves were constructed using the peak area ratio of working standard solutions of OTA prepared at concentration levels of 0.1–25 µg/kg and analyzed by HPLC versus OTA concentration.

2.7. Measurement of Total Phenolic Acid Content

The total phenolic acid content (TPC) of the grape juice samples was determined according to the method suggested by Pankaj and Wan (2017) in a previous study [35]. Briefly, 0.5 mL of standard solution or sample was mixed with 1 mL of Folin–Ciocalteu reagent. After 6 min of incubation at room temperature, 2 mL of sodium carbonate solution (20%) was added. The mixture was placed for 60 min at 30 °C. Finally, the absorbance of the samples was recorded at 760 nm against the blank using a spectrophotometer (Shimadzu UV–Vis Mini 1240, Tokyo, Japan). The TPC was determined by a suitable calibration curve (6.25–100 μg/mL) and reported as μg of gallic acid equivalents/mL [35].

2.8. Measurement of Total Flavonoid Content

The method described by Pankaj et al. (2017) was used for determining the total flavonoid content (TFC) of samples [35]. At first, 0.25 mL of grape juice was mixed with 1.25 mL of deionized water and 75 μL of 5% sodium nitrate solution. After 6 min at room temperature, 150 μL of aluminum chloride solution (10%) was added to the mixture, and after 5 min, 0.5 mL of sodium hydroxide (1 M) was also added. Distilled water was used to adjust the total volume to 2.5 mL, and absorbance was observed at 415 nm by a spectrophotometer. The results were calculated and expressed as μg of catechin equivalents/mL using the calibration curve created from 12.5 to 100 μg/mL [35].

2.9. Antioxidant Capacity Measurement

The antioxidant potential of grape juice samples was measured via the Ferric Reducing Antioxidant Power Assay (FRAP) method described by Langley-Evans et al. (2000), with minor modifications [36]. Fresh FRAP reagent was composed of three solutions: acetate buffer (300 mmol/L) (pH 3.6), ferric chloride solution (20 mmol/L), and a solution of TPTZ (10 mmol/L) diluted in hydrochloric acid (40 mmol/L) at the ratio of 10:1:1 (v/v/v). Moreover, 50 µL of standard solution or grape juice to 700 µL reagent was added. In order to complete the reaction, the mixture was incubated for 5 min at 37 °C. Finally, the absorbance via a spectrophotometer was determined at 593 nm against a blank. The antioxidant power of the samples was detected from a plotted standard curve (62.5–1000 µM) and reported as µmoles of ferrous sulfate equivalents/L [36].

2.10. Experimental Design and Statistical Analysis of Data

Design of experiments and statistical analysis was performed using Design Expert 7.0.0 (Stat-Ease Inc., Minneapolis, Minnesota, USA). Response surface methodology (RSM), the face-centered central composite design (FCCD), was utilized for modeling and optimization of the influence of independent variables, including the three clarifiers, i.e., bentonite (X1), gelatin (X2), and diatomite earth (X3), at the levels of 0.25–0.75%, and clarifying time in levels of 1–3 h (X4) on dependent variables, i.e., the reduction amount (in %) of OTA, phenolic acid, flavonoids, and antioxidant capacity (FRAP assay). The mentioned levels were chosen by performing preliminary experiments, which indicated that clarifier concentrations (0.25–0.75%) and clarifying time (1–3 h) caused grape juice with desirable color quality. The experimental design included 30 experiments composed of 8-star points, 16 factorial points, and 6 center points (with four factors and three levels for each variable). The mentioned points and findings are shown in Table 1. The experimental data were fitted to the second-order polynomial equation:
Y = β0 + β1X1 + β2X23X3 + β4X4+ β11X1 2 + β22X2 2 + β33X32 + β44X42 + β12X1X2 + β13X1X3 + β14X1X4 + β23X2X3 + β24X2X4.
where Y is the response; β0 is a constant coefficient; independent variables are (X1: concentration of bentonite, X2: concentration of gelatin, X3: concentration of diatomite, and X4: time of clarification); the coefficients of the equation are (β1–β4: the linear terms; β11–β44: the quadratic terms; and β12–β24 are the interaction terms). Analysis of Variance (ANOVA) was performed at the probability levels p < 0.05 and p < 0.01 to obtain the coefficients of the final equation for better accuracy.

2.11. Optimization

OTA’s reduction amount (in %) was kept at the maximum level for optimization. In contrast, the reduction amount (in %) of other responses, such as phenolic acid, flavonoids, and antioxidant capacity (FRAP assay) reduction content, was kept at the minimum value, and the independent variables (X1, X2, X3, X4) were placed within the range (between lower and higher level). The higher desirability value (0–1) was chosen among the optimum conditions suggested by the Design Expert software.

3. Results and Discussion

3.1. Method Validation

The results of experiments on the accuracy (recovery), precision (intra-day and inter-day), LOD, LOQ, and linearity of the analysis method for OTA measurement are presented in Table 2. The equation of the calibration curve was Y = 95,167X + 9867, with determination coefficients (R2) of 0.9995. Recovery values ranged from 96.09 to 101.23%, and the RSD of inter- and intra-day precision was lower than 20%. All of these results were in accordance with legal requirements (accuracy range: 70–110% and RSD < 20%) of EU regulations [37]. The LOQ value is well below the maximum allowable limit of OTA in juice (2 μg/kg) [22]. These findings showed that the validated method could be applied well for grape juice’s OTA determination.

3.2. OTA Content, Antioxidant Content, and Capacity of Unclarified Grape Juice

The average concentration of OTA, TPC, and TFC and the antioxidant capacity of grape juice before clarification was 5 µg/kg, 295.91 µg gallic acid/mL, 198.43 μg catechin/mL, and 1362.14 µmoles ferrous sulphate/L, respectively. The results of phenolic acid, flavonoid, antioxidant activity, and OTA reduction percentage during grape juice clarification are shown in Table 1.

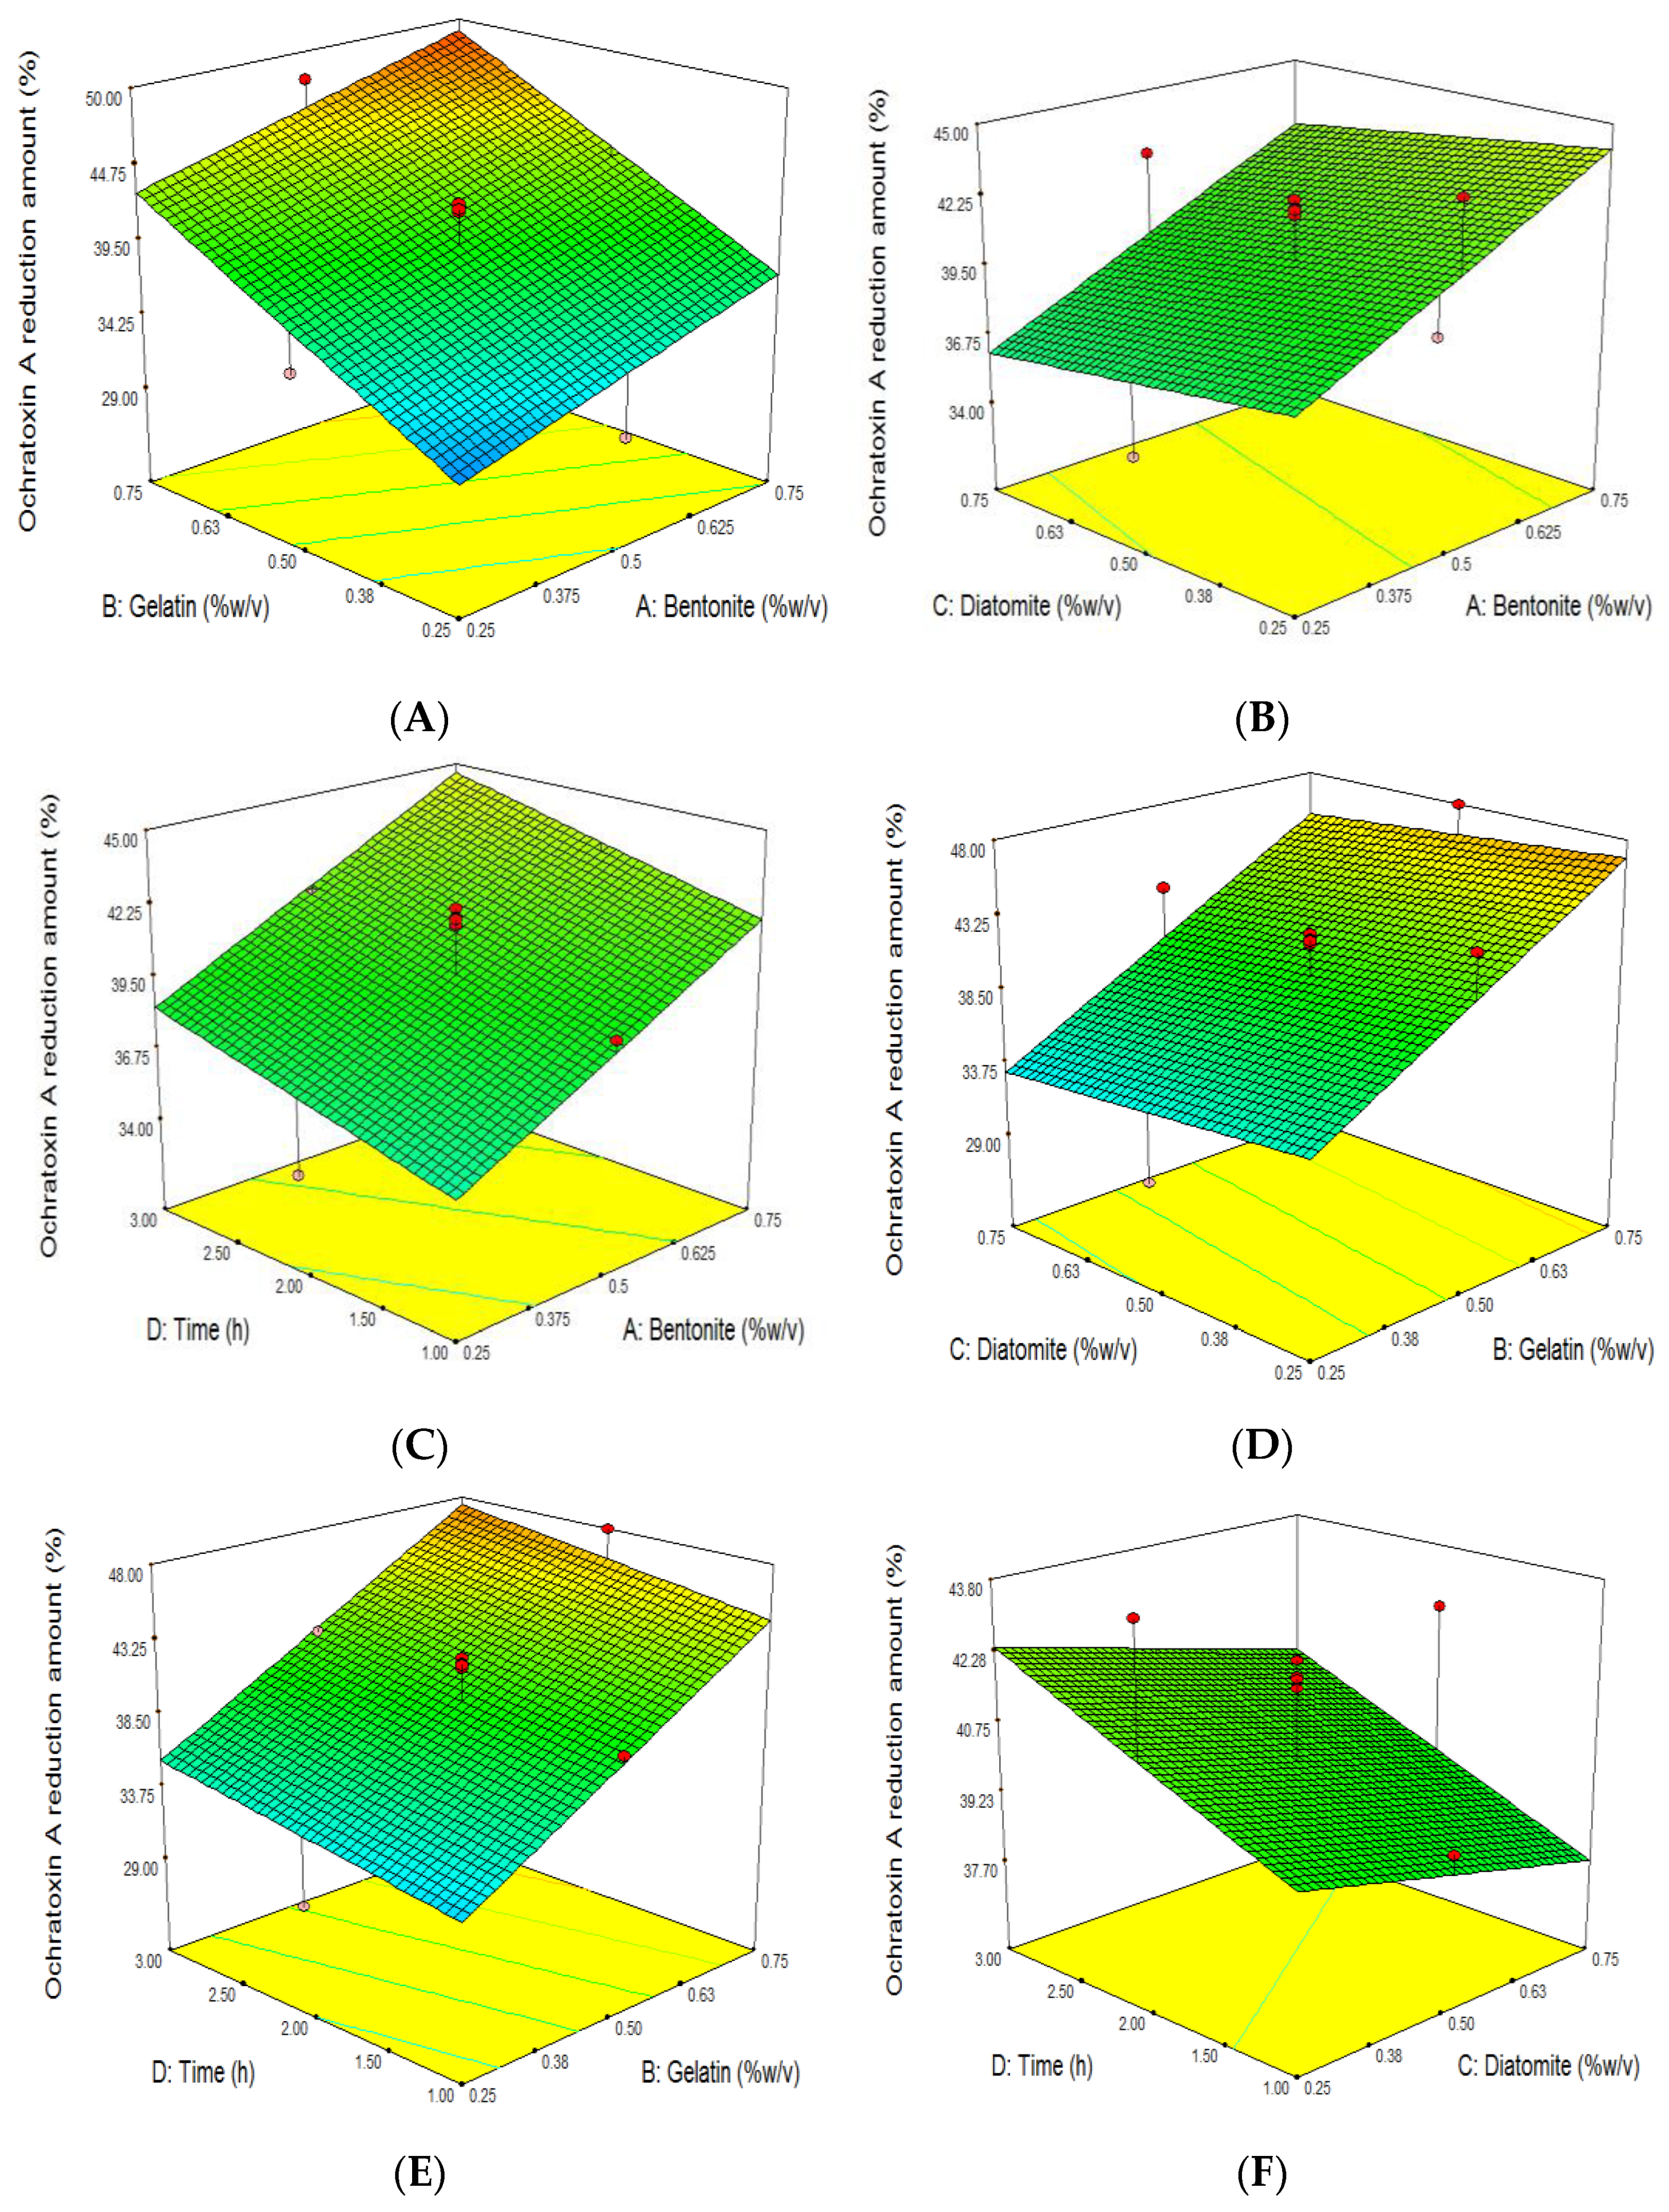
3.3. The Effect of Grape Juice Clarification on the Reduction of OTA

The findings obtained by Design Expert software indicated that a linear (first-order) model could significantly predict the reduction percentage as a function of clarifier concentration and clarification time. This model was well fitted (p < 0.01, F-value = 16.96) and also showed a non-significant lack of fit (Table 3). The equation for OTA reduction percentage included:
The reduction of OTA (%) = 40.05 + 3.13X1 + 5.98X2
The highest percentage of OTA removal (50.56%) was related to the grape juice sample clarified for 3 h by 0.75% bentonite, 0.75% gelatin, and 0.75% diatomite. Moreover, the lowest removal of OTA (27.65%) was achieved in grape juice clarified for 1 h with 0.75% bentonite, 0.25% gelatin, and 0.75% diatomite (Table 1).
With an increment in bentonite (X1) and gelatin (X2) levels from 0.25% to 0.75%, the loss of OTA was significantly increased (Figure 1A–E). Our findings are similar to those of previous studies that showed that increasing the concentration of bentonite in different types of wine led to a decrease in OTA [23,38,39]. However, Sun et al. (2017) observed that there were no significant differences among the OTA removal of wine samples clarified by various concentrations of bentonite (0.12, 0.16, and 0.20 mg/mL), and they could result in a 10% loss of OTA [29].
The formation of a hydrogen bond between OTA and bentonite could cause the removal of this mycotoxin [40]. In addition, bentonite has a layered structure [41], and protein-bound OTA is trapped within bentonite layers and separated from the grape juice matrix [12].
Among various clarifiers applied in this study, gelatin had the most significant influence on OTA reduction (Table 4). Previous studies reported the impact of gelatin on OTA reduction [38,40]. For example, Leong et al. (2006) found that an increment in gelatin concentration from 0.05% to 0.15% resulted in the OTA removal of wine being approximately increased from 13 to 21% [38], which follows our results. However, Castellari et al. (2001) found that OTA absorption was decreased with high concentrations of gelatin [40]. The OTA’s negative charge (carboxyl group of the phenylalanine moiety) interacts with positively charged gelatin (amino group) [39,40].
Among the three clarifiers, the minimum effect on OTA reduction was related to diatomite. As shown in Table 4, the effect of this independent variable on OTA is not significant (p > 0.05). However, diatomite has been applied in the juice production industry [42], and there is limited information about its effect on OTA. Lulamba et al. (2019) indicated that diatomite (200 mL/7gr) in beer and distilled water led to an OTA decrease to 38.4 and 17.9%, respectively. Diatomite has a layered structure, and OTA bonded with protein could be trapped in these layers [43]. Moreover, it is presumed that hydrogen exists in diatomite with the formula SiO2·nH2O, which plays a role in forming hydrogen bonds.
Based on Table 4, the influence of clarification time on OTA reduction was insignificant (p > 0.05), although, with a longer time, the removal of OTA was greater. Our results are similar to those of Sun et al.’s (2017) study. These authors found no significant difference in the clarification of different wine samples clarified by bentonite and gelatin [29].

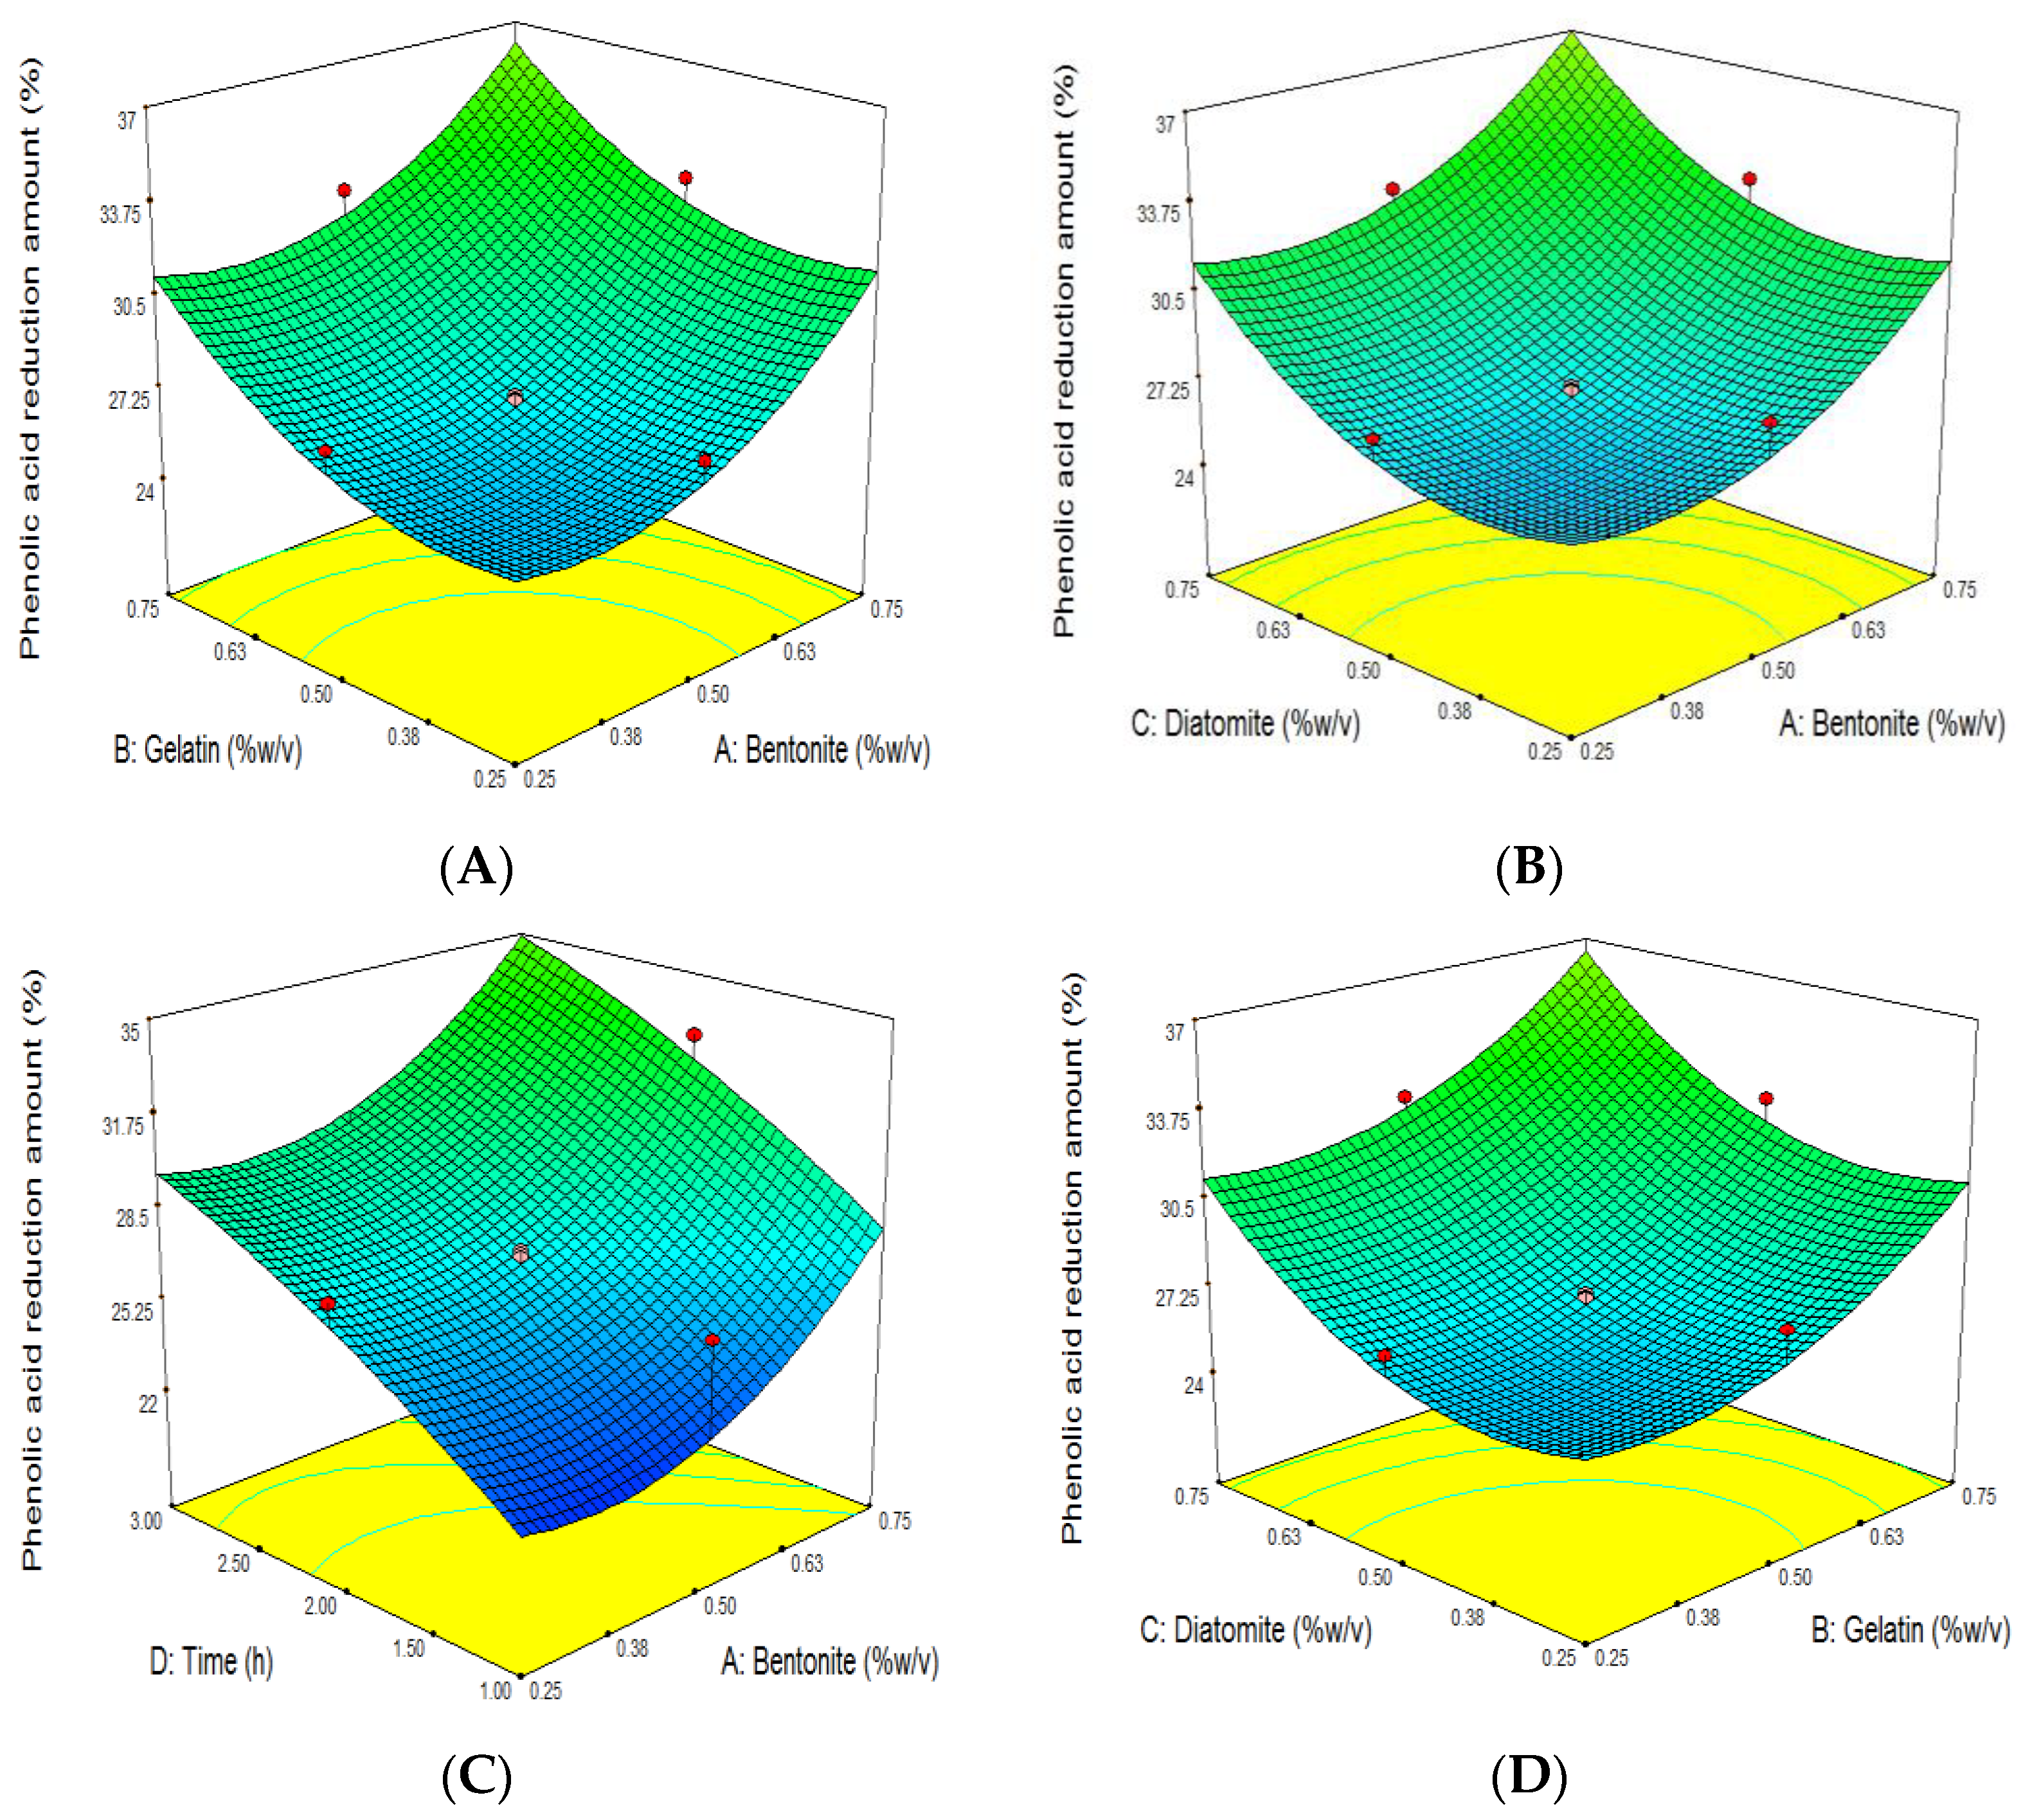
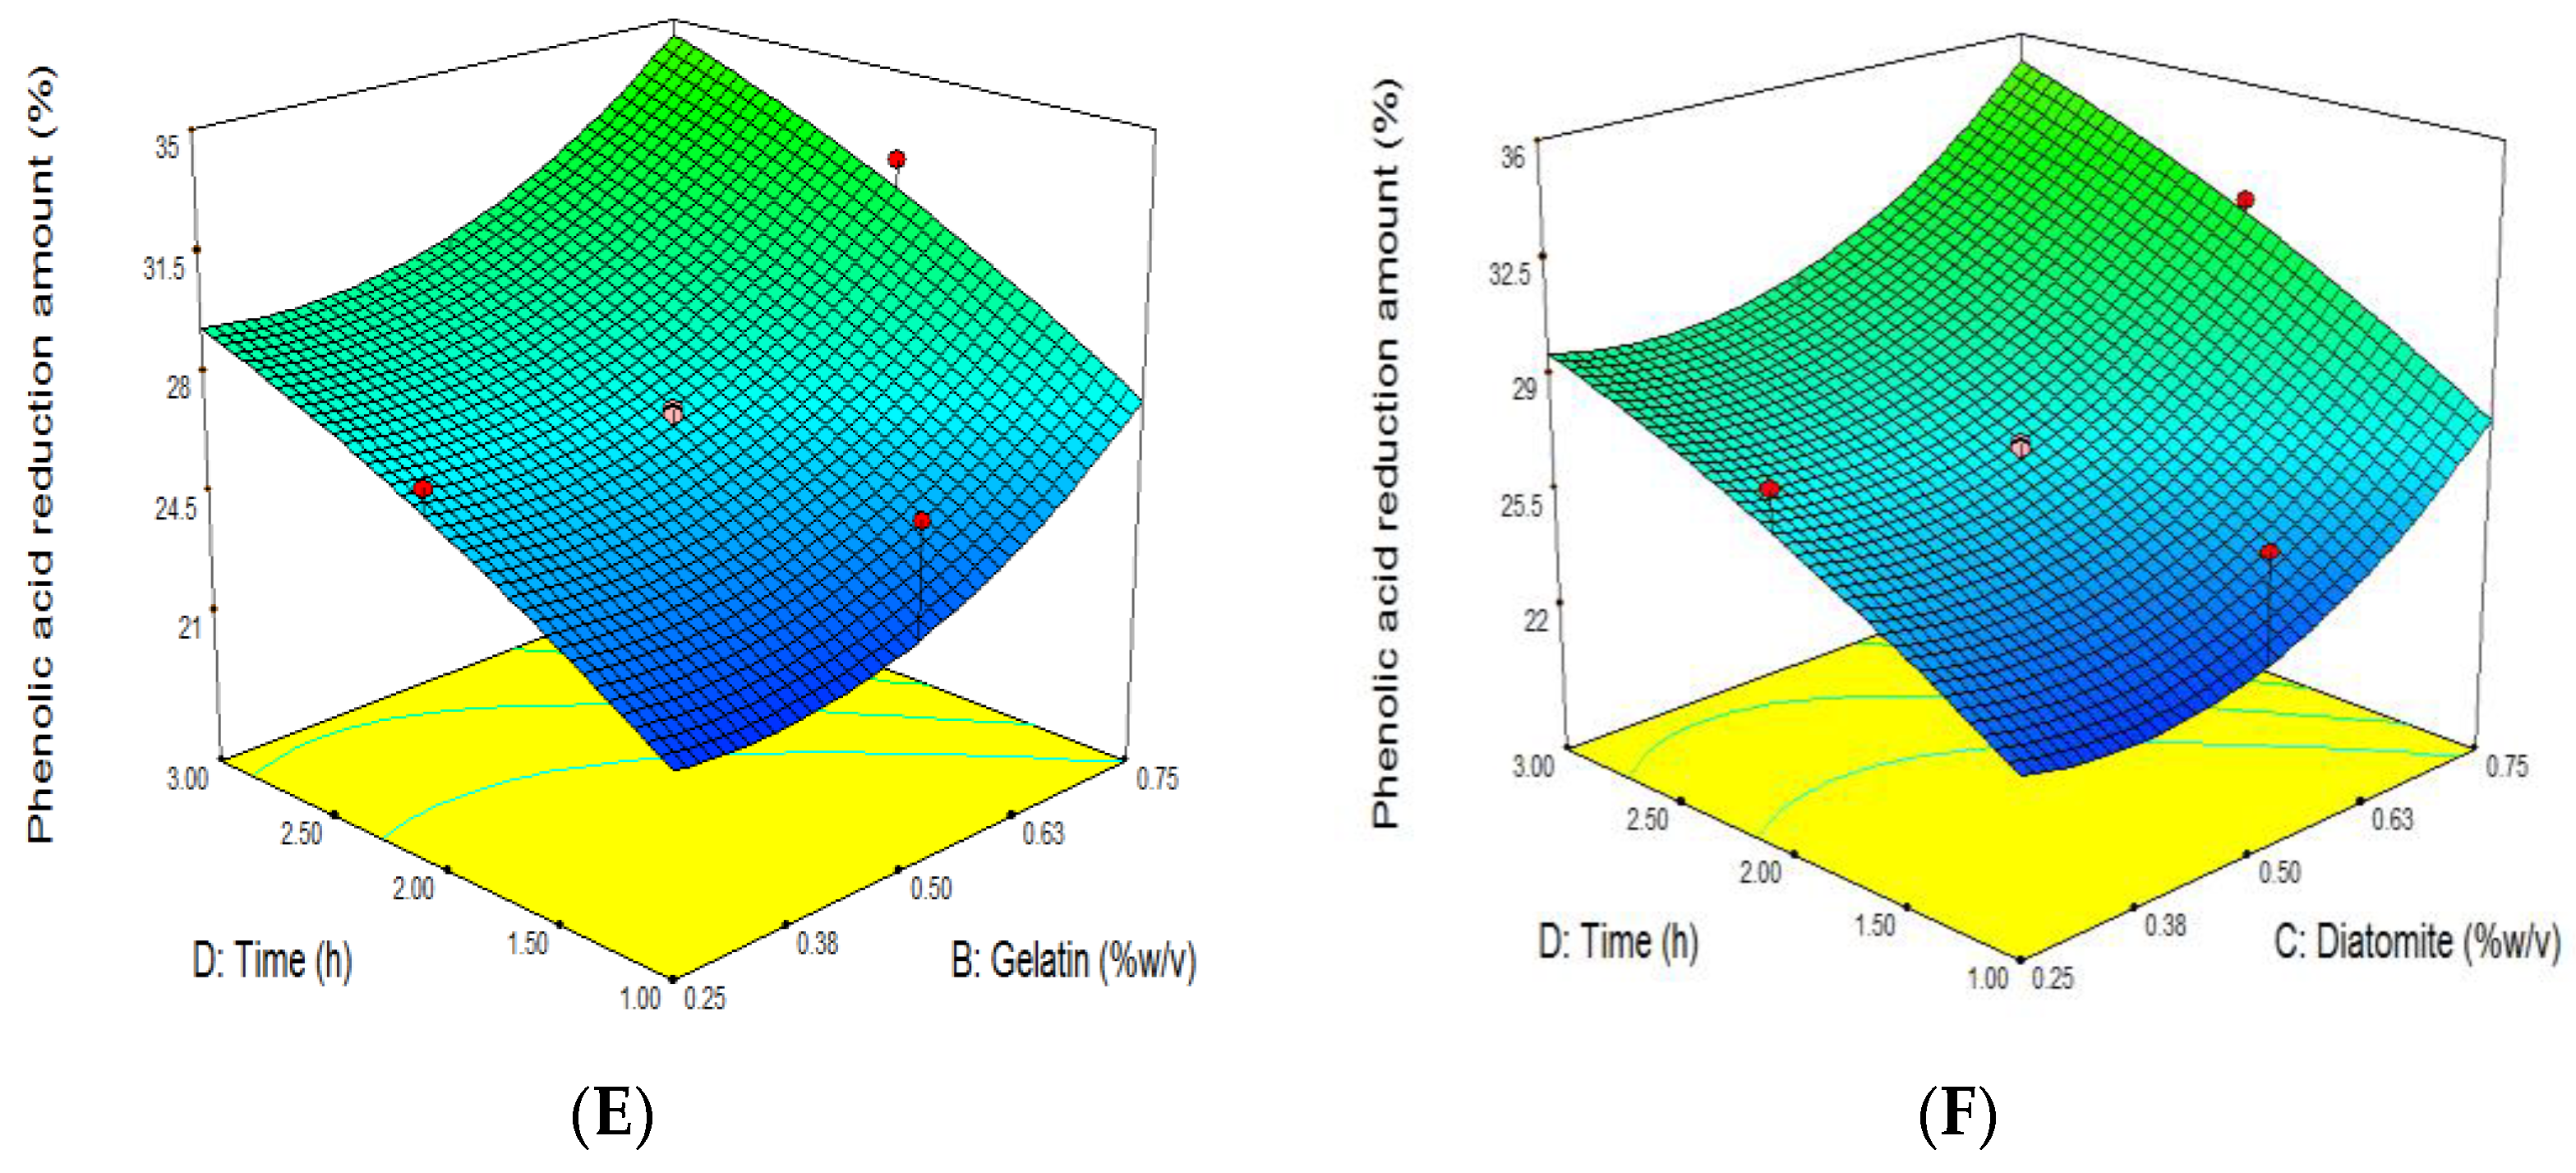
3.4. The Effect of Grape Juice Clarification on the Reduction of TPC

The behavior of TPC during the grape juice clarification process has high importance because the phenolic compounds, such as resveratrol, have antioxidant, cardioprotective, antidiabetic, anticancer, and antiaging properties, and their removal causes nutritional loss in grape juice [44,45]. The experimental results demonstrated that the decrease in TPC followed the quadratic polynomial model (Table 3):
The reduction of TPC = 27.07 + 2.66X1 + 2.56X2 + 2.61X3 + 3.61X4 + 2.25X12 + 1.87X22 + 2.35X32
The linear effects of all factors (p < 0.01) and the quadratic effects of bentonite, gelatin, and diatomite (p < 0.05) significantly influenced the decline in TPC, whereas the remaining terms were not significant (p > 0.05) (Table 4). The highest decline in TPC (44.71%) was obtained by using the following conditions: X1: 0.75%, X2: 0.75%, X3: 0.75%, and X4: 3 h. Meanwhile, the lowest reduction (20.8%) was achieved by utilizing the following parameters: X1: 0.25%, X2: 0.25%, X3: 0.25%, and X4: 1 h (Table 1).
There are various conflicting reports about the effect of bentonite on wine TPC. For example, some researchers suggested that enhancing bentonite increases TPC removal, which is in line with our studies [32,46]. Meanwhile, several authors presented contrasting results and mentioned that adding bentonite reduces TPC loss [47,48]. The platelets of bentonite carry a negative charge and can electrostatically bond to positively charged proteins that contain TPC and tannin [48,49,50]. In addition, cations located in bentonites such as Al3+, Ca2+, Mg2+, Mn2+, Zn2+, Cu2+, Fe2+, Na+, K+, and H+ interact directly with negatively charged phenolic acids in juice or wine [31].
As presented in Table 4, gelatin had a weak role in TPC removal because it has the lowest regression coefficients. The reduction of phenolic acid by gelatin was reported in other studies [46,47,51]. Because of the low pH of fruit juice, gelatin had a positive charge and could absorb negatively charged phenolic acid [32,51].
The reduction of TPC by diatomite has been documented [30,52]. For example, Capanoglu et al. (2013) found that the utilization of diatomite for grape juice filtration caused a reduction in TPC from 276 to 259 mg/g (approximately 6.16% loss) [30]. In another study, Fang et al. (2007) indicated that the application of diatomite as a filtering agent for bayberry juice led to a decrease of 2–5% in TPC [52]. It is thought that the hydrogen bond formation between the active silanol groups of diatomite and the hydroxyl groups of TPC could result in phenolic acid removal [31,53].
When the clarifiers were in contact with grape juice for 3 h instead of 1 h, more TPC was removed (Figure 2C,E,F). Table 4 shows that the clarification time (X4) has the greatest influence on the decline in TPC from grape juice due to its higher coefficient compared to other factors.

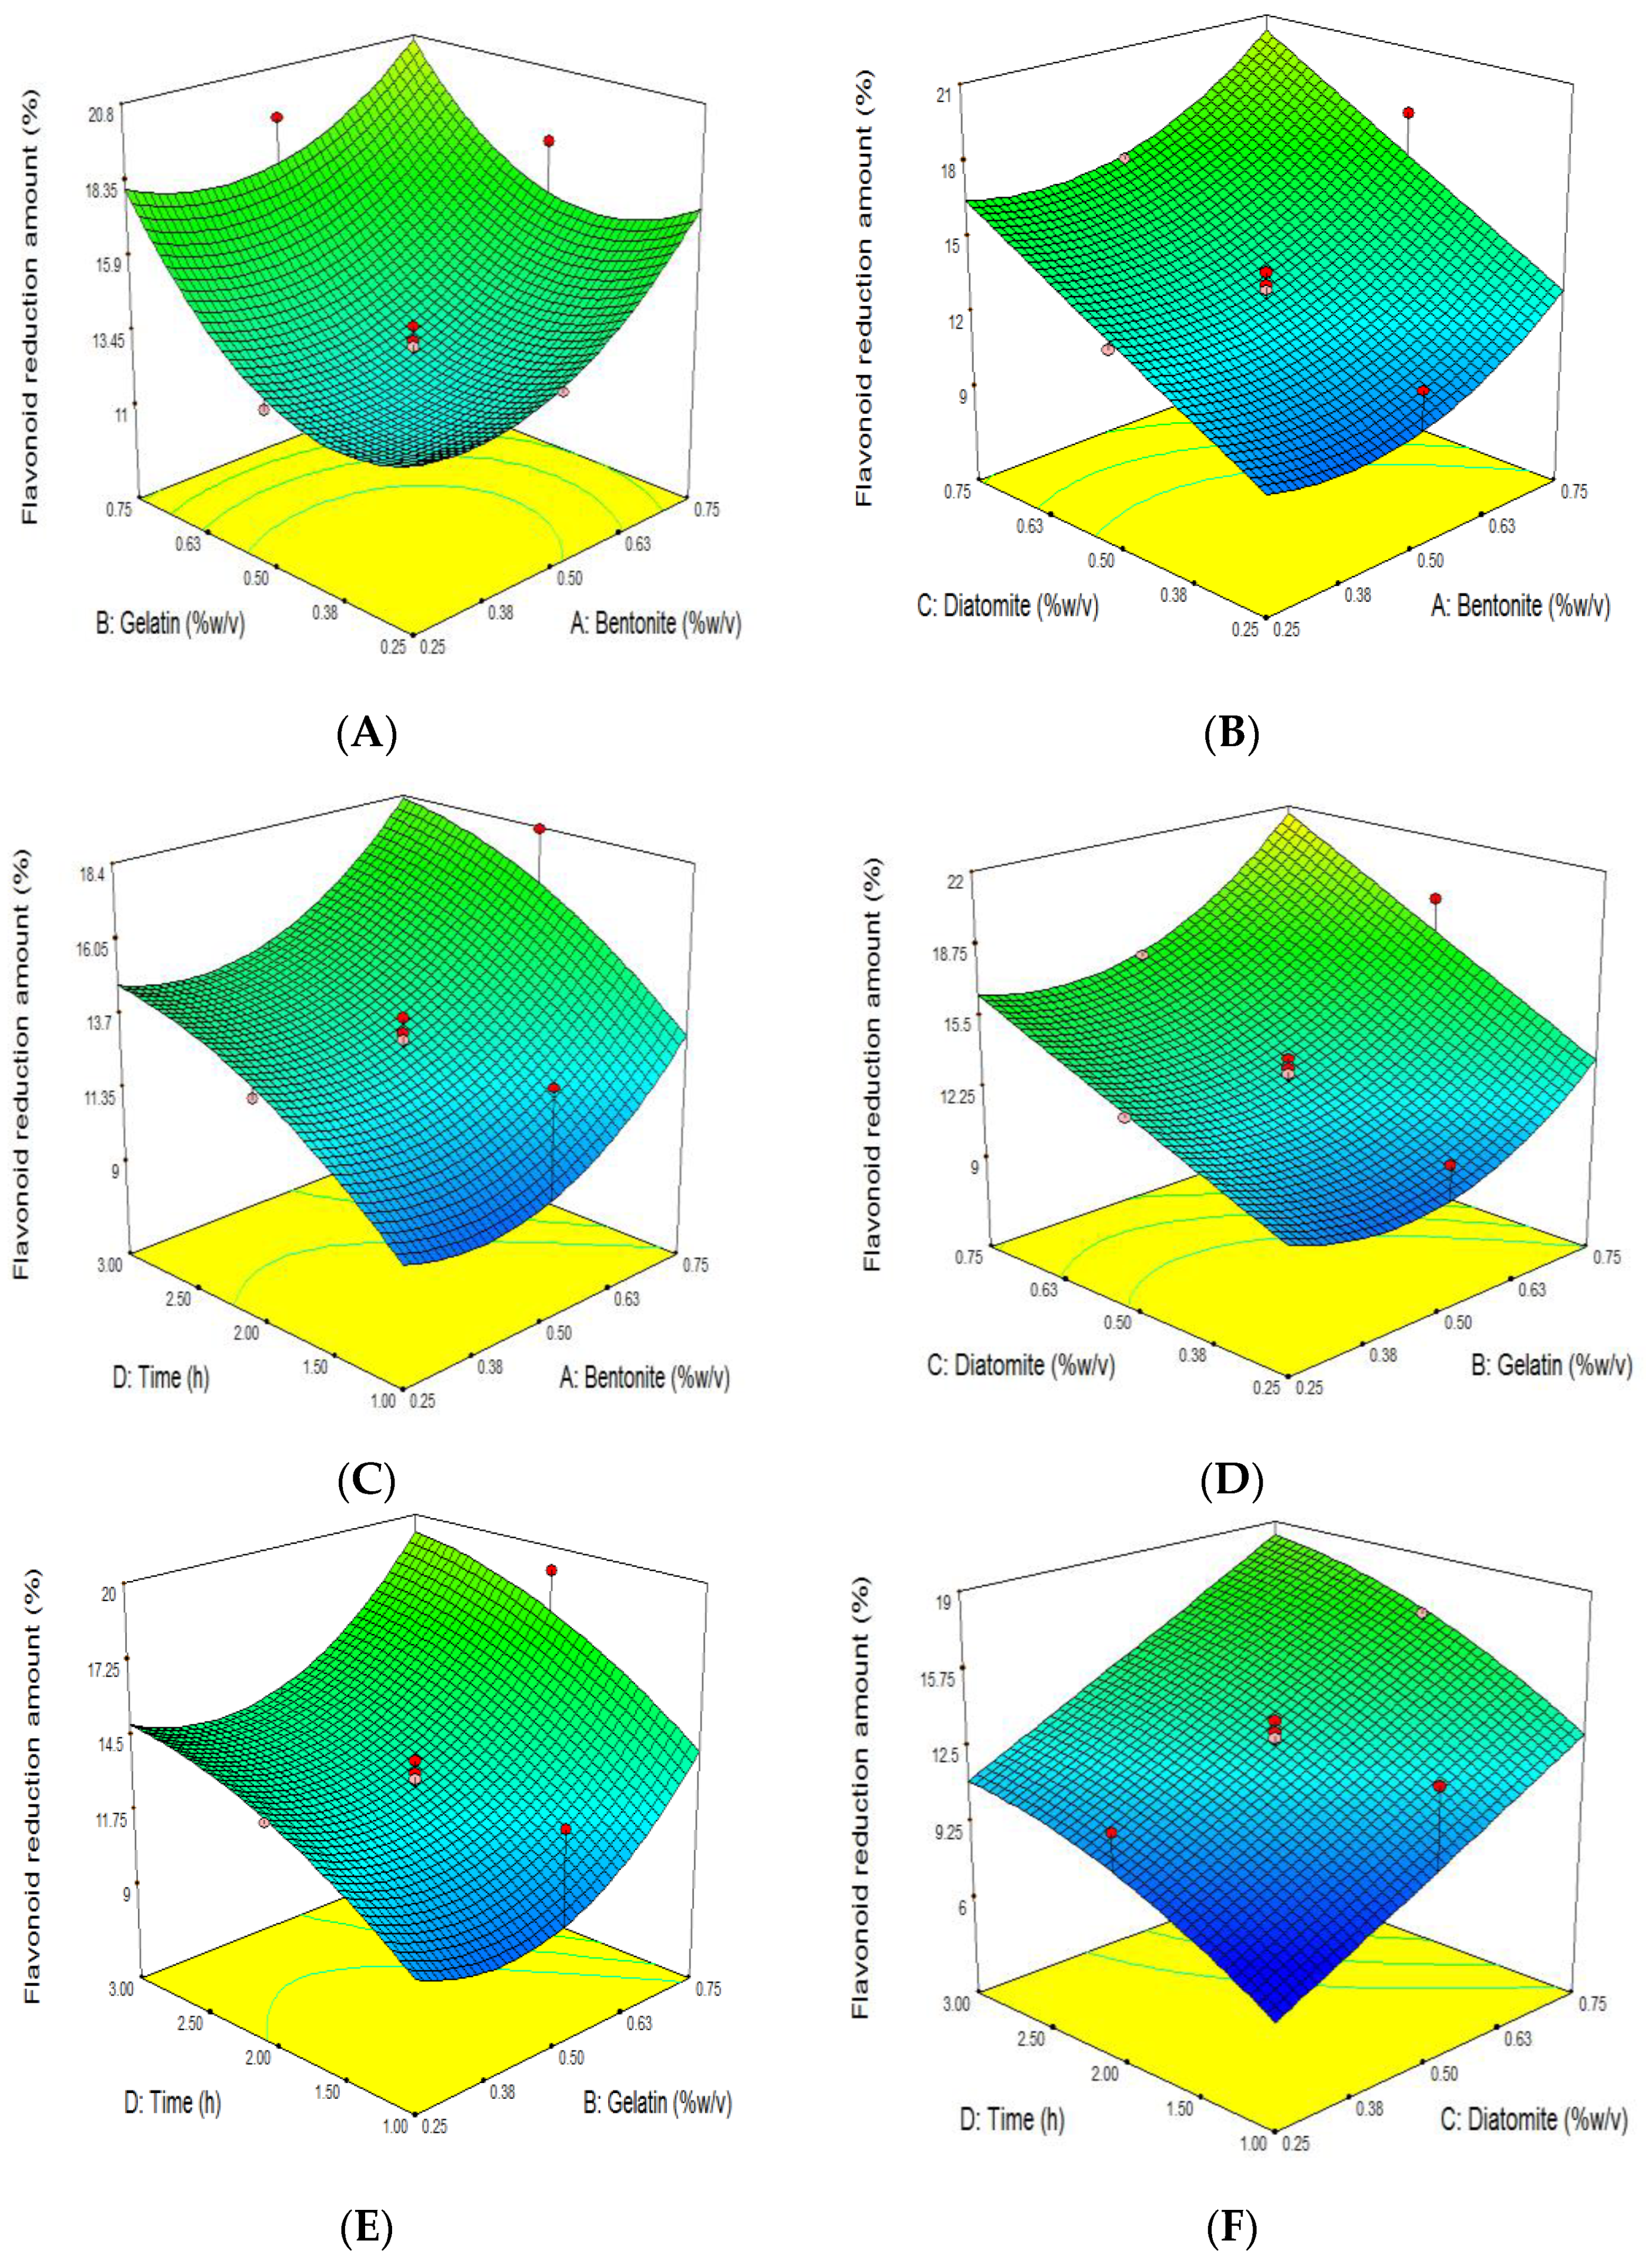
3.5. The Effect of Grape Juice Clarification on the Reduction of TFC

The reduction of TFC ranged from 7.21% in the case of the experiments performed at the lowest level of clarifier amount and clarification time (Run 1 in Table 1) to 25.81% at the highest levels of clarifier amount and clarification time (Run 28 in Table 1). The ANOVA analysis indicated that the quadratic (second-order) model with a high coefficient of determination (R2 = 0.9282) fitted significantly (p < 0.01) to the reduction response of TFC (Table 3). In this model, the linear effects of bentonite, gelatin, diatomite, time (p < 0.01), and the quadratic effect of gelatin (p < 0.05) on the reduction of TFC are significant, whereas the residue of terms is not significant (p > 0.05) (Table 4). The multiple regression equation for the reduction of TFC is as follows:
The reduction of TFC (%) = 13.06 + 1.77X1 + 2.07X2 + 3.56X3 + 2.56X4 + 2.46X22
Among the significant effects, bentonite has the least influence on the reduction of TFC compared to other effects (Table 4). The reduction of TFC was stable when adding bentonite (X1) and gelatin (X2) from 0.25 to 0.5%. However, increasing the bentonite and gelatin concentration to 0.75% improved TFC reduction (Figure 3A–E). Fang et al. (2007) expressed that the refining and filtration of wine with bentonite (0.2 g/L), gelatin (0.2 g/L), and diatomite (2 g/L) resulted in a decrease in TFC from 341.1 (mg/L) to 289.7 (mg/L) (approximately 15.07% reduction), which is within the range of our data [52]. However, the reduction of TFC (approximately 5% reduction) in mulberry wine clarified by bentonite was lower than in our findings [4]. It was proposed that hydrogen bonds between the benzene rings of anthocyanin and bentonite caused the complex formation and the removal of flavonoids, including anthocyanin [48].
The interaction effects of gelatin on the reduction of TFC with bentonite, diatomite, and time were investigated and are shown in Figure 3A,D,E. Among the second-order coefficients, gelatin has the highest value. Therefore, it showed the most substantial impact on the reduction of TFC (Table 4). Ren et al. (2020) found that the clarifying of berry wine with gelatin resulted in a reduction in TFC (approximately 16.5%) [54]. Anthocyanins and gelatin are positively charged; therefore, they could not absorb each other [50]. However, tannins containing a negative charge could play the role of mediator between both mentioned components and settle them.
With increasing diatomite (X3) from 0.25 up to 0.75%, the reduction of TFC was linearly increased (Figure 3B,D,F). In a study conducted by Capanoglu et al. (2013), the filtration of grape juice concentrates with diatomaceous earth resulted in the reduction of TFC from 122 to 15 mg/mL (approximately 87.7% reduction) [30]. In another study, the authors showed that diatomaceous earth caused the reduction of total anthocyanins of açai juice by 20.4% [33]. The positively charged anthocyanins in grape juice could flocculate with diatomite’s negatively charged hydroxyl group [50].
There is a direct relation between clarification time and the reduction of TFC (Figure 3C,E,F). Flavonoids are a type of active food constituent found in nature and are of particular interest because of their potential antioxidant activity and possible beneficial effects on human health [55,56]. As a result, their decrease during the clarification of grape juice must be minimized.

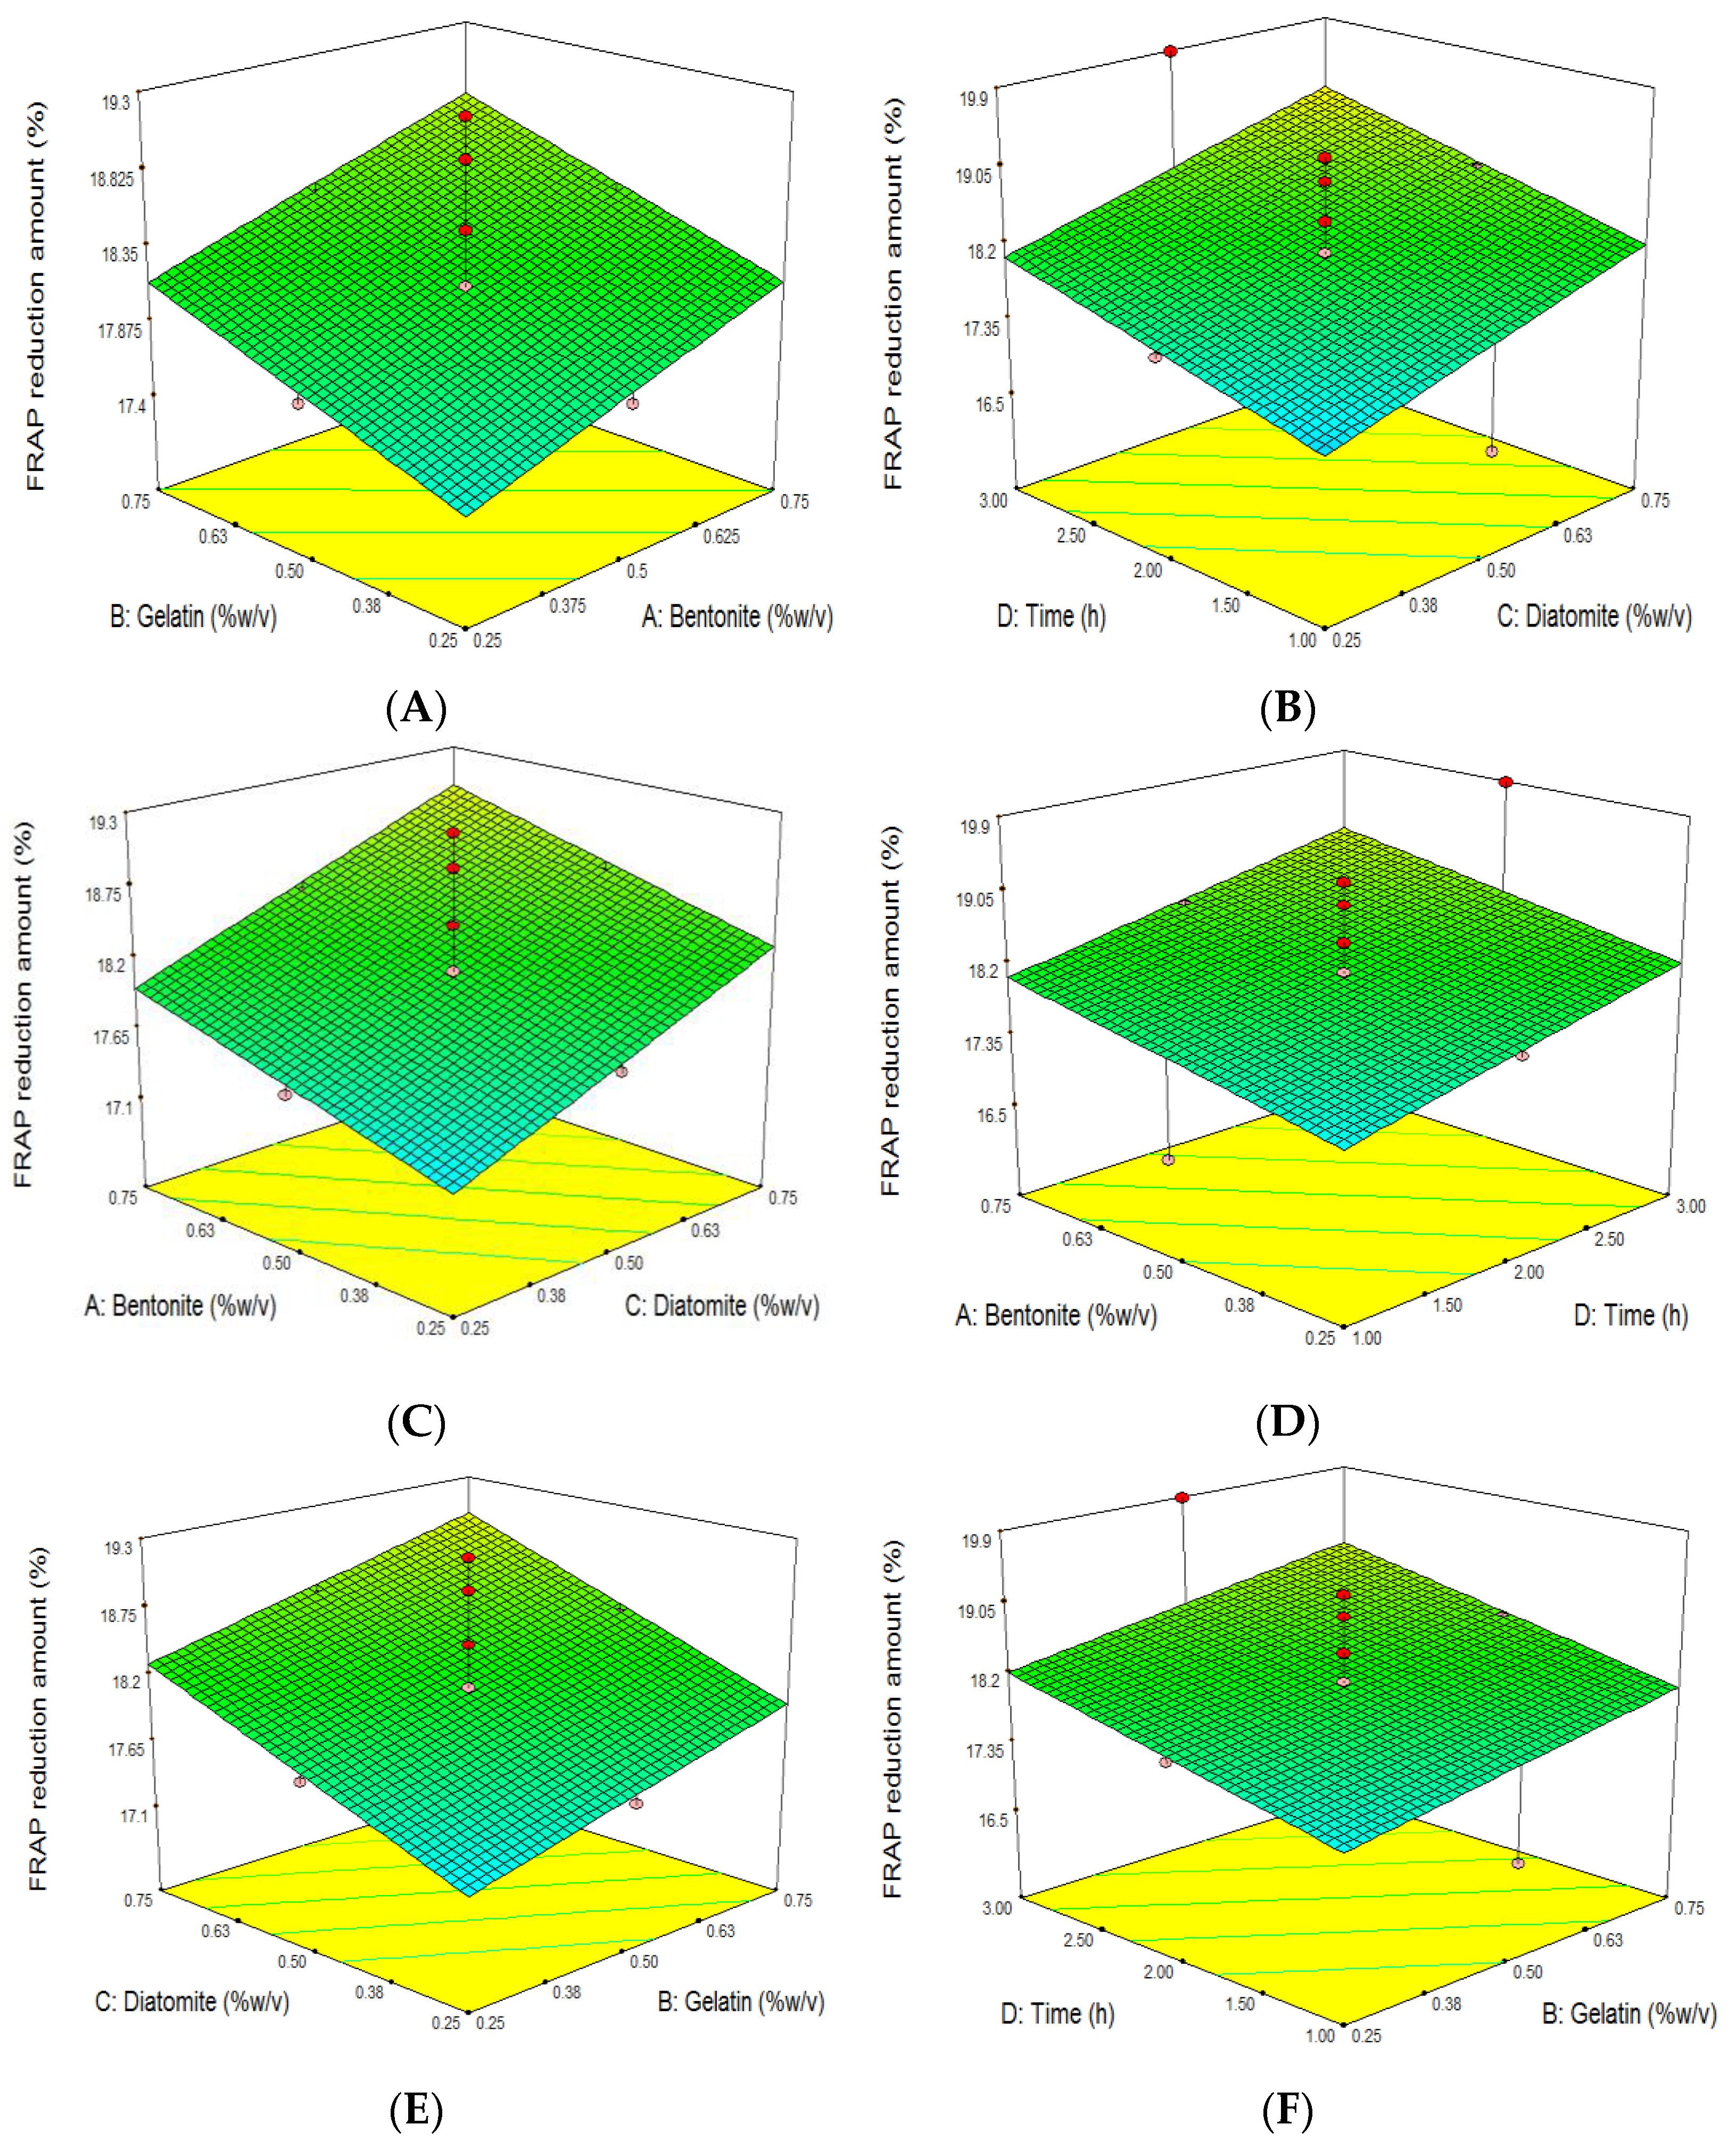
3.6. The Effect of Grape Juice Clarification on the Reduction of Antioxidant Capacity

Due to the antioxidative properties of grapes and their ability to reduce or prevent oxidative stress [57], the assessment of clarifying grape juice antioxidant capacity has high importance. In this study, the antioxidant capacity reduction (assessed by the FRAP method) of grape juice samples ranged between 16.43% (Run 1) and 19.89% (Run 17) (Table 1). For generating a relationship between the antioxidant capacity reduction and clarifier concentration, and clarification time (Table 3), a linear polynomial equation is given as follows:
Reduction of antioxidant capacity (%) = 18.13 + 0.35X1 + 0.34X2 + 0.51X3 + 0.43X4
The increase in clarifier agent concentration from 0.25 to 0.75% was positively associated with antioxidant activity reduction (Figure 4A–F). Our data agree with those of other researchers who used bentonite in different concentrations for the clarification of red wine and showed that a diminution in antioxidant content is linked to an increase in bentonite [46,58]. In contrast to our findings, Ghanem et al. (2017) observed that an increment in bentonite value from 450 up to 800 mg/L resulted in an enhancement in the antioxidant capacity of red wine (2.90–2.92 mg/mL) [32]. It seems that bentonite absorbs some phenols involved in antioxidant activity, such as catechin and caffeic acid [31].
The lowest effect on reducing antioxidant activity among the three clarifiers was shown by gelatin (Table 4). Some authors indicated that gelatin causes red wine’s antioxidant capacity, similar to our results [46,58]. In contrast to these findings, Ghanem et al. (2017) demonstrated that wine samples clarified with a high gelatin concentration had greater antioxidant capacity than those with a low level of this clarifier [32]. Dıblan et al. (2021) found that the binding of phenolic acid as an antioxidant compound to protein clarifiers such as gelatin could decrease the antioxidant capacity of grape juice [31].
Diatomite, with a high coefficient, has the most significant effect on reducing antioxidant capacity (Table 4). In order to manufacture grape juice concentrate, Capanoglu et al. (2013) employed diatomite for filtration and reported that it diminished antioxidant activity from 439 to 378 µmol/g (approximately 13.9%) [30]. On the other hand, according to Farahmand et al. (2017), diatomite filtration reduces the antioxidant content of pomegranate juice from 8 to 7.1 µg/mL (approximately 11.25%) [59]. It is explained that some antioxidant components in grape juice, such as anthocyanin, have a positive charge and can flocculate with negatively charged diatomite [50,60].
As seen in Figure 4B,D,F, the elimination of antioxidant activity can be improved by expanding the clarifier’s contact time (X4) with grape juice from 1 to 3 h. To our knowledge, no data exist on clarification time’s influence on antioxidant activity.

3.7. Process Optimization

In order to produce safe grape juice, multi-objective optimization was employed to achieve maximum OTA diminution and a minimal decrement in compounds and antioxidant capacity. After analyzing the data of thirty experiments and obtaining valid prediction models for each response, the software selected a solution. As shown in Figure 5, the optimal experimental conditions predicted by the face-centered central composite design were: bentonite of 0.45% w/v, gelatin of 0.62% w/v, diatomite of 0.25 w/v, and clarification time of 1 h. The reductions in OTA, TPC, TFC, and antioxidant activity were calculated as 41.67%, 23.86%, 7.20%, and 17.27%, respectively.

4. Conclusions

Clarification is the most crucial step in the process of grape juice manufacture. This study employed prevalent clarifiers (bentonite, gelatin, and diatomite) to clarify grape juice. Moreover, the response surface methodology was used to find an optimal point. Bentonite and gelatin significantly affected the OTA level, whereas compounds and antioxidant capacity were significantly affected by all variables. In general, when enhancing the clarifier concentration (0.25–0.75%) and clarifying time (1–3 h), the removal of OTA, antioxidant compounds, and capacity increased. For the first time, in this report, the optimal values of grape juice clarification parameters with a desirability value of 0.797 to achieve the maximum reduction in OTA and the minimum reduction in compounds and antioxidant capacity were determined. The present study’s results encourage more research to produce healthy grape juice.

Author Contributions

Conceptualization, A.H. and M.B.; methodology, A.H. and F.M.; software, A.H. and M.B.; validation, A.H.; formal analysis, M.B.; investigation, M.B.; resources, M.B.; data curation, M.B.; writing—original draft preparation, A.H. and M.B.; writing—review and editing, A.M.K.; visualization, A.H.; supervision, A.H.; project administration, M.B.; funding acquisition, A.H. and A.M.K. All authors have read and agreed to the published version of the manuscript.

Funding

This study with No. 140003111880 was financially supported by the Center of Research and Technology of Hamadan University of Medical Sciences and Health Services.

Institutional Review Board Statement

The study was conducted in accordance with the Declaration of Helsinki, and approved by the Ethics Committee of Hamadan University of Medical Sciences and Health Services (protocol code: IR.UMSHA.REC.1400.109 and date of approval: 1 May 2021).

Informed Consent Statement

Not applicable.

Data Availability Statement

The data obtained from the study are presented and discussed in the manuscript.

Acknowledgments

The authors are thankful to Amir Daraei Garmakhany for his help in conducting the optimization.

Conflicts of Interest

All the authors declare that they do not have any conflict of interest in this study.

References

  1. Balali-Mood, M.; Riahi-Zanjani, B.; Mahdizadeh, A.; Moradi, V.; Fazeli-Bakhtiyari, R. Arsenic and lead contaminations in commercial fruit juices of markets in Mashhad, Iran. Iran. J. Toxicol. 2018, 12, 15–20. [Google Scholar] [CrossRef]
  2. Muñoz-Robredo, P.; Robledo, P.; Manríquez, D.; Molina, R.; Defilippi, B.G. Characterization of sugars and organic acids in commercial varieties of table grapes. Chil. J. Agric. Res. 2011, 71, 452. [Google Scholar] [CrossRef] [Green Version]
  3. Cosme, F.; Pinto, T.; Vilela, A. Phenolic compounds and antioxidant activity in grape juices: A chemical and sensory view. Beverages 2018, 4, 22. [Google Scholar] [CrossRef] [Green Version]
  4. Dutra, M.d.C.P.; Rodrigues, L.L.; de Oliveira, D.; Pereira, G.E.; dos Santos Lima, M. Integrated analyses of phenolic compounds and minerals of Brazilian organic and conventional grape juices and wines: Validation of a method for determination of Cu, Fe and Mn. Food Chem. 2018, 269, 157–165. [Google Scholar] [CrossRef] [Green Version]
  5. Heshmati, A.; Nili-Ahmadabadi, A.; Rahimi, A.; Vahidinia, A.; Taheri, M. Dissipation behavior and risk assessment of fungicide and insecticide residues in grape under open-field, storage and washing conditions. J. Clean. Prod. 2020, 270, 122287. [Google Scholar] [CrossRef]
  6. Dutra, M.d.C.P.; Viana, A.C.; Pereira, G.E.; Nassur, R.d.C.M.R.; dos Santos Lima, M. Whole, concentrated and reconstituted grape juice: Impact of processes on phenolic composition,“foxy” aromas, organic acids, sugars and antioxidant capacity. Food Chem. 2021, 343, 128399. [Google Scholar] [CrossRef]
  7. Chanson-Rolle, A.; Braesco, V.; Chupin, J.; Bouillot, L. Nutritional composition of orange juice: A comparative study between French commercial and home-made juices. Food Nutr. Sci. 2016, 7, 252. [Google Scholar] [CrossRef]
  8. Jiménez, M.; Juárez, N.; Jiménez-Fernández, V.; Monribot-Villanueva, J.; Guerrero-Analco, J. Phenolic compounds and antioxidant activity of wild grape (Vitis tiliifolia). Ital. J. Food Sci. 2018, 30, 1. [Google Scholar]
  9. Khazaei, S.; Talebi Ghane, E.; Bashirian, S.; Mehri, F. The concentration of potentially toxic elements (PTEs) in fruit juices: A global systematic review, meta-analysis and probabilistic health risk assessment. Int. J. Environ. Anal. Chem. 2021, 1–13. [Google Scholar] [CrossRef]
  10. Genchev, R.; Angelova, G.; Laskova, I.; Gotcheva, V.; Angelov, A. Mycoflora of fresh chokeberry (Aronia melanocarpa) and ochratoxin-producing ability of Penicillium isolates. Qual. Assur. Saf. Crops Foods 2015, 7, 123–131. [Google Scholar] [CrossRef]
  11. Welke, J.E. Fungal and mycotoxin problems in grape juice and wine industries. Curr. Opin. Food Sci. 2019, 29, 7–13. [Google Scholar] [CrossRef]
  12. Heshmati, A.; Ghadimi, S.; Ranjbar, A.; Khaneghah, A.M. Assessment of processing impacts and type of clarifier on the concentration of ochratoxin A in pekmez as a conventional grape-based product. LWT 2020, 119, 108882. [Google Scholar] [CrossRef]
  13. Heshmati, A.; Mozaffari Nejad, A.S. Ochratoxin A in dried grapes in Hamadan province, Iran. Food Addit. Contam. Part B 2015, 8, 255–259. [Google Scholar] [CrossRef] [PubMed]
  14. Ortiz-Villeda, B.; Lobos, O.; Aguilar-Zuniga, K.; Carrasco-Sánchez, V. Ochratoxins in wines: A review of their occurrence in the last decade, toxicity, and exposure risk in humans. Toxins 2021, 13, 478. [Google Scholar] [CrossRef] [PubMed]
  15. Wei, D.; Wu, X.; Xu, J.; Dong, F.; Liu, X.; Zheng, Y.; Ji, M. Determination of Ochratoxin A contamination in grapes, processed grape products and animal-derived products using ultra-performance liquid chromatography-tandem mass spectroscopy system. Sci. Rep. 2018, 8, 1–8. [Google Scholar]
  16. Khaneghah, A.M.; Fakhri, Y.; Abdi, L.; Coppa, C.F.S.C.; Franco, L.T.; de Oliveira, C.A.F. The concentration and prevalence of ochratoxin A in coffee and coffee-based products: A global systematic review, meta-analysis and meta-regression. Fungal Biol. 2019, 123, 611–617. [Google Scholar] [CrossRef]
  17. Heshmati, A.; Zohrevand, T.; Khaneghah, A.M.; Nejad, A.S.M.; Sant’Ana, A.S. Co-occurrence of aflatoxins and ochratoxin A in dried fruits in Iran: Dietary exposure risk assessment. Food Chem. Toxicol. 2017, 106, 202–208. [Google Scholar] [CrossRef]
  18. Batrinou, A.; Houhoula, D.; Papageorgi, E. Rapid detection of mycotoxins on foods and beverages with enzyme-linked immunosorbent assay. Qual. Assur. Saf. Crops Foods 2020, 12, 40–49. [Google Scholar] [CrossRef] [Green Version]
  19. Bui-Klimke, T.R.; Wu, F. Ochratoxin A and human health risk: A review of the evidence. Crit. Rev. Food Sci. Nutr. 2015, 55, 1860–1869. [Google Scholar] [CrossRef] [Green Version]
  20. Nourbakhsh, F.; Tajbakhsh, E. Neurotoxicity mechanism of Ochratoxin A. Qual. Assur. Saf. Crops Foods 2021, 13, 34–45. [Google Scholar] [CrossRef]
  21. Mehri, F.; Esfahani, M.; Heshmati, A.; Jenabi, E.; Khazaei, S. The prevalence of ochratoxin A in dried grapes and grape-derived products: A systematic review and meta-analysis. Toxin Rev. 2020, 41, 1–10. [Google Scholar] [CrossRef]
  22. Oteiza, J.M.; Khaneghah, A.M.; Campagnollo, F.B.; Granato, D.; Mahmoudi, M.R.; Sant’Ana, A.S.; Gianuzzi, L. Influence of production on the presence of patulin and ochratoxin A in fruit juices and wines of Argentina. LWT 2017, 80, 200–207. [Google Scholar] [CrossRef]
  23. Var, I.; Kabak, B.; Erginkaya, Z. Reduction in ochratoxin A levels in white wine, following treatment with activated carbon and sodium bentonite. Food Control 2008, 19, 592–598. [Google Scholar] [CrossRef]
  24. Quintela, S.; Villarán, M.C.; de Armentia, I.L.; Elejalde, E. Ochratoxin A removal in wine: A review. Food Control 2013, 30, 439–445. [Google Scholar] [CrossRef]
  25. Shukla, S.; Park, J.H.; Kim, M. Efficient, safe, renewable, and industrially feasible strategy employing Bacillus subtilis with alginate bead composite for the reduction of ochratoxin A from wine. J. Clean. Prod. 2020, 242, 118344. [Google Scholar] [CrossRef]
  26. Dachery, B.; Hernandes, K.C.; Veras, F.F.; Schmidt, L.; Augusti, P.R.; Manfroi, V.; Zini, C.A.; Welke, J.E. Effect of Aspergillus carbonarius on ochratoxin a levels, volatile profile and antioxidant activity of the grapes and respective wines. Food Res. Int. 2019, 126, 108687. [Google Scholar] [CrossRef] [PubMed]
  27. Cosme, F.; Inês, A.; Silva, D.; Filipe-Ribeiro, L.; Abrunhosa, L.; Nunes, F.M. Elimination of ochratoxin A from white and red wines: Critical characteristics of activated carbons and impact on wine quality. LWT 2021, 140, 110838. [Google Scholar] [CrossRef]
  28. Lulamba, T.E.; Stafford, R.A.; Njobeh, P.B. The relative effectiveness of two filter aids in removing ochratoxin A during beer filtration. J. Inst. Brew. 2019, 125, 422–432. [Google Scholar] [CrossRef]
  29. Sun, X.; Niu, Y.; Ma, T.; Xu, P.; Huang, W.; Zhan, J. Determination, content analysis and removal efficiency of fining agents on ochratoxin A in Chinese wines. Food Control 2017, 73, 382–392. [Google Scholar] [CrossRef]
  30. Capanoglu, E.; de Vos, R.C.; Hall, R.D.; Boyacioglu, D.; Beekwilder, J. Changes in polyphenol content during production of grape juice concentrate. Food Chem. 2013, 139, 521–526. [Google Scholar] [CrossRef]
  31. Dıblan, S.; Özkan, M. Effects of various clarification treatments on anthocyanins, color, phenolics and antioxidant activity of red grape juice. Food Chem. 2021, 352, 129321. [Google Scholar] [CrossRef] [PubMed]
  32. Ghanem, C.; Taillandier, P.; Rizk, M.; Rizk, Z.; Nehme, N.; Souchard, J.P.; El Rayess, Y. Analysis of the impact of fining agents types, oenological tannins and mannoproteins and their concentrations on the phenolic composition of red wine. LWT Food Sci. Technol. 2017, 83, 101–109. [Google Scholar] [CrossRef] [Green Version]
  33. Pacheco-Palencia, L.A.; Hawken, P.; Talcott, S.T. Phytochemical, antioxidant and pigment stability of açai (Euterpe oleracea Mart.) as affected by clarification, ascorbic acid fortification and storage. Food Res. Int. 2007, 40, 620–628. [Google Scholar] [CrossRef]
  34. Heshmati, A.; Mehri, F.; Nili-Ahmadabadi, A.; Khaneghah, A.M. The fate of ochratoxin A during grape vinegar production. Int. J. Environ. Anal. Chem. 2021, 1–10. [Google Scholar] [CrossRef]
  35. Pankaj, S.K.; Wan, Z.; Colonna, W.; Keener, K.M. Effect of high voltage atmospheric cold plasma on white grape juice quality. J. Sci. Food Agric. 2017, 97, 4016–4021. [Google Scholar] [CrossRef]
  36. Langley-Evans, S.C. Antioxidant potential of green and black tea determined using the ferric reducing power (FRAP) assay. Int. J. Food Sci. Nutr. 2000, 51, 181–188. [Google Scholar] [CrossRef]
  37. Stroka, J.; Ambrosio, M.; Doncheva, I.; Lerda, D.; Mischke, C.; Breidbach, A. Validation of an Analytical Method to Determine the Content of Ochratoxin A in Animal Feed. European Commission Joint Research Centre Institute for Reference Materials and Measurements; Office for Official Publications of the European Communities: Luxembourg, 2009; p. 54. [Google Scholar]
  38. Leong, S.L.L.; Hocking, A.D.; Scott, E.S. The effect of juice clarification, static or rotary fermentation and fining on ochratoxin A in wine. Aust. J. Grape Wine Res. 2006, 12, 245–251. [Google Scholar] [CrossRef]
  39. Mine Kurtbay, H.; Bekçi, Z.; Merdivan, M.; Yurdakoç, K. Reduction of ochratoxin A levels in red wine by bentonite, modified bentonites, and chitosan. J. Agric. Food Chem. 2008, 56, 2541–2545. [Google Scholar] [CrossRef]
  40. Castellari, M.; Versari, A.; Fabiani, A.; Parpinello, G.P.; Galassi, S. Removal of ochratoxin A in red wines by means of adsorption treatments with commercial fining agents. J. Agric. Food Chem. 2001, 49, 3917–3921. [Google Scholar] [CrossRef]
  41. Nones, J.; Riella, H.G.; Trentin, A.G.; Nones, J. Effects of bentonite on different cell types: A brief review. Appl. Clay Sci. 2015, 105, 225–230. [Google Scholar] [CrossRef]
  42. Downing, D. Canning of juices, fruit drinks and water. In A Complete Course in Canning, Book III; Woodhead Publishing: Cambridge, UK, 1996. [Google Scholar]
  43. Al-Ghouti, M.A.; Al-Degs, Y.S.; Khraisheh, M.A.; Ahmad, M.N.; Allen, S.J. Mechanisms and chemistry of dye adsorption on manganese oxides-modified diatomite. J. Environ. Manag. 2009, 90, 3520–3527. [Google Scholar] [CrossRef] [PubMed]
  44. Concenco, F.; Brotto, G.F.; Nora, L. Grape wine and juice: Comparison on resveratrol levels. Int. J. Adv. Res. Sci. Eng. Technol. 2019, 6, 368–386. [Google Scholar] [CrossRef]
  45. Gulcin, İ. Antioxidants and antioxidant methods: An updated overview. Arch. Toxicol. 2020, 94, 651–715. [Google Scholar] [CrossRef] [PubMed] [Green Version]
  46. Gonçalves, F.J.; Jordão, A.M. Influence of different commercial fining agents on proanthocyanidin fraction and antioxidant activity of a red wine from Baga grapes. OENO One 2009, 43, 111–120. [Google Scholar] [CrossRef]
  47. Balík, J.; Kyseláková, M.; Tříska, J.; Vrchotová, N.; Veverka, J.; Híc, P.; Totušek, J.; Lefnerová, D. The changes of selected phenolic substances in wine technology. Czech J. Food Sci. 2009, 26, S3–S12. [Google Scholar] [CrossRef] [Green Version]
  48. Dordoni, R.; Galasi, R.; Colangelo, D.; De Faveri, D.M.; Lambri, M. Effects of fining with different bentonite labels and doses on colloidal stability and colour of a Valpolicella red wine. Int. J. Food Sci. Technol. 2015, 50, 2246–2254. [Google Scholar] [CrossRef]
  49. González-Neves, G.; Favre, G.; Gil, G. Effect of fining on the colour and pigment composition of young red wines. Food Chem. 2014, 157, 385–392. [Google Scholar] [CrossRef]
  50. Wasila, H.; Li, X.; Liu, L.; Ahmad, I.; Ahmad, S. Peel effects on phenolic composition, antioxidant activity, and making of pomegranate juice and wine. J. Food Sci. 2013, 78, C1166–C1172. [Google Scholar] [CrossRef]
  51. Bagci, P.O. Effective clarification of pomegranate juice: A comparative study of pretreatment methods and their influence on ultrafiltration flux. J. Food Eng. 2014, 141, 58–64. [Google Scholar] [CrossRef]
  52. Fang, Z.; Zhang, M.; Du, W.; Sun, J. Effect of fining and filtration on the haze formation in bayberry (Myrica rubra Sieb. et Zucc.) juice. J. Agric. Food Chem. 2007, 55, 113–119. [Google Scholar] [CrossRef]
  53. Ibrahim, S.M.; Bin Jumah, M.N.; Othman, S.I.; Alruhaimi, R.S.; Al-Khalawi, N.; Salama, Y.F.; Allam, A.A.; Abukhadra, M.R. Synthesis of Chitosan/Diatomite Composite as an Advanced Delivery System for Ibuprofen Drug; Equilibrium Studies and the Release Profile; ACS Omega: Washington, DC, USA, 2021. [Google Scholar]
  54. Ren, M.; Liu, S.; Li, R.; You, Y.; Huang, W.; Zhan, J. Clarifying effect of different fining agents on mulberry wine. Int. J. Food Sci. Technol. 2020, 55, 1578–1585. [Google Scholar] [CrossRef]
  55. Martínez-Patiño, J.C.; Gullón, B.; Romero, I.; Ruiz, E.; Brnčić, M.; Žlabur, J.Š.; Castro, E. Optimization of ultrasound-assisted extraction of biomass from olive trees using response surface methodology. Ultrason. Sonochemistry 2019, 51, 487–495. [Google Scholar] [CrossRef] [PubMed]
  56. Perez-Vizcaino, F.; Fraga, C.G. Research trends in flavonoids and health. Arch. Biochem. Biophys. 2018, 646, 107–112. [Google Scholar] [CrossRef]
  57. Sridhar, K.; Charles, A.L. In vitro antioxidant activity of Kyoho grape extracts in DPPH and ABTS assays: Estimation methods for EC50 using advanced statistical programs. Food Chem. 2019, 275, 41–49. [Google Scholar] [CrossRef] [PubMed]
  58. Yildirim, H.K. Effects of fining agents on antioxidant capacity of red wines. J. Inst. Brew. 2011, 117, 55–60. [Google Scholar] [CrossRef]
  59. Farahmand, M.; Golmakani, M.T.; Mesbahi, G.; Farahnaky, A. Investigating the effects of large-scale processing on phytochemicals and antioxidant activity of pomegranate juice. J. Food Process. Preserv. 2017, 41, e12792. [Google Scholar] [CrossRef]
  60. Zhang, L.; Wu, G.; Wang, W.; Yue, J.; Yue, P.; Gao, X. Anthocyanin profile, color and antioxidant activity of blueberry (Vaccinium ashei) juice as affected by thermal pretreatment. Int. J. Food Prop. 2019, 22, 1035–1046. [Google Scholar] [CrossRef] [Green Version]
Figure 1. Response surface plot of the effects of bentonite, gelatin, and diatomite concentration and clarifying time on ochratoxin A reduction amount (%) of grape juice. Influence of (A): gelatin and bentonite, (B): diatomite and bentonite, (C): time and bentonite, (D): diatomite and gelatin, (E): time and gelatin, (F): time and diatomite, on ochratoxin A reduction amount (%).
Foods 11 01432 g001
Figure 2. Response surface plot of the effects of bentonite, gelatin, and diatomite concentration and clarifying time on grape juice’s phenolic acid reduction amount (%). Influence of (A): gelatin and bentonite, (B): diatomite and bentonite, (C): time and bentonite, (D): diatomite and gelatin, (E): time and gelatin, (F): time and diatomite, on grape juice’s phenolic acid reduction amount (%).
Foods 11 01432 g002aFoods 11 01432 g002b
Figure 3. Response surface plot of the effects of bentonite, gelatin, and diatomite concentration and clarifying time on flavonoid reduction amount (%) of grape juice. Influence of (A): gelatin and bentonite, (B): diatomite and bentonite, (C): time and bentonite, (D): diatomite and gelatin, (E): time and gelatin, (F): time and diatomite, on grape juice’s flavonoid reduction amount (%).
Foods 11 01432 g003
Figure 4. Response surface plot of the effects of bentonite, gelatin, and diatomite concentration and clarifying time on grape juice’s antioxidant capacity reduction amount (%). Influence of (A): gelatin and bentonite, (B): diatomite and bentonite, (C): time and bentonite, (D): diatomite and gelatin, (E): time and gelatin, (F): time and diatomite, on grape juice’s antioxidant capacity reduction amount (%).
Foods 11 01432 g004
Figure 5. The optimum value of different variables for OTA removal of grape juice.
Foods 11 01432 g005
Table 1. Experimental design and results of OTA, phenolic acid, flavonoid, and antioxidant activity reduction percentage during grape juice clarification.
RunIndependent Variables Dependent Variables
X1: Bentonite (% w/v)X2:
Gelatin (% w/v)
X3: Diatomite (% w/v)X4:
Time
(h)
OTA (µg/kg)Loss of OTA (%)TPC
(µg/mL)
Loss of TPC (%)TFC
(µg/mL)
Loss
of TFC (%)
FRAP (µmol/L)Loss
of FRAP (%)
10.25 (−1)0.25 (−1)0.25 (−1)1 (−1)3.4730.56234.3320.81184.137.211138.3416.43
20.25 (−1)0.25 (−1)0.75 (+1)1 (−1)3.3732.65218.6826.10173.612.511122.4017.6
30.25 (−1)0.75 (+1)0.25 (−1)1 (−1)3.0738.55217.9426.35177.9110.341126.7617.28
40.25 (−1)0.75 (+1)0.75 (+1)1 (−1)3.0039.95202.9131.43164.1617.271113.2818.27
50.25 (−1)0.5 (0)0.5 (0)2 (0)3.3034.00214.6827.45173.2112.711120.7717.72
60.25 (−1)0.25 (−1)0.25 (−1)3 (+1)3.5030.06210.6628.81174.6911.961128.6717.14
70.25 (−1)0.25 (−1)0.75 (+1)3 (+1)3.4032.1194.8634.15164.1617.271115.0518.14
80.25 (−1)0.75 (+1)0.25 (−1)3 (+1)2.7445.15194.5634.25168.2615.201119.5417.81
90.25 (−1)0.75 (+1)0.75 (+1)3 (+1)2.7145.85179.0039.51147.3125.761105.9218.81
100.5 (0)0.5 (0)0.5 (0)1 (−1)3.0539.00218.2926.23172.5513.041137.1116.52
110.5 (0)0.5 (0)0.5 (0)2 (0)3.1038.00221.5825.12176.0811.261116.4118.04
120.5 (0)0.5 (0)0.5 (0)2 (0)3.0938.24216.8126.73171.4113.621116.2718.05
130.5 (0)0.5 (0)0.5 (0)2 (0)2.9241.7222.0824.95176.5511.031115.5918.1
140.5 (0)0.5 (0)0.5 (0)2 (0)2.9042.10216.3426.89172.812.921104.8318.89
150.5 (0)0.5 (0)0.5 (0)2 (0)2.9341.50215.9627.02172.3713.131101.2919.15
160.5 (0)0.5 (0)0.5 (0)2 (0)2.9141.75216.5826.81174.0412.291110.8318.45
170.5 (0)0.5 (0)0.5 (0)3 (+1)2.9441.15212.0528.34173.4712.581091.2119.89
180.75 (+1)0.25 (−1)0.75 (+1)1 (−1)3.6227.65202.3431.62164.1617.271113.1418.28
190.5 (0)0.25 (−1)0.5 (0)2 (0)3.5229.60215.627.14172.0813.281120.7717.72
200.5 (0)0.5 (0)0.25 (−1)2 (0)2.8143.80212.9128.05176.3411.131123.2217.54
210.5 (0)0.5 (0)0.75 (+1)2 (0)2.8842.45199.9832.42165.8216.431109.6018.54
220.5 (0)0.75 (+1)0.5 (0)2 (0)2.6047.97200.1532.36160.4819.131111.6418.39
230.75 (+1)0.25 (−1)0.25 (−1)1 (−1)2.8343.35216.4326.86180.049.271126.7617.28
240.75 (+1)0.25 (−1)0.25 (−1)3 (+1)2.7944.23194.8334.16166.1916.251119.5417.81
250.75 (+1)0.75 (+1)0.75 (+1)1 (−1)2.5449.23187.2236.73156.8620.951104.1518.94
260.75 (+1)0.75 (+1)0.25 (−1)1 (−1)2.5648.75203.3531.28173.6112.511117.5017.96
270.75 (+1)0.75 (+1)0.25 (−1)3 (+1)2.5349.32180.9538.85161.7218.501110.4218.48
280.75 (+1)0.75 (+1)0.75 (+1)3 (+1)2.4750.56163.5844.72147.2125.811096.8019.48
290.75 (+1)0.25 (−1)0.75 (+1)3 (+1)3.1237.54178.4939.68152.5523.121105.6518.83
300.75 (+1)0.5 (0)0.5 (0)2 (0)3.2734.67198.8232.81162.0318.341138.3418.39
OTA: ochratoxin A, TPC: total phenolic content, TFC: total flavonoid content, FRAP: Ferric Reducing Antioxidant Power.
Table 2. Data regarding method validation.
Spiked Concentration (µg/kg)RecoveryLinearity (µg mL−1)LOD (µg kg−1)LOQ (µg kg−1)
Intra-DayRSDInter-DayRDS
2.598.2512.5699.7814.87
5101.2311.87100.8515.870.05–250.070.23
1097.549.8796.0910.76
Table 3. ANOVA for responses by response surface method.
ResponseSourceSum of SquareDFMean SquareF ValueProbe > FModel
OTA reduction amount (%)Model872.194218.0516.96<0.0001Linear
Lack of fit303.422015.174.240.0580
Pure error17.9153.58
Total49,307.99301643.60
R2 0.7308
TPC reduction amount (%)Model207.72451.9326.57<0.0001Quadratic
Lack of fit24.80102.482.750.1380
Pure error4.5150.90
Total28,908.9130963.63
R2 0.9651
TFC reduction amount (%)Model78.65419.666.730.0026Quadratic
Lack of fit38.24103.833.510.0892
Pure error5.4751.09
Total7423.3830247.45
R2 0.9282
FRAP reduction amount (%)Model12.3843.0914.14<0.001Linear
Lack of fit4.34200.220.960.5809
Pure error1.1350.23
Total9880.1330329.34
R2 0.6935
Table 4. Regression coefficients of coded factors for the responses during the optimization of grape juice clarification.
CoefficientsReduction of OTA (%)p-ValueReduction of TPC (%)p-ValueReduction of TFC (%)p-ValueReduction of FRAP (%)p-Value
Intercept (X0)+40.05-+27.07-+13.06-+18.13-
X1+3.140.0010+2.66<0.0001+1.770.0005+0.350.0042
X2+5.98<0.0001+2.56<0.0001+2.070.0001+0.340.0045
X3−0.880.3092+2.61<0.0001+3.56<0.0001+0.510.0001
X4+1.460.0965+3.61<0.0001+2.56<0.0001+0.430.0006
X1X2--−0.150.6726−0.490.2735--
X1X3--+0.0390.9118+0.160.7159--
X1X4--−0.0690.8453+0.0510.9073--
X2X3--+0.0470.8951+0.480.2742--
X2X4--+8.125 × 10−30.9818+0.120.7888--
X3X4--+0.0880.8044+0.0860.8431--
X12--+2.250.0207+1.780.1135--
X22--+1.870.0484+2.460.0350--
X32--+2.350.0162+0.0400.9703--
X42--−0.600.5012−0.930.3938--
Publisher’s Note: MDPI stays neutral with regard to jurisdictional claims in published maps and institutional affiliations.

