3.1. Physicochemical Data
Fruit pH showed a statistically significant (
p ≤ 0.05) difference among date palm cultivars, and cv. Khalas had the highest fruit pH, followed by Sukkari, Sheshi, Khodry, and Sullag (
Table 1). Similarly, the TSS was maximum in cv. Khalas and minimum in cv. Salag. The lowest moisture content was recorded in cvs. Rushodiya and Sukari, which were statistically at par, whereas it was highest in cv. Sagai. The highest range of water activity was determined in cvs. Rushodiya and Sagai, followed by Khadri, which significantly decreased in cvs. Ruziez, Medjool, and Ajwa.
Previous studies have demonstrated that various date cultivars have considerable variations in fruit physicochemical attributes [
23,
54,
55,
56]. The pH variations can affect the fruits’ flavor, aroma, texture, and shelf life due to organic acids, which change from cultivar to cultivar. Since pH levels greater than 4.6 indicate low-acidic values, the current investigation found that all date palm cultivars at the Tamar stage exhibited low-acidic qualities. It has already been reported in a few other studies that the fruit pH decreases with maturity stages, and it is lowest at the final stage of ripening [
57,
58,
59]. In general, the increase in the TSS value is related to the decrease in the moisture content of the fruit [
60,
61,
62].
In this study, it was observed that each cultivar of the ten tested cultivars responded individually. For example, the TSS value in cv. Khalas was 71% higher than the moisture content, which means the higher TSS value of cv. Khalas might be due to the significant decrease in moisture content from the fruit surface. The moisture content of date palm fruits declines rapidly as they ripen. For example, the fruits of certain date palm cultivars that were sold as fresh at the Rutab stage have a moisture content of less than 35%. It further decreases to less than 24% when the fruit ripened at the Tamar stage and reaches 4–10% in ripened dry date cultivars [
63,
64]. Similarly, date fruits with a moisture content < 40% and a water activity < 0.90 are generally unsuitable for microbial growth [
65].
Our results indicated 15.72–21.06% of the moisture content in the date palm cultivars studies and are categorized as semi-dry cultivars. These findings coincide with those previously reported, with a few variations due to the date palm cultivars and climatic conditions [
66,
67,
68]. Due to its importance as an index of date quality stability and microbial spoilage, water activity must be considered in date fruit standards. A water activity of more than 0.95 generally encourages the growth of microorganisms in fruits and vegetables [
69]. Nadeem et al. [
70] reported that many local and commercial date palm cultivars had a 0.32 to 0.48 water activity. Aleid et al. [
8] reported a non-significant difference in water activity in date palm cultivars, i.e., Sukkary, Khalas, Sugai, and Anbara, ranging from 0.417 to 0.623. They were studied on date palm cvs. Aseel, Dhakki, Karbalain, Muzawati, and Rabai, Rashid et al. [
71] determined the lowest water activity (0.680) in cv. Aseel and highest (0.795) in cv. Rabai. They stated that the product deterioration risk is minimal in cv. Aseel because of low water activity. In the present study, although the water activity in all date palm cultivars is lower than 0.95, cys. Ruziez, Ajwa, Medjool, Sullag, Sheshi, and Sukkari cultivars have minimal risk of microbial spoilage.
Fruit pH was significantly decreased when date palm fruits were stored for different durations (
Table 2). It was higher in unstored fruits (6.07), which decreased to 5.69 after 6 months of storage. Fruit TSS, moisture content, and water activity showed the opposite trend to pH, as these attributes increased with the increase in storage duration. Unstored fruits had a lower TSS (42.32 Brix), moisture content (17.05%), and water activity (0.49) compared to fruits stored for 6 months, which had a higher TSS (64.11 Brix), moisture content (19.49%), and water activity (0.64).
Hazbavi et al. [
72] mentioned that, after storing dates (cv. Stamaran) for six months of storage, the pH was reduced by 5.4%. A 10.97% decrease in the pH of the date palm cv. Tamar fruits of date palm (cv. Khalas) stored at −18 °C for 6 months had the lowest pH compared to Khalal and Rutab fruits [
7]. Aleid et al. [
8] reported that fruit pH decreased while TSS and moisture content increased when the date fruits (cv. Khalas) were stored at 5 °C for 12 months.
The findings of the present study showed a 6.26% reduction in the fruit pH after 6 months of storage. Microorganisms’ fermentative activity results in the production of organic acids and a decrease in pH [
73]. According to our study, the TSS of date palm fruits stored for 6 months increased by 51.48%. Similarly, an increase in TSS was observed in date palm cv. Barhi, which was stored for 70 days at 0 °C and 90–95% RH [
60]. The TSS increased in Tamar fruits of date palms (cv. Mazafati) stored for 180 days at 4 °C [
19]. The enzymatic conversion of large polysaccharides into small sugars would be the main reason for the increase in TSS [
72]. Radi et al. [
74] suggested that the increase in TSS of date fruits during storage could be related to microbial and enzymatic activities degrading high molecular weight compounds to low molecular weight ones.
Our study also showed that the moisture content and water activity of date palm fruits were increased by about 14.31% and 30.61%, respectively, after 6 months of storage. Mohammed et al. [
14] recorded a 19.05% moisture content and 0.76 water activity in date fruits (cv. Khalas) stored at 5 °C and 80% RH. Another study indicated that the moisture content was not significantly increased in cvs. Majhoul and Boufeggous, whereas TSS was increased in cv. Majhoul after 5 months of storage at 2–4 °C and 66–68.5% RH [
75]. The evaporation of fruit water caused by the relatively high temperature and moderate RH could explain the decrease in both moisture and water activity.
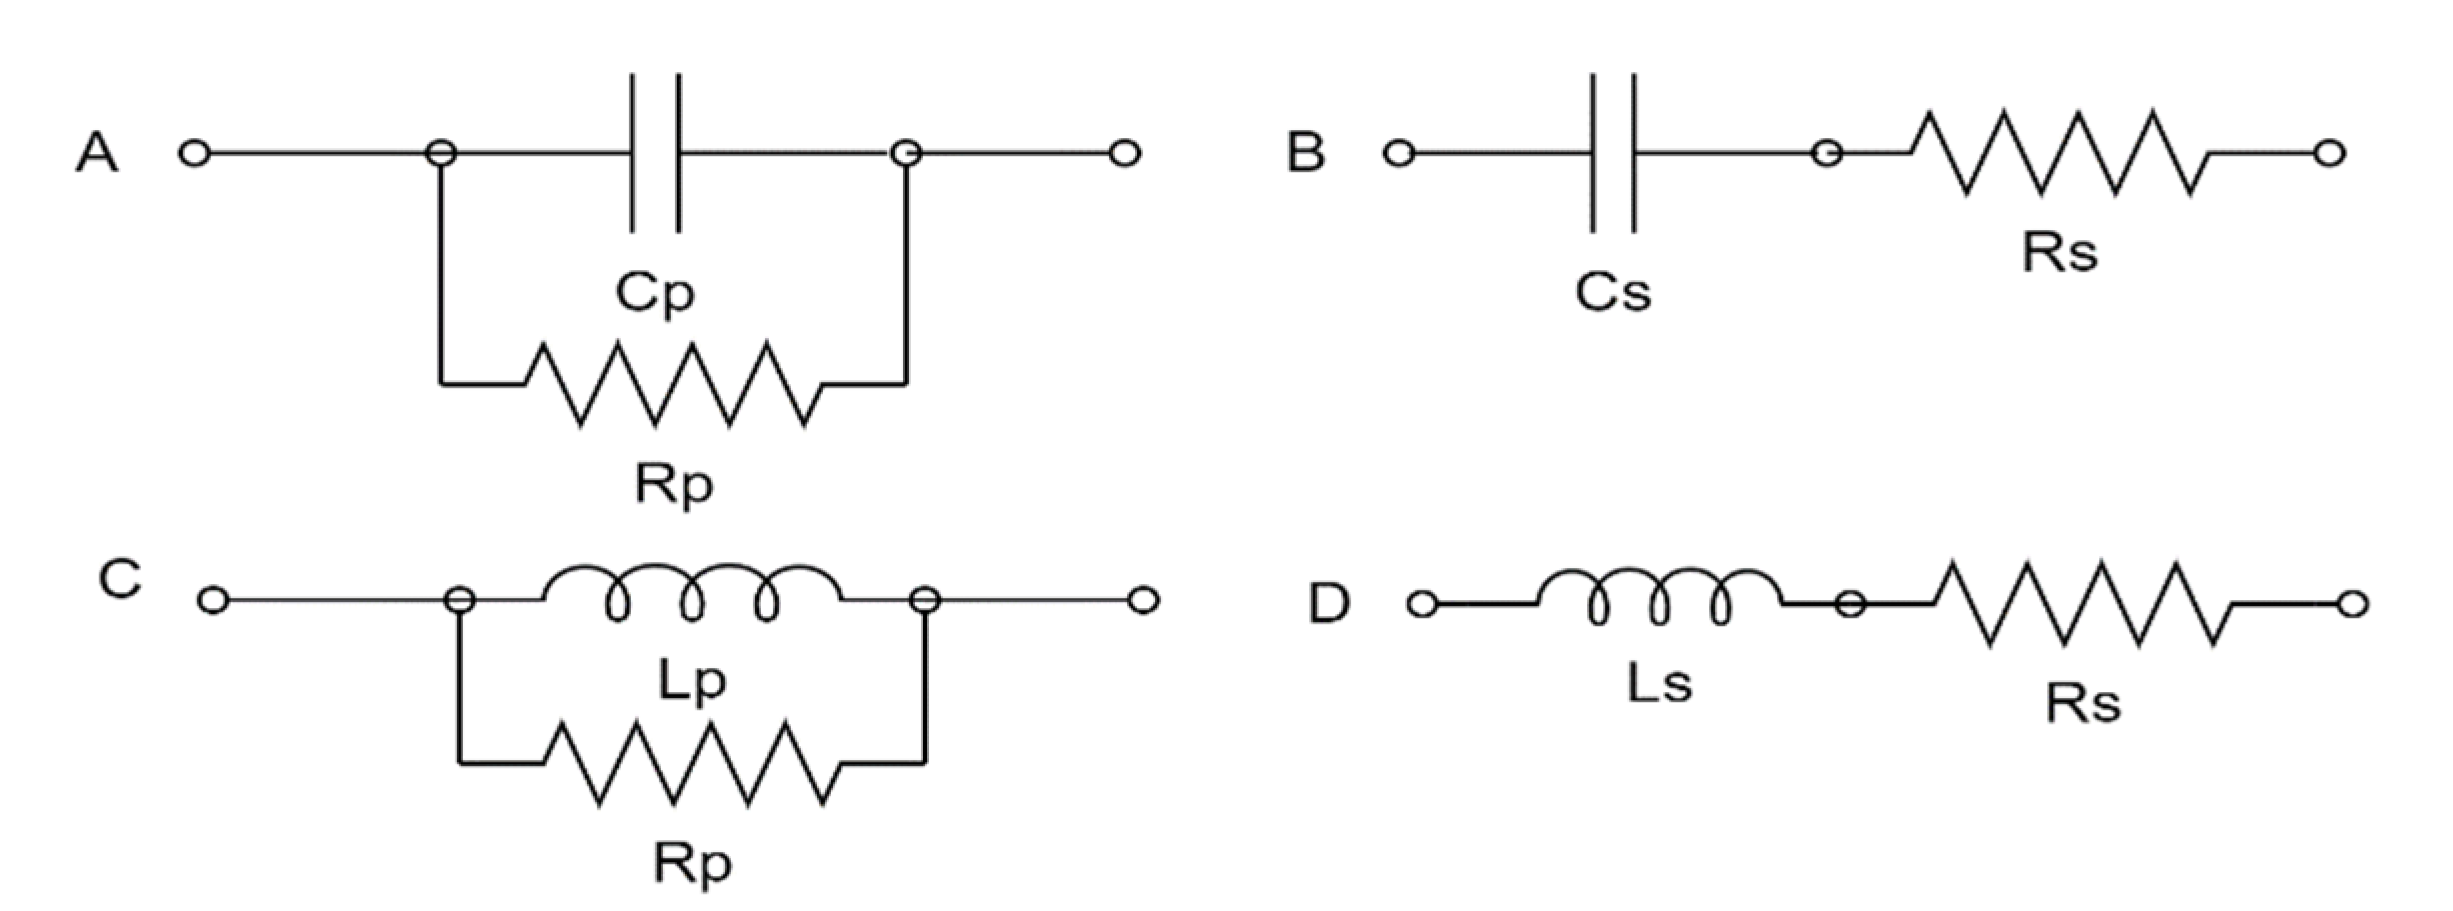
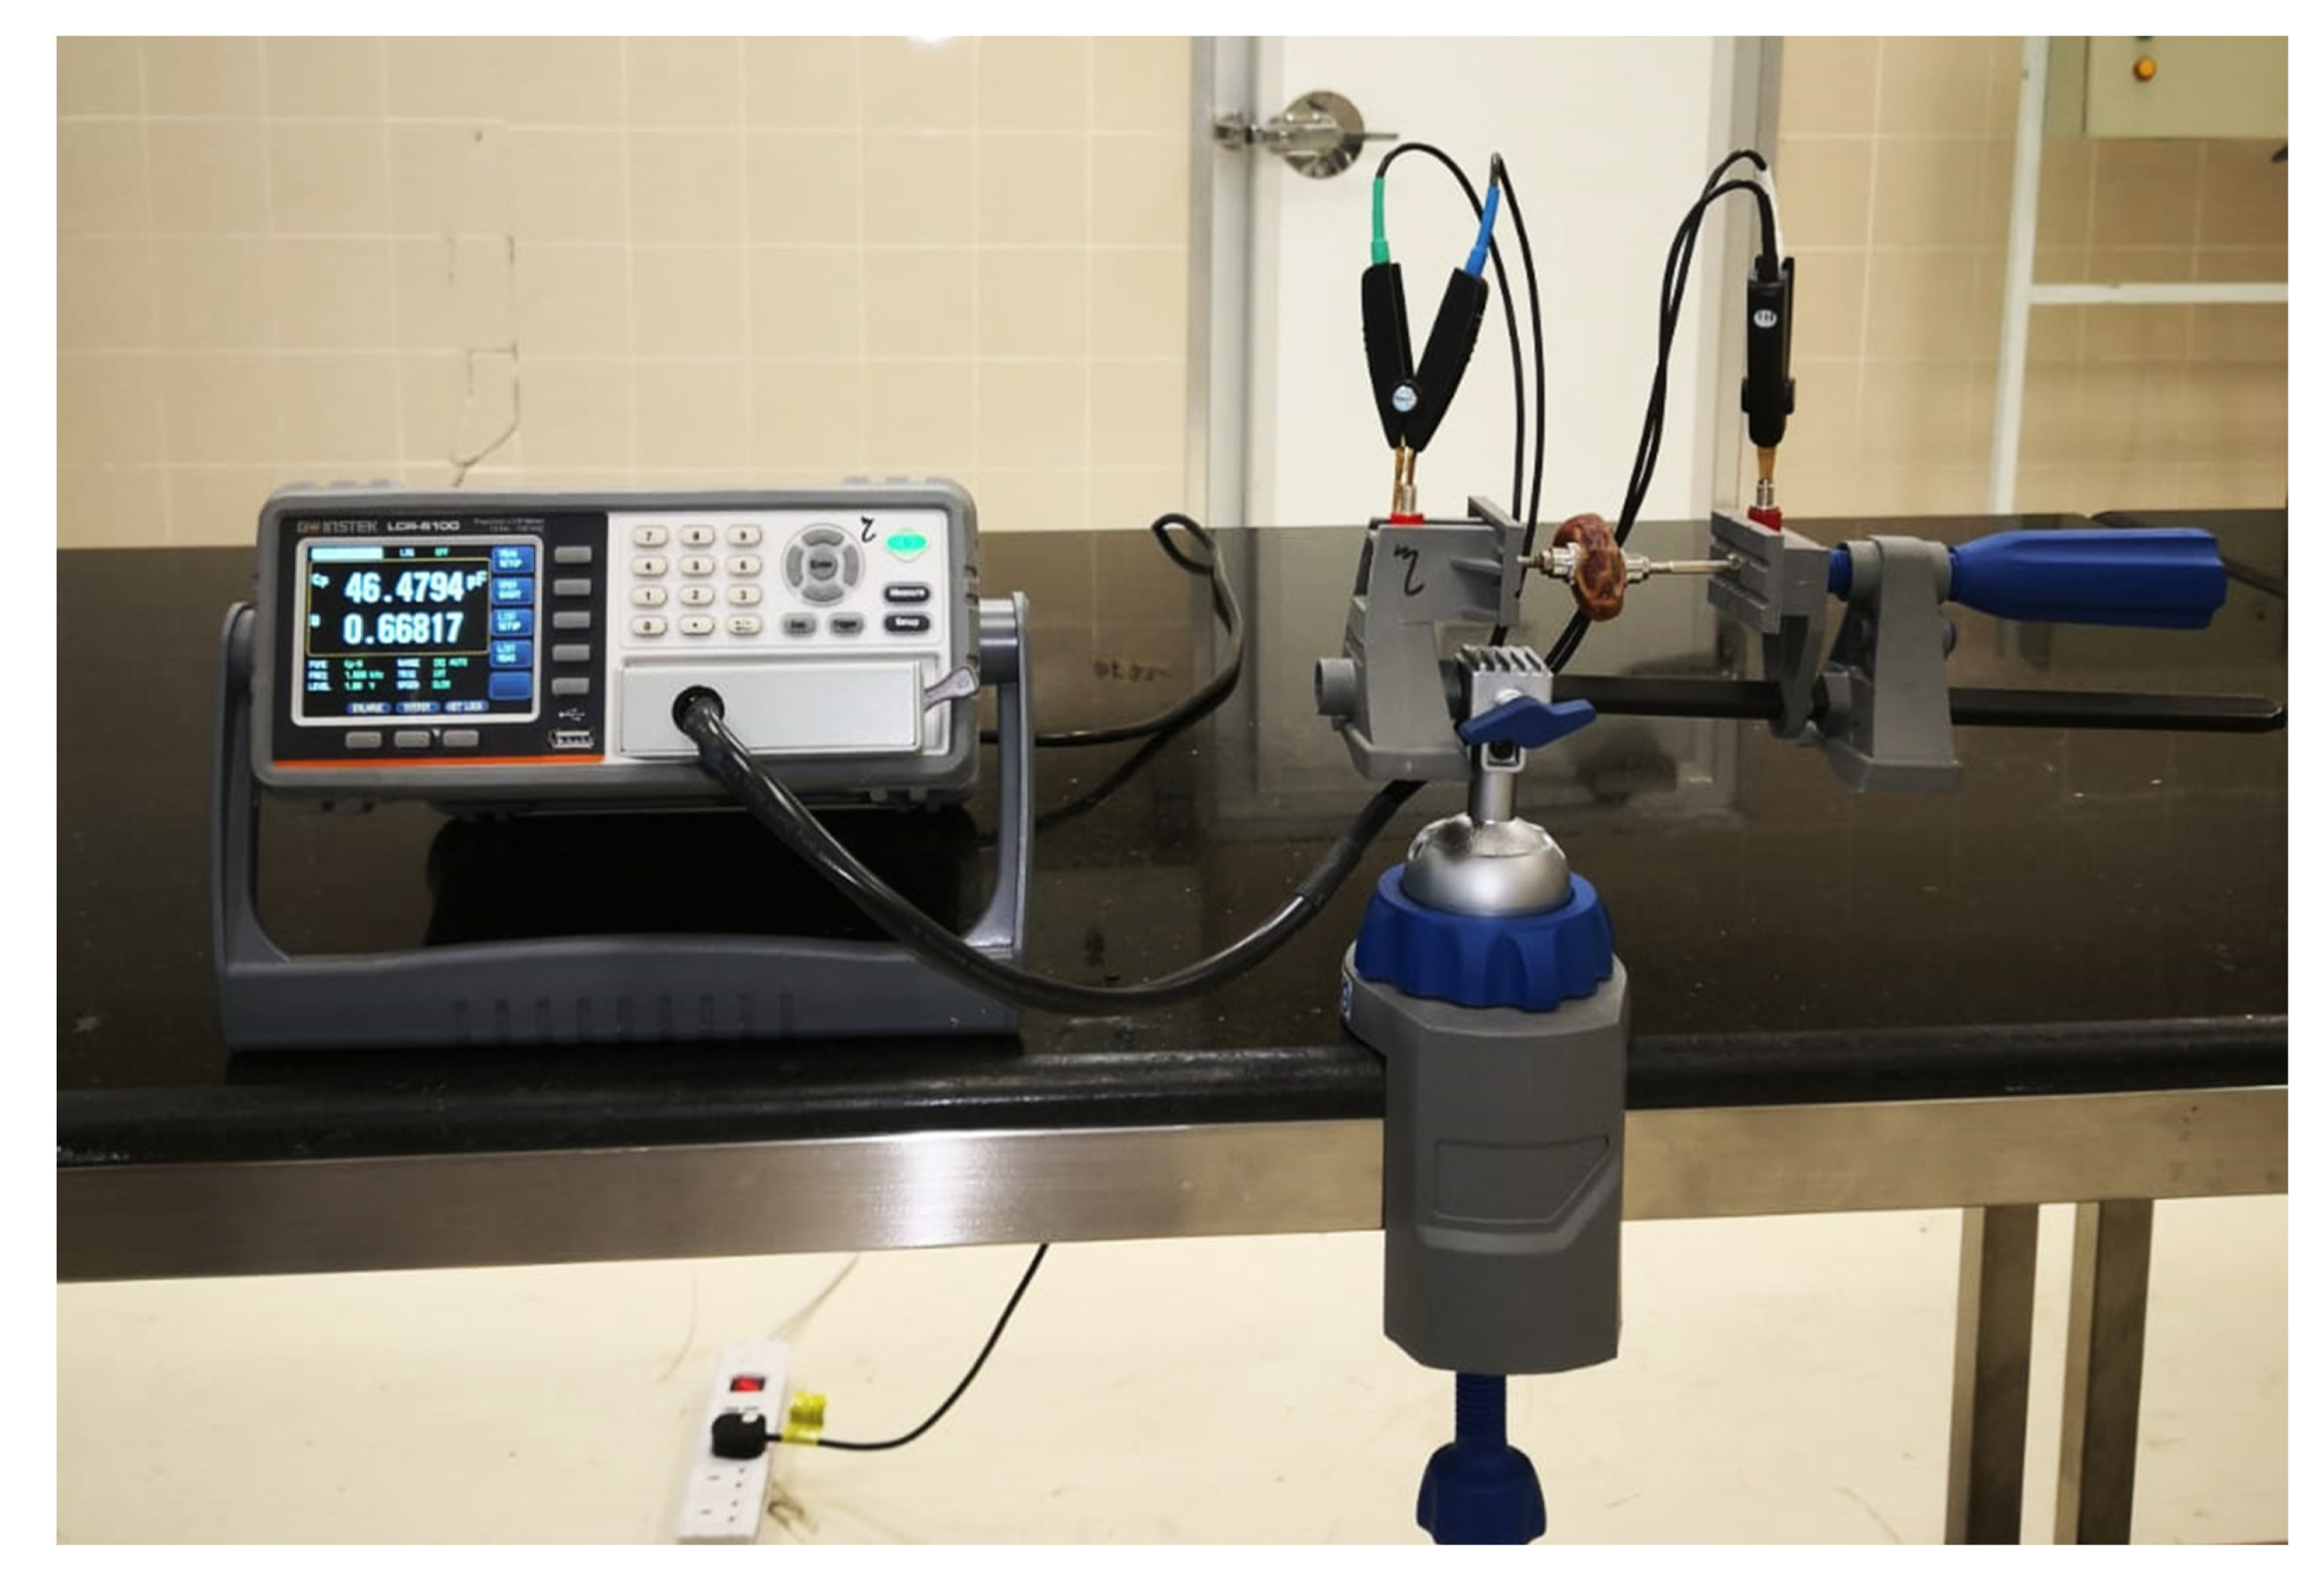
3.2. Electrical Properties Data
The electrical properties of date palm fruits were determined at different frequencies and were significant at
p ≤ 0.05 (
Table 3). The measured electrical properties, such as the capacitance value (series equivalent circuit model), equivalent series resistance, dissipation factor, capacitance value (parallel equivalent circuit model), equivalent parallel resistance, resistance, and the absolute value of impedance, were very large at a low frequency (10 Hz). However, the reactance, phase radian, and phase angle electrical properties were higher at 100 Hz. As a result, the inductance value (series equivalent circuit model) was a maximum at 1000 Hz frequency, while the inductance value (parallel equivalent circuit model) was measured as higher than 100,000 Hz. The statistical difference was non-significant regarding the direct current resistance parameter; however, its value was linearly increased with the increase in frequency.
Due to the high electrical capacity of cell membranes, electrical current only flowed via extracellular fluid, which has a relatively high resistance in the low-frequency area. However, the impedance drops significantly in the high-frequency range because the current can travel through intracellular fluid, which has a low resistance. It can be seen that, as the frequency increased, the impedance decreased dramatically. Dispersion is a phenomenon in which the decrease in impedance is proportional to the increase in frequency [
46]. As the frequency increased, the capacitance of the cell membrane dropped. The amount of water in biological cells is critical for their structural and functional integrity [
42]. As a result, it is supposed that when fruit moisture is reduced, structural changes in the cell membrane cause a decrease in cell membrane capacitance [
43]. The ion efflux across the fruit membrane produced by osmotic changes in the extracellular fluid modified the electrical properties of the cell membrane. Thus, alterations in cell membrane capacitance could have been created by ion movement caused by plasmolysis when moisture is declined [
34,
43]. Heat injury to plant cells causes a reduction in the capacitance of the cell membrane [
40].
At low temperatures, electrode polarization was shown to account for a higher fraction of overall impedance in potatoes, but extracellular resistance and capacitances continued to decline. It could be the electrolyte leakage to the extracellular space, presumably due to membrane injury [
76]. Soltani et al. [
77] applied a capacitance sensing system to predict banana quality during ripening and found a good relationship between SSC and firmness at a 1 MHz frequency. Similarly, the highest inductive value was observed at 34 MHz frequency to determine the ripening time of oil palm fruit bunch [
78]. The electrical impedance values of various apple cultivars rapidly decreased, which is assumed to correlate to dispersion induced by cell membrane capacitance [
39,
41]. Electrical current flows through the extracellular fluid at low frequencies, thereby avoiding cell membranes. At high frequencies, however, the cell membranes act as a conductor. The current flows through the intracellular fluid, which contains more electrolytes; thus, the impedance at low frequencies is higher [
39,
79].
Table 4 shows that the average values of important electrical properties of date palm fruits were significantly (
p ≤ 0.05) varied at different storage durations (0, 2, 4, and 6 months). The fruits before storage showed higher values regarding series resistance, dissipation factor, parallel resistance, resistance, direct current resistance, the absolute value of impedance, phase radian, and phase angle. However, there was a non-significant difference in the phase radian and phase angle parameters between before storage and 2 months of storage fruits. The maximum quality factor value was observed in fruits stored for 4 months, followed by 6 months of storage fruits and before storage fruits. The capacitance value (series equivalent circuit model), capacitance value (parallel equivalent circuit model), inductance value (parallel equivalent circuit model), inductance value (series equivalent circuit model), and reactance were maximal after 6 months of cold storage fruits. However, there was a non-significant difference in the capacitance value (series equivalent circuit model) and capacitance value (parallel equivalent circuit model) parameters between 4 and 6 months of stored fruits.
Different researchers reported that fruit electrical conduction increases with temperature, field strength, storage duration, sugar concentration, and fruit firmness [
38,
80,
81,
82,
83,
84]. Watanabe et al. [
39] stated that the initial resistance and reactance values of apple fruit varied by cultivar and declined as storage duration increased. The non-uniformity of electrical characteristics was attributed to non-uniform conditions, such as differences in cell size or shape between cultivars. They also stated that the LTO, which relates to the resistance of the extracellular parts of the fruit, declined after four weeks of storage and then increased. However, it decreased after 16 weeks of storage in some apple cultivars. Our study indicated that resistance decreased with the increase in storage duration. Extracellular resistance has been reported to decrease in vegetables due to the degradation of cell membrane integrity during storage [
44,
85]. It is assumed that the electrical resistance increase in apples after storage was caused by water transpiration during storage [
86]. The water activity and moisture content of apples significantly impacted dielectric characteristics during storage. Therefore, the change in electrical parameters can be used to indirectly reflect changes in internal quality [
35]. Jiangjie et al. [
87] found that a frequency of 39.8 kHz could be used for nondestructive post-harvest quality detection for new red star apples, and that the absolute value of impedance, equivalent parallel resistance, and capacitance could be used as sensitive electrical parameters to indicate quality parameter changes during the ripening and senescence. According to Sastry [
88], electrical conduction increases with storage duration and the difference was negligible when the temperature is changed. In the present study, electrical parameters such as capacitance, dissipation factor, inductance, and reactance increased with the increased storage time.
3.3. Correlation between Physicochemical and Electrical Properties
Table 5 shows the correlation between the fruit physicochemical traits, such as pH, TSS, moisture content, and water activity. The electric parameters at various frequencies vary significantly, either positively or negatively. At a low frequency (10 Hz), there was a significant positive correlation between pH, inductance value (parallel), and inductance value (series); and TSS, moisture content, and water activity with capacitance value (parallel) and quality factor. Similarly, at 100 Hz frequency, pH had a strong positive correlation with dissipation, phase radian, phase angle, and quality factor. The electrical parameters, inductance value (parallel) and inductance value (series), had a better positive correlation with TSS and moisture content.
In contrast, water activity positively correlated with inductance value (parallel) at 1000 Hz frequency. The electric parameter reactance was positively correlated with pH and moisture content at a 10,000 Hz frequency. At a high frequency (100,000 Hz), fruit pH was positively correlated with equivalent series resistance, capacitance value (parallel), equivalent parallel resistance, resistance, and the absolute value of impedance; fruit TSS with capacitance value (series) and reactance; moisture content with capacitance value (series), phase radian, and phase angle; and water activity with capacitance value (series), dissipation factor, inductance value (series), reactance, phase radian, and phase angle.
The electrical resistance showed a significant decline as the citrus fruit matured and was closely correlated to the changes in pH [
89]. Our results showed a negative correlation of resistance when correlated with pH, TSS, moisture content, and water activity. However, it positively correlated with pH when the frequency was 10,000 and 100,000 Hz. A reduced resistance is also linked to a reduction in hardness and TSS rise [
90]. Soltani et al. [
77] found a correlation between the soluble solid contents, firmness of the fruit, and the capacitance sensing system parameters. There was a strong correlation between the quality parameters and the relative permittivity of the capacitive property. Citrus tissues found a linear relationship between the matrix moisture content and the dielectric constant γ-relaxation was found in citrus tissues. They indicated that the dielectric constant under γ-relaxation is an important tool for predicting the moisture content of citrus fruit [
91]. The highest correlation with various frequencies predicted the quality parameters of the damaged apples [
92]. The cell wall, membranes, and composition of the cell contents may all undergo significant modifications during storage. All these alterations would have an impact on tissue capacitance. A change in reactance can be used to indicate changes in capacitance. The impedance values will change when the resistance and reactance parameters change. As a result, its relationship with physicochemical properties will be comparable. During the storage of date fruits, the value of resistance and reactance decreased, lowering the value of its impedance [
93].
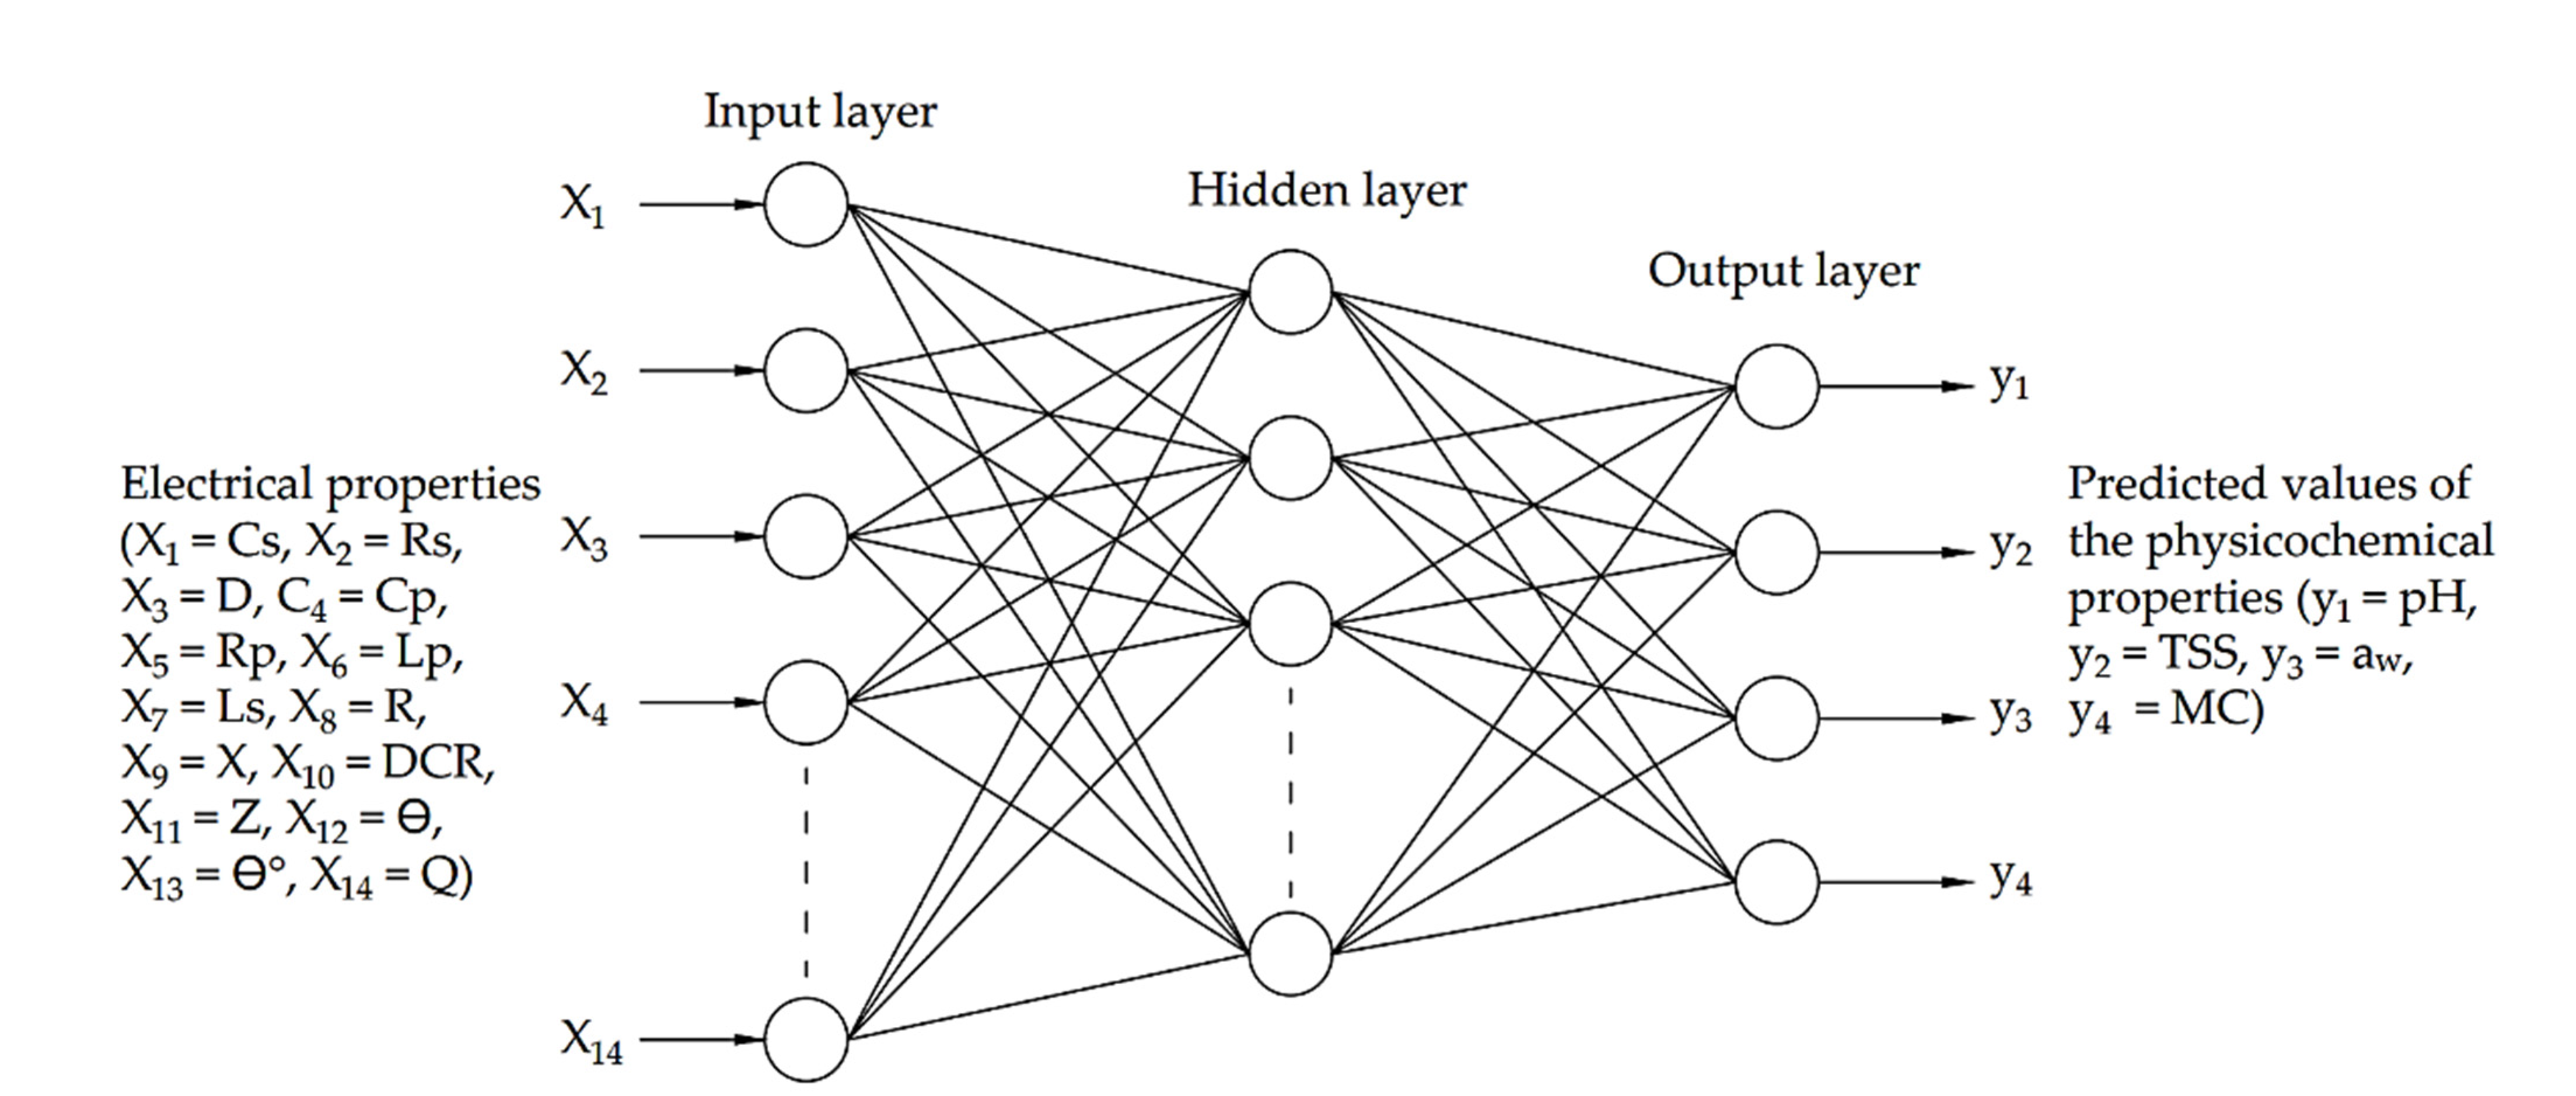
3.4. ANNs and MLR Models
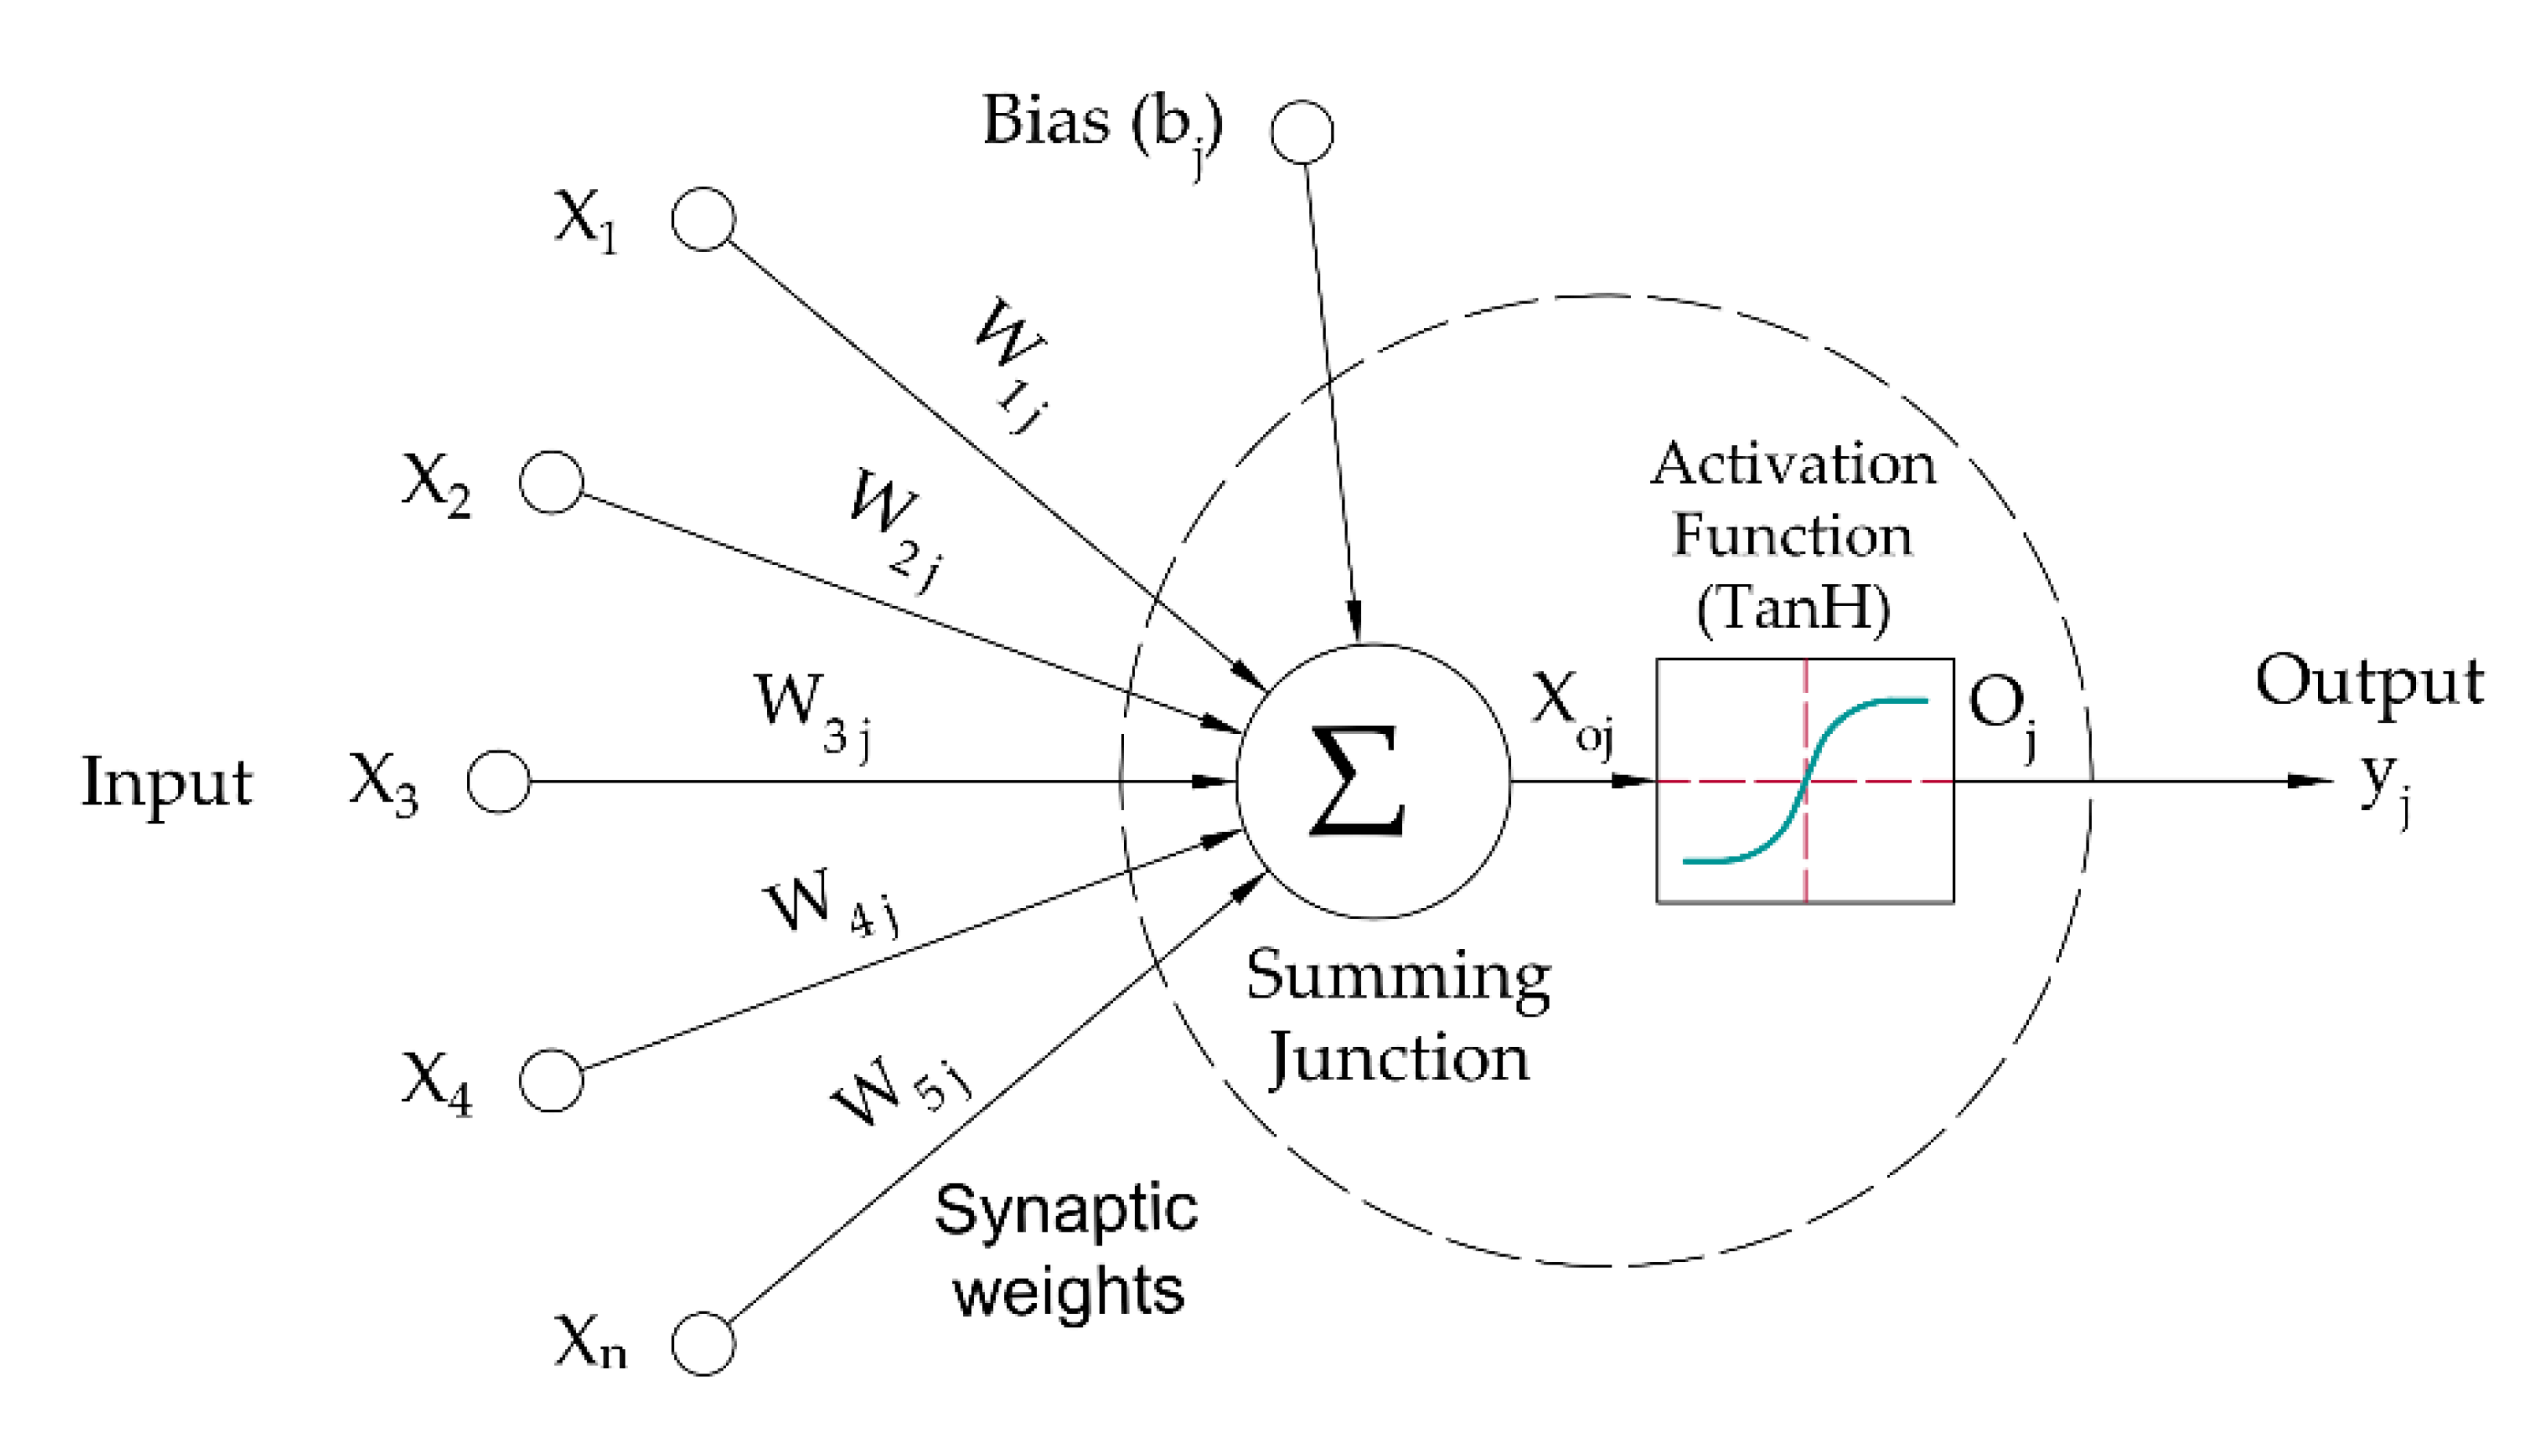
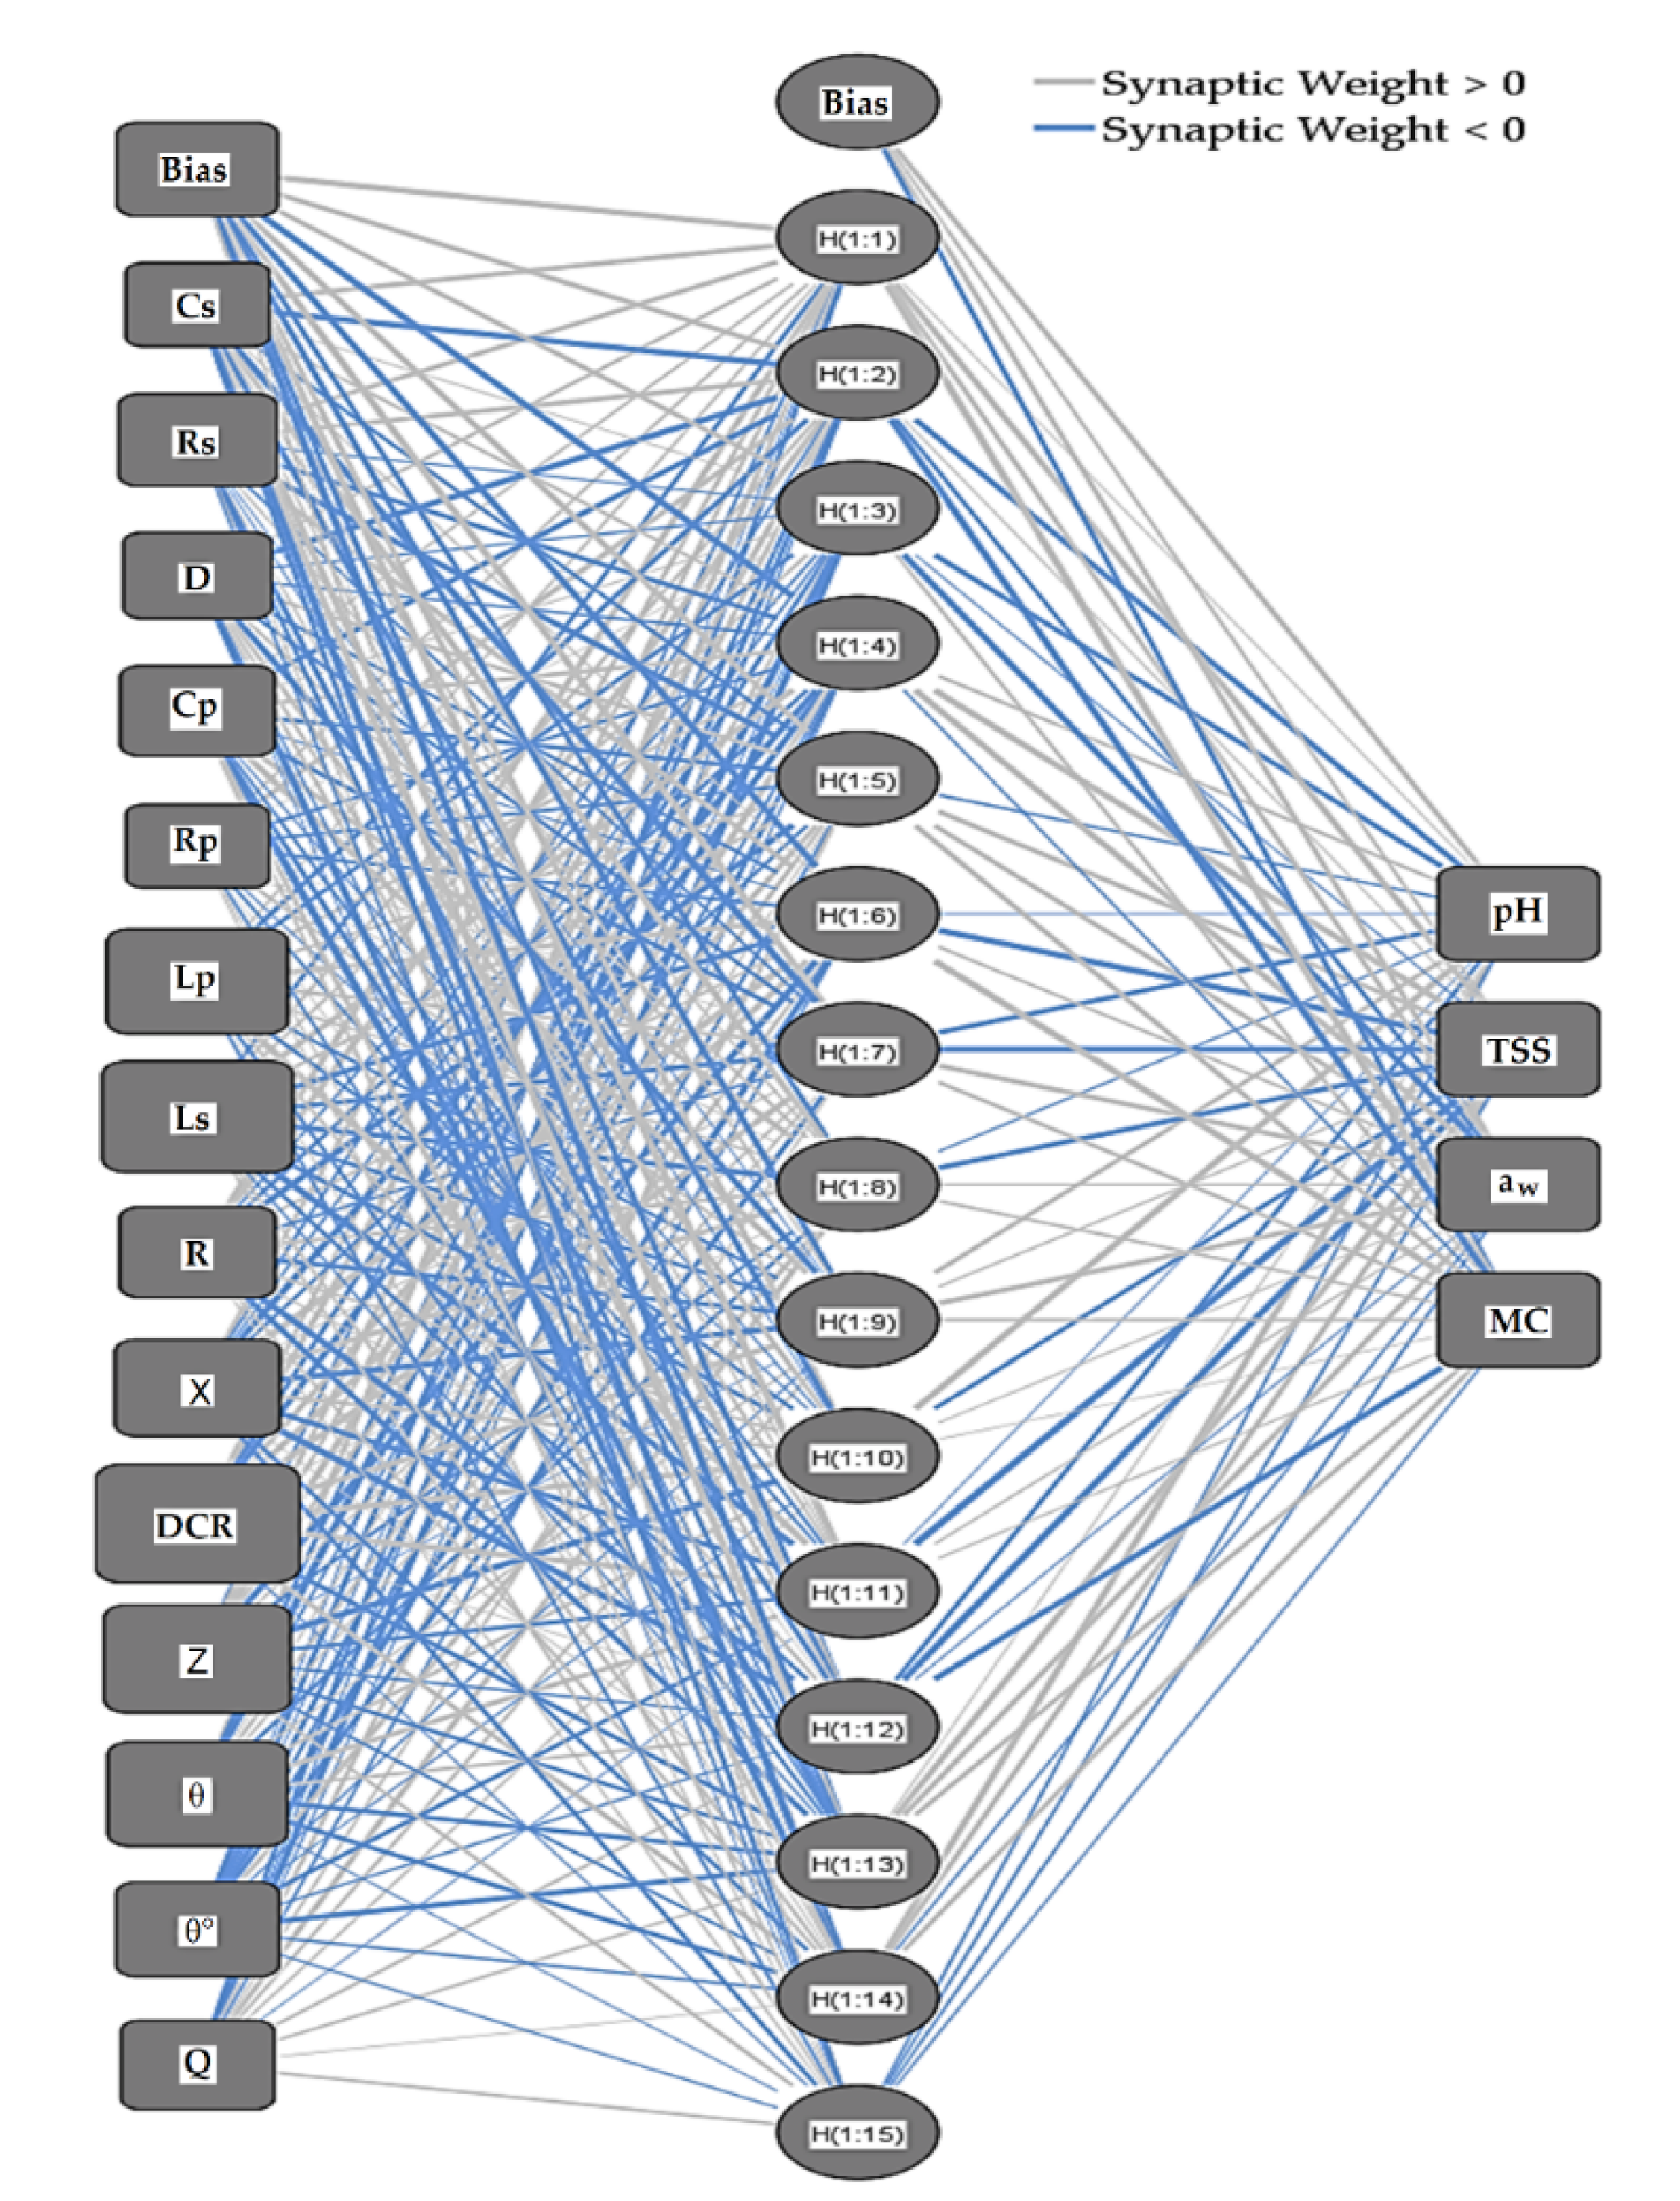
The ANNs technique in SPSS was adopted to determine the optimal prediction model at different testing frequencies. The number of hidden layers was one for all ANNs at the various testing frequencies. The input layer in the ANNs at 10 and 100 Hz contains 13 neurons for the independent variables (Cs, Rs, D, Cp, Rp, Ls, R, X, DCR, Z, ϴ, ϴ°, and Q), and the optimal hidden layers contain 12 neurons at 10 Hz and 14 neurons at 100 Hz. The input layer in the ANNs at 1000, 10,000, and 100,000 Hz contains 14 neurons for the independent variables (Cs, Rs, D, Cp, Rp, Ls, Lp, R, X, DCR, Z, ϴ, ϴ°, and Q), and the optimal hidden layers contain 15 neurons. The output layer contains four neurons for the dependent variables (pH, TSS, aw, and MC). The rescaling method for covariates was standardized. The activation function applied for the hidden layers was a hyperbolic tangent. The activation function applied for the output layers was Identity for all ANNs models at the different testing frequencies. About 60% of the measured data were used as a training dataset, 20% for model testing, and 20% for evaluation. The sum of squares was used as an error function because of the Identity function.
Figure 5 shows the optimal ANNs diagram applied to predict the pH, TSS, a
w, and MC of the date fruits during cold storage based on their electrical properties at 10,000 Hz. The diagram shows the 14 input nodes (Cs, Rs, D, Cp, Rp, Ls, Lp, R, X, DCR, Z, ϴ, ϴ°, and Q), the 15 hidden nodes, and the 4 output nodes representing the predicted values of the target physicochemical properties (pH, TSS, a
w, and MC). The trained ANNs quickly determine the target physicochemical properties when fed the system’s electrical properties data.
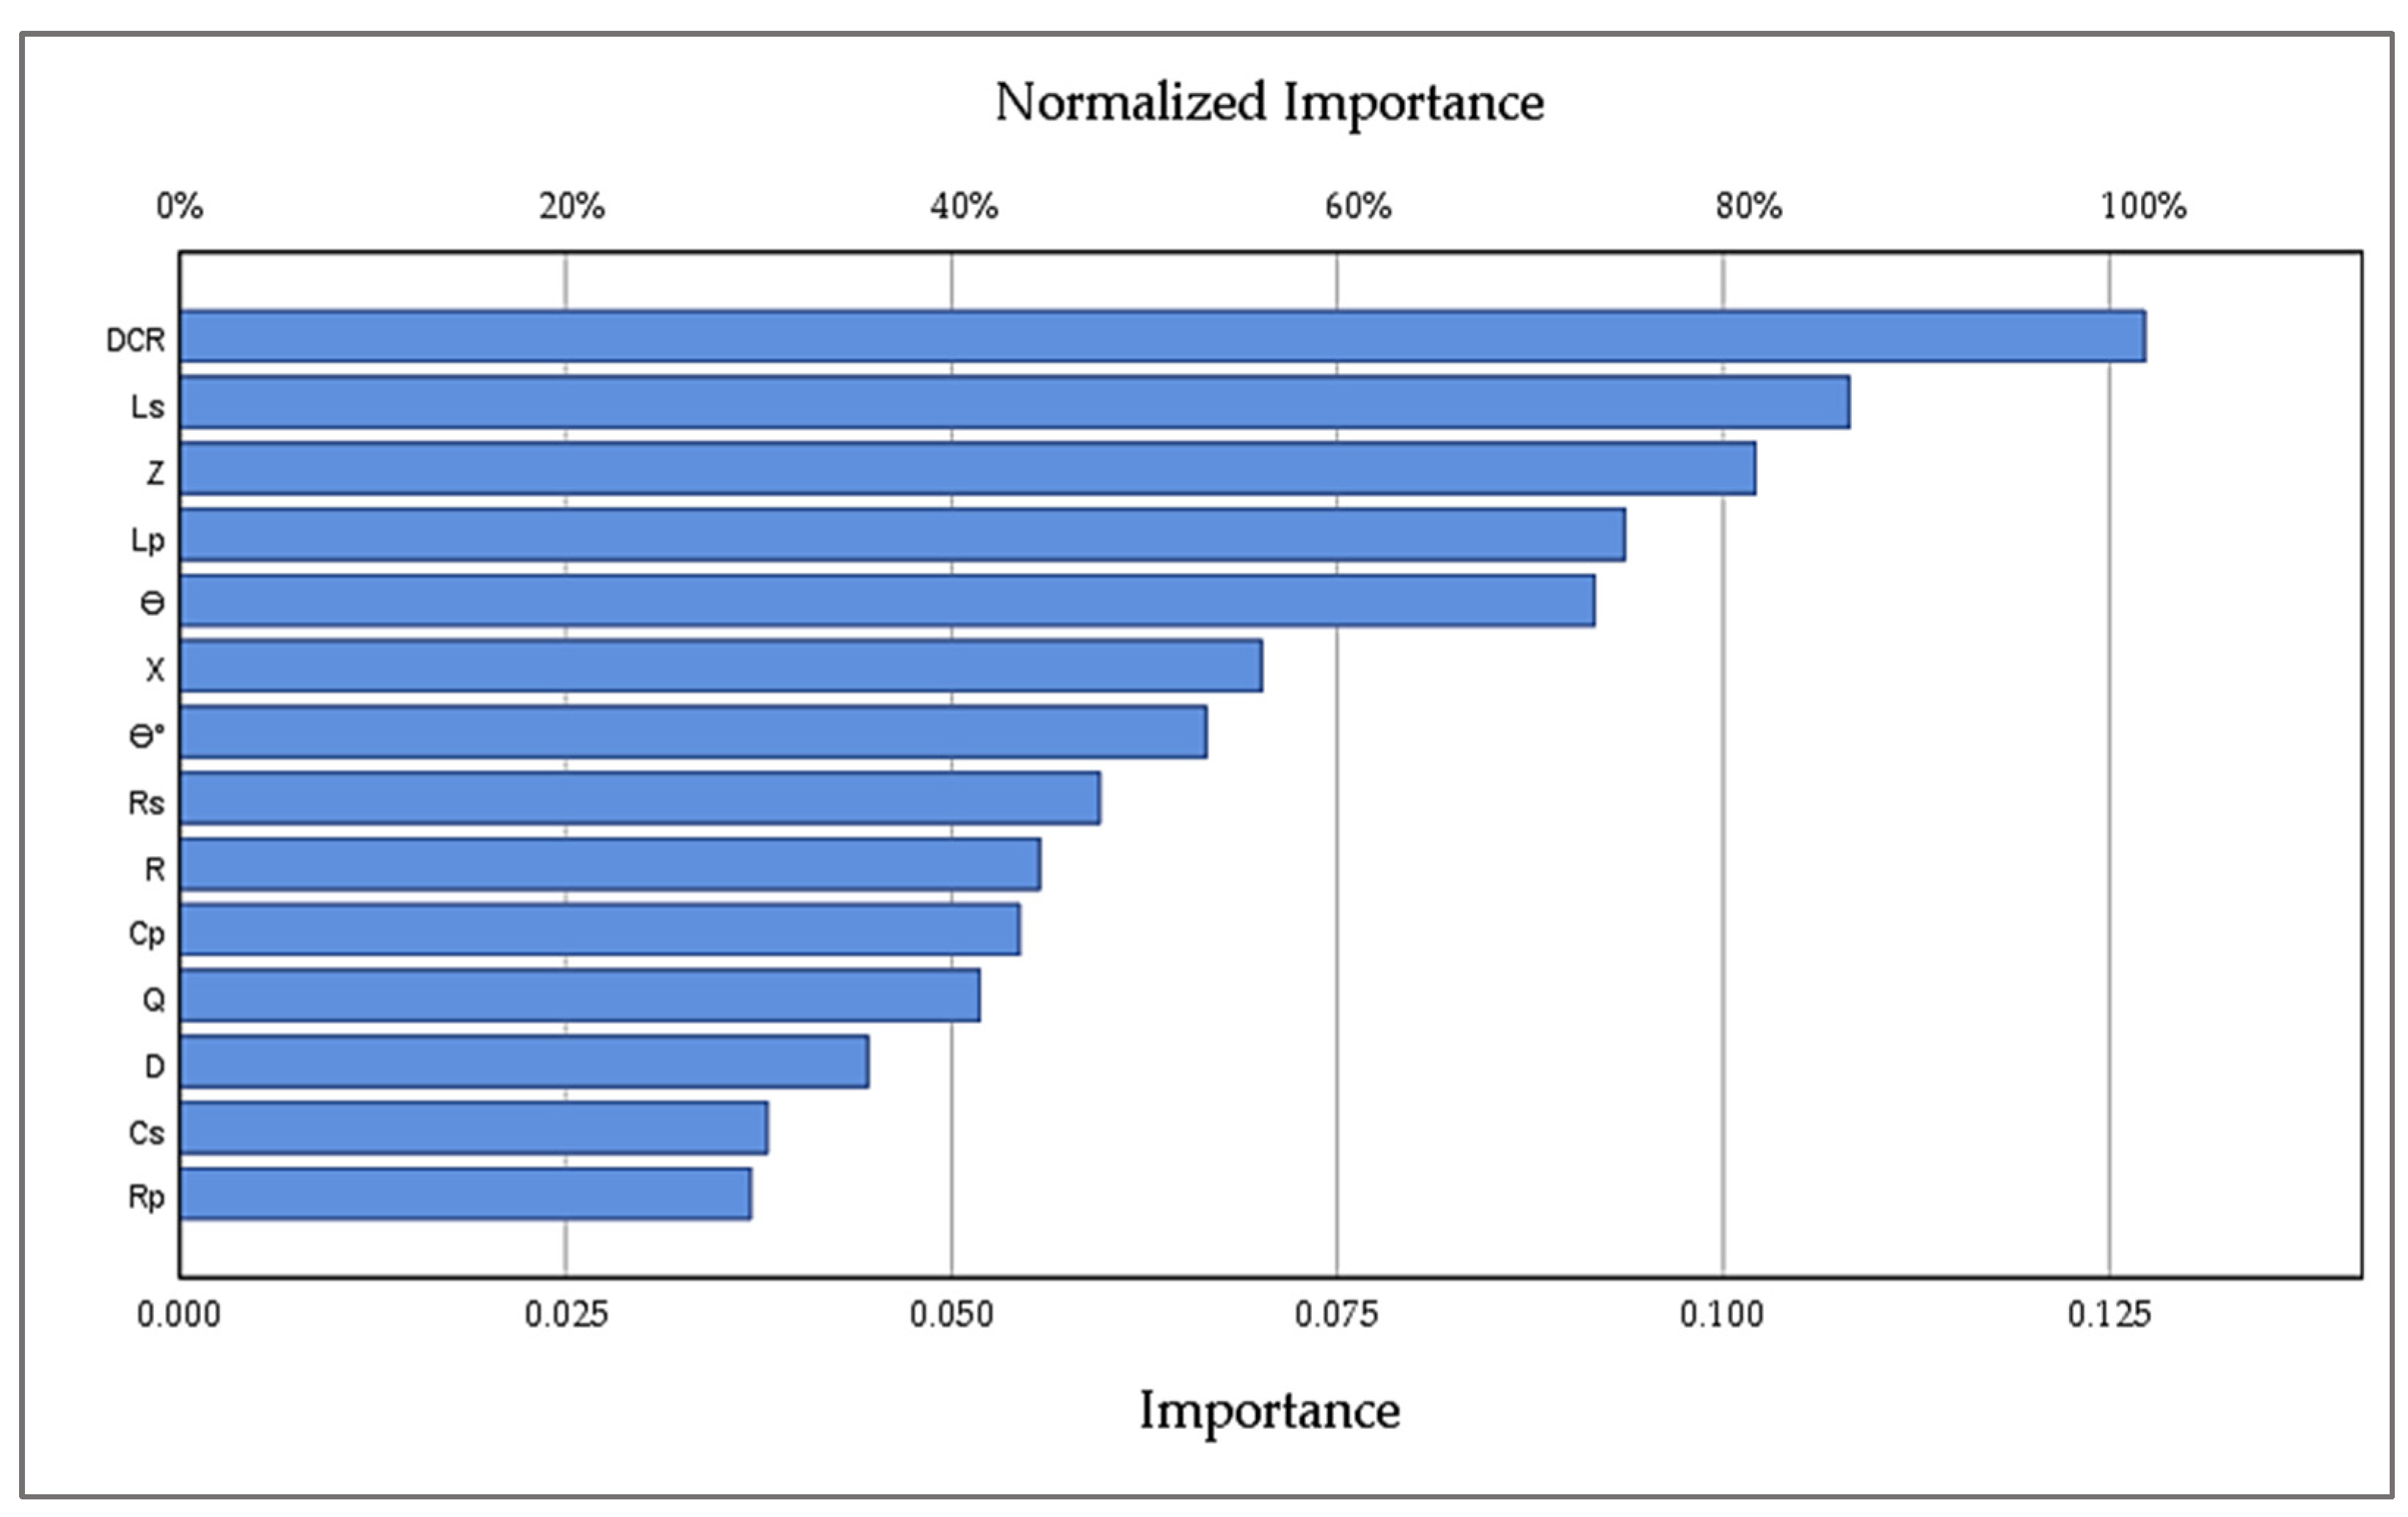
Figure 6 shows the importance of the independent variables (Cs, Rs, D, Cp, Rp, Ls, Lp, R, X, DCR, Z, ϴ, ϴ°, and Q) at 10,000 Hz in the ANNs model in terms of the relative and normalized importance. This figure displays the impact of the change of each independent variable on the ANNs prediction model. The variables related to DCR, Ls, Z, Lp, ϴ, X, and ϴ° have the most critical effect on how the network predicts the values of the dependent variables, i.e., pH, TSS, a
w, and MC at 10,000 Hz.
Table 6 displays the comparison between error results of the ANNs models, i.e., the sum of squares error, average overall relative error, and relative error in the training, testing, and holdout phases at various testing frequencies. In addition, relative errors were displayed depending on the dependent variables of the pH, TSS, a
w, and MC measurement levels. From
Table 1, it is noticed that the values of the electrical parameters at 10,000 Hz gave better results regarding the model errors in the phases of training, testing, and holdout datasets. Based on these results, adopting electrical measurements of dates at 10,000 Hz can successfully predict the pH, total soluble solids (TSS), water activity (a
w), and moisture content of the date fruits during cold storage.
The R
2 and RMSE related to the MLR models for predicting the pH, TSS, a
w, and MC parameters under the testing frequencies are presented in
Table 7. The F-test showed that several independent variables in the MLR for pH property are significant (
p ≤ 0.05) at 10,000 Hz.
The MLR prediction models for pH values based on the electrical parameters at 100 Hz (R2 = 0.813, RMSE = 0.289), 1000 Hz (R2 = 0.842, RMSE = 0.176), 10,000 Hz (R2 = 0.843, RMSE = 0.175) are characterized by a significative determination coefficient, which can be used as a significative predictive model at one of these frequencies. The other MLR models were characterized by low R2 and high RMSE values. Therefore, the MLR models are considered unsuitable for accurately evaluating the TSS, aw, and MC.
The prediction models using the MLR technique based on the electrical properties measured by a 10,000 Hz frequency are the best for all target properties of pH, TSS, aw, and MC.
The developed MLR prediction models for pH, TSS, a
w, and MC at 10,000 Hz that acquired the best results are given below:
The performance of the ANNs and MLR prediction models at various frequencies based on R
2 and RMSE values in the evaluation set is shown in
Table 7. The high R
2 and low values of RMSE indicated that the ANNs models present promising possibilities to predict the target physicochemical properties of date fruits based on their electrical properties. Based on R
2 and RMSE in
Table 7, it is shown that the ANNs modeling techniques were more efficient compared with the MLR models for predicting the pH, TSS, a
w, and MC values at all testing frequencies. The results showed that the R
2 for ANNs models at frequencies of 1000, 10,000, and 10,0000 Hz was more acceptable than the ANNs models at 10 and 100 Hz. The high values of R
2 were obtained for pH (R
2 = 0.938), TSS (R
2 = 0.954), a
w (R
2 = 0.876), and MC (R
2 = 0.855) in the evaluation set of ANNs models based on the measured electrical properties of the stored date fruits at 10,000 Hz. Furthermore, the low values of RMSE were obtained also at 10,000 Hz for the pH (RMSE = 0.121), TSS (RMSE = 2.946), a
w (RMSE = 0.020), and MC (RMSE = 0.803) in the evaluation set of ANNs models.
Generally, based on these results, the MLR models had lower performance and weaker predictive ability than ANNs for predicting pH, TSS, a
w, and MC at various frequencies (
Table 7). Based on these results, the MLR models are unsuitable for predicting the target properties and show a relative disadvantage because they only describe the linear relationship between variables.
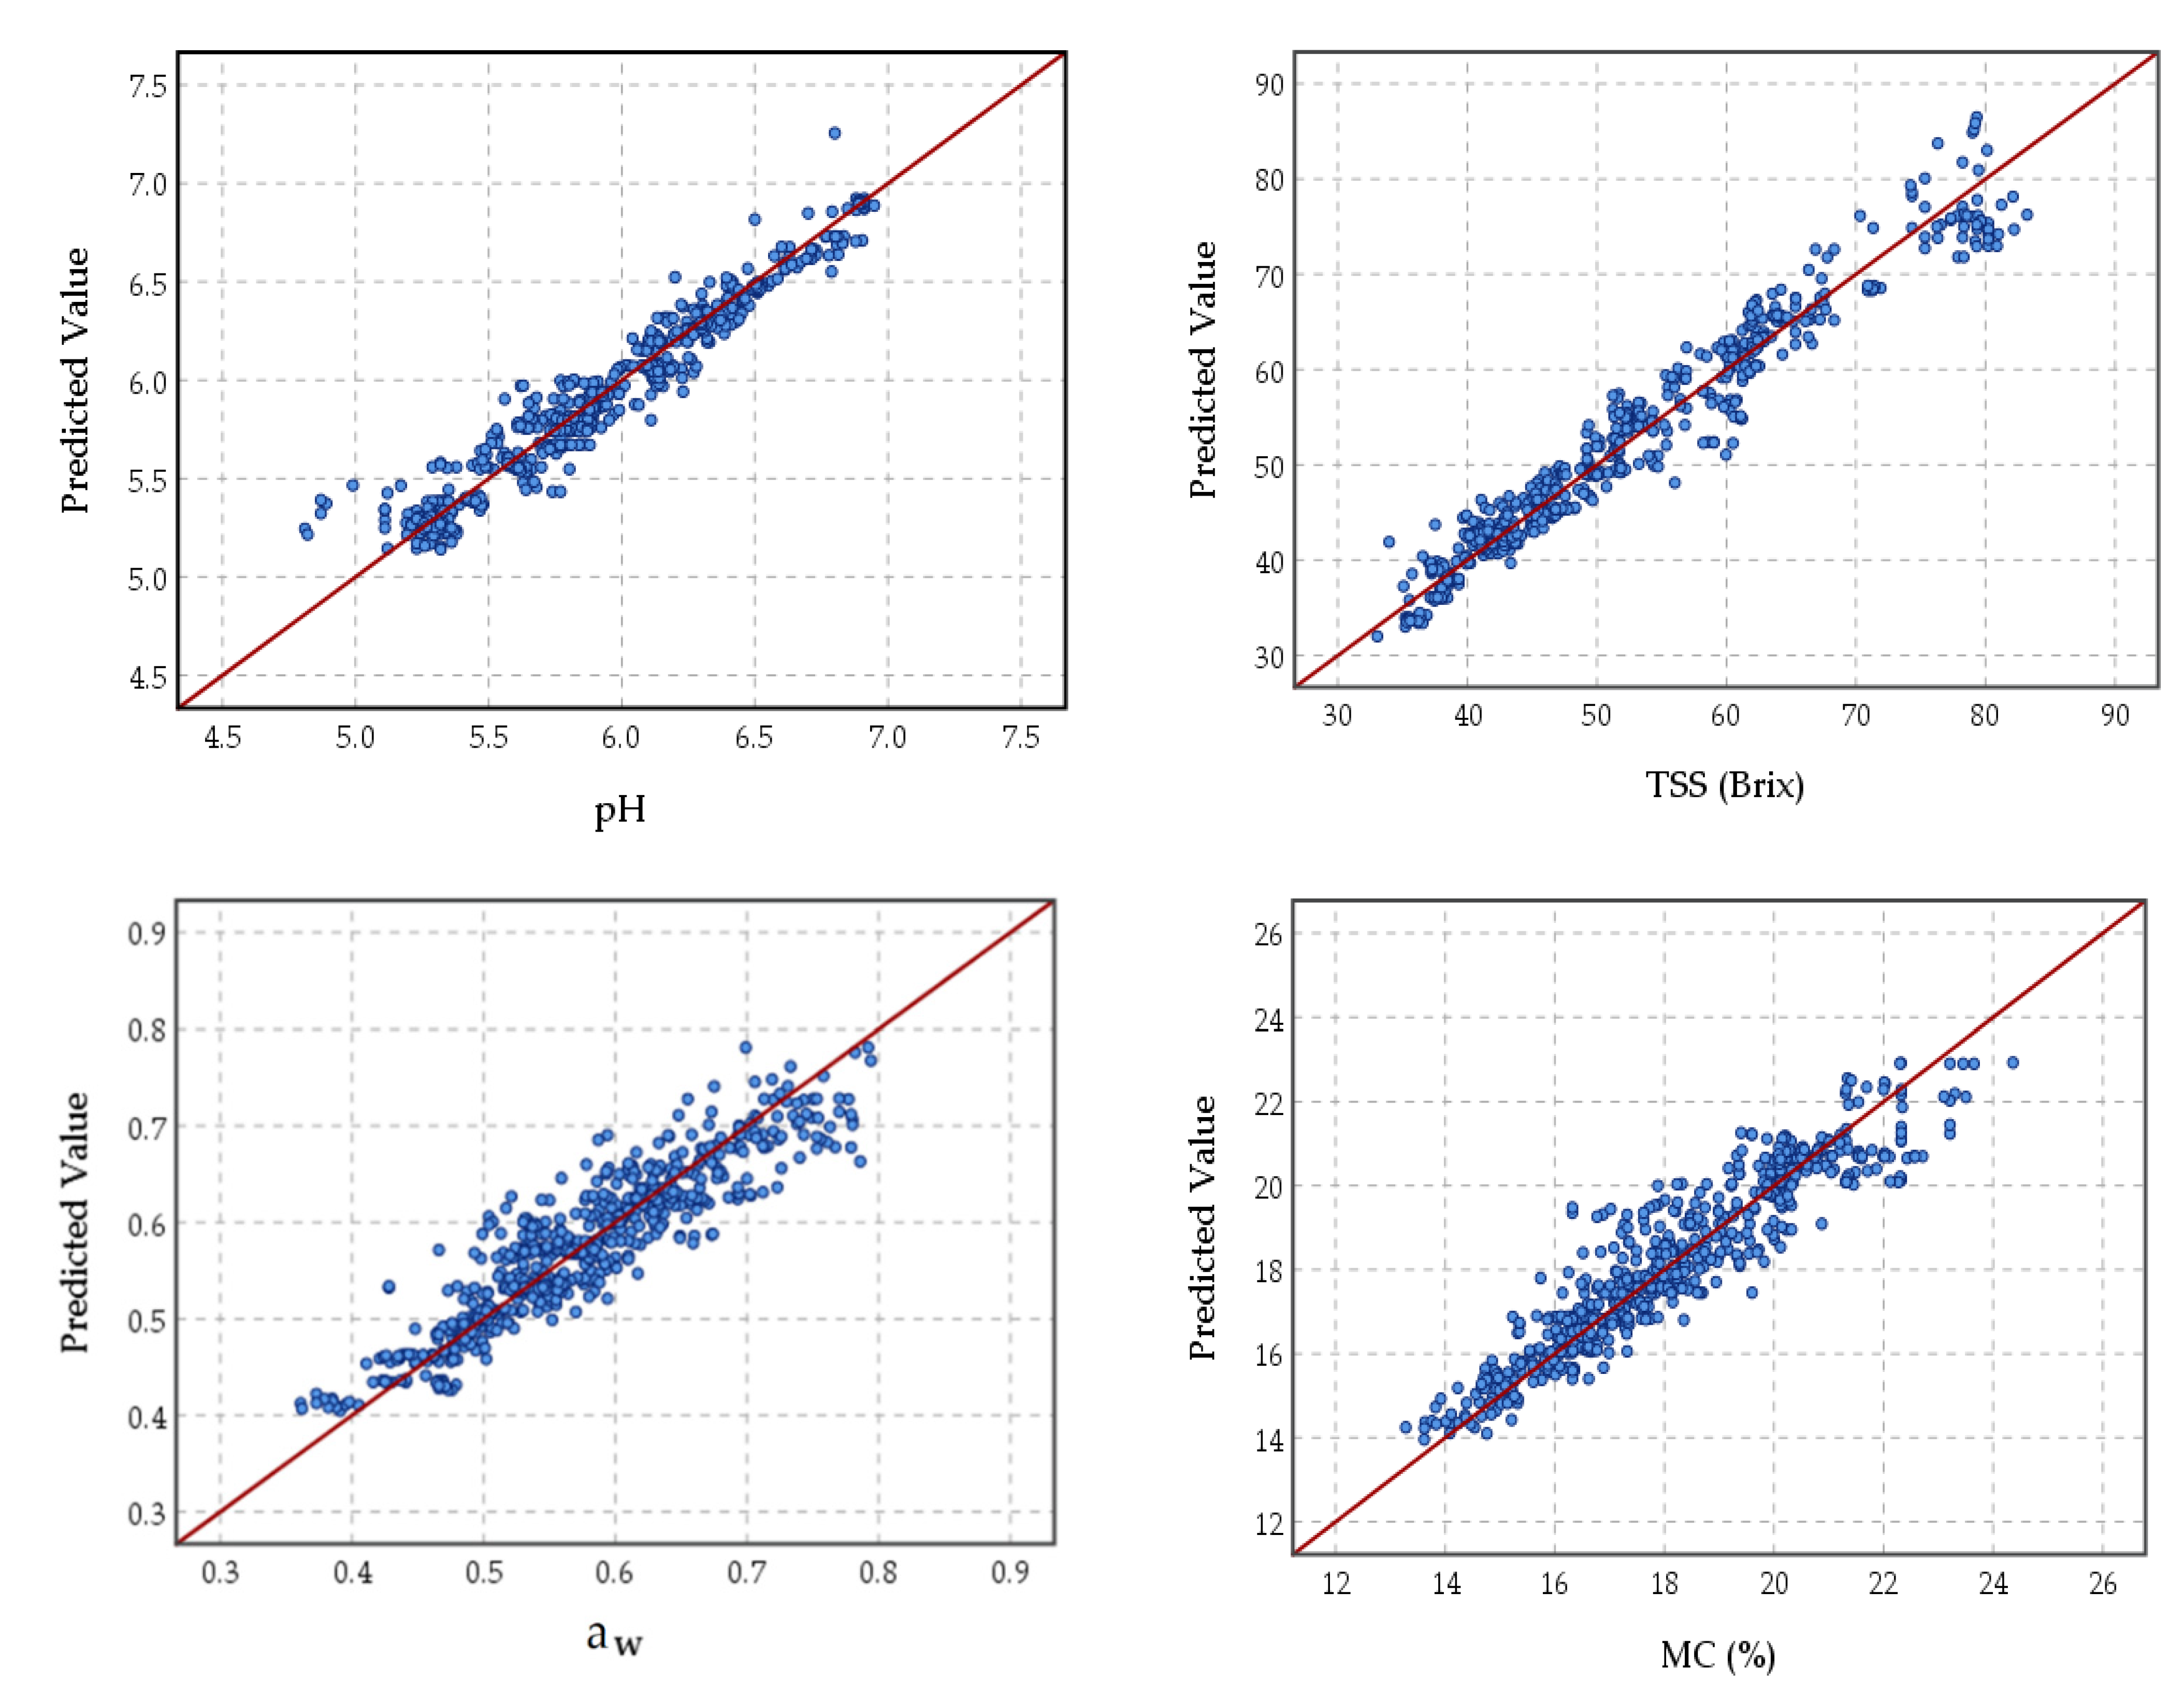
Figure 7 presents the scatter plots of the measured values of pH, TSS, a
w, and MC of the stored date fruits versus the predicted values by the neural networks model in the evaluation phase based on the measured electrical properties of the stored date fruits at 10,000 Hz. The network structure of the model was one hidden layer and 14 neurons, which exhibited the highest level of accuracy. The prediction error in the training and testing phases at 10,000 Hz was lower than in the same phases at other frequencies. The results displayed that the ANNs model at 10,000 Hz was more accurate than the various frequencies in the evaluation phase. The regression line between the predicted and the observed values of the target properties, i.e., pH (y = 0.38 + 0.94 x), TSS (y = 1.87 + 0.96 x), a
w (y = 0.09 + 0.84 x), and MC (y = 2.36 + 0.87) at validation sets, nearly overlapped the 1:1 line (y = x + 0).
So far, to our knowledge, there is no study that has employed the feed-forward ANNs with a backpropagation training algorithm for the prediction of the physicochemical properties of date fruits based on their electrical properties. Nayak et al. [
48] mentioned that the dates are the type of fruit that have been used very rarely to process with ANNs. However, Fadel suggested a novel method for classifying dates using Probabilistic Neural Networks (PNN) based on the color of five cultivars of date fruits. The authors observed good classification accuracy in the experimental process [
94]. Hsu et al. [
95] mentioned that the ANNs learned to find the solutions for the problem by developing a memory capable of associating many input patterns with a resulting set of effects or outputs. The problem with these ANNs models is the dependency on data for their training. The training phase of the models is the process of updating the internal representation of the model in response to external variables to achieve a specific task. In addition, it modifies the network architecture, which involves modifying the weights of the links, changing connection links by removing or creating new links, and changing the individual neurons firing rules [
96]. Sablani and Rahman proposed [
49] an ANNs model to predict the thermal conductivity of food, i.e., apple, corn starch, pear, raisin, potato, starch, ovalbumin, sucrose, carrot, and rice, as a function of moisture content, apparent porosity, and temperature. The optimal proposed ANNs model consisted of two hidden layers with four neurons in each layer. This model predicted the thermal conductivity with low mean absolute and relative errors. Singh [
97] has proposed a methodology for the sweet potatoes during drying using an ANNs model to get online predictions of moisture kinetics in the potatoes. The results achieved in their work showed that the predicting ANNs model with two hidden neurons and a feed-forward network could help envisage and model the moisture relocate in the product.
Our results indicated that the MLR models were less accurate than the ANNs models for the prediction of fruit pH and had low performance and weak predictive ability for the TSS, a
w, and MC at all testing frequencies. If the constants or parameters of a mathematical equation that relates the input variables to the output variable are defined for a given mathematical equation that relates the input variables to the output variable, the difference between the predicted output and the observed output of the equation for the set of input data is a minimum for statistical regression, such as the MLR. As a result, ANNs can be used to study ambiguous and unclear datasets and their interactions, but statistical regression analysis, i.e., MLR, will fail in such cases. Furthermore, ANNs can be used to analyze more data at the same time with more complicated and complex interactions. Even if the data is incomplete and noisy, ANNs can outperform MLR in prediction, modeling, and optimization [
52]. Therefore, MLR models were unsuitable for our research, whereas the ANNs prediction model accurately predicted the quality attributes we were looking for. The results of ANNs are simple and do not require any modifications. ANNs are several types of intelligent modeling techniques that can solve a problem by analyzing scarce, unstructured, and incomplete numerical data about non-stationary and nonlinear systems [
98]. The ANNs developed a solution by training on their measurements using the nonlinear correlation between various variables.
This study indicated that the ANNs model was found to be a powerful tool for efficiently predicting the pH, TSS, water activity, and moisture content of date fruits based on their electrical properties.


