3.1. S. cerevisiae Characterization and Differentiation
The strawberry tree fruit fermentations were carried out by two producers (P1 and P2) using fruit harvested in October and December.
When collecting the fermented mass for microbiological analysis, the temperature and Brix degrees were measured for each deposit, as shown in
Table 4.
The fermented mass of fruit collected in October from Producer 2 appeared to be slightly advanced as compared to that of Producer 1, considering the Brix values at T1 and T2. On the other hand, the decrease in the Brix value during the fermentation process of fruit harvested in December was greater in relation to that of the fruit harvested in October for the analyzed period (T1–T2).
Plate-count analyses (total count, yeast, and acetic acid bacteria) were performed in duplicate. The colonies formed were counted, and average values are recorded in
Table 5, where the elapsed times since the collection of the fruit in the deposits are also recorded. Both the total count and the yeast count presented similar results, at the level of 10
7 colony-forming units (cfu) per milliliter during the fermentation period analyzed (5–140 days), similar to what has been observed by other authors [
8,
24]. When the values at the beginning of the fermentation are compared with those from the middle of the fermentation (samples F and J, and H and L), a slight increase in the total and yeast counts can be noticed. In samples taken while the fermentation was already taking place (samples E and I, and G and K), the opposite can be observed, with a small decrease in the number of colony-forming units. In relation to the acetic bacteria, only samples F and H presented colonies at a level of 10
6 and 10
4 per milliliter, respectively, which correspond to the beginning of fermentation. Nevertheless, they were not detected in the following sampling period (T2), which indicates that, presumably, these bacteria tend to disappear during fermentation.
In order to characterize the yeast isolates, 20 yeast colonies grown in yeast growth media (10 yeast colonies per replicate sample) were randomly selected. Each isolate was further purified in YPD media. After cell lysis, PCR with specific primers for
S. cerevisiae was performed, followed by gel electrophoresis. The results obtained allowed the presumptive differentiation of the
S. cerevisiae isolates from the non-
Saccharomyces cerevisiae isolates, depending on the detection of the amplicon as a positive result for
S. cerevisiae (
Table 6).
From a total of 160 isolates, 94 were characterized as
S. cerevisiae species. In the case of isolates from samples F and H, no
S. cerevisiae were detected, most probably because the isolates were obtained from samples collected only 2 and 5 days after harvest. Thus, the initial phase of fermentation seems to be characterized by a predominance of non-
Saccharomyces yeasts, similar to what occurs in wine fermentation [
25,
26], corroborating the low numbers of
S. cerevisiae species found on the surfaces of
Arbutus unedo fruit [
8].
The yeast isolates that tested positive for S. cerevisiae species were further differentiated using microsatellite primers (SSR). The microsatellite profiles of C3, C5, C8, C11, and SCAAT3, C4, C6, YKL172, ScAAT1, ScAAT5, and YPL009c SSRs were determined using two multiplex reactions followed by capillary electrophoresis in an automatic Beckman Coulter DNA Sequencer.
The dendrogram established using the poppr (v2.8.3) package of the R statistical software is represented in
Figure 1.
If we consider the distance between the commercial, active dry yeast isolates, each of the three corresponding to one strain, around 56 different S. cerevisiae strains were detected among the 94 isolates from the Arbutus unedo fermentation samples (the blue line across the dendrogram.
Another line was drawn along the dendrogram (red line), and eight major clusters were obtained. Cluster 1 groups 6 isolates from P1 detected in fermentation samples from fruit collected in December (4 strains). Cluster 2 also groups 20 isolates from P1, but from fermented samples of fruit harvested in October (codes E and I). Three strains could be differentiated at each sampling. In this cluster, there is the exception of isolates J2 and J4, as they are from the deposit of fruit collected in December. The ADY CE groups separately. Cluster 3 comprises isolates from P2, detected in T2 samples, the isolate from fermented October fruit (K7) being similar to a strain (L7) from December’s fermented fruit. Cluster 4, comprising 21 isolates (from E3 to I14), corresponds to a high number of strains (19), grouping both producers, fruit harvests, and sampling times. Cluster 5 groups 18 isolates from both P1 and P2, most probably corresponding to only 7 strains. A total of 2 sub-clusters can be observed, one of them with isolates only from P2, that correspond to 2 strains from October’s fruit harvest (G and K). Cluster 6 groups 3 strains from P2 at T2, from both the October and December fruit harvests. Cluster 7 groups isolates from P2, the majority coming from December’s fermented fruit, sampled at T2 (7 isolates corresponding to 6 strains), 6 isolates from October’s fermented fruit, sampled at T2 (3 strains), and 1 strain from the T1 sampling time (G9). There is 1 isolate from P1 which also grouped in this cluster (J15). Cluster 8 is the most distinct cluster, with 10 isolates coming only from P2 and corresponding to 4 strains, 1 of them being common to both harvests and both sampling times (isolates G10, G5, G11, L15, K15, K1, and K18).
In general, and despite the great diversity encountered in the 94 isolates differentiated by SSR markers, there is a good separation between isolates from P1 and P2. Isolates from P1 group in Clusters 1 and 2. Clusters 3, 6, and 8 group isolates from P2. Cluster 7 also groups isolates from P2 with only 1 isolate from P1. Only 2 groups encompass isolates from both producers.
The separation of the harvesting times was not that clear. Only Cluster 1 grouped isolates from the December harvest period for P1. Nevertheless, the other isolates from this sampling (J) are scattered all over the dendrogram, grouping in Clusters 2, 4, and 7. Cluster 2 encompasses mostly isolates from the October harvest in P1. In P2, all clusters contain isolates from both harvest times.
3.2. Distillates Characterization and Differentiation
The results of the distillates analytical determinations were submitted to principal component analysis (PCA). The plot of the samples on the plane of the first two components, which explain 78.53 and 19.51% of the variance, is shown in
Figure 2.
The first component allowed the greatest separation of the distillates from the two producers, with samples from Producer 1 located on the right side of component 1 and samples of the P2 on the opposite side of this component. The projection of the variables in the same plane showed that the variables with the greatest contribution to this separation are acidity, pH, density, TAV, methanol, 2-butanol, 1-propanol and 1-butanol. The samples from P2 are more related to higher levels of TAV, methanol, 2-butanol, 1-propanol, 1-butanol, and pH and with lower levels of density and acidity.
There seems to be a slight separation of the distillation samples along component 2 which seems to be related to the harvest time. Actually, the samples produced with the fruit harvested in October are located on the positive side of this component, which seems to be related to higher amounts of acetaldehyde and ethyl acetate, while the samples produced with fruit harvested in December are located on the negative side of this component more related to higher amounts of isobutanol.
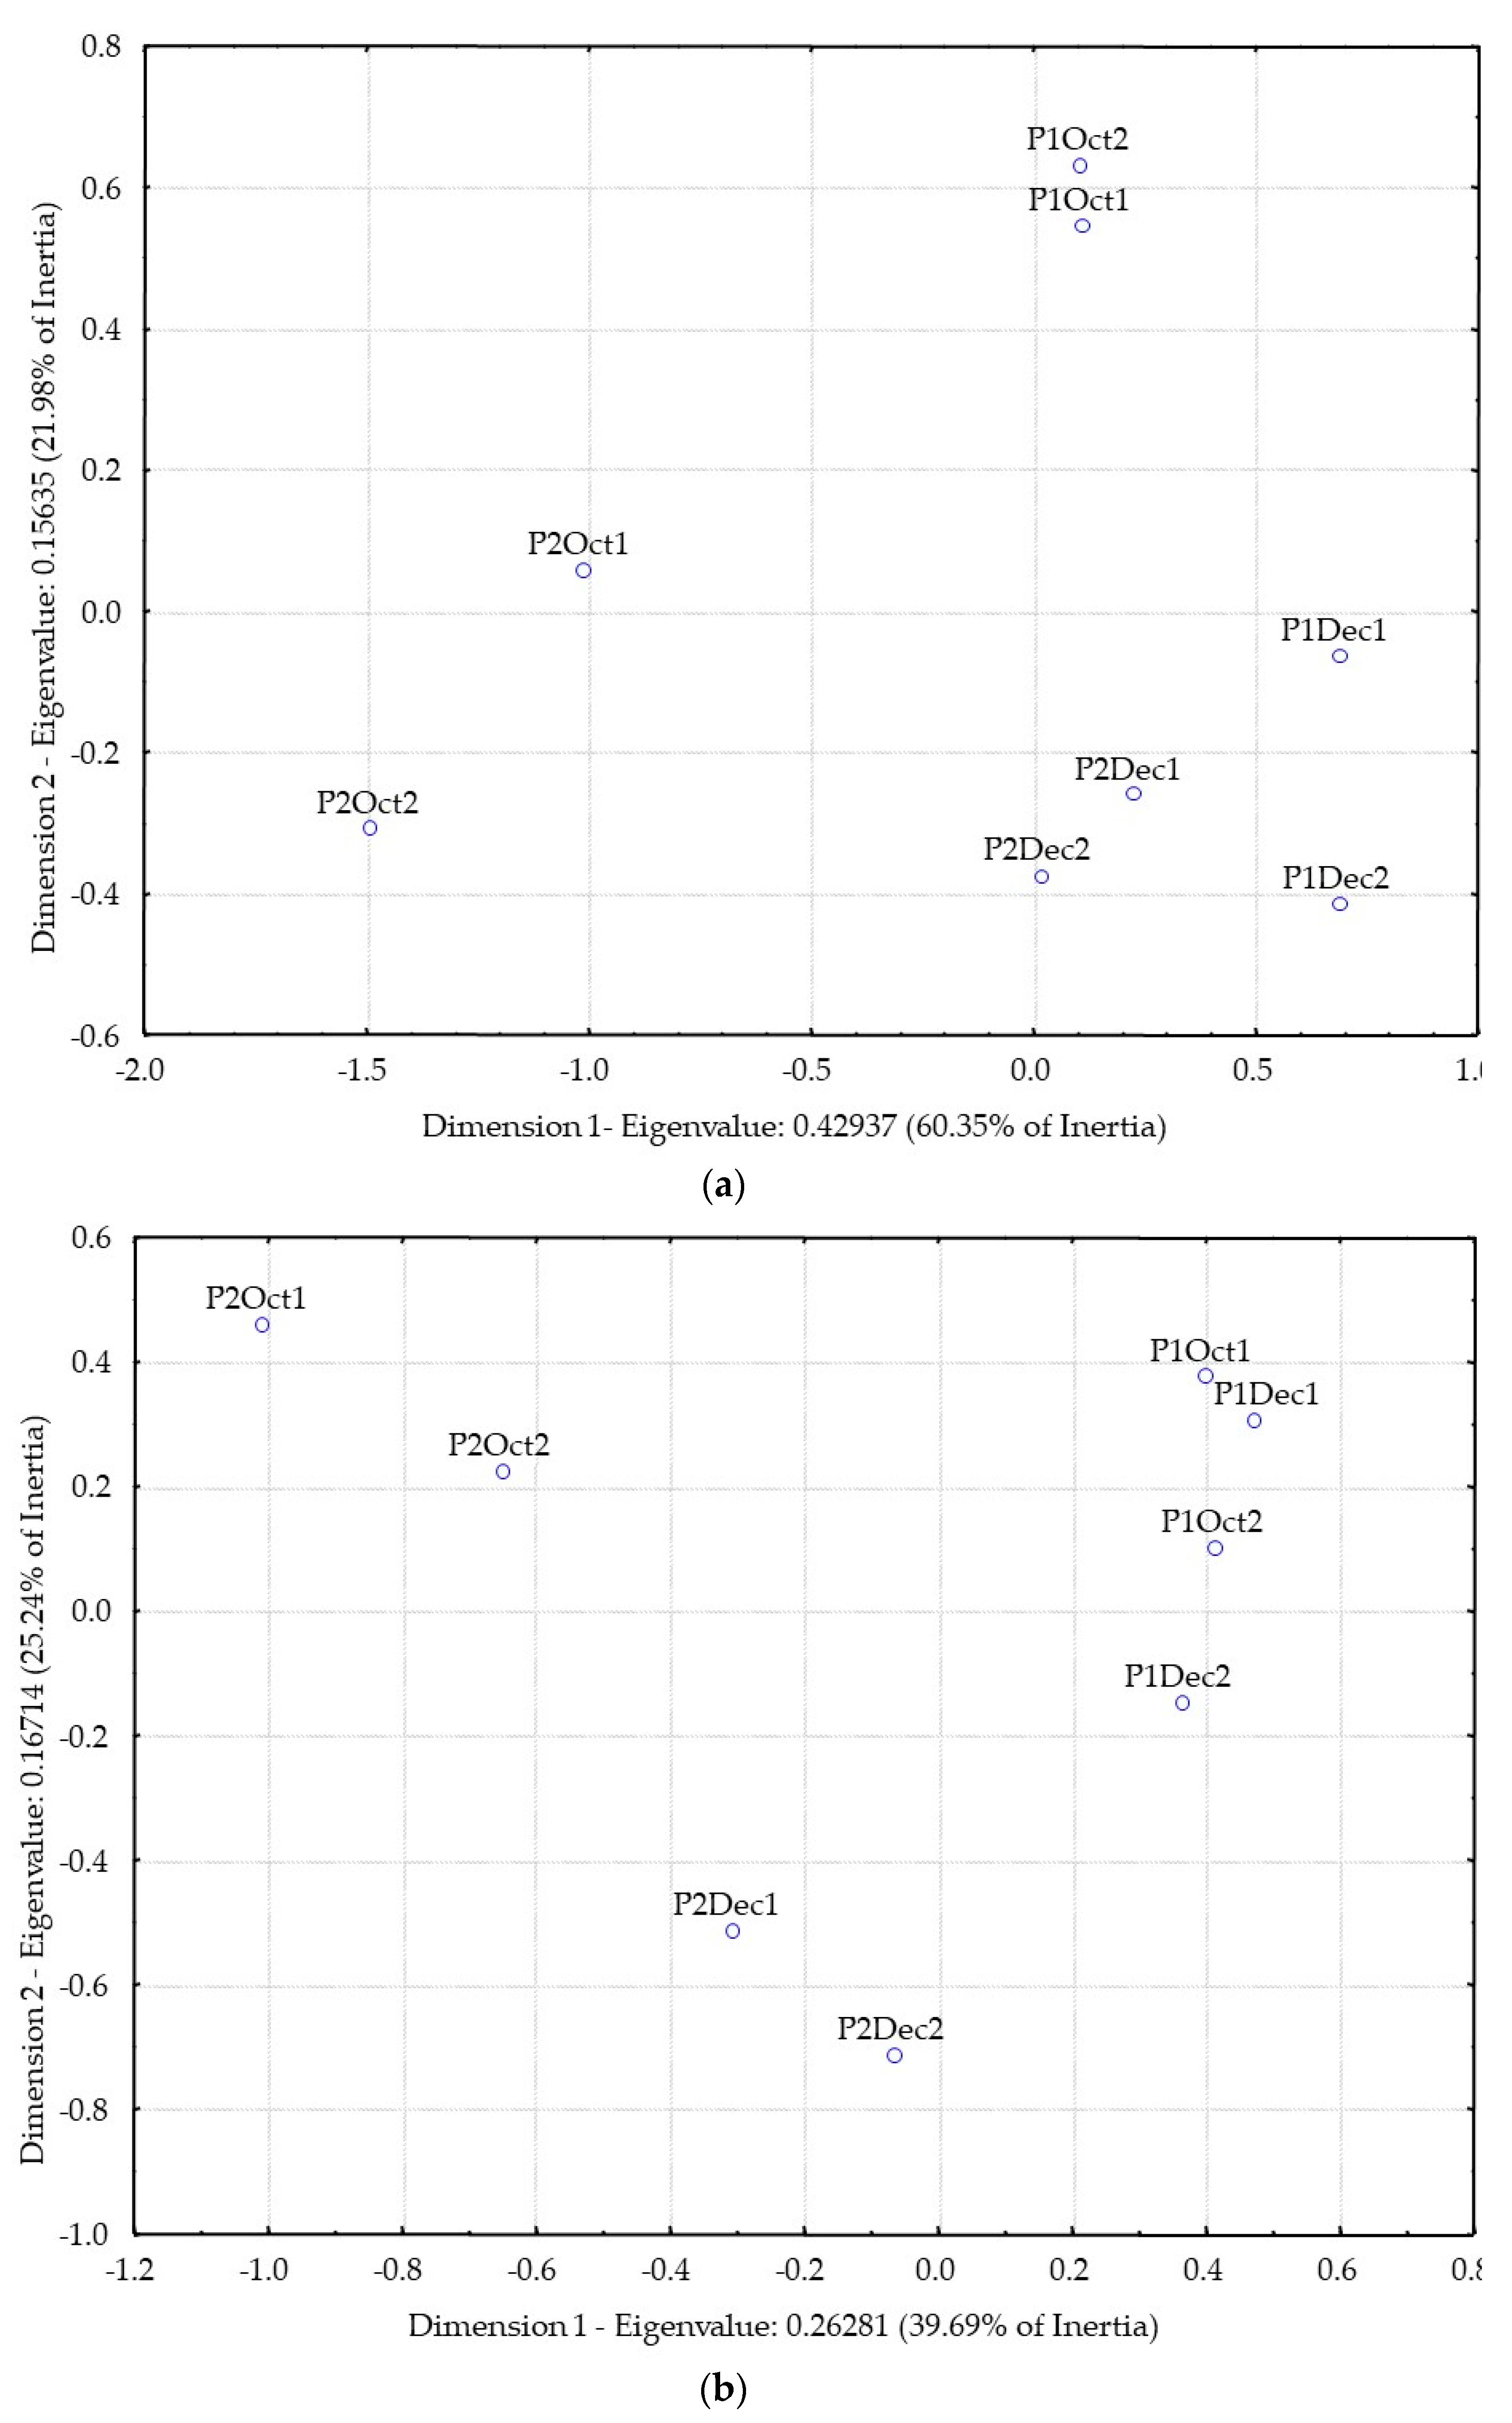
Figure 3a shows the results of the correspondence analysis of the distillates odor similarity matrix.
Figure 3b shows of the correspondence analysis of the distillates flavor similarity matrix.
From the analysis of
Figure 3a, based on the odor similarities of the distillates, it is not clear the separation between producers (P1 and P2). However, there is a relatively high similarity of odor among distillates from December fruit harvest for both producers (P1 and P2).
Considering flavor analysis (
Figure 3b), P1 distillates are closer together, but well separated from P2 distillates. Moreover, P2 distillates are separated from each other according to the different harvest time (October and December).
Therefore, the analysis of the physical-chemical and sensorial results highlighted a clear separation between the distillates of the two producers, in agreement with the microbiological results. Further research is needed to study the relationship between territory and products, as is being studied with other alcoholic beverages [
27].


 ,
, 


