
Interactive Effects of Copper and Functional Substances in Wine on Alcoholic Hepatic Injury in Mice

 , , ,
, , ,
Abstract
: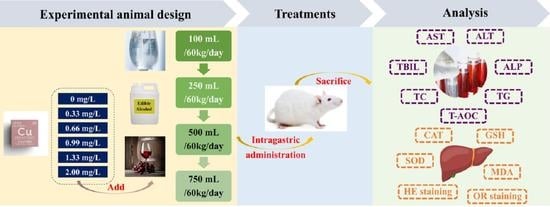
1. Introduction
2. Materials and Methods
2.1. Laboratory Animals and Reagents
2.2. Intragastric Fluid
2.3. Experimental Grouping
2.4. Determination of Serum and Liver Indicators
2.5. Analysis of Residual Copper in Mouse Liver
2.6. Statistical Analysis
3. Results
3.1. Chemical Composition of Intragastric Fluids
3.2. Serum Indicators of Mice
3.2.1. AST and ALT
3.2.2. TC and TG
3.2.3. TBIL and ALP
3.2.4. T-AOC
3.3. Mouse Liver Indicators
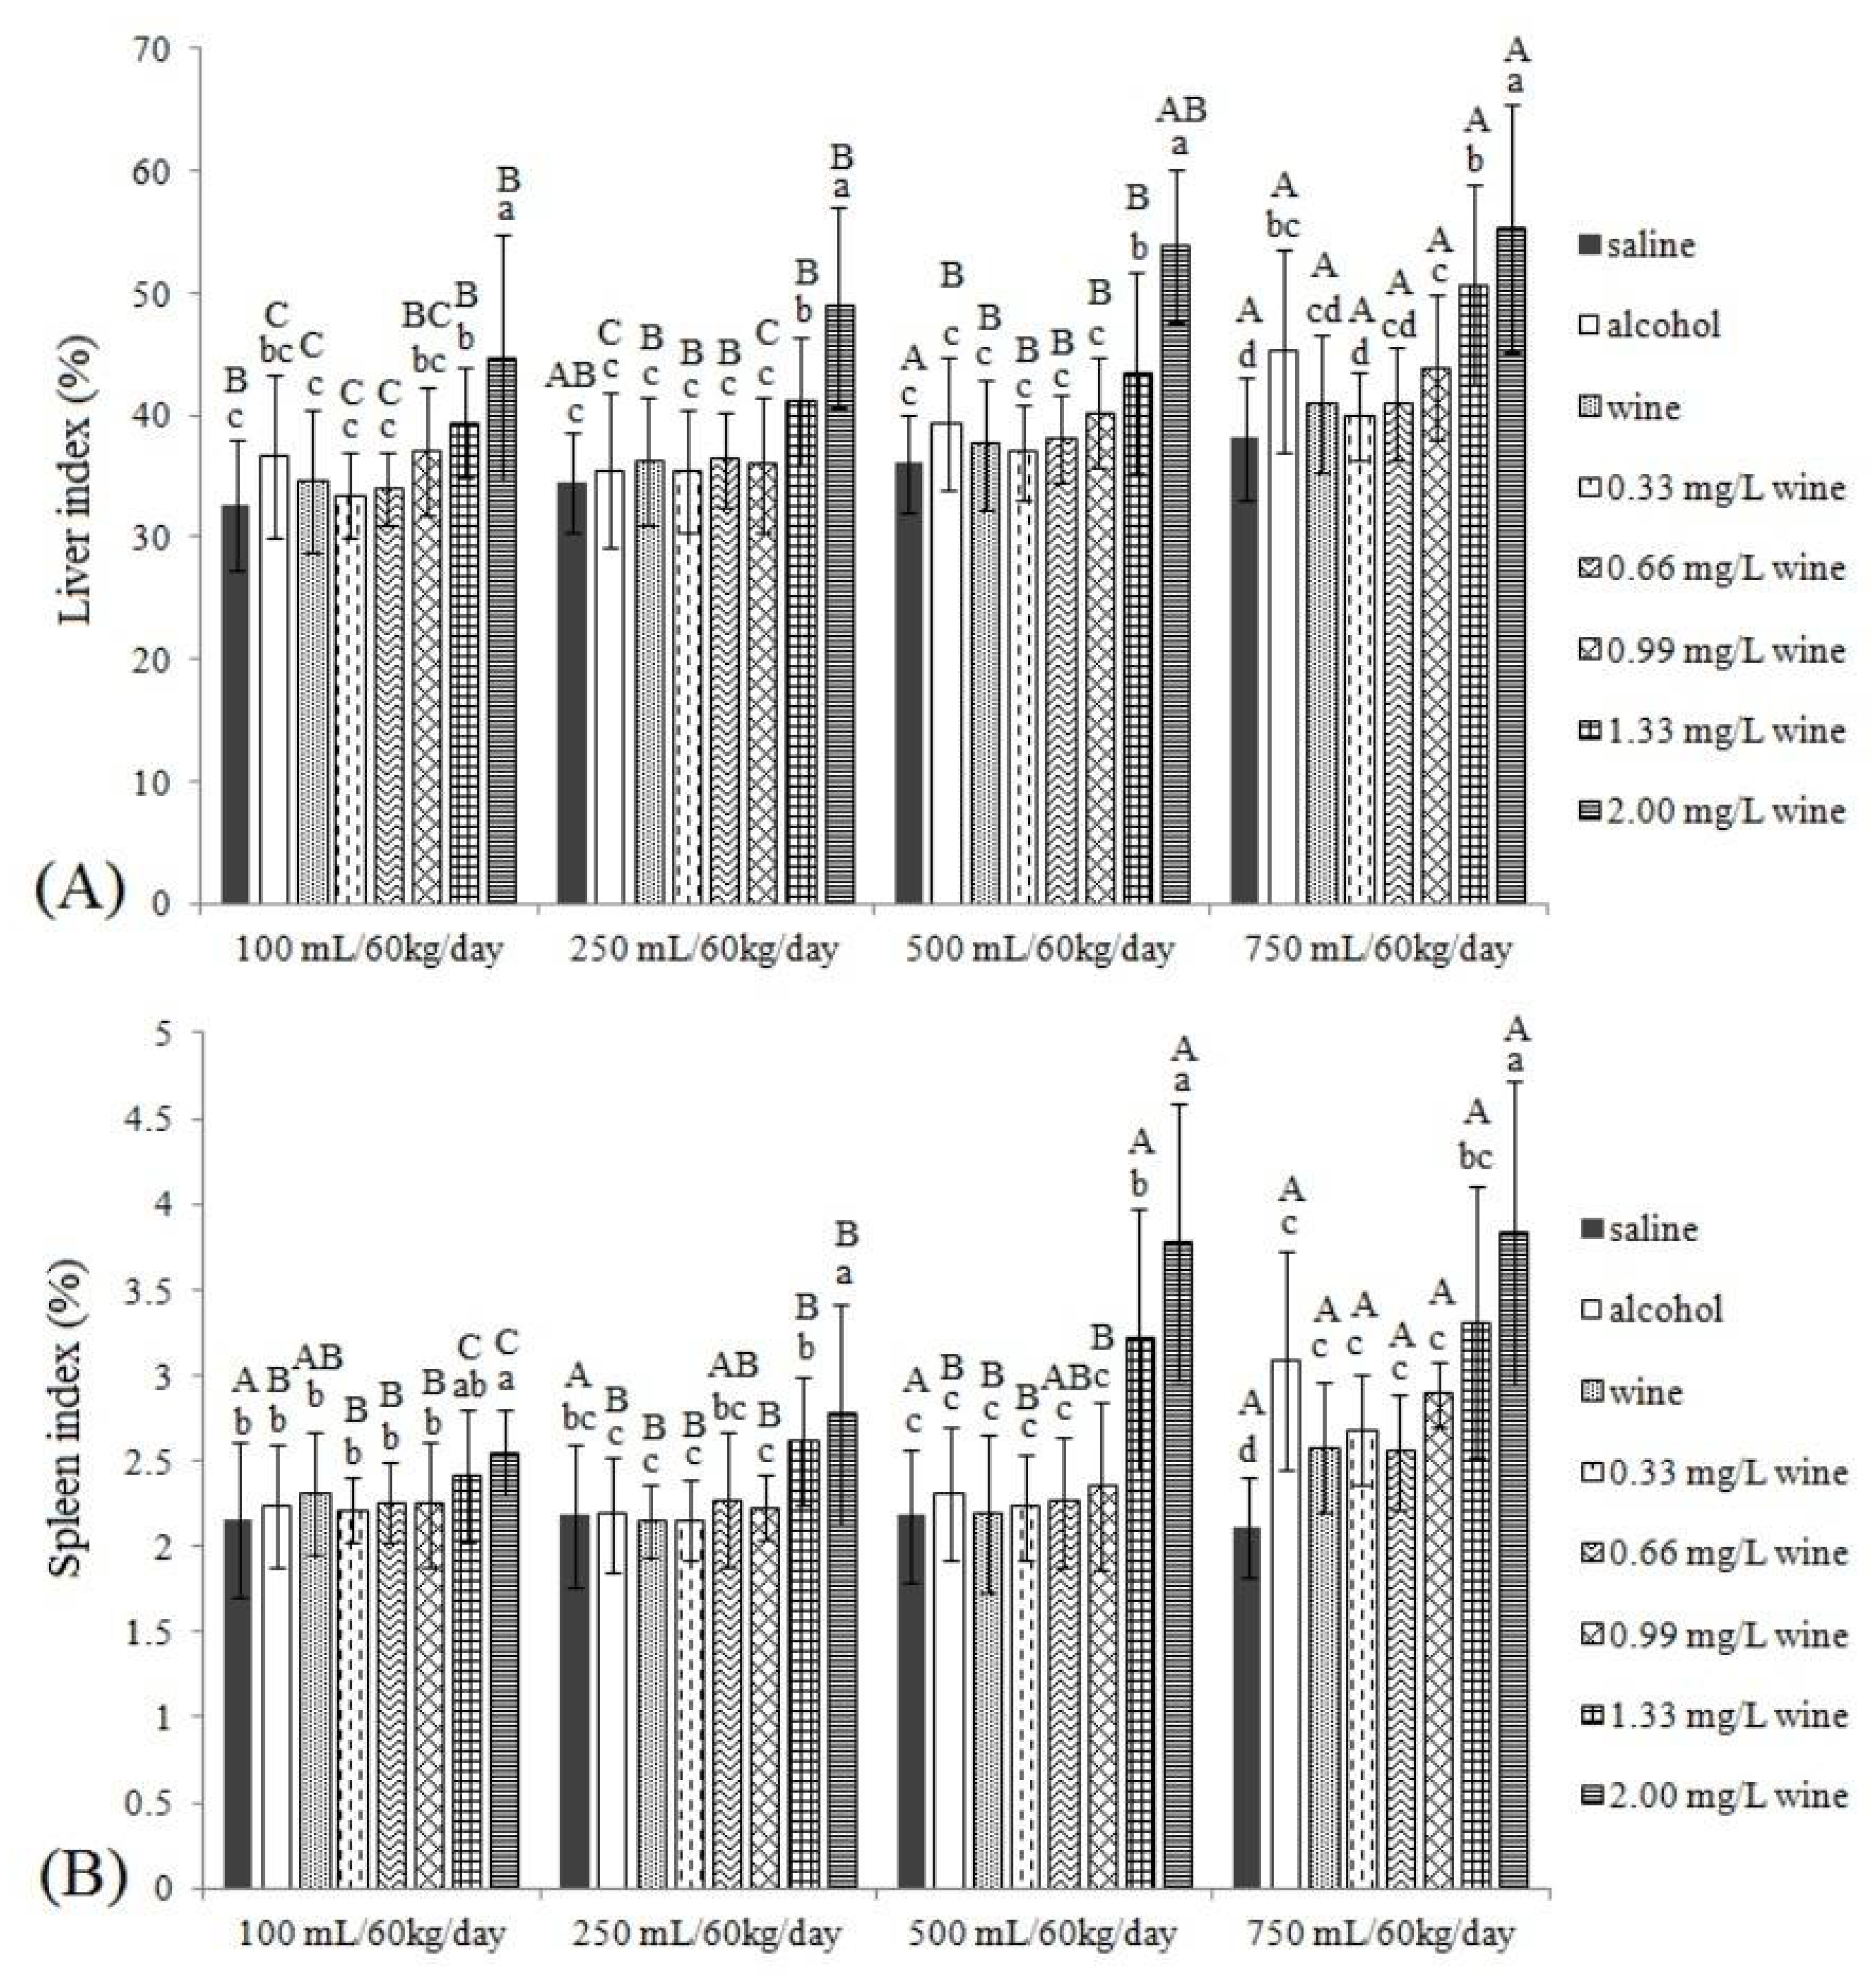
3.3.1. Liver Index and Spleen Index
3.3.2. CAT, GSH, SOD and MDA
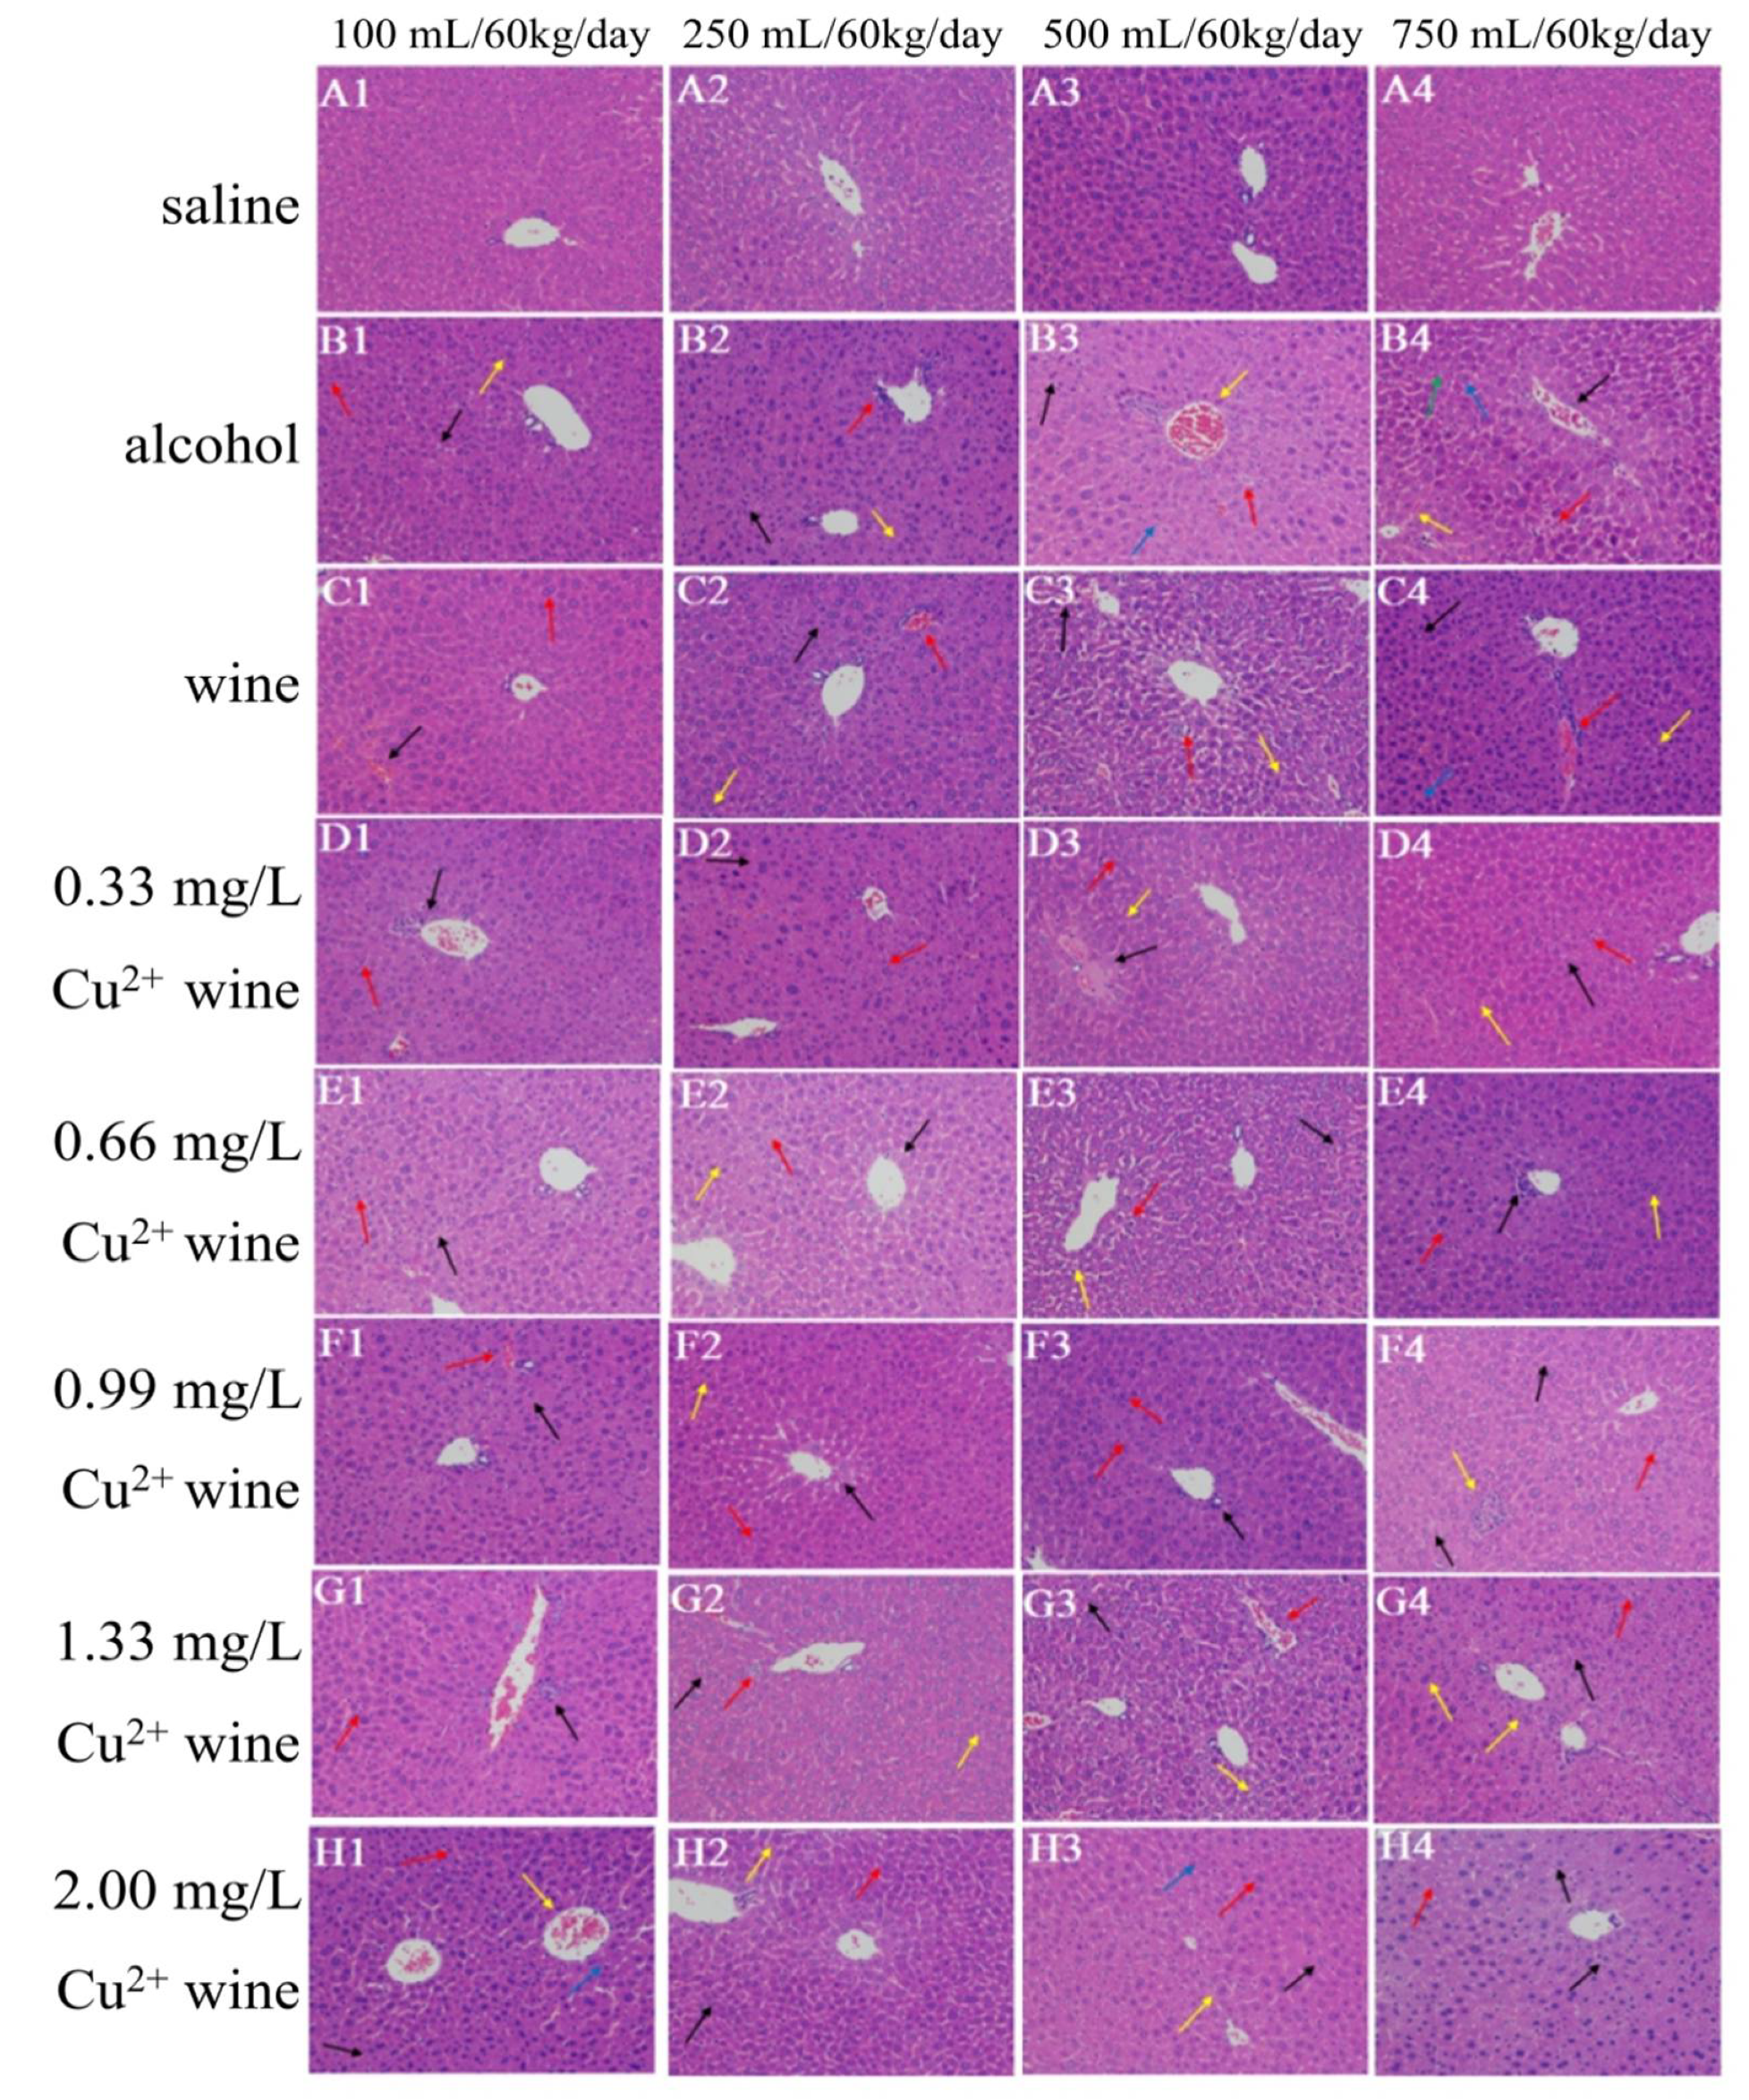
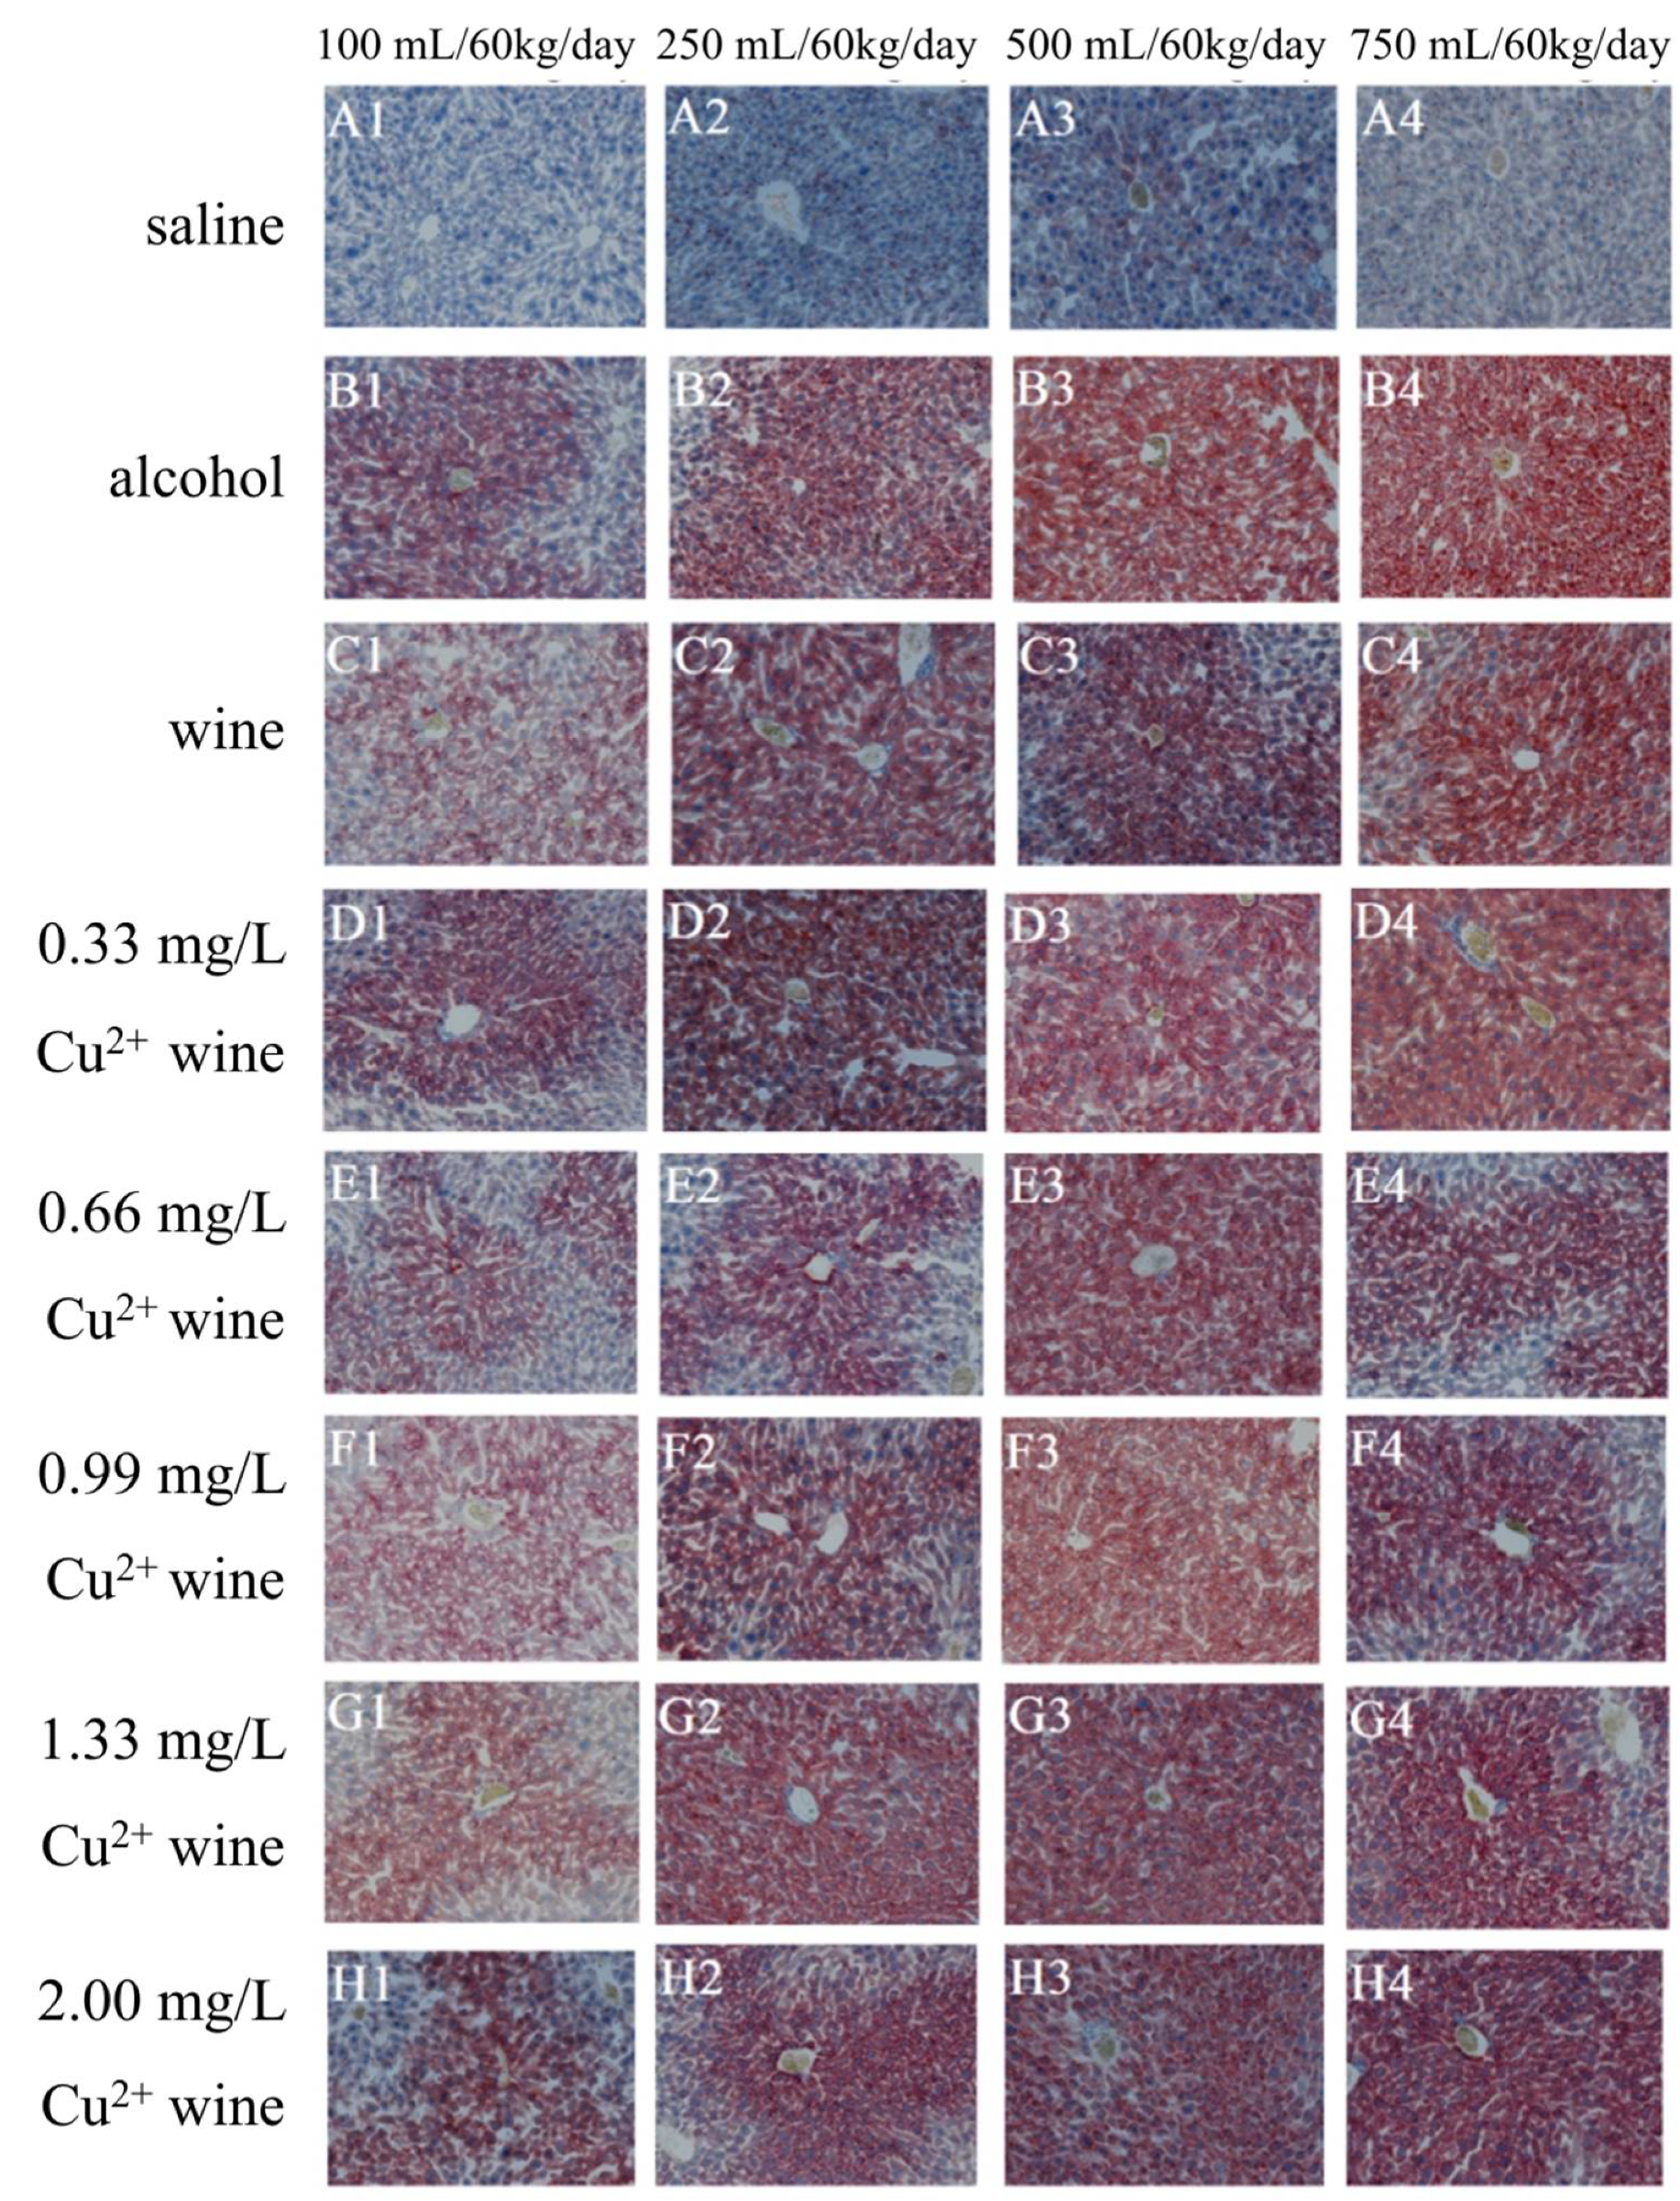
3.4. Histopathological Observation of Mouse Liver
3.4.1. HE Staining Results
3.4.2. OR Staining Results
3.5. Analysis of Copper Residue in Mouse Liver
4. Discussion
5. Conclusions
Supplementary Materials
Author Contributions
Funding
Institutional Review Board Statement
Informed Consent Statement
Data Availability Statement
Conflicts of Interest
References
- Bishehsari, F.; Magno, E.; Swanson, G.; Desai, V.; Voigt, R.M.; Forsyth, C.B.; Keshavarzian, A. Alcohol and Gut-Derived Inflammation. Alcohol Res. Curr. Rev. 2017, 38, 163–171. [Google Scholar]
- Bajaj, J.S. Alcohol, liver disease and the gut microbiota. Nat. Rev. Gastro. Hepat. 2019, 16, 235–246. [Google Scholar] [CrossRef] [PubMed]
- Li, H.; Xie, Z.; Zhang, Y.; Liu, Y.; Niu, A.; Liu, Y.; Zhang, L.; Guan, L. Rosa rugosa polysaccharide attenuates alcoholic liver disease in mice through the gut-liver axis. Food Biosci. 2021, 44, 101385. [Google Scholar] [CrossRef]
- Dunn, W.; Shah, V.H. Pathogenesis of alcoholic liver disease. Clin. Liver Dis. 2016, 20, 445–456. [Google Scholar] [CrossRef] [PubMed] [Green Version]
- Li, B.; Zhu, L.; Wu, T.; Zhang, J.; Jiao, X.; Liu, X.; Wang, Y.; Meng, X. Effects of triterpenoid from Schisandra Chinensis on oxidative stress in alcohol-induced liver injury in rats. Cell Biochem. Biophys. 2015, 71, 803–811. [Google Scholar] [CrossRef] [PubMed]
- Sun, X.; Cheng, X.; Zhang, J.; Ju, Y.; Que, Z.; Liao, X.; Lao, F.; Fang, Y.; Ma, T. Letting wine polyphenols functional: Estimation of wine polyphenols bioaccessibility under different drinking amount and drinking patterns. Food Res. Int. 2020, 127, 108704. [Google Scholar] [CrossRef]
- Sajish, M.; Schimmel, P. A human tRNA synthetase is a potent PARP1-activating effector target for resveratrol. Nature 2015, 519, 370–373. [Google Scholar] [CrossRef] [Green Version]
- Diaba-Nuhoho, P.; Cour, M.; Hadebe, N.; Marais, D.; Lecour, S.; Blackhurst, D. Chronic and moderate consumption of reduced-alcohol wine confers cardiac benefits in a rat model of pulmonary arterial hypertension. BMC Res. Note 2021, 14, 324. [Google Scholar] [CrossRef]
- Kasdallah-Grissa, A.; Mornagui, B.; Aouani, E.; Hammami, M.; May, M.E.; Gharbi, N.; Kamoun, A.; El-FazaâMiura, S. Resveratrol, a red wine polyphenol, attenuates ethanol-induced oxidative stress in rat liver. Life Sci. 2007, 80, 1033–1039. [Google Scholar] [CrossRef]
- Jiang, Z.; Chen, C.; Xie, W.; Wang, M.; Wang, J.; Zhang, X. Anthocyanins attenuate alcohol-induced hepatic injury by inhibiting pro-inflammation signaling. Nat. Prod. Res. 2016, 30, 469–473. [Google Scholar] [CrossRef]
- Tverdal, A.; Skurtveit, S.; Selmer, R.; Myhre, R.; Thelle, D. Coffee and wine consumption is associated with reduced mortality from alcoholic liver disease: Follow-up of 219,279 Norwegian men and women aged 30-67 years. Ann. Epidemiol. 2018, 28, 753–758. [Google Scholar] [CrossRef] [PubMed]
- Clark, A.; Kontoudakis, N.; Barril, C.; Schmidtke, L.; Scollary, G. Measurement of labile copper in wine by medium exchange stripping potentiometry utilising screen printed carbon electrodes. Talanta 2016, 154, 431–437. [Google Scholar] [CrossRef] [PubMed]
- Sun, X.; Zhao, Y.; Liu, L.; Jia, B.; Zhao, F.; Huang, W.; Zhan, J. Copper tolerance and biosorption of Saccharomyces cerevisiae during alcoholic fermentation. PLoS ONE 2015, 10, e0128611. [Google Scholar] [CrossRef] [PubMed]
- Ince, M.; Ince, O.K.; Onal, A. Exposure to copper and risk assessment for human health via consumption of alcoholic beverages. J. Food Sci. Technol. 2021, 58, 510–519. [Google Scholar] [CrossRef]
- García-Esparza, M.A.; Capri, E.; Pirzadeh, P.; Trevisan, M. Copper content of grape and wine from Italian farms. Food Additi. Contam. 2006, 23, 274–280. [Google Scholar] [CrossRef]
- Mirlean, N.; Roisenberg, A.; Chies, J. Metal contamination of vineyard soils in wet subtropics (southern Brazil). Environ. Pollut. 2007, 149, 10–17. [Google Scholar] [CrossRef]
- Turnlund, J.R.; Jacob, R.A.; Keen, C.L.; Strain, J.J.; Kelley, D.S.; Domek, J.M.; Keyes, W.R.; Ensunsa, J.L.; Lykkesfeldt, J.; Coulter, J. Long-term high copper intake: Effects on indexes of copper status, antioxidant status, and immune function in young men. Am. J. Clin. Nutr. 2004, 79, 1037–1044. [Google Scholar] [CrossRef]
- Araya, M.; Olivares, M.; Pizarro, F.; Gonzalez, M.; Speisky, H.; Uauy, R. Copper exposure and potential biomarkers of copper metabolism. BioMetals 2003, 16, 199–204. [Google Scholar] [CrossRef]
- Gutiérrez, A.J.; Rubio, C.; Moreno, I.M.; González, A.G.; Gonzalez-Weller, D.; Bencharki, N.; Hardisson, A.; Revert, C. Estimation of dietary intake and target hazard quotients for metals by consumption of wines from the Canary Islands. Food Chem. Toxicol. 2017, 108, 10–18. [Google Scholar] [CrossRef]
- Do, M.H.; Lee, H.L.L.; Kim, Y.; Lee, H.B.; Lee, E.; Park, J.H.; Park, H. Corchorus olitorius L. ameliorates alcoholic liver disease by regulating gut-liver axis. J. Funct. Foods 2021, 85, 104648. [Google Scholar] [CrossRef]
- Wang, J.; Xiao, J.; Zhang, J.; Chen, H.; Li, D.; Li, L.; Cao, J.; Xie, L.; Luo, Y. Effects of dietary Cu and Zn on the accumulation, oxidative stress and the expressions of immune–related genes in the livers of Nile tilapia (Oreochromis niloticus). Fish Shellfish Immun. 2020, 100, 198–207. [Google Scholar] [CrossRef] [PubMed]
- Li, W.; Yao, Y.; Chen, K.; Ju, Y.; Min, Z.; Sun, X.; Cheng, Z.; Liao, Z.; Zhang, K.; Fang, Y. Effect of foliar application of fulvic acid antitranspirant on sugar accumulation, phenolic profiles and aroma qualities of Cabernet Sauvignon and Riesling grapes and wines. Food Chem. 2021, 351, 129308. [Google Scholar] [CrossRef] [PubMed]
- Araya, M.; Núñez, H.; Pavez, L.; Arredondo, M.; Méndez, M.; Cisternas, F.; Pizarro, F.; Sierralta, W.; Uauy, R.; González, M. Administration of high doses of copper to capuchin monkeys does not cause liver damage but induces transcriptional activation of hepatic proliferative responses. J. Nutr. 2012, 142, 233–237. [Google Scholar] [CrossRef] [PubMed] [Green Version]
- Ma, T.; Sun, X.; Tian, C.; Zheng, Y.; Zheng, C.; Zhan, J. Chemical composition and hepatoprotective effects of polyphenols extracted from the stems and leaves of Sphallerocarpus gracilis. J. Funct. Foods 2015, 18, 673–683. [Google Scholar] [CrossRef]
- Ozcelik, D.; Ozaras, R.; Gurel, Z.; Uzun, H.; Aydin, S. Copper-mediated oxidative stress in rat liver. Biol. Trace Elem. Res. 2003, 96, 209–215. [Google Scholar] [CrossRef]
- Muñoz-Espín, D.; Serrano, M. Cellular senescence: From physiology to pathology. Nat. Rev. Mol. Cell Biol. 2014, 15, 482–496. [Google Scholar] [CrossRef]
- Rana, K.; Verma, Y.; Rana, S.V.S. Possible Mechanisms of Liver Injury Induced by Cadmium Sulfide Nanoparticles in Rat. Biol. Trace Elem. Res. 2021, 199, 216–226. [Google Scholar] [CrossRef]
- Fridovich, I. Superoxide dismutases. Annu. Rev. Biochem. 1975, 44, 147–159. [Google Scholar] [CrossRef]
- Gaetani, G.F.; Galiano, S.; Canepa, L.; Ferraris, A.M.; Kirkman, H.N. Catalase and glutathione peroxidase are equally active in detoxification of hydrogen peroxide in human erythrocytes. Blood 1989, 73, 334–339. [Google Scholar] [CrossRef] [Green Version]
- Halliwell, B.; Gutteridge, J.M.; Cross, C.E. Free radicals, antioxidants and human disease: Where are we now? J. Lab. Clin. Med. 1992, 119, 598–620. [Google Scholar] [CrossRef] [Green Version]
- Deroover, K.; Siegrist, M.; Brain, K.; McIntyre, J.; Bucher, T. A scoping review on consumer behaviour related to wine and health. Trends Food Sci. Technol. 2021, 112, 559–580. [Google Scholar] [CrossRef]
- Namachivayam, A.; Gopalakrishnan, A.V. A review on molecular mechanism of alcoholic liver disease. Life Sci. 2021, 274, 119328. [Google Scholar] [CrossRef] [PubMed]
- O’Keefe, J.H.; Bhatti, S.K.; Bajwa, A.; DiNicolantonio, J.J.; Lavie, C.J. Alcohol and cardiovascular health: The dose makes the poison… or the remedy. Mayo Clin. Proc. 2014, 89, 382–393. [Google Scholar] [CrossRef] [PubMed] [Green Version]
- Fuhrman, B.; Lavy, A.; Aviram, M. Consumption of red wine with meals reduces the susceptibility of human plasma and low-density lipoprotein to lipid peroxidation. Am. J. Clin. Nutr. 1995, 61, 549–554. [Google Scholar] [CrossRef] [PubMed]
- Micallef, M.; Lexis, L.; Lewandowski, P. Red wine consumption increases antioxidant status and decreases oxidative stress in the circulation of both young and old humans. Nutr. J. 2007, 6, 27. [Google Scholar] [CrossRef] [Green Version]
- Komárek, M.; Čadková, E.; Chrastný, V.; Bordas, F.; Bollinger, J. Contamination of vineyard soils with fungicides: A review of environmental and toxicological aspects. Environ. Int. 2010, 36, 138–151. [Google Scholar] [CrossRef]
- Yu, W.; Liao, J.; Yang, F.; Zhang, H.; Chang, X.; Yang, Y.; Bilal, R.M.; Wei, G.; Liang, W.; Guo, J.; et al. Chronic tribasic copper chloride exposure induces rat liver damage by disrupting the mitophagy and apoptosis pathways. Ecotox. Environ. Safe. 2021, 212, 111968. [Google Scholar] [CrossRef]
- Bertinato, J.; L’Abbé, M.R. Maintaining copper homeostasis: Regulation of copper-trafficking proteins in response to copper deficiency or overload. J. Nutr. Biochem. 2004, 15, 316–322. [Google Scholar] [CrossRef]
- Jomova, K.; Valko, M. Advances in metal-induced oxidative stress and human disease. Toxicology 2011, 283, 65–87. [Google Scholar] [CrossRef]
- Jong, W.H.; Rijk, E.D.; Bonetto, A.; Wohlleben, W.; Stone, V.; Brunelli, A.; Badetti, E.; Marcomini, A.; Gosens, I.; Cassee, F.R. Toxicity of copper oxide and basic copper carbonate nanoparticles after short-term oral exposure in rats. Nanotoxicology 2018, 13, 50–72. [Google Scholar] [CrossRef]
- He, S.; Liu, D.; Li, J.; Zhao, S.; Jin, E.; Li, X. Effects of high copper dose on morphology and antioxidant function of liver and kidney in mice. Acta Nutr. Sin. 2014, 36, 253–257. [Google Scholar]
- Saporito-Magriñá, C.; Musacco-Sebio, R.; Acosta, J.M.; Bajicoff, S.; Paredes-Fleitas, P.; Boveris, A.; Repetto, M.G. Rat liver mitochondrial dysfunction by addition of copper(II) or iron(III) ions. J. Inorg. Biochem. 2017, 166, 5–11. [Google Scholar] [CrossRef] [PubMed]
- Saporito-Magriñá, C.; Musacco-Sebio, R.; Acosta, J.M.; Bajicoff, S.; Paredes-Fleitas, P.; Reynoso, S.; Boveris, A.; Repetto, M.G. Copper(II) and iron(III) ions inhibit respiration and increase free radical-mediated phospholipid peroxidation in rat liver mitochondria: Effect of antioxidants. J. Inorg. Biochem. 2017, 172, 94–99. [Google Scholar] [CrossRef] [PubMed]


| Wine | 0.33 mg/L Copper Wine | 0.66 mg/L Copper Wine | 0.99 mg/L Copper Wine | 1.33 mg/L Copper Wine | 2.00 mg/L Copper Wine | |
|---|---|---|---|---|---|---|
| Phenolic compounds | ||||||
| Flavanol | ||||||
| Epigallocatechin | 50.28 ± 3.13 d | 45.24 ± 0.14 e | 52.21 ± 2.23 c | 57.67 ± 1.52 a | 55.13 ± 6.29 b | 58.26 ± 5.71 a |
| Catechin | 143.78 ± 2.56 b | 144.24 ± 1.75 b | 138.66 ± 4.28 c | 153.78 ± 6.56 a | 128.74 ± 1.60 d | 125.32 ± 2.36 e |
| Epigallocatechin 3-gallate | 12.23 ± 0.55 a | 10.23 ± 0.26 b | 9.89 ± 1.11 b | 9.53 ± 0.99 b | 9.44 ± 0.89 b | 9.33 ± 1.00 b |
| Epicatechin | 236.72 ± 8.79 a | 230.66 ± 6.49 b | 228.71 ± 9.23 c | 237.21 ± 4.57 a | 235.82 ± 8.11 a | 226.77 ± 7.84 d |
| Epicatechin-3-O-gallate | 34.21 ± 1.55 a | 32.89 ± 2.06 a | 30.01 ± 1.66 b | 28.99 ± 0.99 b | 25.32 ± 2.23 c | 25.44 ± 0.60 c |
| Myricetin | 32.46 ± 0.53 a | 28.46 ± 1.24 b | 27.96 ± 0.39 b | 28.04 ± 0.55 b | 27.89 ± 0.50 b | 28.82 ± 1.12 b |
| Isorhamnetin | 2.33 ± 0.10 a | 1.16 ± 0.08 a | 1.03 ± 0.12 a | 0.99 ± 0.09 a | 1.00 ± 0.08 a | 1.13 ± 0.15 a |
| Flavonol | ||||||
| Rutin | 168.49 ± 1.85 a | 123.43 ± 0.76 f | 128.11 ± 4.21 e | 146.79 ± 8.37 d | 152.41 ± 3.48 c | 160.33 ± 2.36 b |
| Isoquercitrin | 108.52 ± 1.22 c | 106.22 ± 4.68 d | 105.82 ± 5.04 d | 109.51 ± 6.11 bc | 123.83 ± 0.88 a | 111.22 ± 3.49 b |
| Quercitrin | 66.57 ± 4.07 a | 58.87 ± 2.88 b | 59.11 ± 5.02 b | 56.13 ± 4.73 c | 56.02 ± 7.01 c | 55.49 ± 1.99 c |
| Resveratrol | 4.56 ± 0.22 a | 4.44 ± 0.43 a | 4.38 ± 0.42 a | 4.36 ± 0.39 a | 4.39 ± 0.56 a | 4.33 ± 0.50 a |
| Quercetin | 29.44 ± 1.67 a | 29.23 ± 2.23 a | 29.11 ± 0.79 a | 29.04 ± 1.98 a | 28.89 ± 3.21 a | 29.34 ± 2.66 a |
| Luteolin | 1.35 ± 0.04 a | 0.95 ± 0.15 a | 0.88 ± 0.12 a | 0.85 ± 0.10 a | 0.83 ± 0.18 a | 0.79 ± 0.13 a |
| Apigenin | 0.50 ± 0.03 a | 0.48 ± 0.03 a | 0.47 ± 0.02 a | 0.51 ± 0.03 a | 0.46 ± 0.01 a | 0.52 ± 0.06 a |
| Kaempferol | 1.28 ± 0.08 a | 1.20 ± 0.14 a | 1.21 ± 0.10 a | 1.17 ± 0.13 a | 1.19 ± 0.15 a | 1.40 ± 0.09 a |
| Hydroxycinnamic acid | ||||||
| Trans-fertaric acid | 2.49 ± 0.19 a | 2.40 ± 0.18 a | 2.39 ± 0.43 a | 2.32 ± 0.22 a | 2.35 ± 0.18 a | 2.36 ± 0.18 a |
| Caffeic acid | 18.87 ± 1.43 a | 18.67 ± 2.24 a | 18.57 ± 1.46 a | 18.62 ± 1.79 a | 18.55 ± 2.03 a | 18.49 ± 2.44 a |
| Coumaric acid | 24.11 ± 1.58 b | 25.08 ± 0.59 a | 25.11 ± 1.60 a | 25.11 ± 1.23 a | 25.13 ± 1.11 a | 25.12 ± 0.99 a |
| 4-hydroxycinnamic acid | 4.99 ± 0.49 c | 4.95 ± 0.34 c | 4.89 ± 0.21 c | 4.97 ± 0.52 c | 6.31 ± 0.73 a | 5.22 ± 0.55 b |
| Ferulic acid | 4.08 ± 0.11 a | 4.05 ± 0.52 a | 3.99 ± 0.43 a | 3.95 ± 0.17 a | 3.78 ± 0.15 a | 3.68 ± 0.26 a |
| 3-hydroxycinnamic acid | 3.22 ± 0.41 c,d | 3.52 ± 0.22 b,c | 3.89 ± 0.32 a | 3.74 ± 0.44 a,b | 3.59 ± 0.65 a,b | 3.19 ± 0.16 d |
| Sinapic acid | 10.26 ± 0.14 a | 5.26 ± 0.85 c | 4.96 ± 1.01 c | 4.99 ± 0.88 c | 8.24 ± 0.98 b | 5.20 ± 0.56 c |
| Isoferulic acid | 4.28 ± 0.08 a | 1.28 ± 0.05 b | 1.34 ± 0.04 b | 1.33 ± 0.06 b | 1.19 ± 0.12 b | 1.19 ± 0.03 b |
| Hydroxy benzoic acid | ||||||
| Gallic acid | 30.06 ± 2.77 a | 30.12 ± 1.88 a | 29.96 ± 3.10 a | 30.10 ± 2.70 a | 29.69 ± 2.42 a | 31.26 ± 2.55 a |
| Protocatechuic acid | 0.79 ± 0.11 a | 0.82 ± 0.08 a | 0.85 ± 0.03 a | 0.86 ± 0.09 a | 0.83 ± 0.15 a | 0.84 ± 0.10 a |
| Gentisic acid | 96.56 ± 7.29 a | 96.16 ± 6.63 a | 95.86 ± 6.37 a | 95.12 ± 9.21 a | 92.54 ± 3.03 b | 90.88 ± 8.30 b |
| Vanillic acid | 37.98 ± 0.98 a,b | 39.59 ± 2.99 a | 37.30 ± 1.23 b | 36.98 ± 3.37 b | 37.11 ± 0.55 b | 37.03 ± 1.00 b |
| Syringic acid | 15.87 ± 0.23 a | 16.87 ± 0.64 a | 16.99 ± 0.27 a | 17.01 ± 0.98 a | 17.68 ± 1.10 a | 16.87 ± 0.98 a |
| Methyl 3,4-dihydroxybenzoate | 6.44 ± 0.22 a | 5.68 ± 0.42 a | 5.44 ± 0.33 a | 5.38 ± 0.45 a | 5.37 ± 0.24 a | 5.23 ± 0.44 a |
| Methyl vanillate | 1.42 ± 0.08 a | 1.52 ± 0.14 a | 1.33 ± 0.10 a | 1.29 ± 0.08 a | 1.31 ± 0.12 a | 1.25 ± 0.10 a |
| Ethyl 4-hydroxybenzoate | 165.93 ± 9.33 d | 168.23 ± 7.27 c | 170.63 ± 11.03 b | 171.22 ± 8.00 a,b | 173.02 ± 6.49 a | 172.99 ± 5.98 a |
| Vanilic acid ethyl ester | 8.19 ± 0.63 a | 8.49 ± 0.54 a | 8.52 ± 0.60 a | 8.66 ± 0.92 a | 8.55 ± 0.81 a | 8.53 ± 0.63 a |
| Organic acids | ||||||
| Oxalic acid | 11.10 ± 0.03 b,c | 11.16 ± 0.04 b,c | 10.88 ± 0.12 c | 11.28 ± 0.02 a,b | 11.47 ± 0.06 a | 10.56 ± 0.33 d |
| Tartaric acid | 2181.40 ± 30.10 b | 2186.78 ± 15.31 b | 2276.53 ± 25.14 a | 2256.91 ± 8.93 a | 2251.93 ± 3.53 a | 2215.29 ± 16.63 b |
| Quinic acid | 30.08 ± 1.01 a | 29.03 ± 1.00 a | 28.91 ± 2.01 a | 29.01 ± 1.00 a | 29.08 ± 3.26 a | 28.22 ± 0.25 a |
| Pyruvic acid | 80.35 ± 0.01 a | 80.00 ± 1.00 a | 80.84 ± 2.00 a | 78.36 ± 2.10 a | 82.02 ± 4.02 a | 76.01 ± 6.01 a |
| Shikimic acid | 102.98 ± 3.00 a | 103.07 ± 3.00 a | 106.12 ± 4.01 a | 100.86 ± 10.52 a | 101.69 ± 0.60 a | 100.49 ± 5.50 a |
| Malic acid | 107.05 ± 7.00 a | 112.05 ± 2.01 a | 107.86 ± 3.01 a | 110.02 ± 4.00 a | 110.61 ± 4.60 a | 105.18 ± 10.01 a |
| Malonic acid | 6.99 ± 0.50 a,b | 6.85 ± 0.15 a,b | 6.74 ± 0.24 a,b | 6.95 ± 0.05 a,b | 7.22 ± 0.26 a | 6.42 ± 0.39 b |
| Lactic acid | 2101.15 ± 51.00 a | 2080.52 ± 20.02 a | 2036.01 ± 14.00 a,b | 1974.30 ± 74.01 b | 2042.15 ± 42.18 a,b | 2019.42 ± 19.53 a,b |
| Citric acid | 25.79 ± 0.88 a | 26.01 ± 1.04 a | 26.45 ± 2.45 a | 26.42 ± 4.42 a | 26.10 ± 1.10 a | 26.28 ± 1.28 a |
| Fumaric acid | 1.1 ± 0.20 a | 0.93 ± 0.07 a | 1.11 ± 0.14 a | 1.05 ± 0.05 a | 0.99 ± 0.01 a | 1.07 ± 0.13 a |
| Succinic acid | 943.11 ± 43.00 a | 938.09 ± 47.99 a | 930.23 ± 30.01 a | 928.26 ± 22.07 a | 928.22 ± 31.50 a | 926.62 ± 19.52 a |
| Groups | Copper Content in Mouse Liver (μg/g) | |||
|---|---|---|---|---|
| Drinking Amount (mL/60 kg/day) | ||||
| 100 | 250 | 500 | 750 | |
| saline | 1.98 ± 0.22 a E | 2.03 ± 0.25 a E | 2.05 ± 0.21 a E | 1.98 ± 0.27 a E |
| alcohol | 2.01 ± 0.34 a E | 1.94 ± 0.23 a E | 2.13 ± 0.33 a E | 1.89 ± 0.32 a E |
| wine | 2.09 ± 0.22 a E | 2.02 ± 0.31 a E | 2.09 ± 0.24 a E | 1.99 ± 0.29 a E |
| 0.33 mg/L copper wine | 2.13 ± 0.29 b DE | 2.18 ± 0.31 ab D | 2.26 ± 0.24 a DE | 2.33 ± 0.23 a D |
| 0.66 mg/L copper wine | 2.24 ± 0.23 b D | 2.34 ± 0.19 ab CD | 2.39 ± 0.28 a D | 2.45 ± 0.31 a D |
| 0.99 mg/L copper wine | 2.48 ± 0.55 c C | 2.59 ± 0.33 bc C | 2.67 ± 0.14 b C | 2.81 ± 0.34 a C |
| 1.33 mg/L copper wine | 2.69 ± 0.29 d B | 2.82 ± 0.29 c B | 2.96 ± 0.23 b B | 3.15 ± 0.11 a B |
| 2.00 mg/L copper wine | 2.98 ± 0.22 d A | 3.14 ± 0.13 c A | 3.29 ± 0.19 b A | 3.34 ± 0.12 a A |
Publisher’s Note: MDPI stays neutral with regard to jurisdictional claims in published maps and institutional affiliations. |
© 2022 by the authors. Licensee MDPI, Basel, Switzerland. This article is an open access article distributed under the terms and conditions of the Creative Commons Attribution (CC BY) license (https://creativecommons.org/licenses/by/4.0/).
Share and Cite
Sun, X.; Wang, J.; Ge, Q.; Li, C.; Ma, T.; Fang, Y.; Zhan, J. Interactive Effects of Copper and Functional Substances in Wine on Alcoholic Hepatic Injury in Mice. Foods 2022, 11, 2383. https://doi.org/10.3390/foods11162383
Sun X, Wang J, Ge Q, Li C, Ma T, Fang Y, Zhan J. Interactive Effects of Copper and Functional Substances in Wine on Alcoholic Hepatic Injury in Mice. Foods. 2022; 11(16):2383. https://doi.org/10.3390/foods11162383
Chicago/Turabian StyleSun, Xiangyu, Jiaqi Wang, Qian Ge, Caihong Li, Tingting Ma, Yulin Fang, and Jicheng Zhan. 2022. "Interactive Effects of Copper and Functional Substances in Wine on Alcoholic Hepatic Injury in Mice" Foods 11, no. 16: 2383. https://doi.org/10.3390/foods11162383