

Coffee Leaf Tea from El Salvador: On-Site Production Considering Influences of Processing on Chemical Composition

 ,
, 

 ,
,  and
and
Abstract
:1. Introduction
2. Materials and Methods
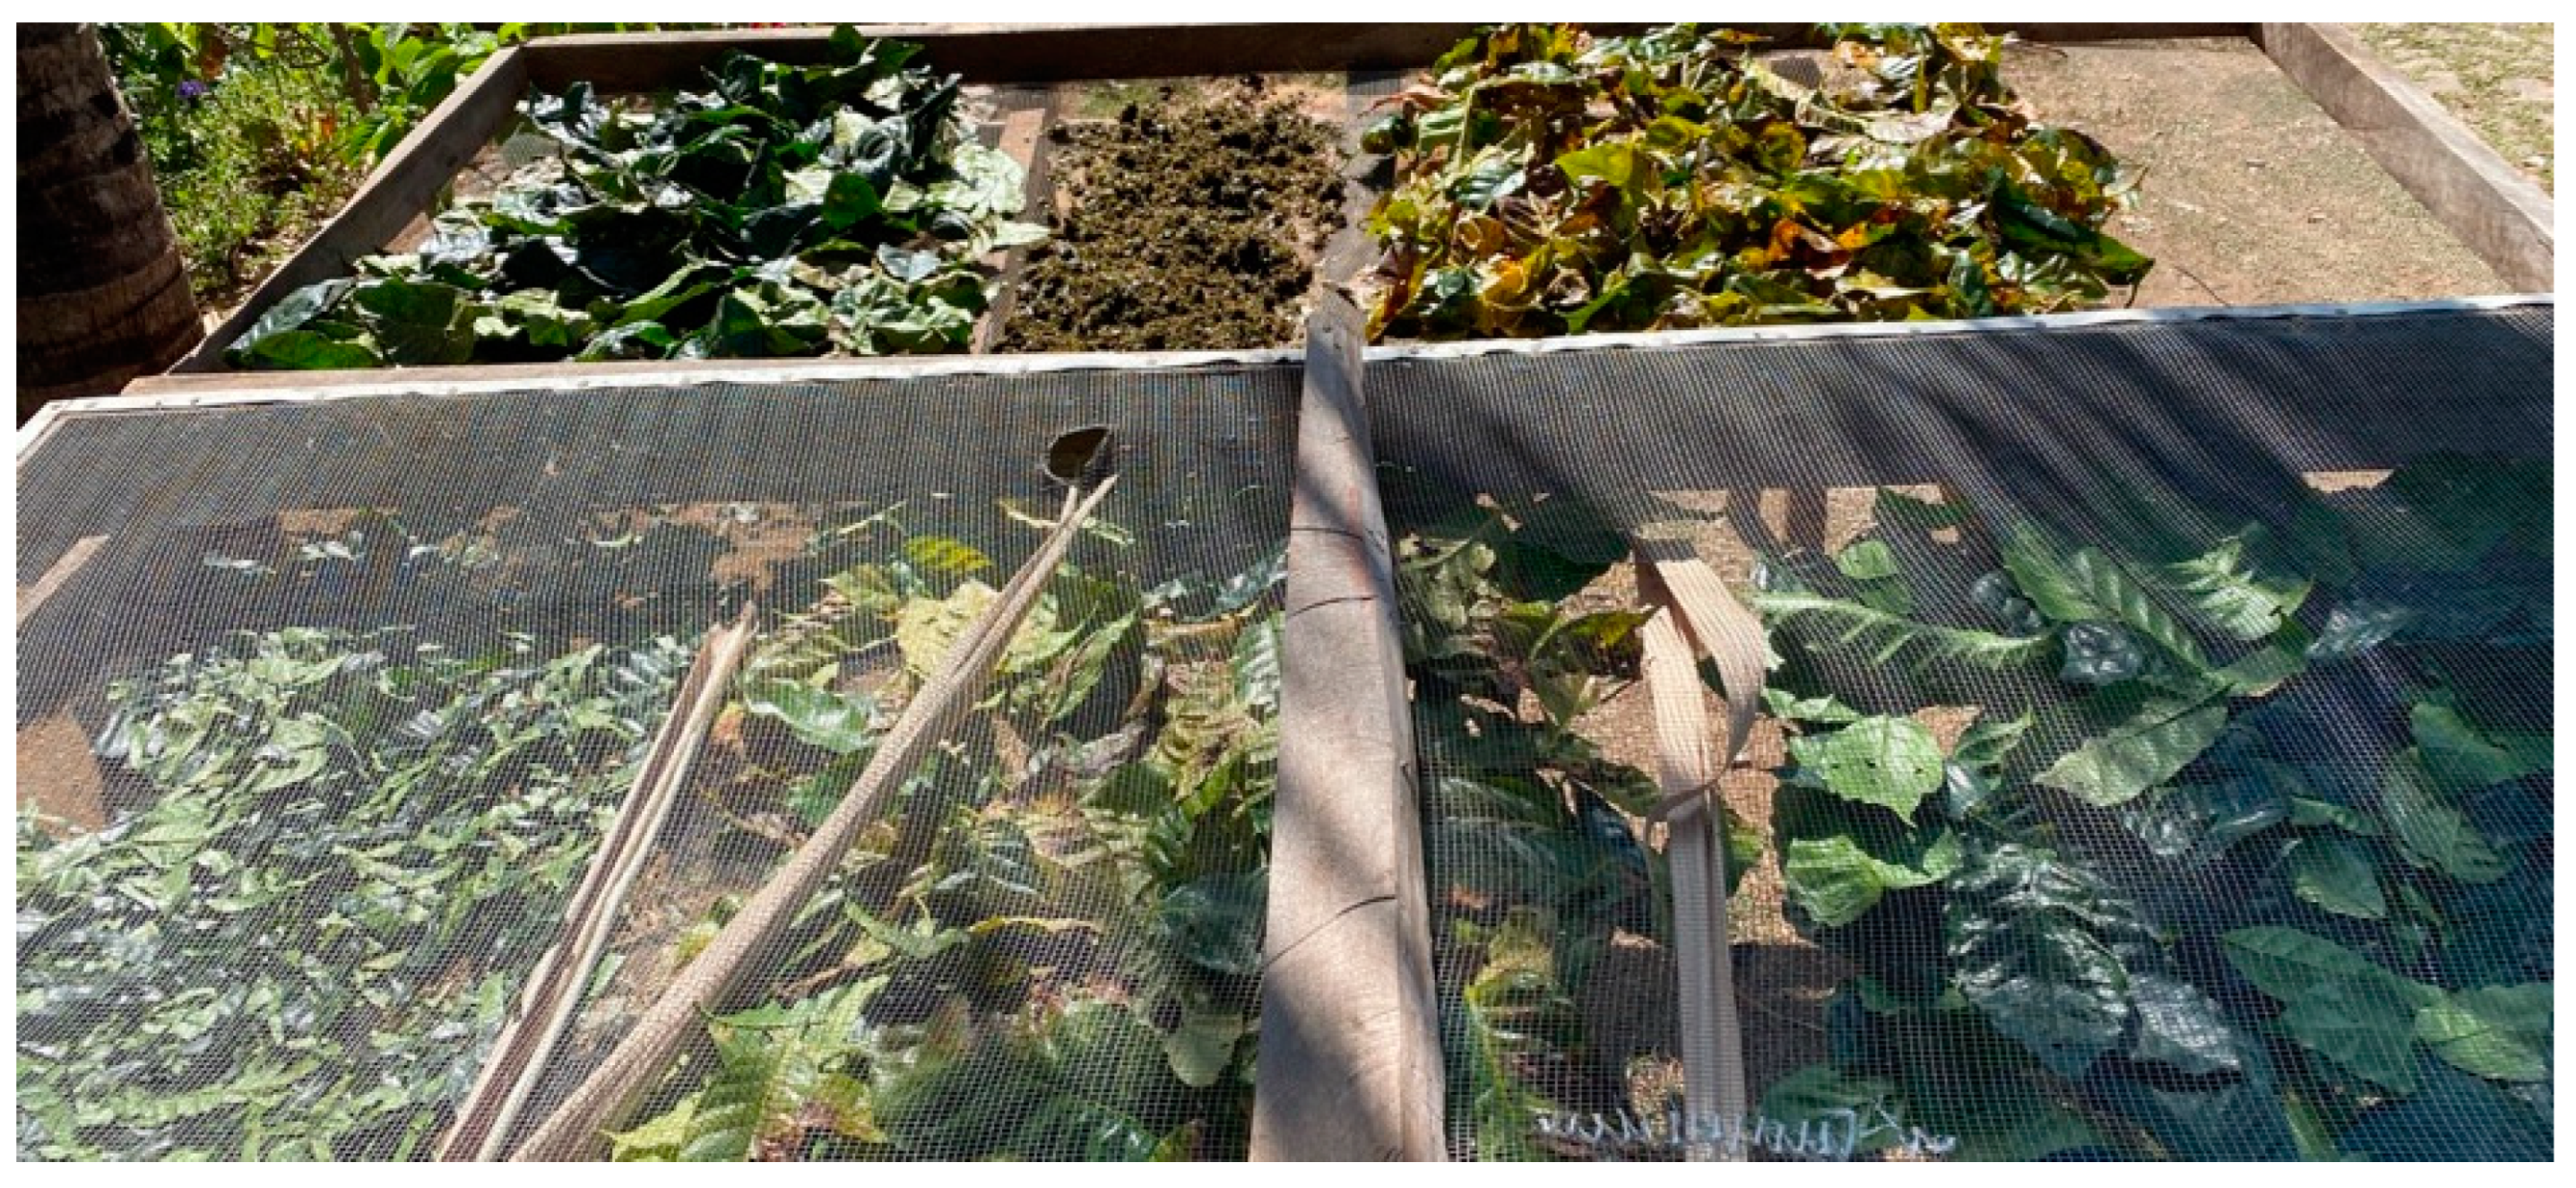
2.1. Coffee Leaf Tea Production in El Salvador
2.1.1. Drying Methods
2.1.2. Fermentation
2.1.3. Postprocessing and Packaging
2.2. Analysing of Non-Volatile Compounds
2.2.1. Sample Preparation for HPLC, NMR, NIR, and Photometry
2.2.2. Standard Analytical Procedures
2.2.3. Nuclear Magnetic Resonance (NMR) Spectrometry
2.3. Preliminary Sensory Analysis
2.4. Analysis of Volatile, Odour-Active Compounds
2.4.1. Tea Preparation
2.4.2. Direct-Immersion Stir Bar Sorptive Extraction (DI-SBSE)
2.4.3. Gas Chromatography
2.4.4. Odour Activity Value (OAV)
2.5. Statistical Analysis
3. Results and Discussion
3.1. Moisture Content of Fresh Leaves
3.2. Preparation of Coffee Leaf Tea Samples
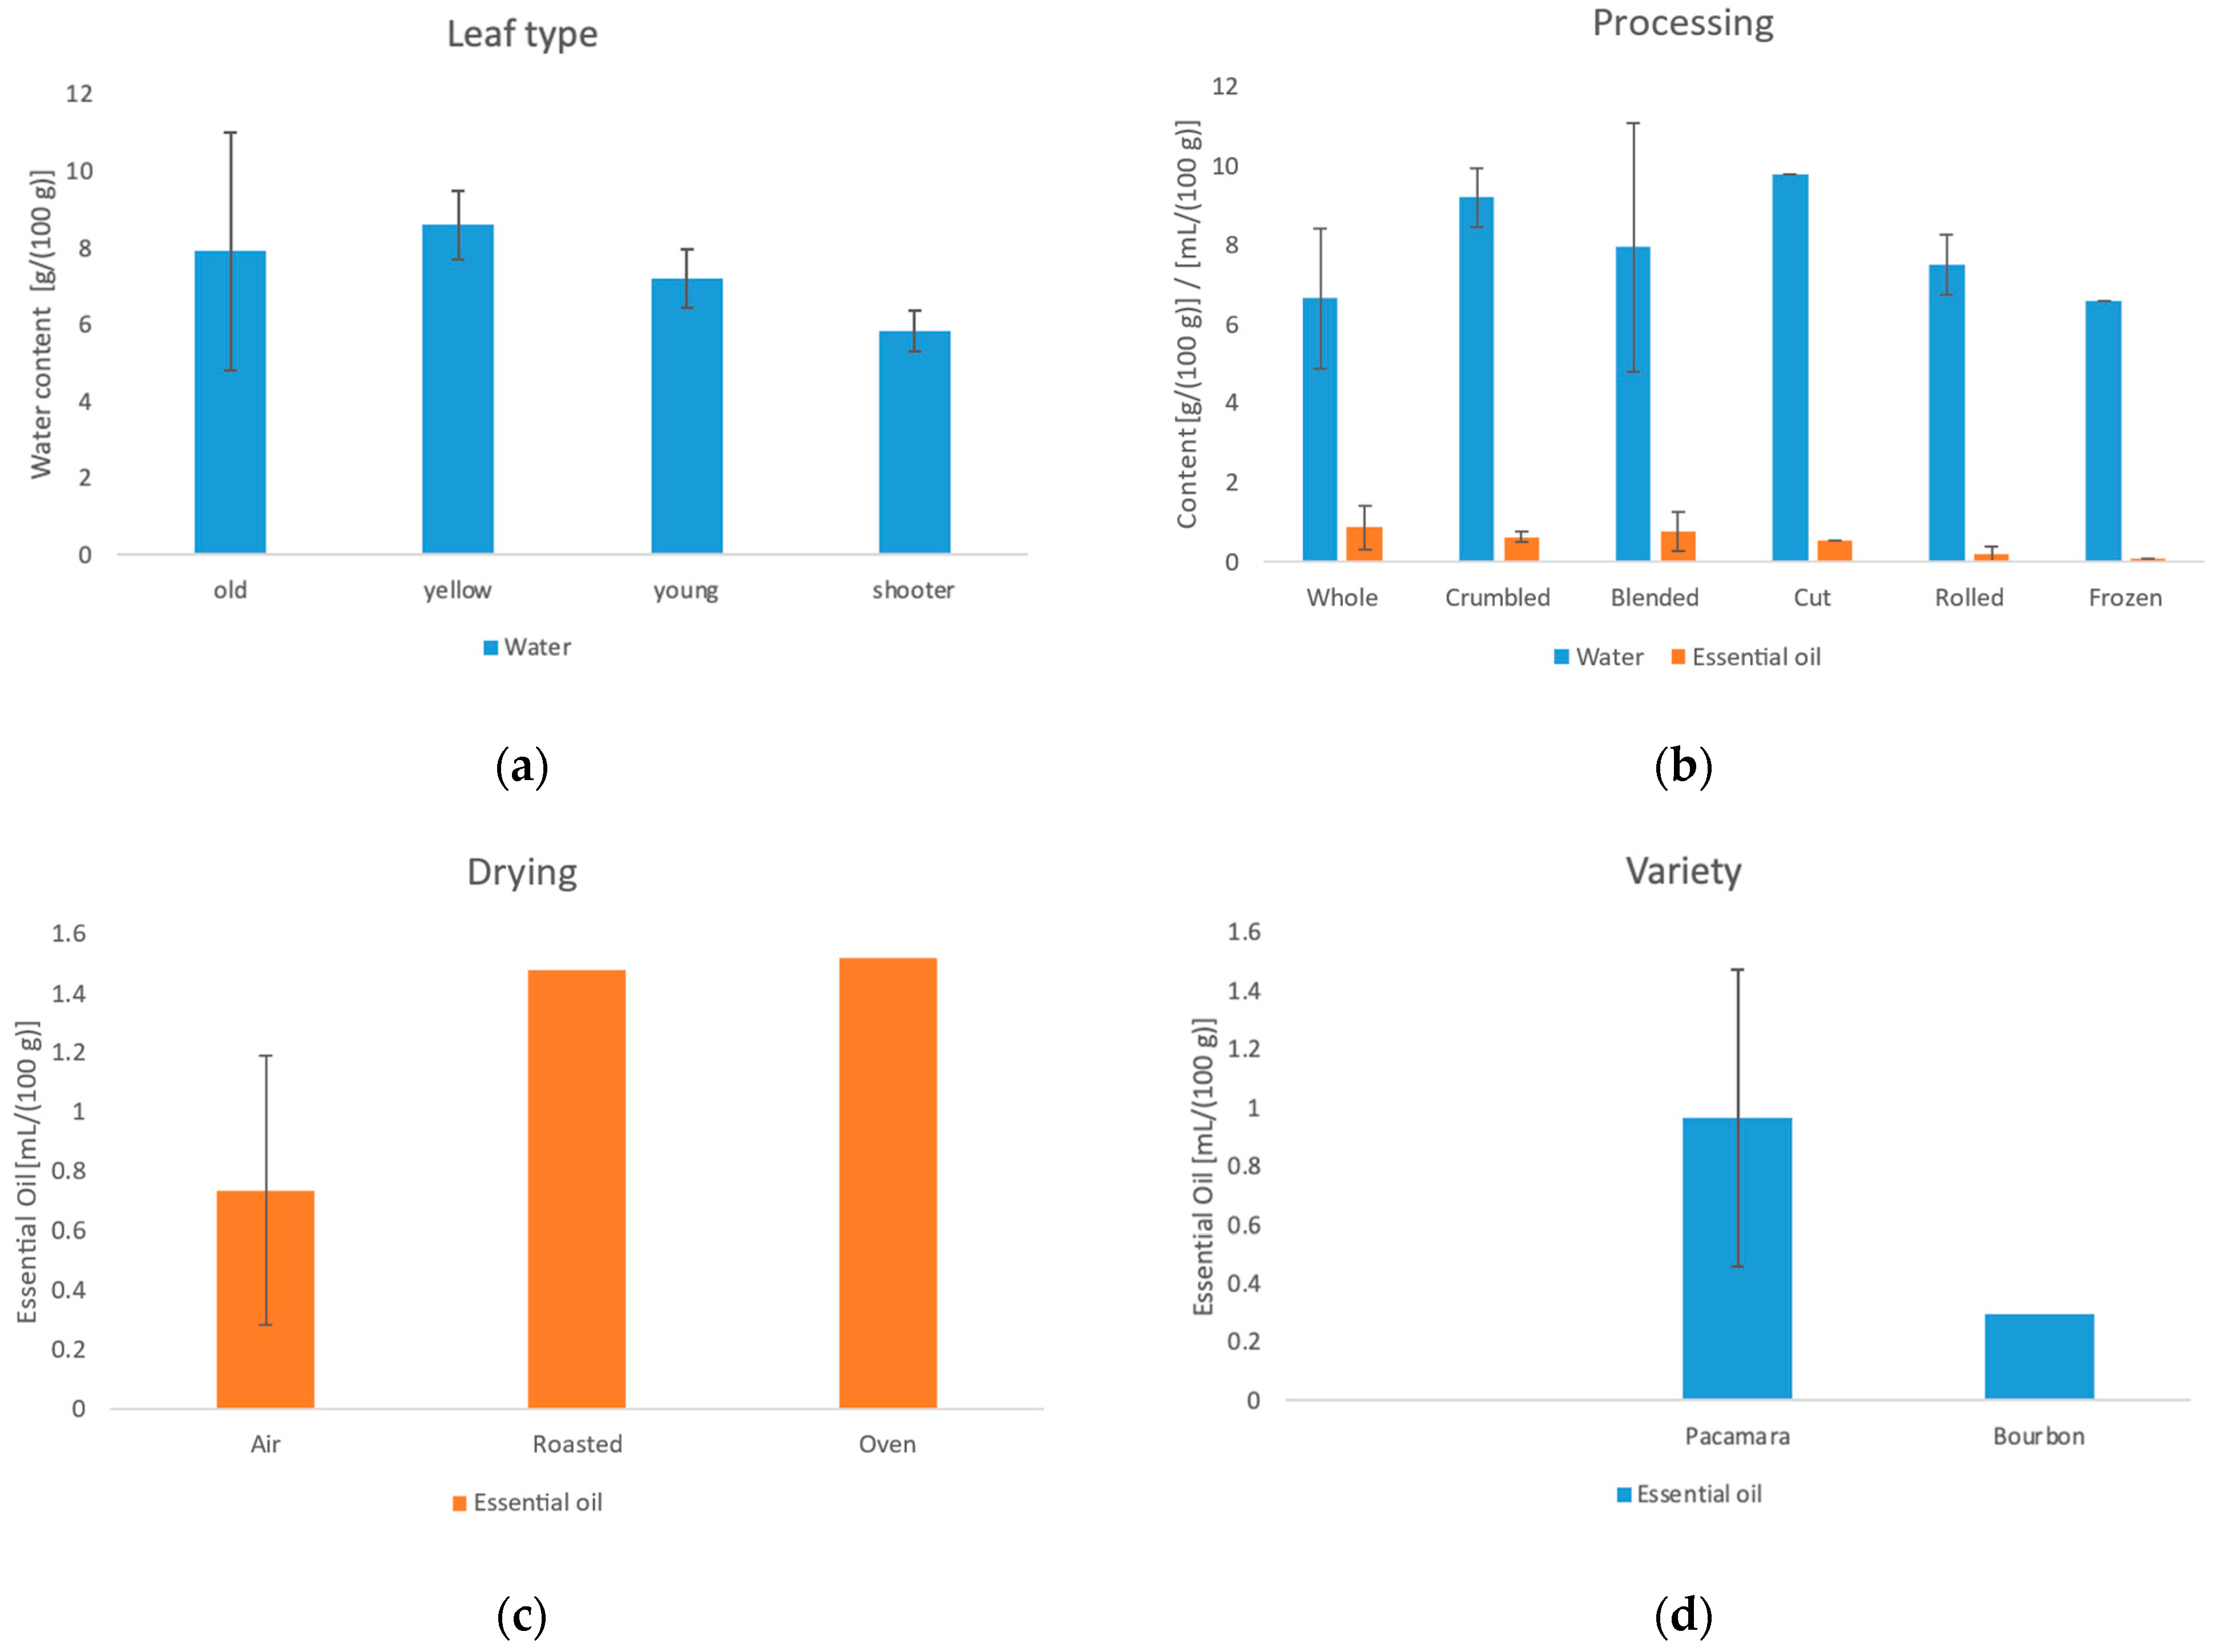
3.3. Water Content, Essential Oil Content and Ash Content
3.4. Content of Caffeine and Catechins
3.4.1. Caffeine
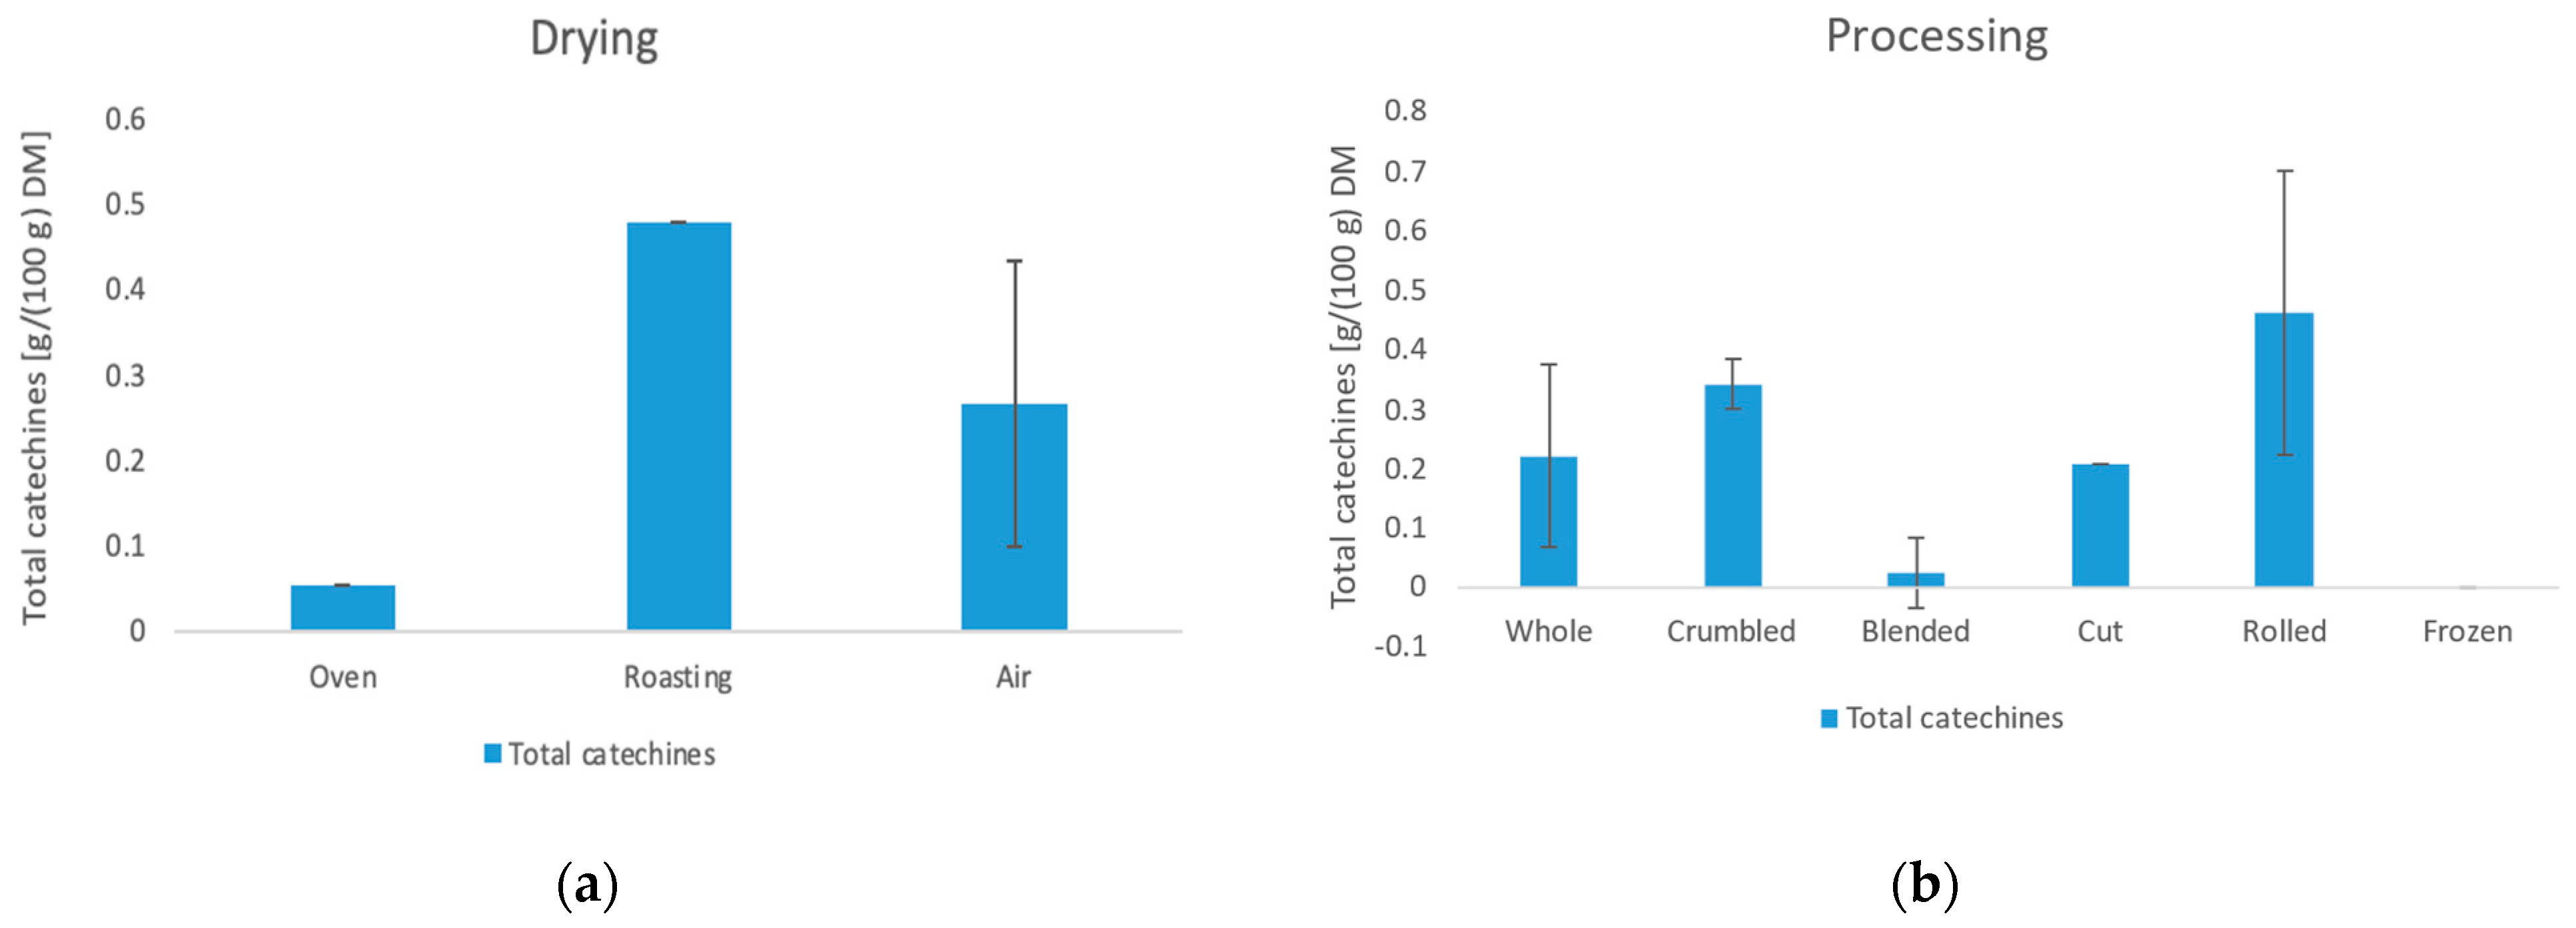
3.4.2. Catechins
3.5. Content of Total Polyphenols
3.6. Content of Organic Acids and Trigonellin
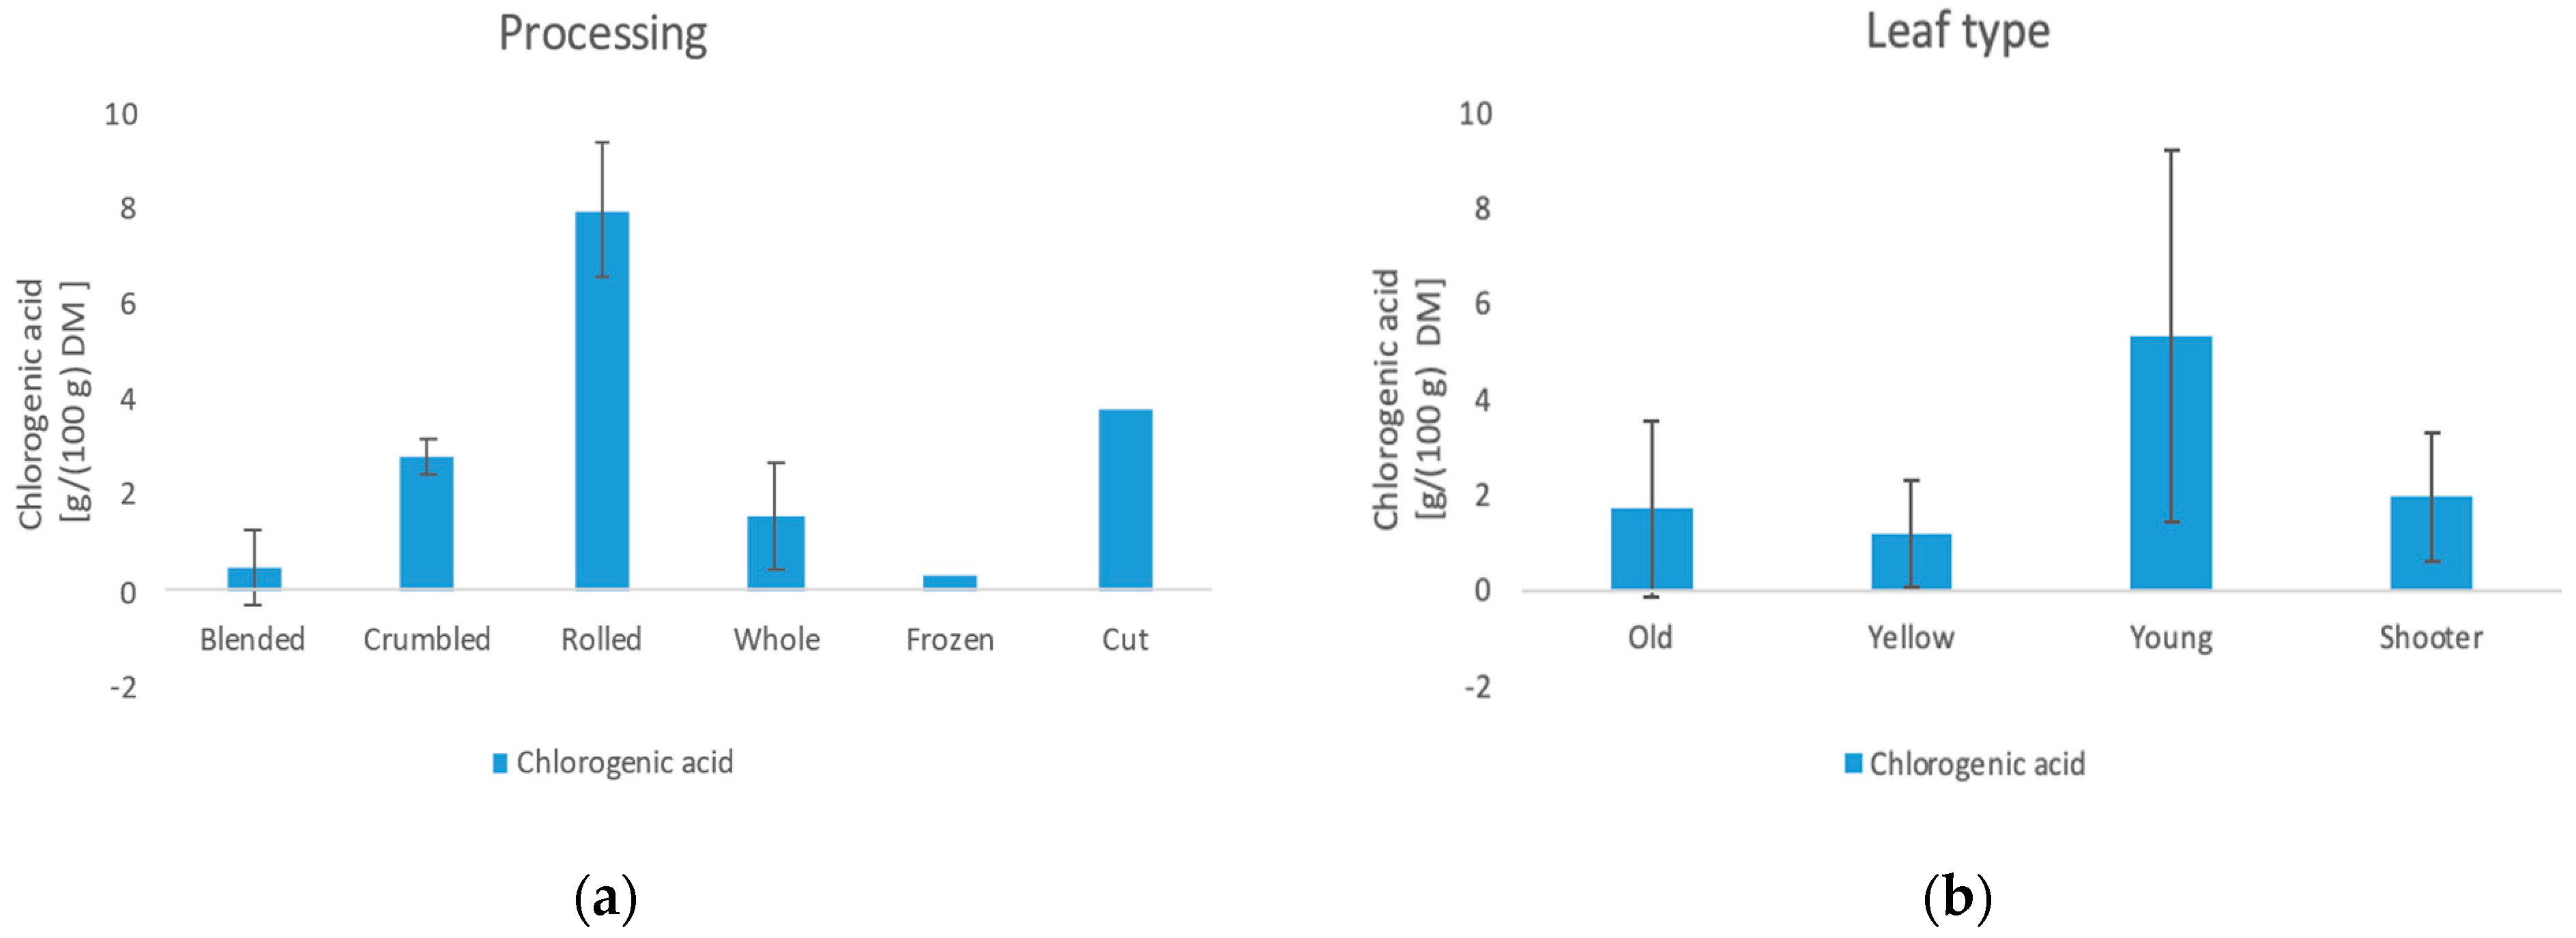
3.6.1. Chlorogenic Acid
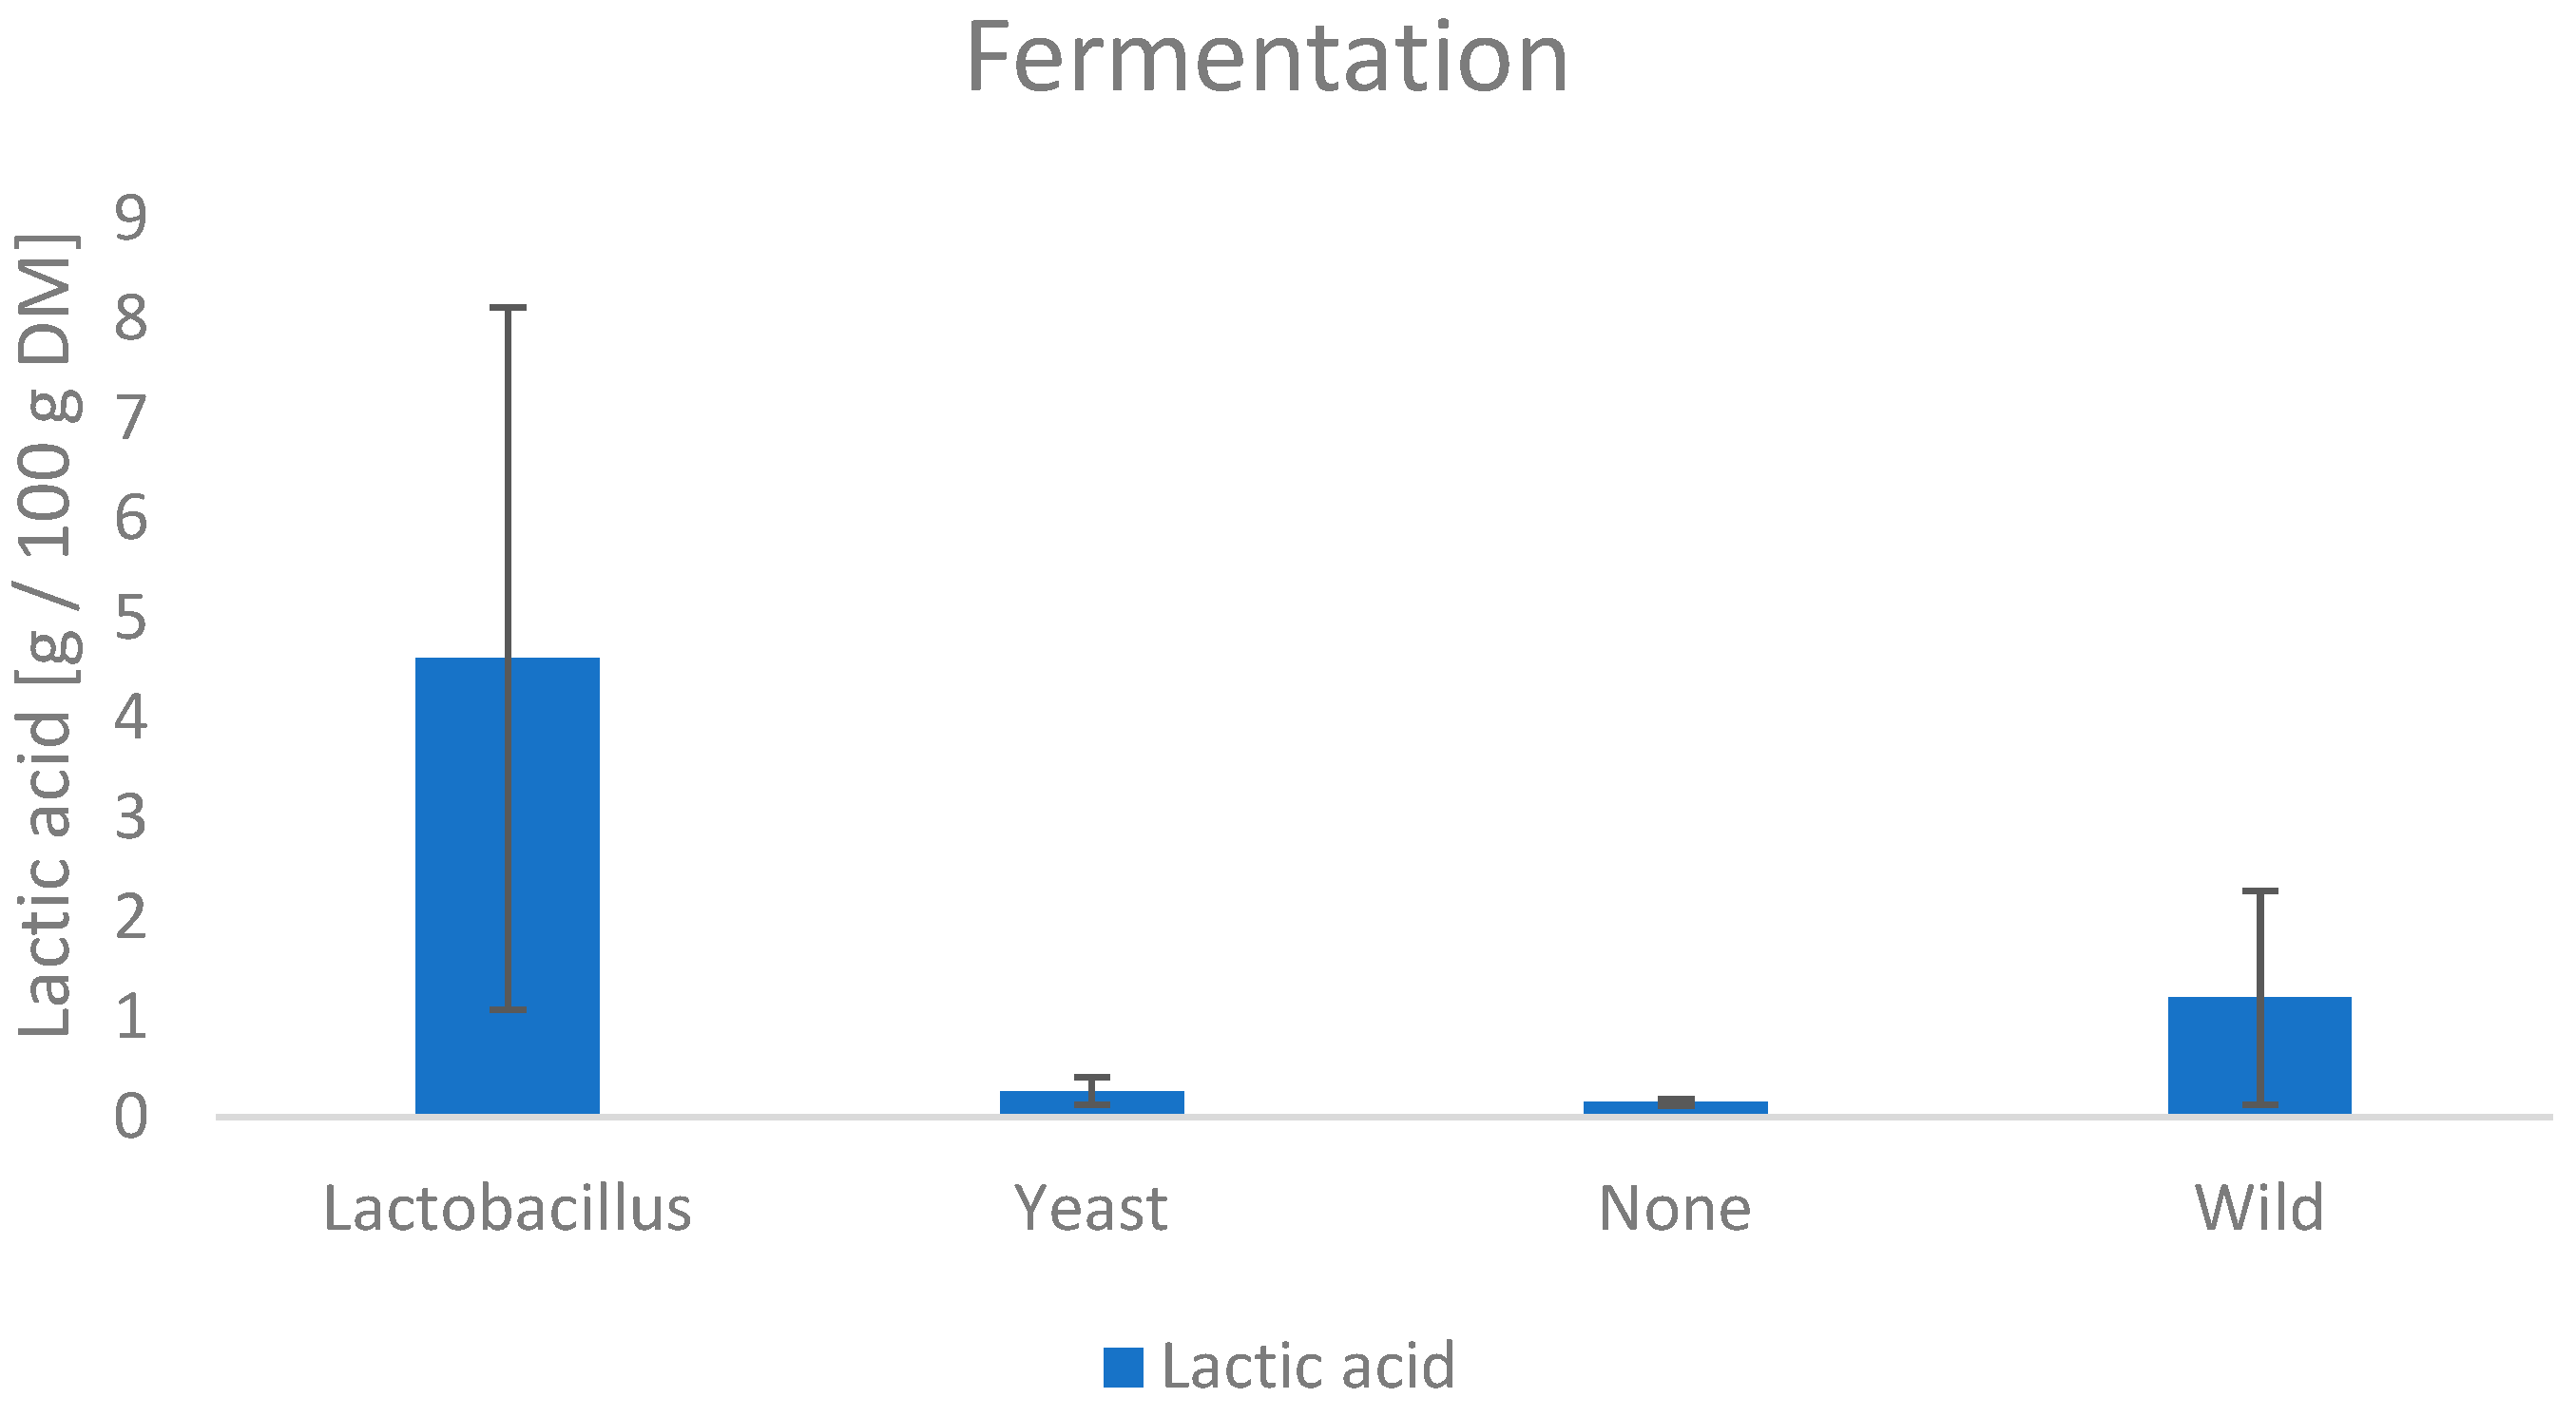
3.6.2. Lactic Acid
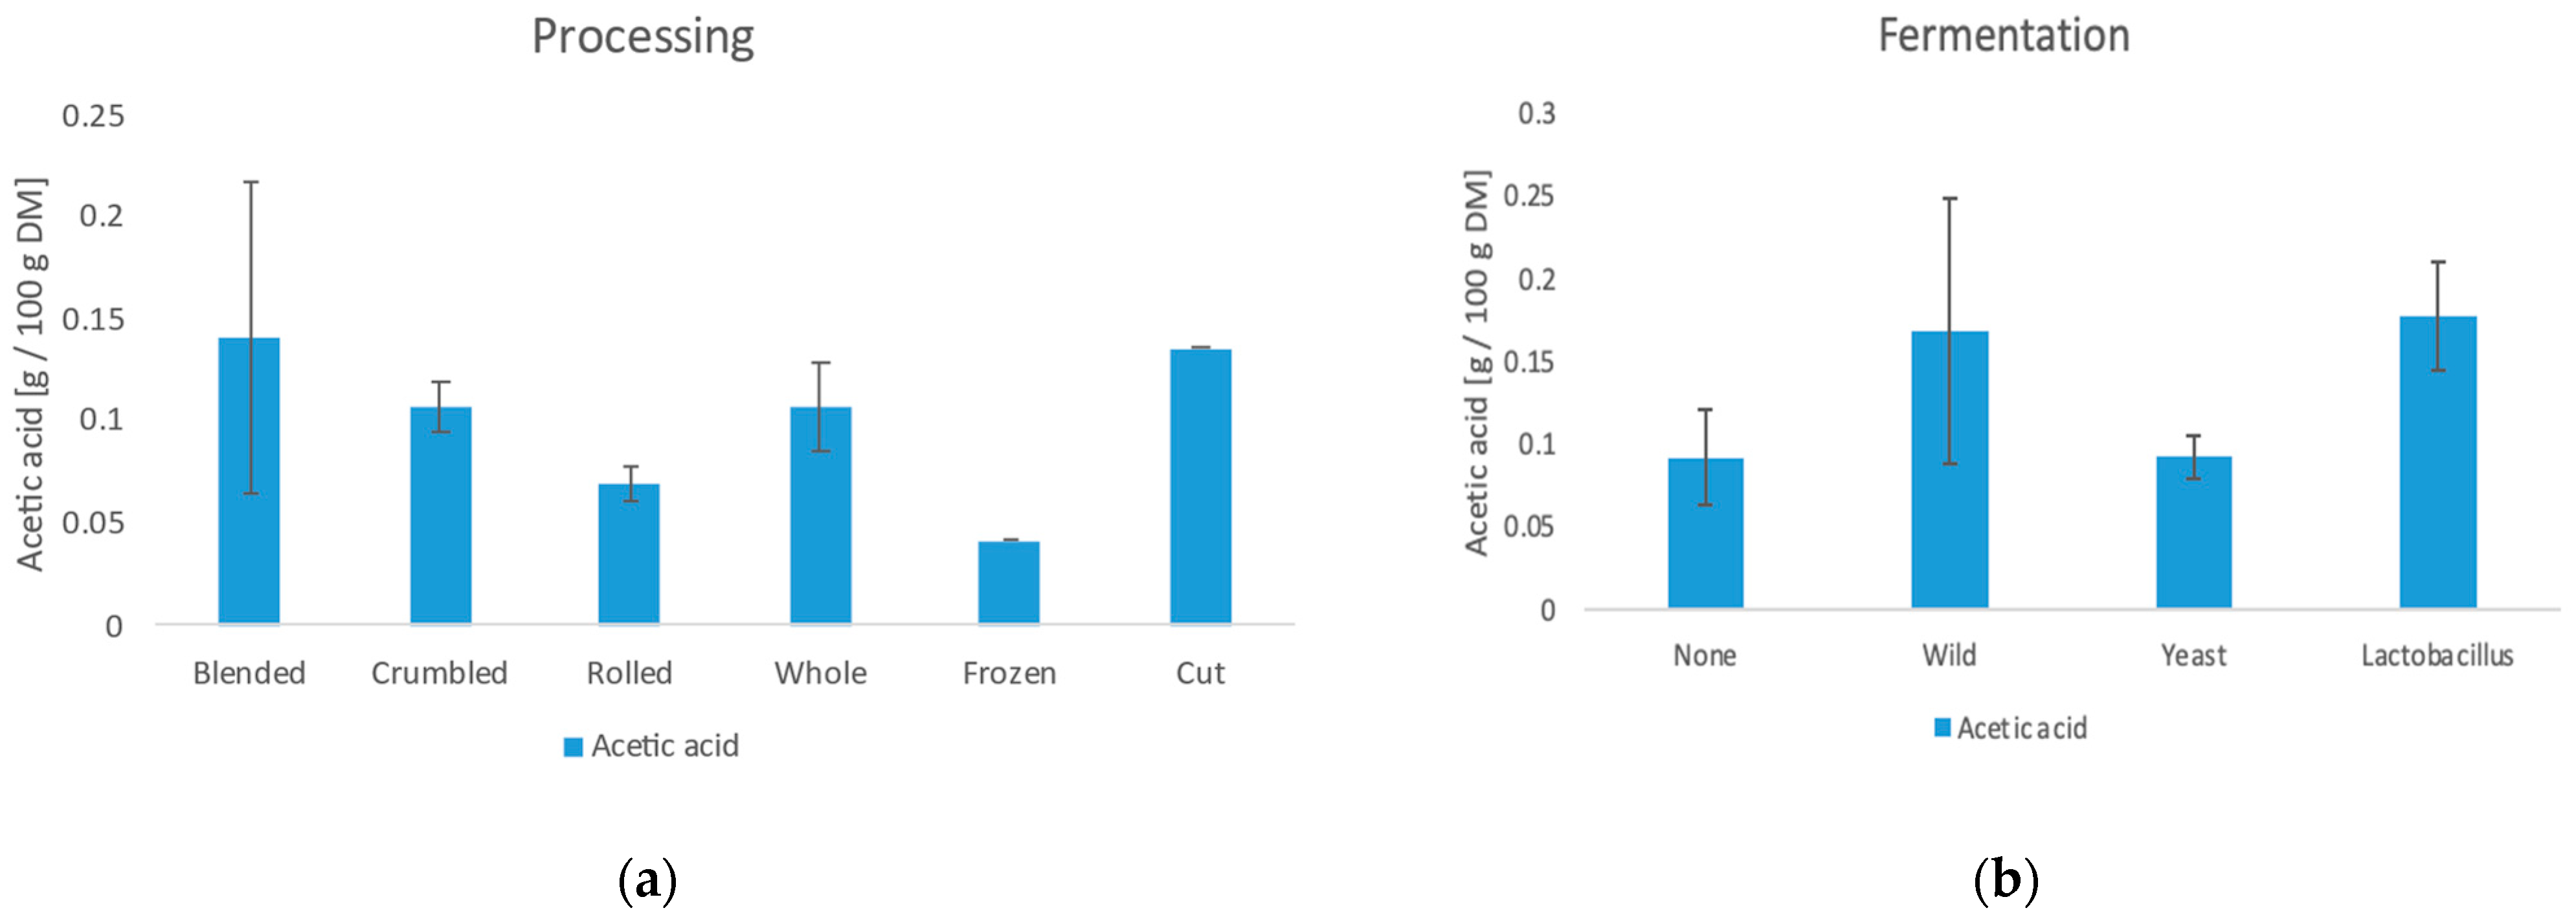
3.6.3. Acetic Acid
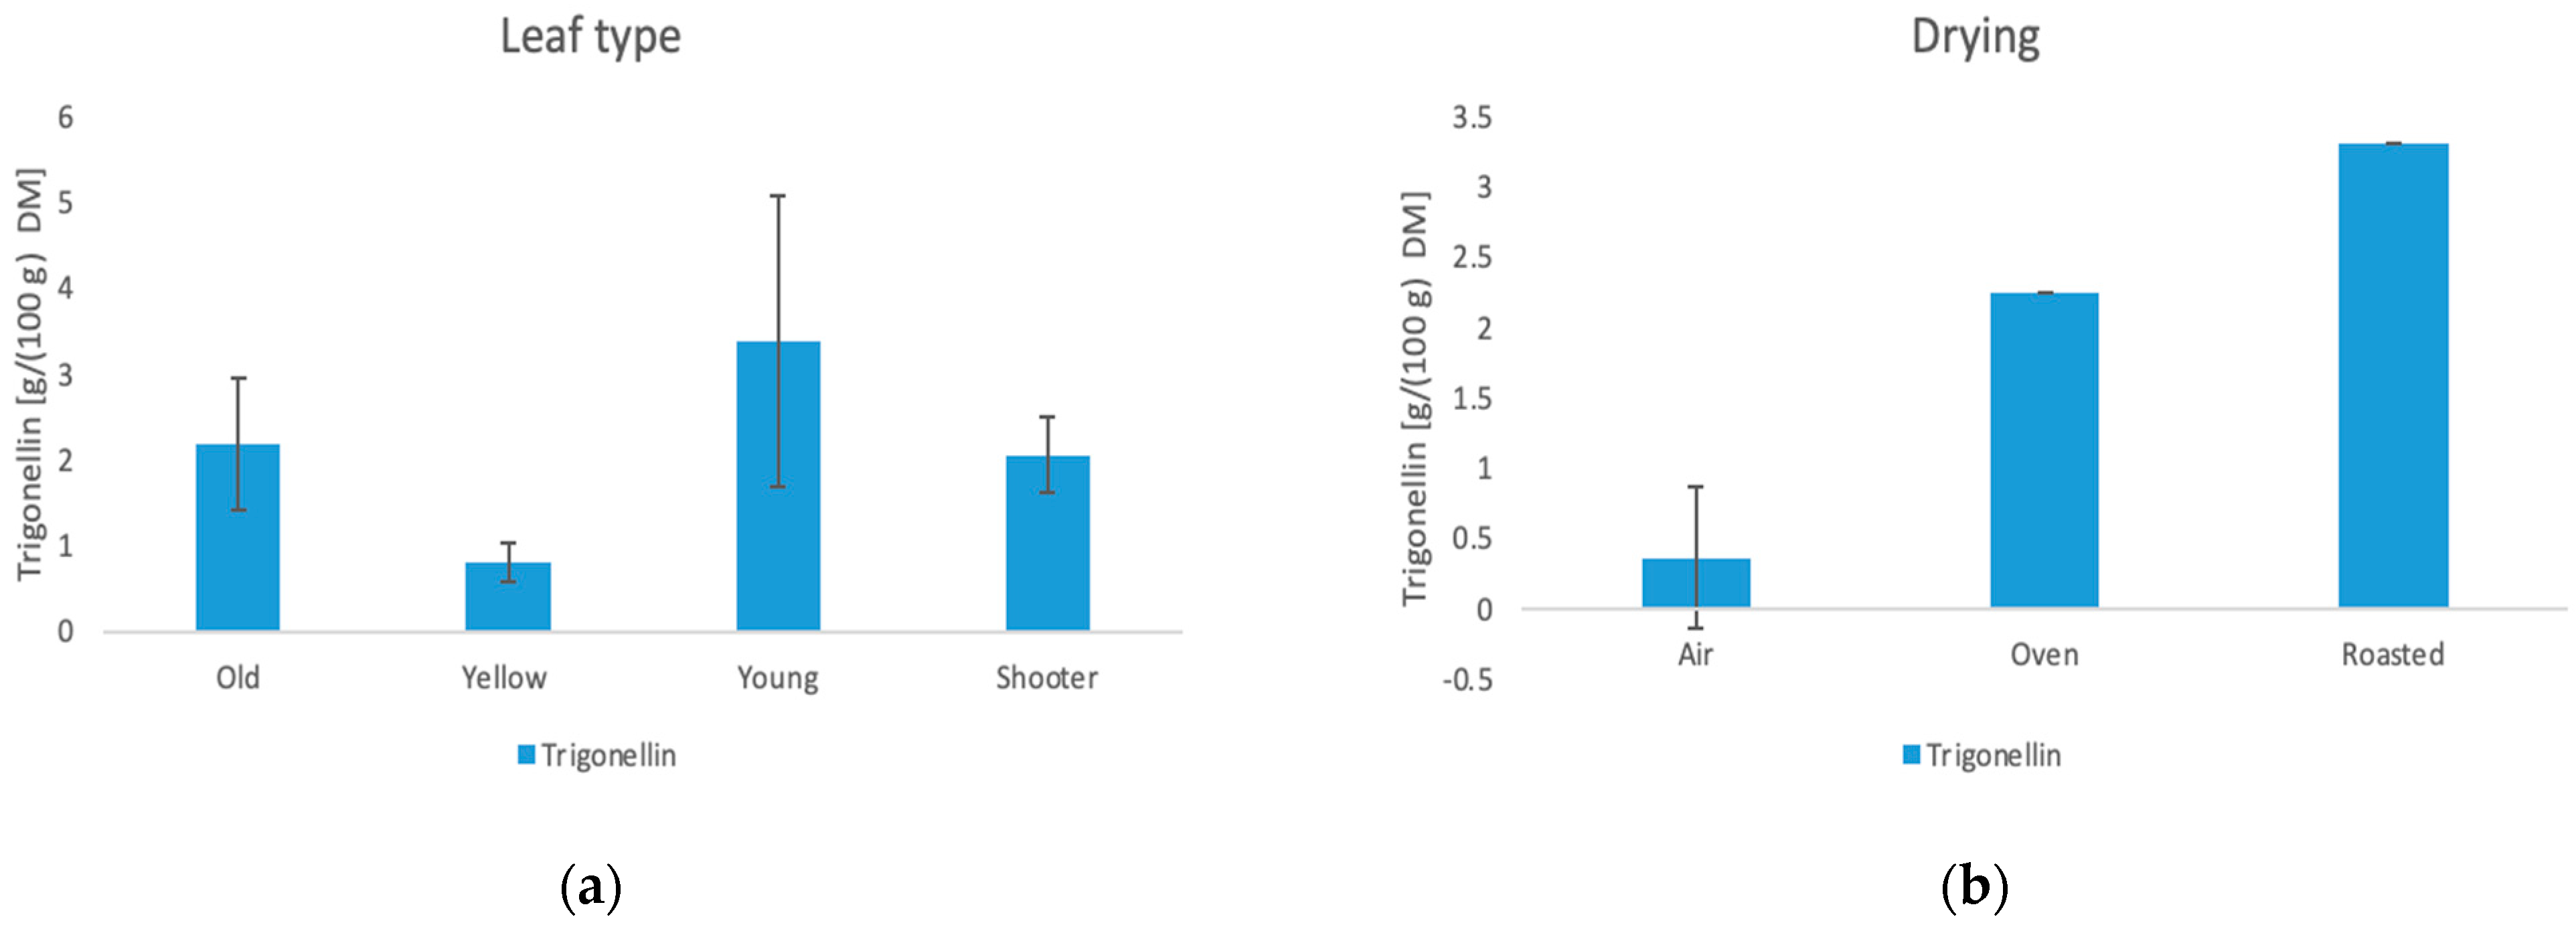
3.6.4. Trigonelline
3.7. Preliminary Sensory Evaluation
3.7.1. Personal Acceptance
3.7.2. Simple Descriptive Test
3.7.3. Profile Test
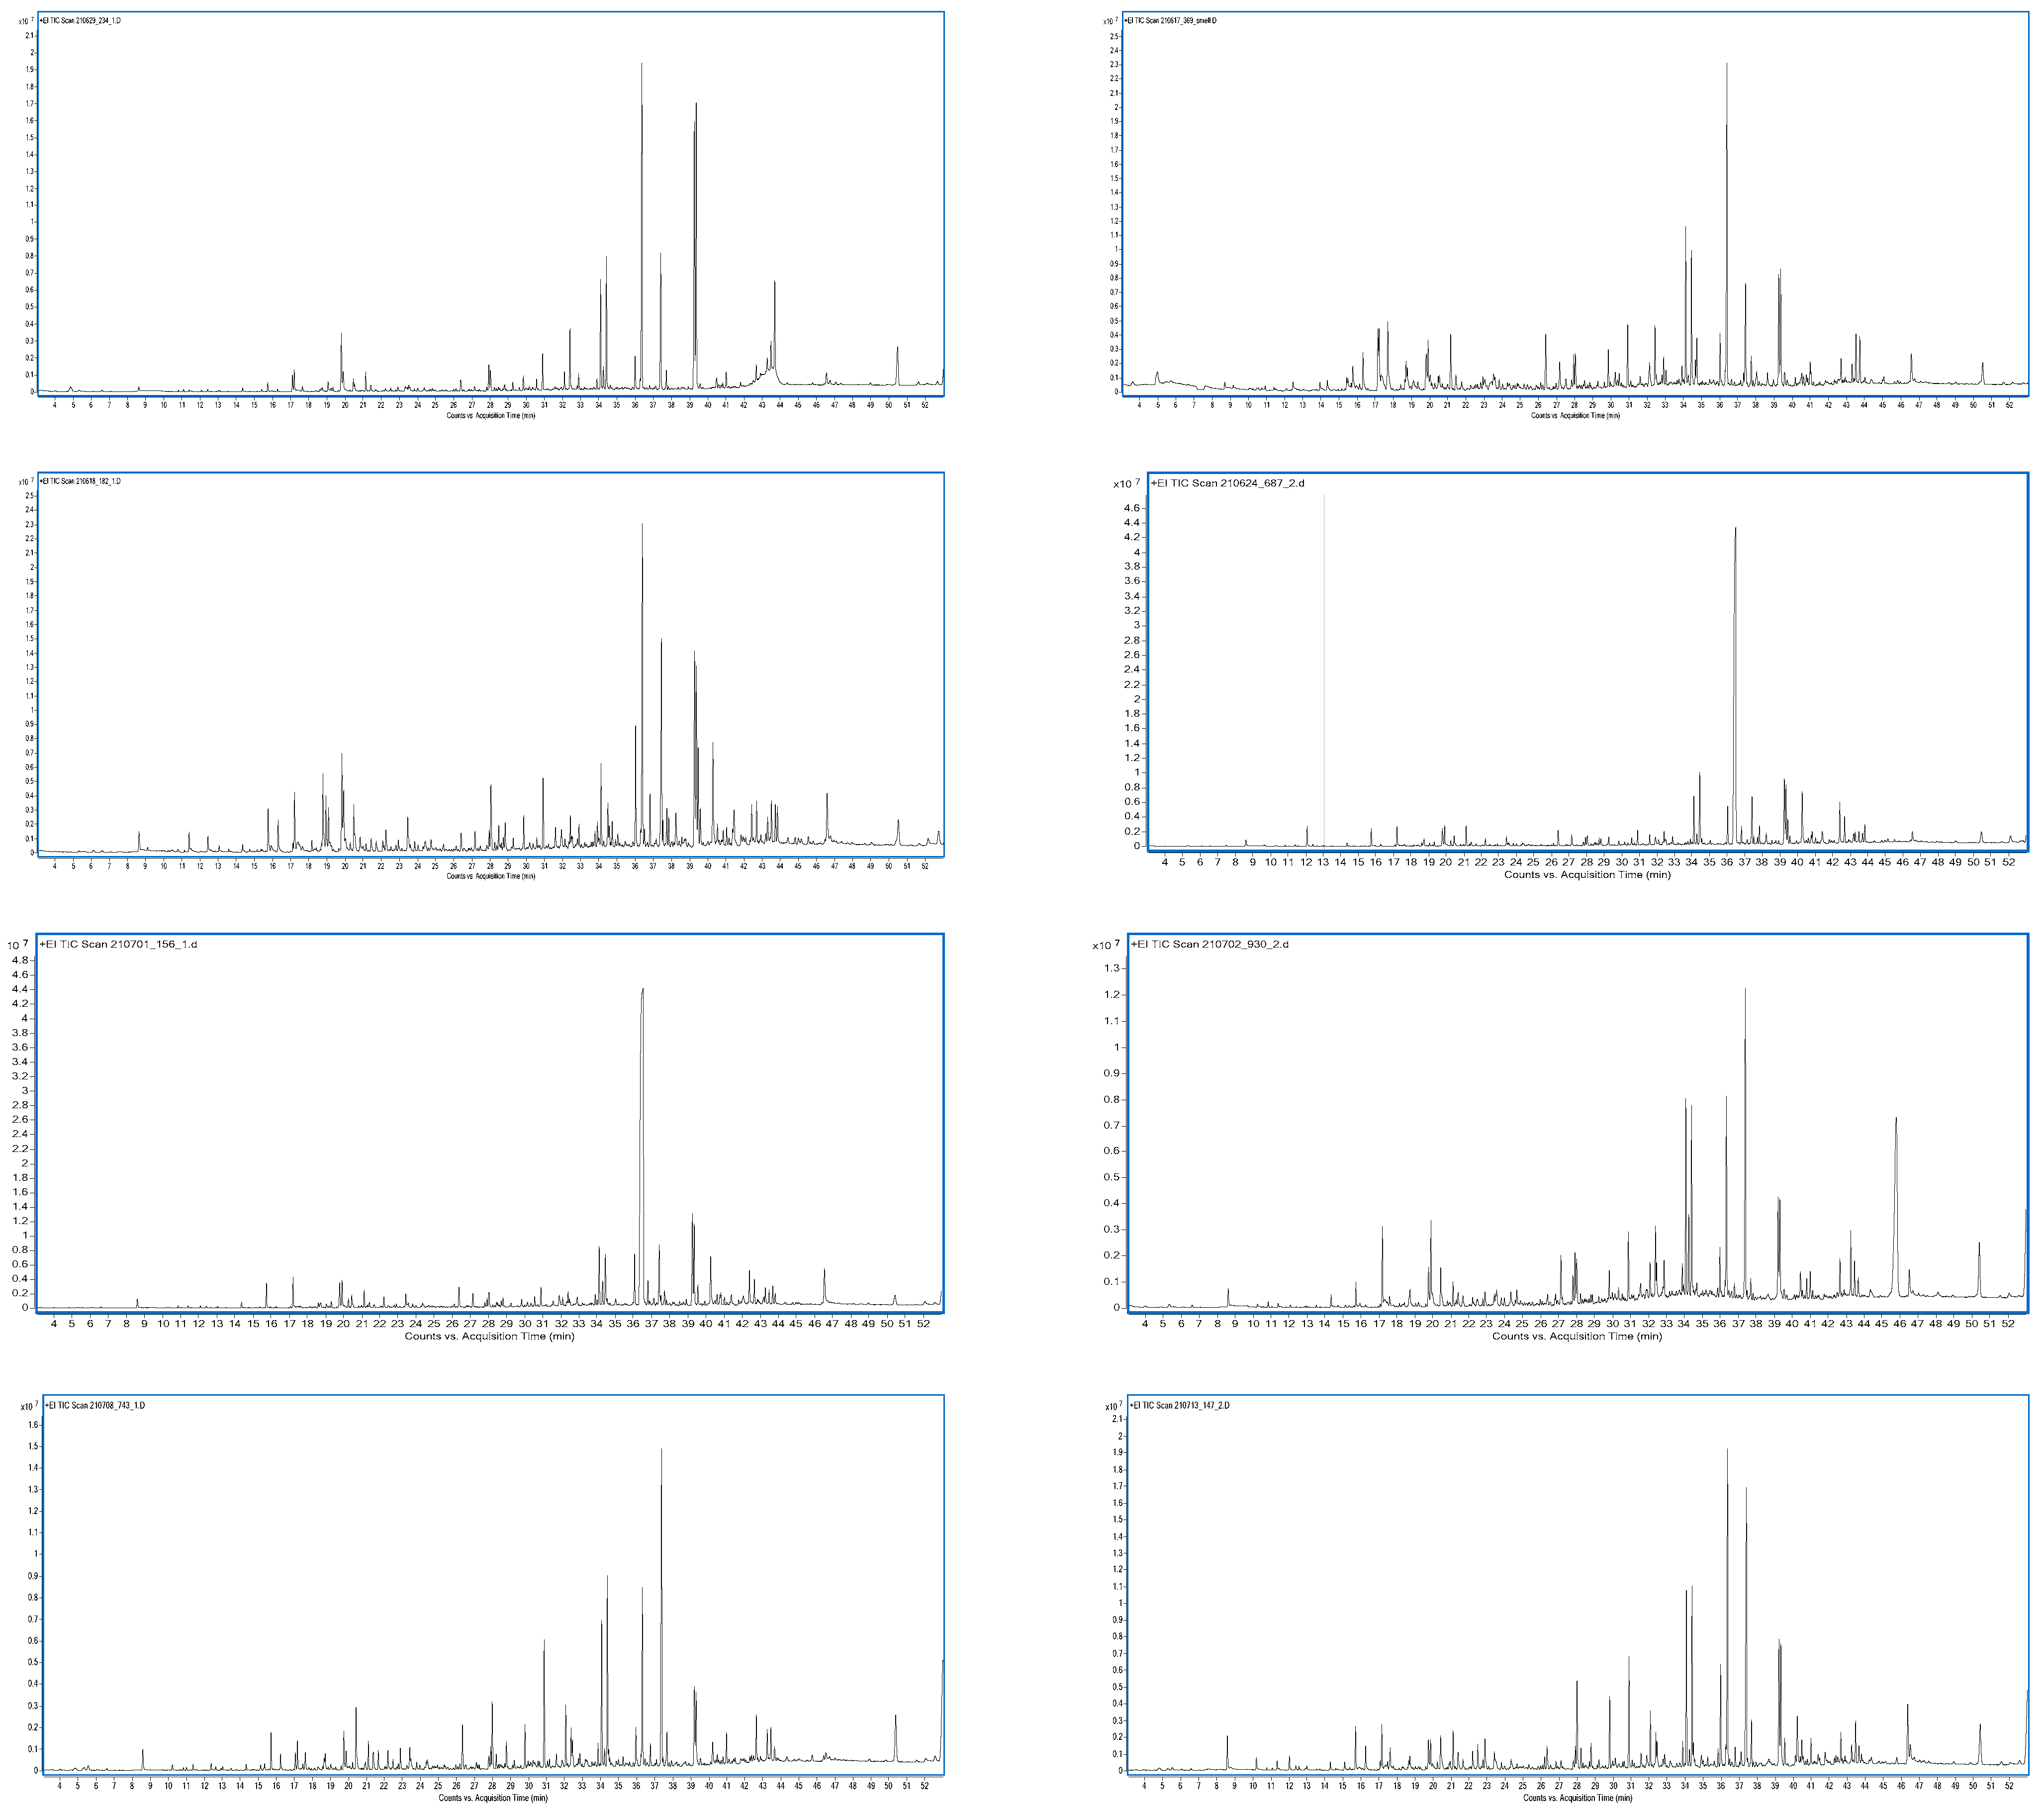
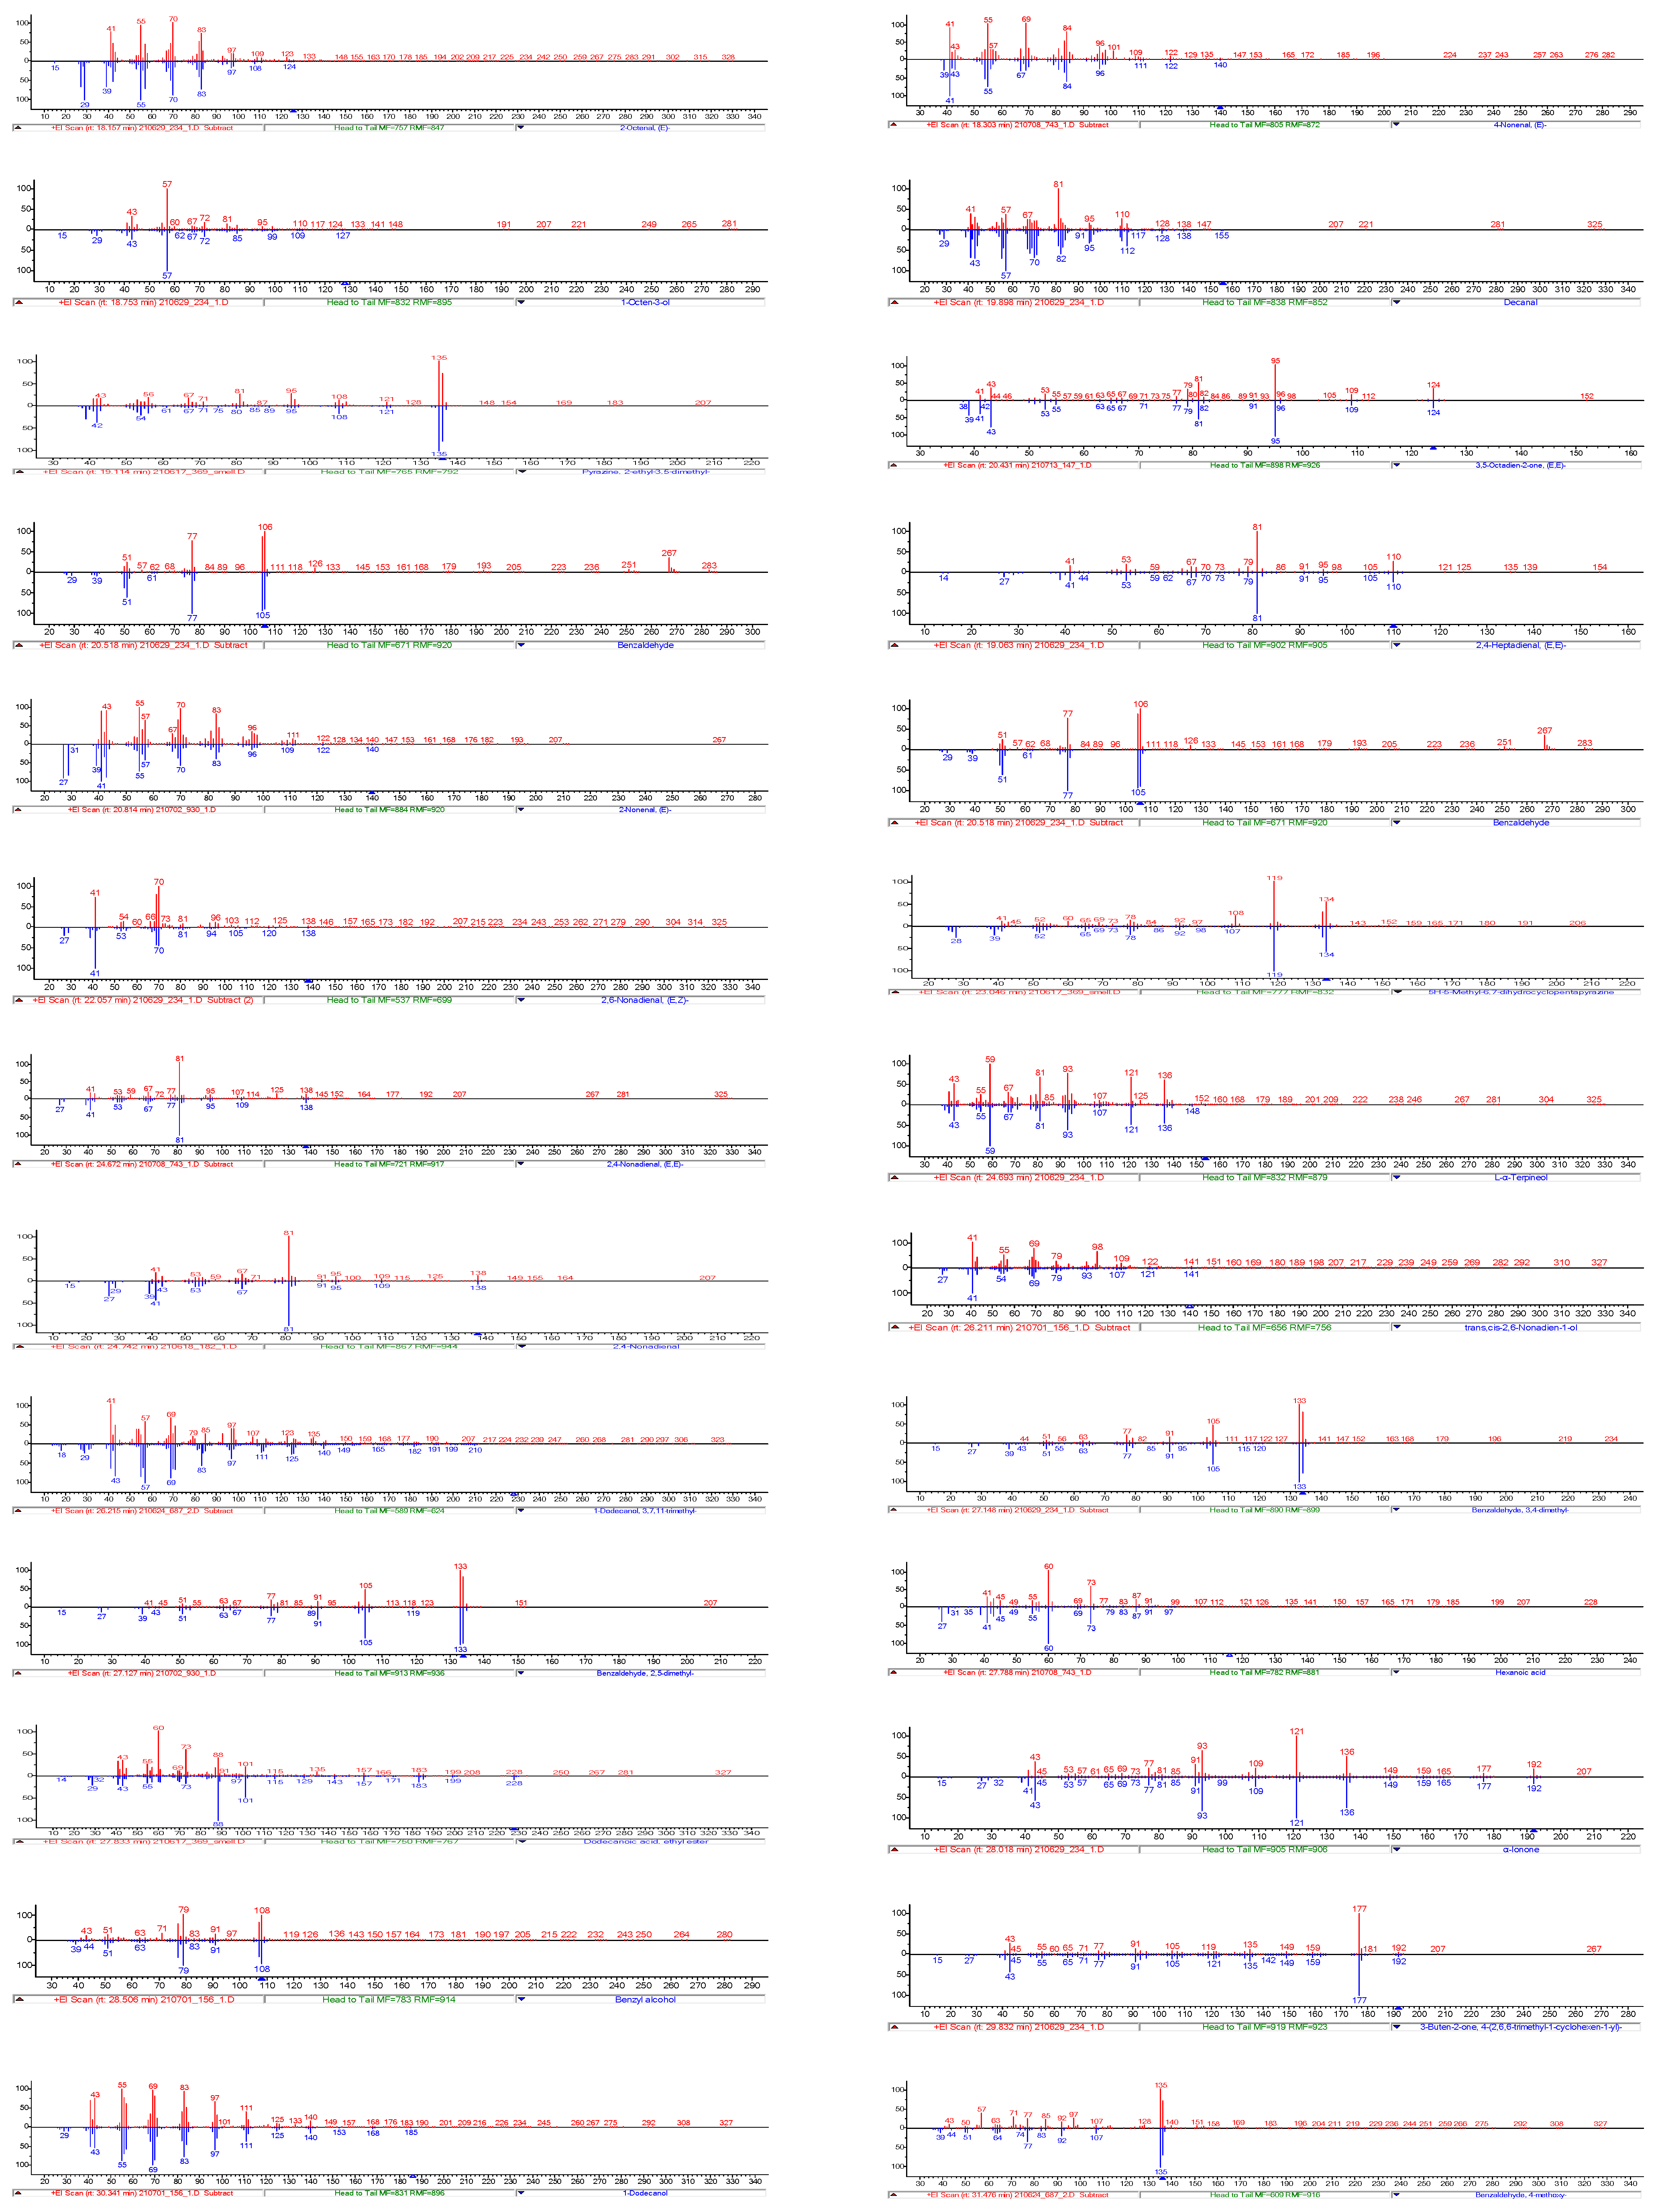
3.8. Aroma Analysis via DI-SBSE-GC-MS-O
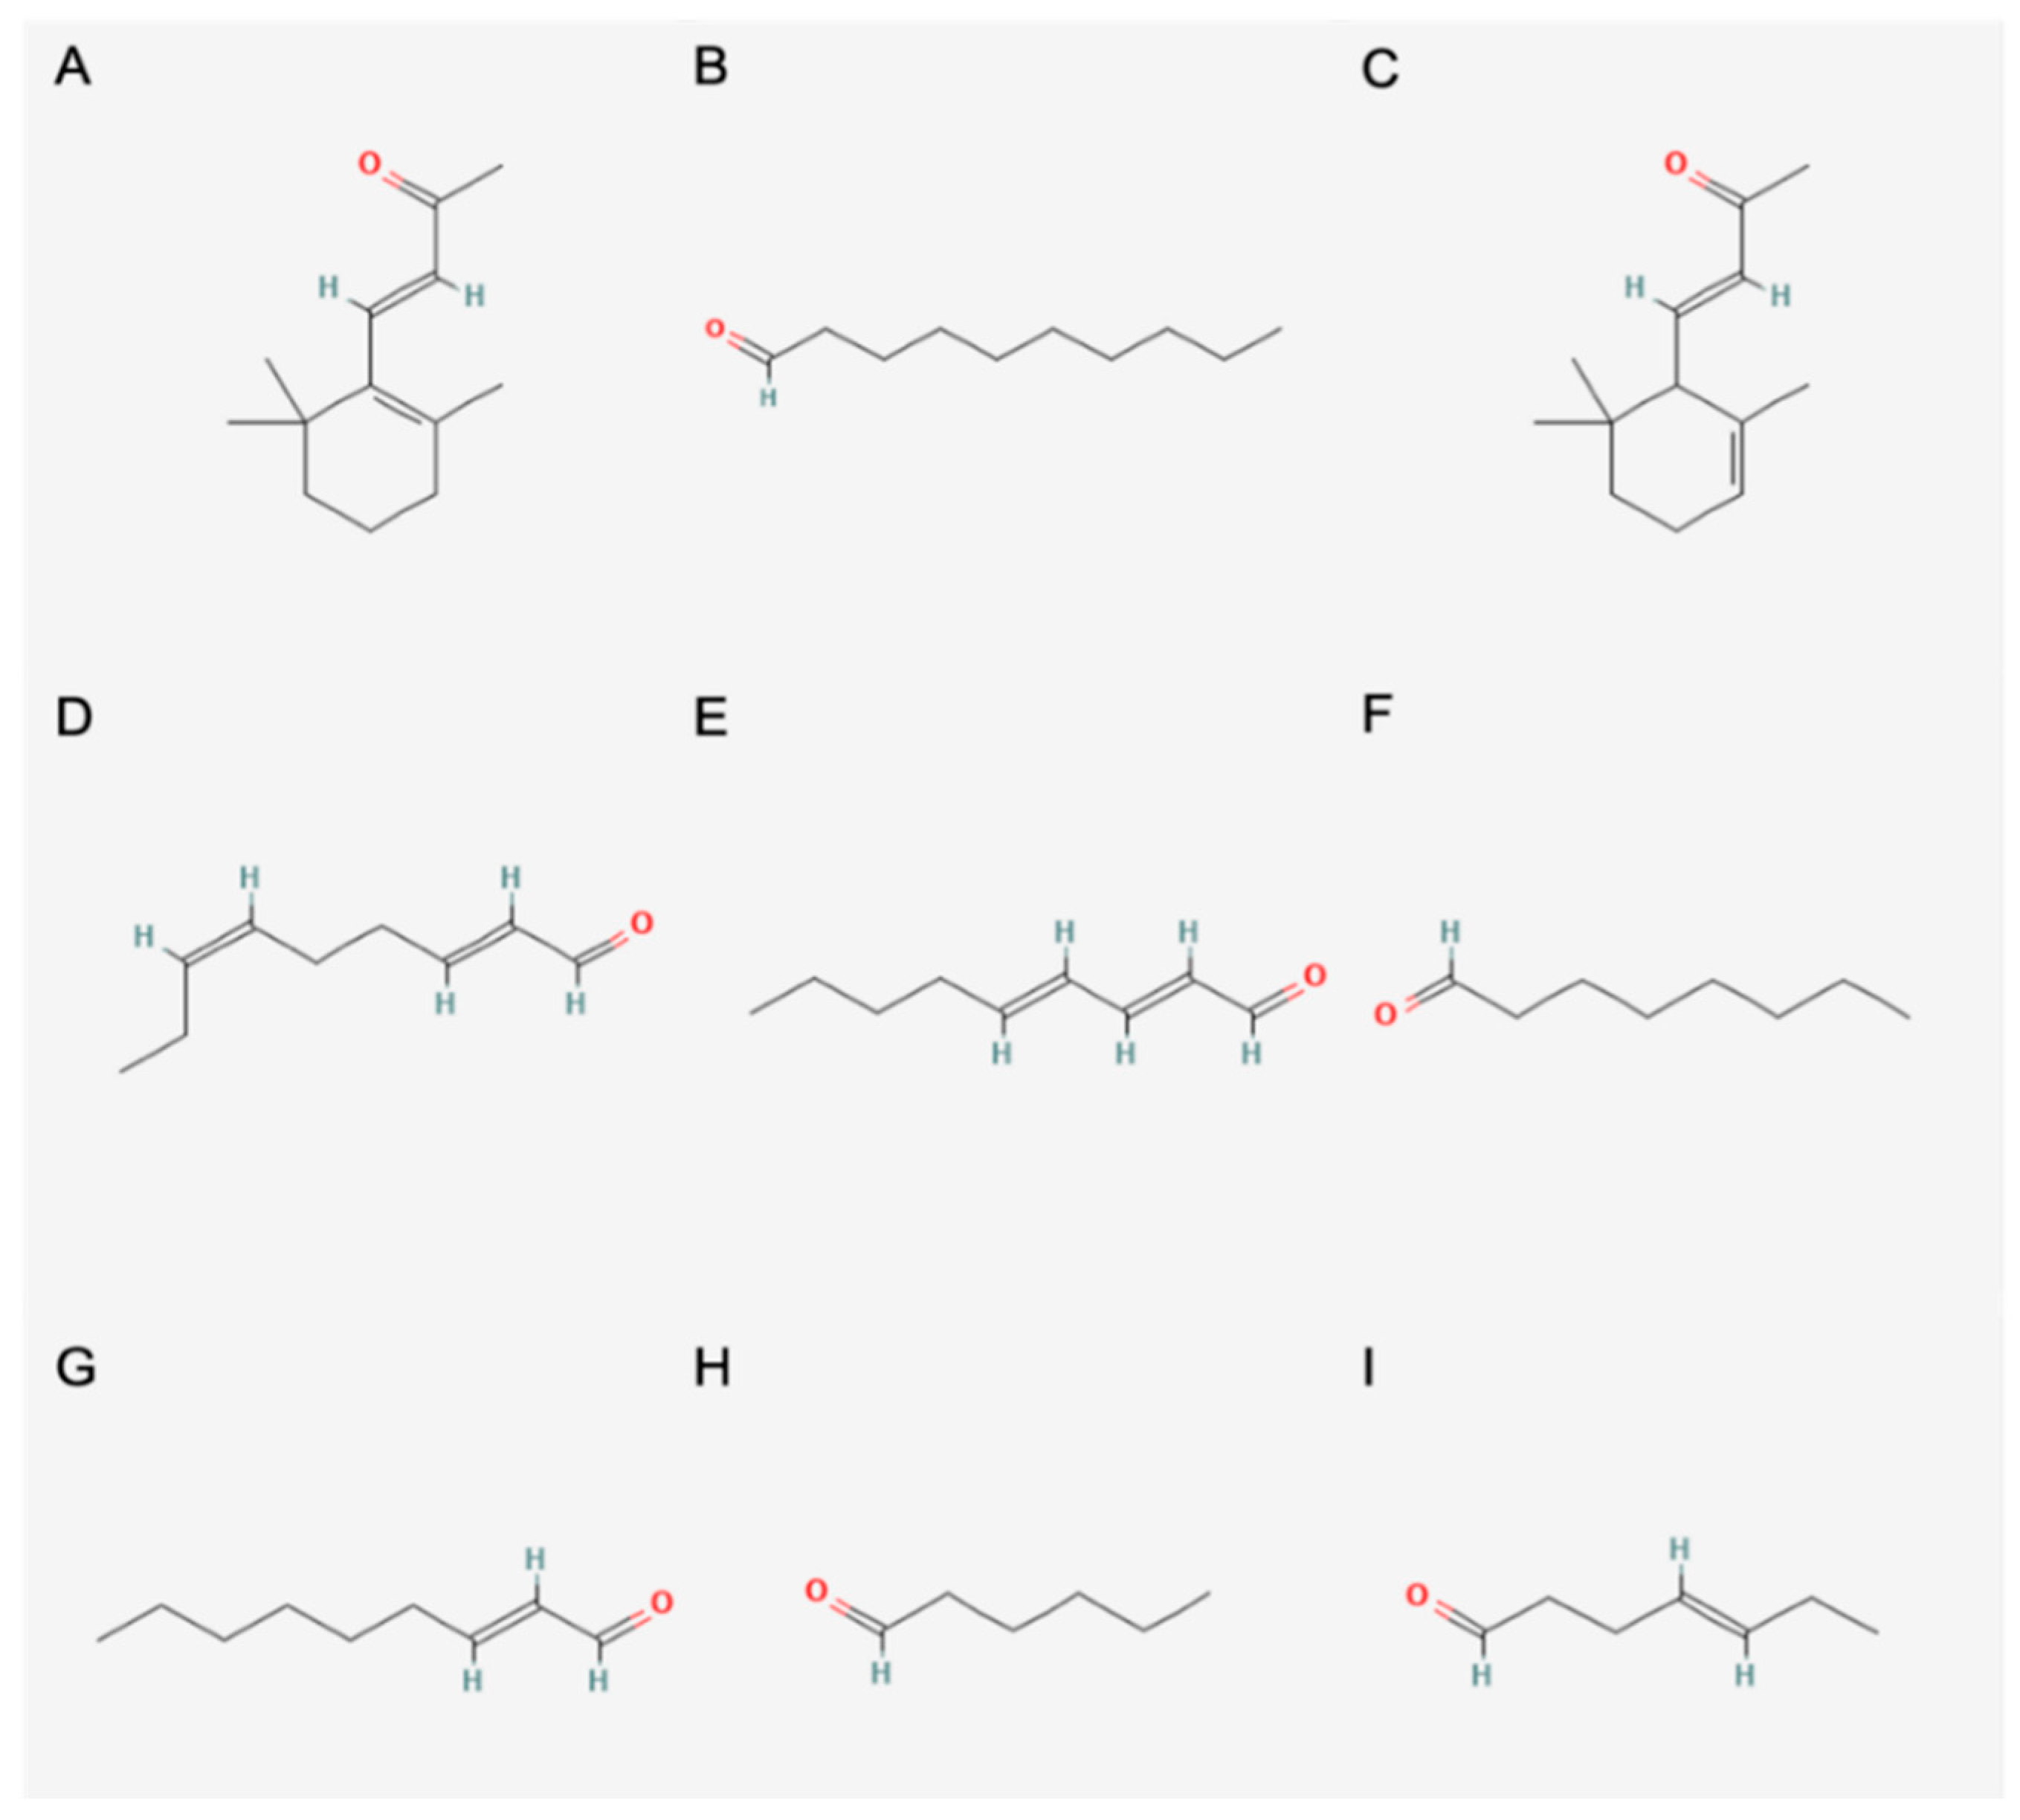
3.8.1. Identification of Odour-Active Compounds
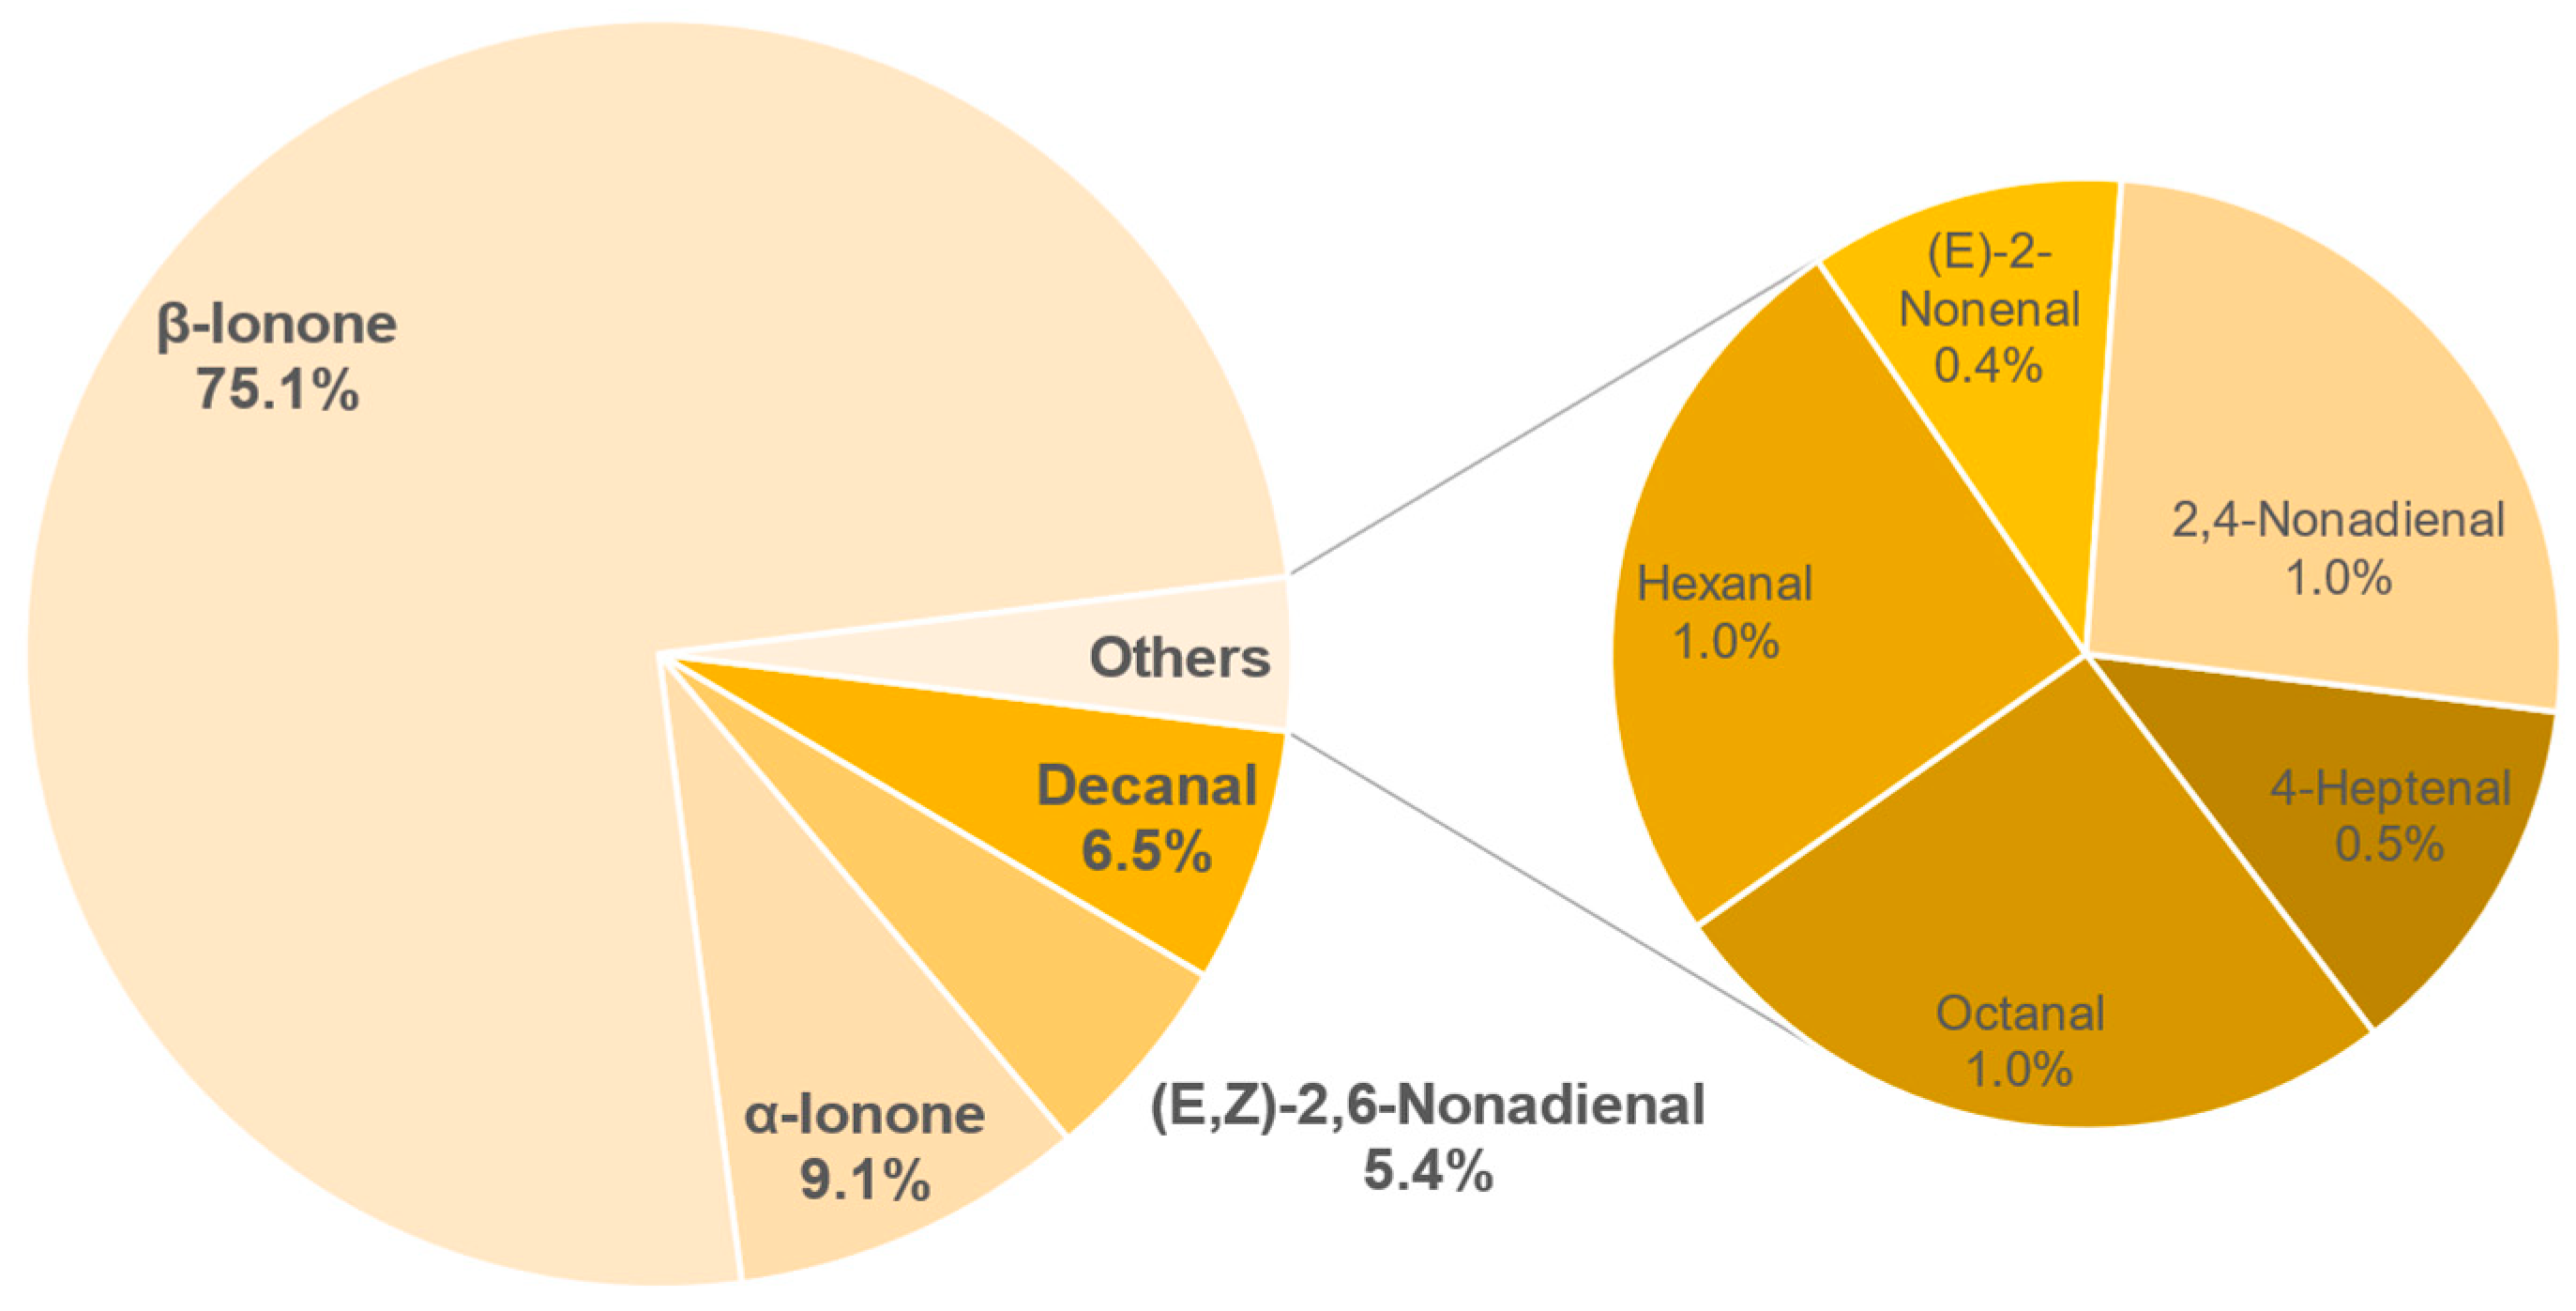
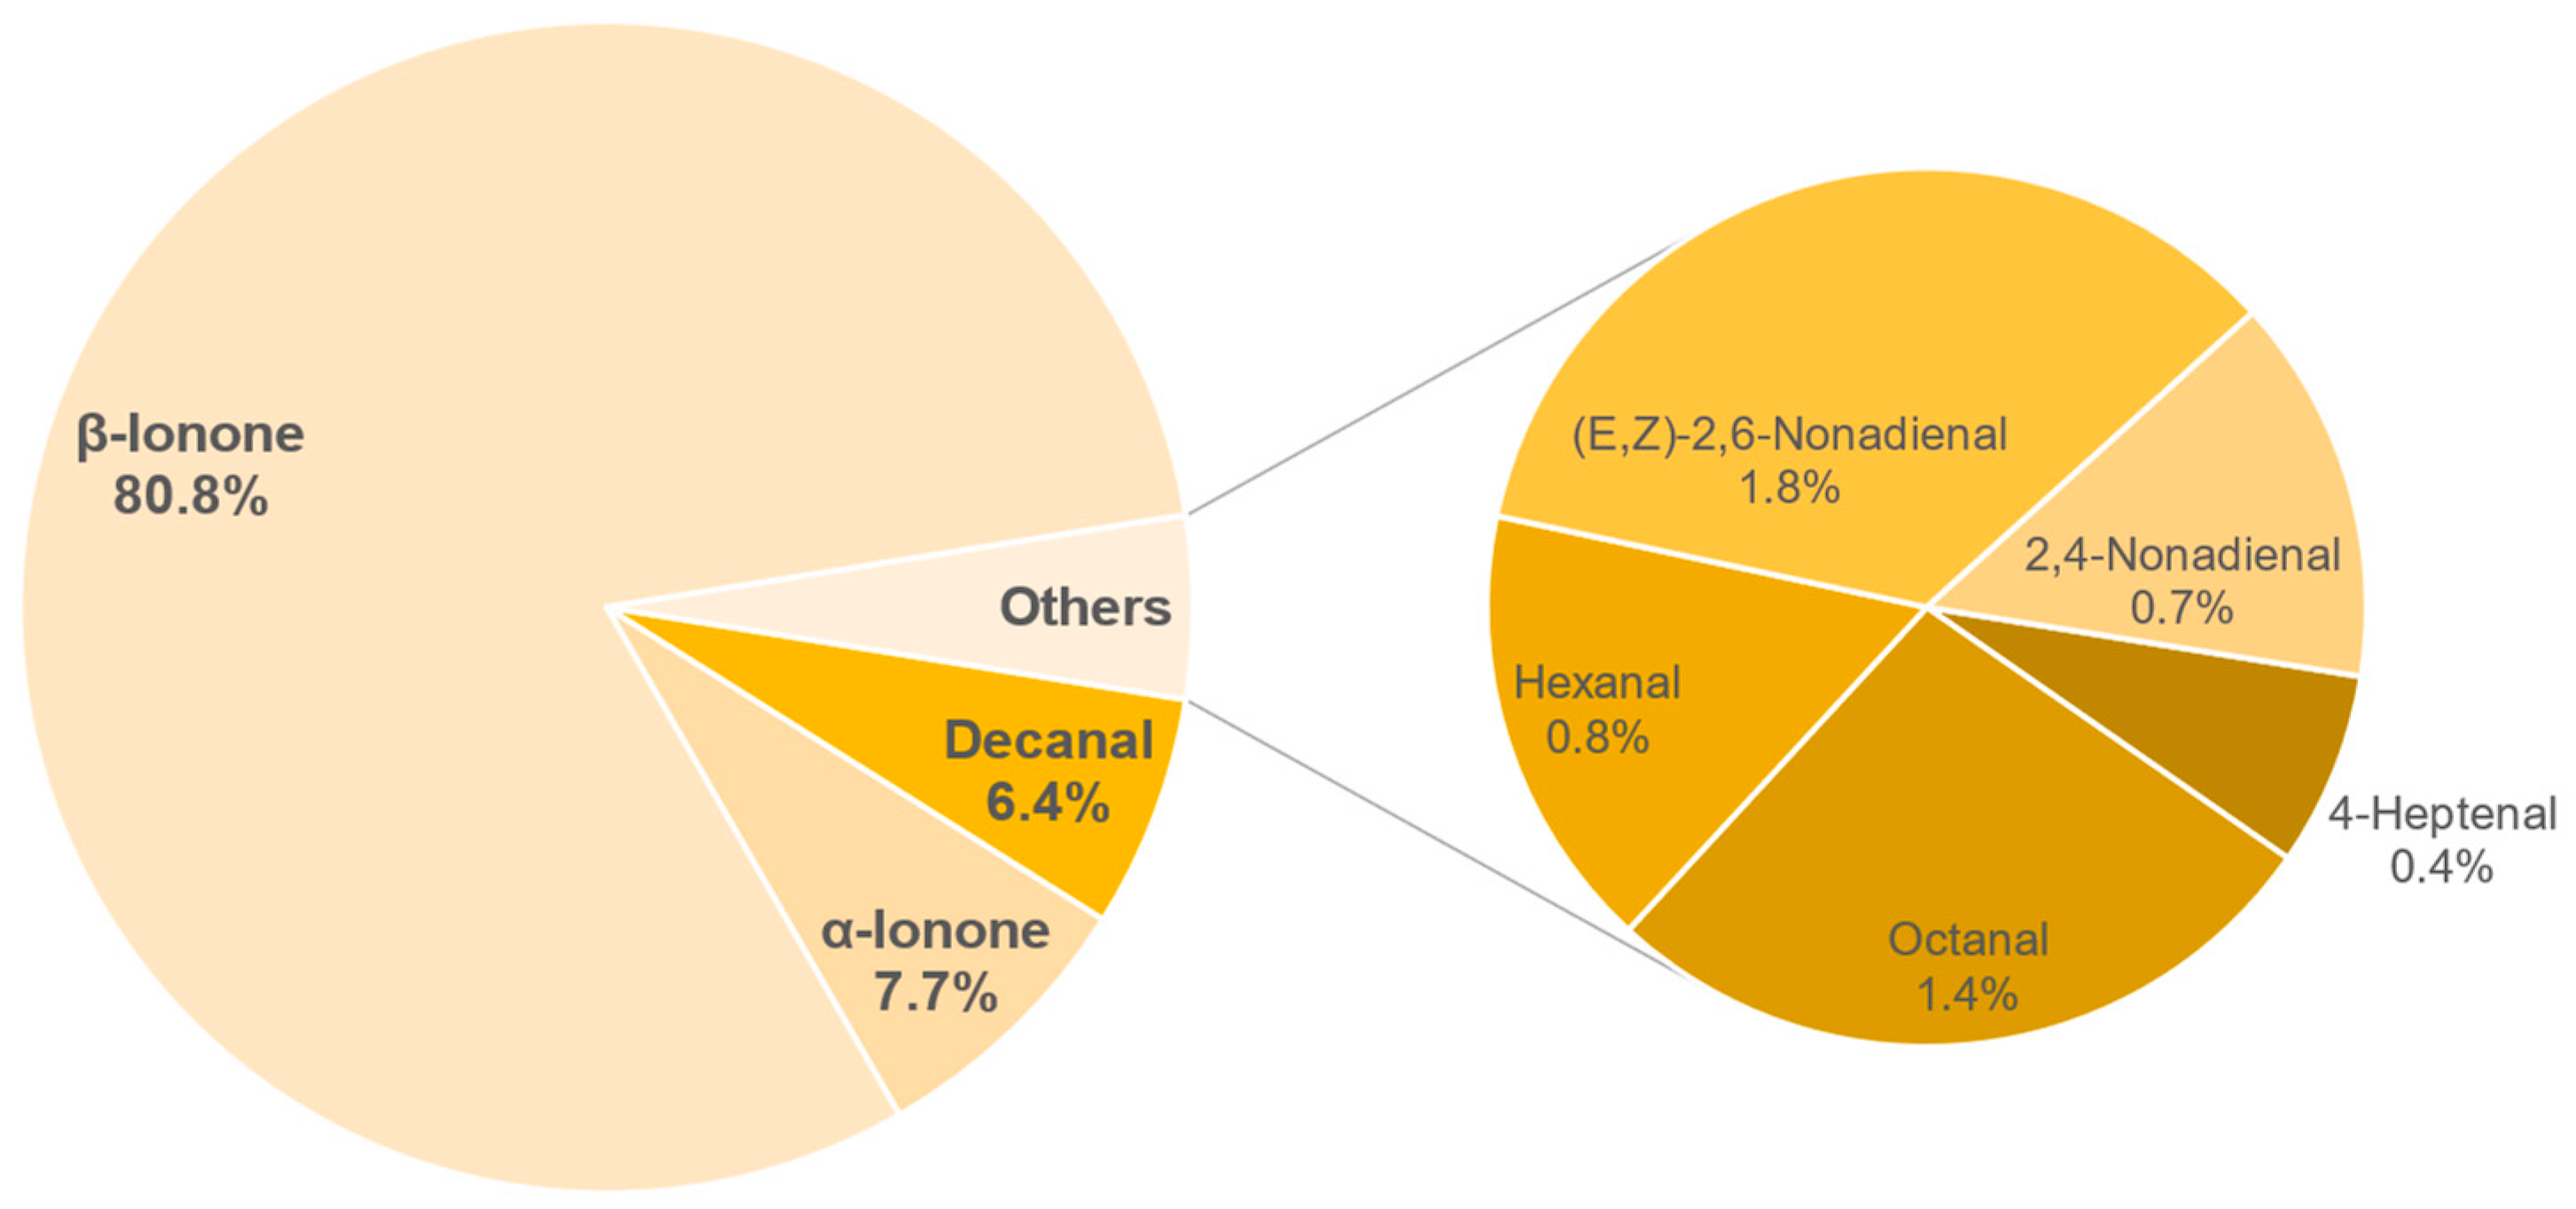
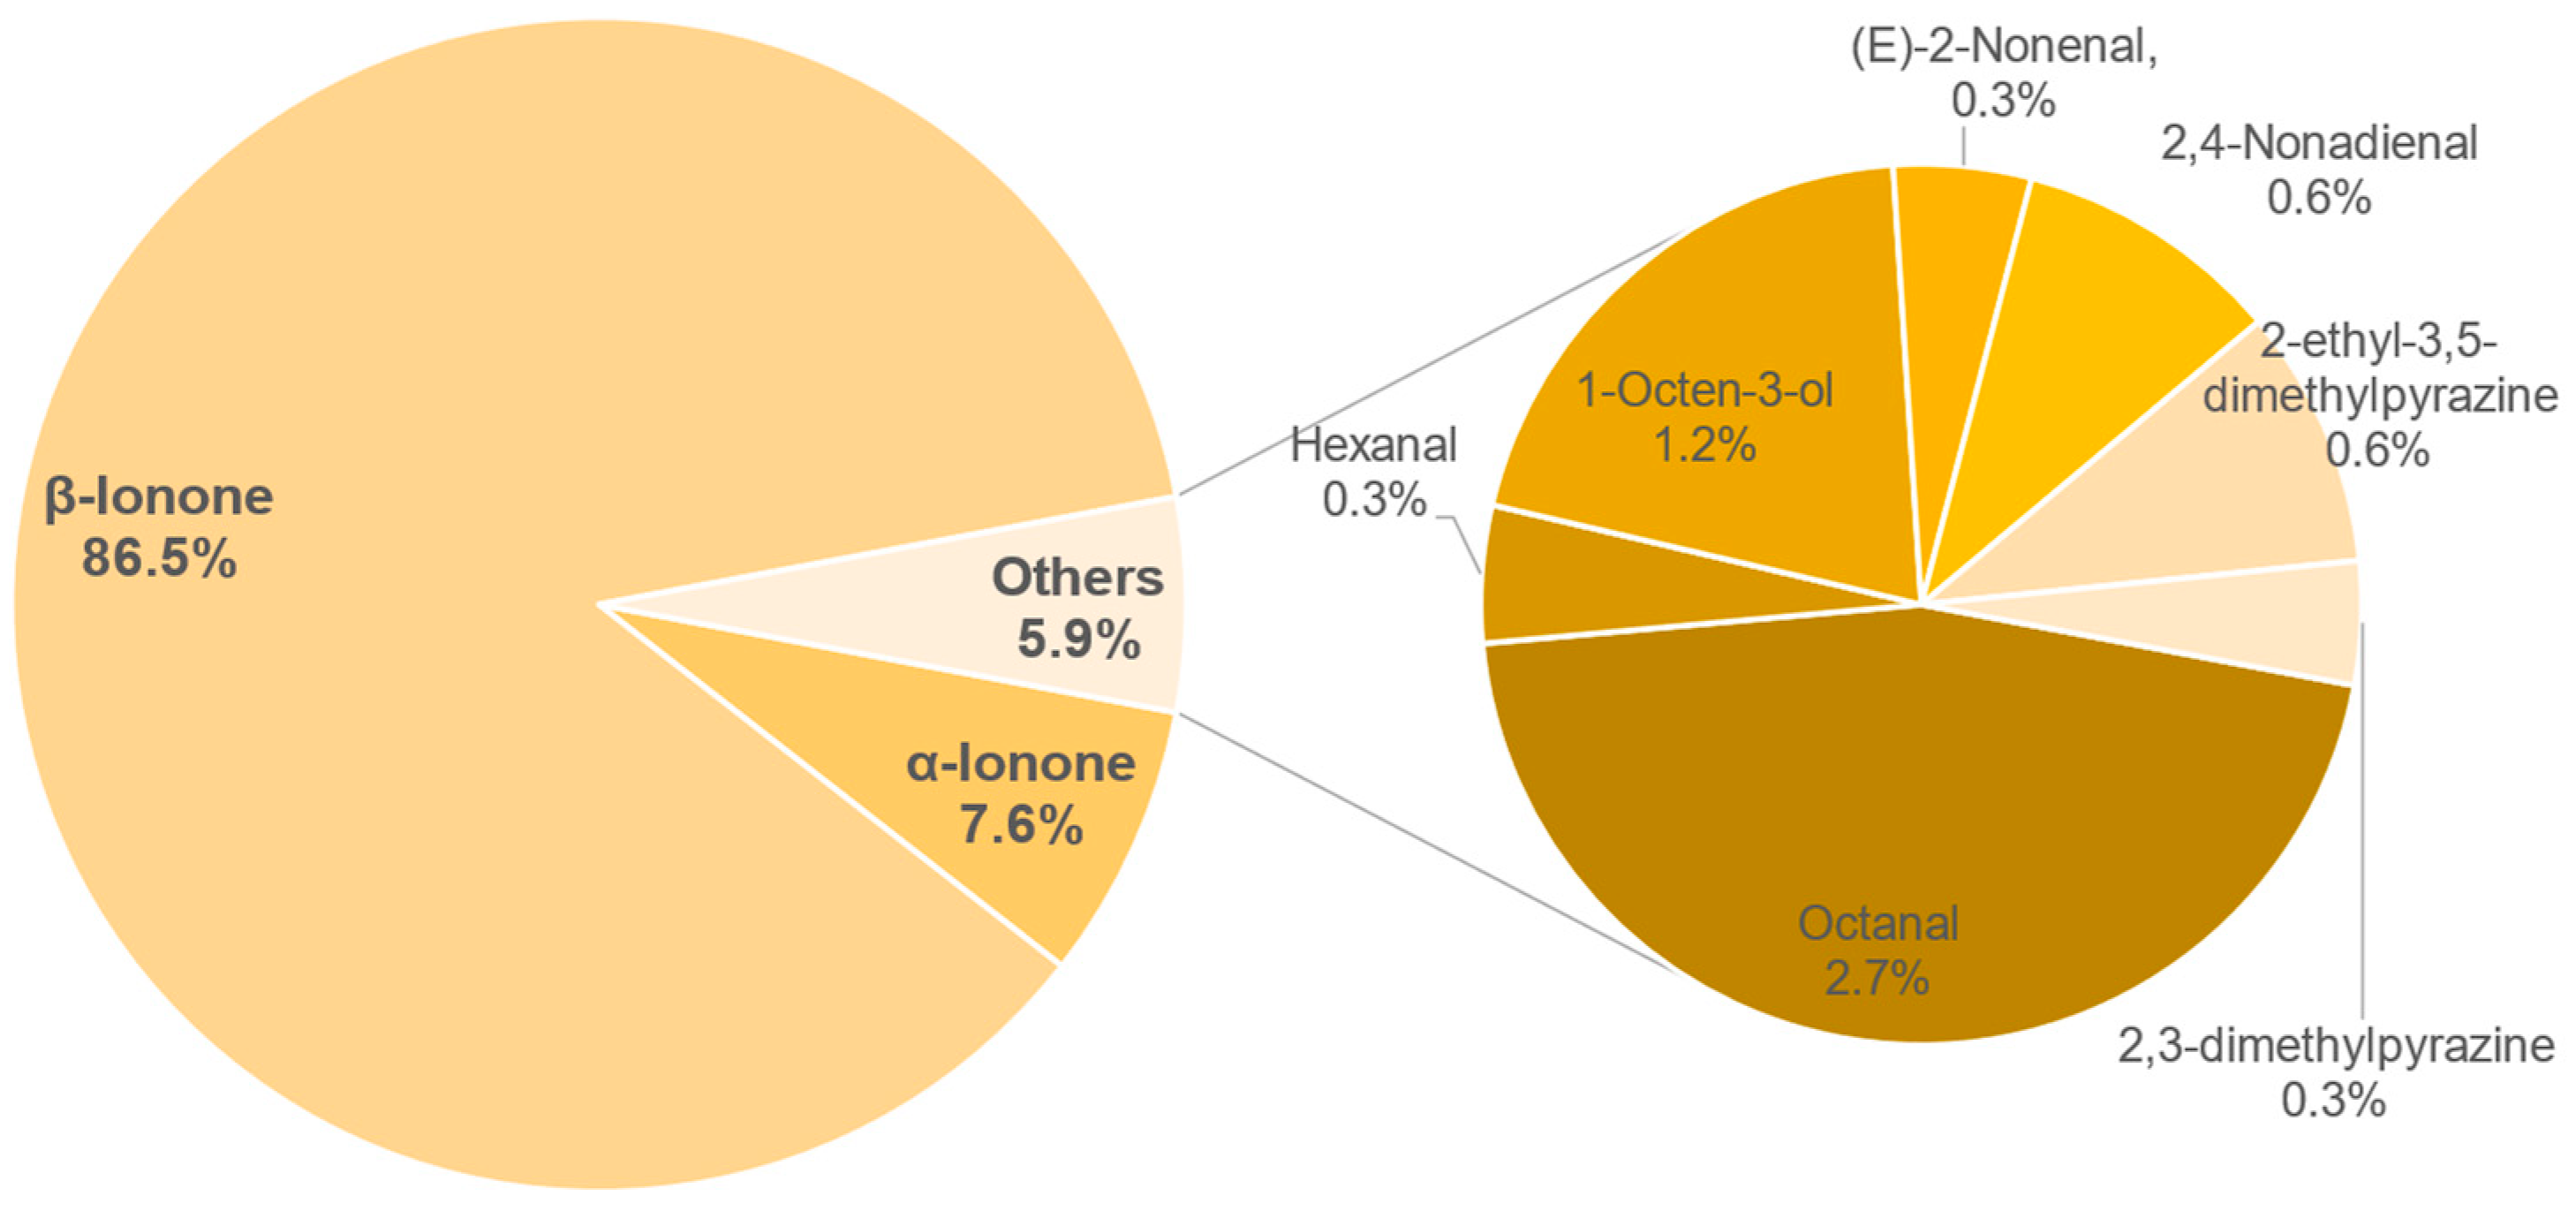
3.8.2. Semi-Quantification and Odour Activity Values
4. Conclusions
Author Contributions
Funding
Institutional Review Board Statement
Informed Consent Statement
Data Availability Statement
Acknowledgments
Conflicts of Interest
Appendix A

| Sample Number | Water (g/100 g) | Essential Oil (mL/100 g) | Ash (g/100 g) |
|---|---|---|---|
| 1 | 7.71 ± 0.15 | 1.08 ± 0.09 | 8.41 ± 0.19 |
| 2 | 9.68 ± 0.36 | 0.79 ± 0.07 | 10.20 ± 0.20 |
| 3 | 8.26 ± 0.13 | 0.46 ± 0.21 | 8.88 ± 0.99 |
| 4 | 10.07 ± 0.11 | 0.66 ± 0.11 | 9.85 ± 0.11 |
| 5 | 9.77 ± 0.24 | 0.52 ± 0.5 | 9.46 ± 1.01 |
| 6 | 7.86 ± 0.03 | 0.47 ± 0.06 | 7.94 ± 0.23 |
| 7 | 9.24 ± 0.23 | 0.76 ± 0.06 | 8.14 ± 0.08 |
| 8 | 5.99 ± 0.13 | 1.52 ± 0.08 | 9.98 ± 0.08 |
| 9 | 6.27 ± 0.11 | 1.28 ± 0.20 | 9.64 ± 0.10 |
| 10 | 7.11 ± 0.26 | 1.16 ± 0.07 | 9.00 ± 0.09 |
| 11 | 6.84 ± 0.14 | 1.20 ± 0.03 | 8.95 ± 0.10 |
| 12 | 8.12 ± 0.24 | 1.04 ± 0.29 | 9.29 ± 0.88 |
| 13 | 7.85 ± 0.22 | 1.31 ± 0.06 | 8.53 ± 0.16 |
| 14 | 8.35 ± 0.13 | 1.25 ± 0.16 | 8.52 ± 0.37 |
| 15 | 5.52 ± 0.26 | 0.00 ± 0.00 | 9.89 ± 0.14 |
| 16 | 17.42 ± 0.04 | 0.30 ± 0.01 | 3.22 ± 0.00 |
| 17 | 6.56 ± 0.12 | 0.02 ± 0.03 | 8.54 ± 0.09 |
| 18 | 6.75 ± 0.13 | 0.39 ± 0.02 | 7.82 ± 0.14 |
| 19 | 8.25 ± 0.30 | 0.00 ± 0.00 | 7.81 ± 0.05 |
| 20 | 5.39 ± 0.04 | 0.37 ± 0.31 | 9.00 ± 0.86 |
| 21 | 5.99 ± 0.1 | 0.01 ± 0.02 | 9.85 ± 0.92 |
| 22 | 6.58 ± 0.06 | 0.09 ± 0.04 | 8.62 ± 0.21 |
| 23 | 3.92 ± 0.06 | 1.48 ± 0.05 | 8.10 ± 0.16 |
| 24 | 6.58 ± 0.02 | 0.30 ± 0.26 | 9.55 ± 0.81 |
| Sample Number | Caffeine (g/100 g DM) | Epigallocatechin Gallate (g/100 g DM) | Total Catechins (g/100 g DM) | Theobromin (g/100 g DM) |
|---|---|---|---|---|
| 1 | 0.740 ± 0.003 | - | 0.306 ± 0.006 | - |
| 2 | 0.565 ± 0.004 | - | 0.299 ± 0.002 | 0.021 ± 0.001 |
| 3 | 0.747 ± 0.010 | - | 0.390 ± 0.023 | - |
| 4 | 0.520 ± 0.001 | - | 0.290 ± 0.002 | 0.015 ± 0.001 |
| 5 | 0.699 ± 0.027 | - | 0.208 ± 0.090 | - |
| 6 | 0.693 ± 0.026 | - | 0.206 ± 0.089 | - |
| 7 | 0.713 ± 0.006 | - | 0.345 ± 0.004 | - |
| 8 | 0.669 ± 0.001 | - | 0.054 ± 0.003 | - |
| 9 | 0.396 ± 0.003 | - | - | - |
| 10 | 0.406 ± 0.003 | - | - | - |
| 11 | 0.444 ± 0.001 | - | - | - |
| 12 | 0.392 ± 0.003 | - | - | - |
| 13 | 0.370 ± 0.001 | - | - | - |
| 14 | 0.368 ± 0.004 | - | - | - |
| 15 | 0.380 ± 0.004 | - | - | - |
| 16 | 0.449 ± 0.001 | - | - | - |
| 17 | 0.462 ± 0.003 | - | - | - |
| 18 | 0.939 ± 0.596 | - | 0.221 ± 0.157 | - |
| 19 | 1.333 ± 0.019 | - | 0.699 ± 0.009 | 0.009 ± 0.003 |
| 20 | 0.381 ± 0.003 | - | 0.045 ± 0.007 | - |
| 21 | 0.761 ± 0.012 | - | 0.092 ± 0.008 | - |
| 22 | 1.000 ± 0.004 | - | - | - |
| 23 | 0.894 ± 0.008 | - | 0.479 ± 0.001 | - |
| 24 | 0.858 ± 0.003 | - | 0.091 ± 0.128 | - |
| Sample Number | Total Polyphenol (g/100 g DM) |
|---|---|
| 1 | 8.28 ± 0.33 |
| 2 | 9.34 ± 0.36 |
| 3 | 7.62 ± 0.26 |
| 4 | 8.31 ± 0.22 |
| 5 | 7.54 ± 0.67 |
| 6 | 3.73 ± 0.28 |
| 7 | 7.15 ± 0.18 |
| 8 | 4.76 ± 0.13 |
| 9 | 0.91 ± 0.12 |
| 10 | 1.68 ± 0.75 |
| 11 | 1.50 ± 0.81 |
| 12 | 2.35 ± 0.66 |
| 13 | 2.04 ± 0.82 |
| 14 | 2.18 ± 0.82 |
| 15 | 0.91 ± 0.08 |
| 16 | 1.08 ± 0.00 |
| 17 | 1.15 ± 0.00 |
| 18 | 7.91 ± 0.77 |
| 19 | 10.36 ± 0.25 |
| 20 | 2.73 ± 0.45 |
| 21 | 0.79 ± 0.11 |
| 22 | - |
| 23 | 5.93 ± 0.27 |
| 24 | 5.08 ± 0.19 |
| Sample | Chlorogenic Acid (g/100 g DM) | Acetic Acid (g/100 g DM) | Lactic Acid (g/100 g DM) | Trigonellin (g/100 g DM) |
|---|---|---|---|---|
| 1 | 2.92 | 0.107 | 0.18 | 2.79 |
| 2 | 2.58 | 0.088 | 0.16 | 0.98 |
| 3 | 2.38 | 0.101 | 0.13 | 2.66 |
| 4 | 2.81 | 0.097 | 0.15 | 1.15 |
| 5 | 3.78 | 0.136 | 0.14 | 2.76 |
| 6 | 1.17 | 0.068 | 0.11 | 1.80 |
| 7 | 3.32 | 0.124 | 0.13 | 2.66 |
| 8 | 1.44 | 0.114 | 0.11 | 2.25 |
| 9 | 0.20 | 0.145 | 8.12 | 1.26 |
| 10 | 0.16 | 0.102 | 0.21 | 1.21 |
| 11 | 0.08 | 0.266 | 0.92 | 1.28 |
| 12 | 0.23 | 0.115 | 0.21 | 0.62 |
| 13 | 0.18 | 0.093 | 0.20 | 0.68 |
| 14 | 0.24 | 0.21 | 1.08 | 0.62 |
| 15 | 0.08 | 0.137 | 2.76 | 1.44 |
| 16 | 0.00 | 0.051 | 0.49 | 1.11 |
| 17 | 0.06 | 0.29 | 2.59 | 1.01 |
| 18 | 9.35 | 0.061 | 0.16 | 4.87 |
| 19 | 6.58 | 0.078 | 0.22 | 4.25 |
| 20 | 2.82 | 0.078 | 0.14 | 2.34 |
| 21 | 0.31 | 0.122 | 0.49 | 2.01 |
| 22 | 0.31 | 0.042 | 0.12 | 3.30 |
| 23 | 6.20 | 0.14 | 0.14 | 3.31 |
| 24 | 3.00 | 0.074 | 0.23 | 2.41 |
| Number | Compound | RI | RI (lit/std) | Odour | Identification | 182 | 687 | 234 | 156 | 930 | 743 | 147 | 369 |
|---|---|---|---|---|---|---|---|---|---|---|---|---|---|
| 1 | Hexanal | 1079 | 1079 | green, grassy | RI,MS,O | X | X | X | X | X | X | X | X |
| 2 | 4-Heptenal | 1242 | 1239 | green | RI,MS,O | X | X | X | X | ||||
| 3 | Octanal | 1285 | 1286 | fruity | RI,MS,O | X | |||||||
| 4 | n.i. | 1298 | - | green | / | X | |||||||
| 5 | 1-Hydroxy-2-propanone a | 1307 | 1305 | sweetish | RI,O | X | |||||||
| 6 | 2,3 Dimethylpyrazin | 1347 | 1347 | - | RI,MS | X | |||||||
| 7 | 1-Hexanol a | 1357 | 1357 | sweetish green | RI,O | X | |||||||
| 8 | n.i. | 1370 | - | green/cucumber | / | X | |||||||
| 9 | (E)-2-Octenal | 1430 | 1430 | cucumber | RI,MS,O | X | X | X | |||||
| 10 | (E)-4-Nonenal a | 1435 | 1435 | fruity | RI,O | X | |||||||
| 11 | n.i. | 1449 | - | melon | / | X | |||||||
| 12 | 1-Octen-3-ol | 1453 | 1452 | forest | RI,MS,O | X | |||||||
| 13 | n.i. | 1465 | - | fruity | / | X | |||||||
| 14 | 3-Ethyl-3,5-dimethyl-pyrazine a | 1468 | 1466 | roasty, coffee | RI,O | X | |||||||
| 15 | Decanal | 1502 | 1497 | citrus, floral | RI,MS,O | X | X | X | X | X | X | X | X |
| 16 | 2-Ethyl-3,5-dimethylpyrazine | 1512 | 1512 | - | RI,MS | X | |||||||
| 17 | (E,E)-3,5-Octadien-2-one a | 1519 | 1521 | green, grassy | RI,O | X | |||||||
| 18 | Benzaldehyde | 1523 | 1522 | sweetish fruity | RI,MS,O | X | |||||||
| 19 | n.i. | 1530 | - | green, grassy | / | X | |||||||
| 20 | (E)-2-Nonenal | 1536 | 1537 | citrus like | RI,MS,O | X | |||||||
| 21 | n.i. | 1560 | - | green, grassy | / | X | |||||||
| 22 | n.i. | 1562 | - | green, grassy | / | X | |||||||
| 23 | 2,6-Nonadienal | 1587 | 1586 | cucumber | RI,MS,O | X | X | X | X | X | X | X | X |
| 24 | 5H-5-Methyl-6,7-dihydrocyclopentapyrazine a | 1629 | 1630 | peanut | RI,O | X | |||||||
| 25 | (E,E)-2,4-Nonadienal a | 1699 | 1698 | melon,cucumber | RI,O | X | |||||||
| 26 | α-Terpineol | 1699 | 1699 | citrus like | RI,MS,O | X | X | ||||||
| 27 | n.i. | 1700 | - | citrus like | / | X | X | ||||||
| 28 | 2,4-Nonadienal | 1702 | 1700 | melon,cucumber | RI,MS,O | X | |||||||
| 29 | 2,3-Nonadienal a | 1703 | 1703 | melon,cucumber | RI,O | X | |||||||
| 30 | 4-Ethyl-benzaldehyde a | 1709 | 1711 | fruity | RI,O | X | |||||||
| 31 | n.i. | 1712 | - | pineapple | / | X | |||||||
| 32 | (E,Z)-2,6-Nonadien-1-ol a | 1769 | 1770 | green, cucumber | RI,O | X | X | X | |||||
| 33 | 3,7,11-Trimethyl-1-dodecanol a | 1770 | green | RI,O | X | ||||||||
| 36 | 3,4-Dimethylbenzaldehyde a | 1811 | 1790 | sweetish, green | RI,O | X | X | X | X | X | |||
| 37 | 2,5-Dimethylbenzaldehyde a | 1812 | 1812 | sweetish, green | RI,O | X | |||||||
| 38 | Hexanoic acid a | 1844 | 1844 | fatty | RI,O | X | |||||||
| 39 | Dodecanoic acid, ethyl ester a | 1846 | 1846 | sweetish, floral | RI,O | X | |||||||
| 40 | α-Ionone | 1857 | 1855 | sweetish, floral | RI,MS,O | X | X | X | X | X | X | X | X |
| 41 | n.i. | 1874 | - | green | / | X | |||||||
| 42 | Benzyl alcohol | 1878 | 1877 | fruity | RI,MS,O | X | |||||||
| 43 | β-Ionone | 1942 | 1943 | honey, flower | RI,MS,O | X | X | X | X | X | X | X | X |
| 44 | 1-Dodecanol | 1969 | 1971 | cocutnut | RI,MS,O | X | |||||||
| 45 | n.i. | 2005 | - | green | / | X | X | X | |||||
| 46 | n.i. | 2007 | - | green | / | X | X | ||||||
| 47 | 4-Methoxybenzaldehyde | 2027 | 2025 | vanilla | RI,MS,O | X | X | X | |||||
| 48 | n.i. | 2034 | - | cocutnut | RI,MS,O | X | |||||||
| 49 | n.i. | 2078 | - | green, cucumber | / | X | X | ||||||
| 50 | n.i. | 2081 | - | green, cucumber | / | X | |||||||
| 51 | 1-Ethylundecylbenzene a | 2092 | 2094 | herbal | RI,O | X | |||||||
| 52 | n.i. | 2094 | - | herbal | / | X | X | ||||||
| 53 | n.i. | 2096 | - | herbal | / | X | X | X | |||||
| 55 | n.i. | 2155 | - | green, cucumber | / | X | X | X | |||||
| 56 | 1-Methyldodecylbenzene a | 2158 | mint | RI,O | X | ||||||||
| 57 | Nonanoic acid | 2168 | 2164 | sweetish green | RI,MS,O | X | X | X | |||||
| 58 | Tetrahydro-6-pentyl-2H-pyran-2-one a | 2201 | 2201 | cocotnut | RI,O | X | |||||||
| 59 | Isopropyl palmitate a | 2242 | 2237 | sweetish | RI,O | X | |||||||
| 60 | n.i. | 2251 | - | citrus like | / | X | |||||||
| 61 | Dihydro-5-pentyl-2(3H)-furanone a | 2264 | 2266 | cocutnut | RI,O | X | X | ||||||
| 62 | 5-Heptyldihydro-2(3H)-furanone a | 2264 | roasty, coffee | RI,O | X | ||||||||
| 63 | γ-Dodecalactone | 2381 | 2379 | fruity | RI,MS,O | X | X | ||||||
| 64 | n.i. | 2397 | - | aquarium | / | X | |||||||
| 65 | (Z)-Dihydro-5(2-octenyl)-2(2H)-furanone a | 2402 | 2390 | green, sweetish | RI,O | X | |||||||
| 66 | n.i. | 2402 | - | green, sweetish | / | X | X | X | X | ||||
| 67 | Indole | 2449 | 2443 | Nutty | RI,MS,O | X | |||||||
| 68 | n.i. | 2471 | - | Stable | / | X |
| Compound | Concentration in µg/L | OAV |
|---|---|---|
| β-Ionone | 3.44 ± 0.33 | 491 |
| (E,Z)-2,6-Nonadienal | 2.56 ± 0.36 | 256 |
| α-Ionone | 3.01 ± 0.59 | 100 |
| Octanal | 12.87 ± 0.93 | 18 |
| Decanal | 1.69 ± 0.15 | 17 |
| 4-Heptenal | 7.15 ± 1.22 | 9 |
| Hexanal | 28.4 ± 4.19 | 6 |
| (E)-2-Nonenal | 0.22 ± 0.02 | 3 |
| 1-Dodecanol | 0.33 ± 0.09 | <1 |
| 3-Hexen-1-ol | 28.91 ± 3.76 | <1 |
| α-Terpineol | 0.76 ± 0.08 | <1 |
| 1-Dodecanol | 0.3 ± 0.03 | <1 |
| (E)-2-Octenal | 1.78 ± 0.19 | <1 |
| Nonanoic acid | 638.8 ± 36.55 | <1 |
| Benzyl alcohol | 147.73 ± 26.28 | <1 |
| (E,E)-2,4-Heptadienal | 101.17 ± 6.95 | <1 |
| γ-Dodecalactone | 2.54 ± 0.43 | <1 |
| Compound | Concentration in g/L | OAV |
|---|---|---|
| β-Ionone | 0.93 ± 0.05 | 132 |
| (E,Z)-2,6-Nonadienal | 0.49 ± 0.06 | 49 |
| α-Ionone | 0.9 ± 0.04 | 30 |
| Decanal | 1.41 ± 0.16 | 14 |
| Octanal | 6.72 ± 1.05 | 10 |
| 2,4-Nonadienal | 0.76 ± 0.13 | 8 |
| Hexanal | 23.46 ± 3.89 | 5 |
| (E)-2-Nonenal | 0.26 ± 0.01 | 3 |
| 4-Heptenal | 2.21 ± 0.37 | 3 |
| 1-Dodecanol | 0.38 ± 0.07 | <1 |
| 3-Hexen-1-ol | 41 ± 8.15 | <1 |
| α-Terpineol | 0.82 ± 0.11 | <1 |
| 1-Dodecanol | 0.13 ± 0.01 | <1 |
| (E)-2-Octenal | 0.39 ± 0.06 | <1 |
| Nonanoic acid | 730.46 ± 13.3 | <1 |
| Benzyl alcohol | 53.87 ± 7.15 | <1 |
| (E,E)-2,4-Heptadienal | 25.07 ± 1.45 | <1 |
| γ-Dodecalactone | 2 ± 0.36 | <1 |
| Benzaldehyde | 2.71 ± 0.28 | <1 |
| Compound | Concentration in µg/L | OAV |
|---|---|---|
| β-Ionone | 1.75 ± 0.07 | 249 |
| Decanal | 5.37 ± 0.91 | 54 |
| α-Ionone | 1.39 ± 0.04 | 46 |
| (E,Z)-2,6-Nonadienal | 0.18 ± 0.03 | 18 |
| Octanal | 5.75 ± 0.71 | 8 |
| 2,4-Nonadienal | 0.28 ± 0.03 | 3 |
| 4-Heptenal | 1.97 ± 0.34 | 2 |
| (E)-2-Nonenal | 0.19 ± 0.02 | 2 |
| Hexanal | 9.28 ± 1.6 | 2 |
| 1-Dodecanol | 0.24 ± 0.03 | <1 |
| 1-Octen-3-ol | 0.63 ± 0.1 | <1 |
| 3-Hexen-1-ol | 14.35 ± 2.77 | <1 |
| α-Terpineol | 1.13 ± 0.06 | <1 |
| (E)-2-Octenal | 0.1 ± 0.02 | <1 |
| Nonanoic acid | 1199.03 ± 347.21 | <1 |
| Benzyl alcohol | 33.6 ± 3.78 | <1 |
| γ-Dodecalactone | 0.05 ± 0 | <1 |
| Benzaldehyde | 5.66 ± 0.37 | <1 |
| Indole | 3.32 ± 0.13 | <1 |
| Compound | Concentration in µg/L | OAV |
|---|---|---|
| β-Ionone | 2.14 ± 0.15 | 306 |
| Decanal | 26.83 ± 3.29 | 268 |
| (E,Z)-2,6-Nonadienal | 0.78 ± 0.21 | 78 |
| α-Ionone | 2.13 ± 0.06 | 71 |
| Octanal | 15.84 ± 2.13 | 23 |
| 2,4-Nonadienal | 1.01 ± 0.01 | 11 |
| (E)-2-Nonenal | 0.74 ± 0.04 | 9 |
| Hexanal | 38.98 ± 1.25 | 9 |
| 4-Heptenal | 4.65 ± 0.72 | 6 |
| 1-Dodecanol | 0.73 ± 0.08 | <1 |
| 3-Hexen-1-ol | 40.6 ± 1.07 | <1 |
| α-Terpineol | 1.46 ± 0.15 | <1 |
| (E)-2-Octenal | 0.67 ± 0.08 | <1 |
| Nonanoic acid | 1508.67 ± 310.48 | <1 |
| Benzyl alcohol | 130.01 ± 14.89 | <1 |
| (E,E)-2,4-Heptadienal | 57 ± 4.83 | <1 |
| γ-Dodecalactone | 0.16 ± 0.03 | <1 |
| Benzaldehyde | 6.5 ± 0.76 | <1 |
| Benzaldehyde, 4-methoxy- | 1.83 ± 0.07 | <1 |
| Compound | Concentration in µg/L | OAV |
|---|---|---|
| β-Ionone | 2.95 ± 0.23 | 421 |
| Decanal | 30.06 ± 3.49 | 301 |
| α-Ionone | 1.39 ± 0.07 | 46 |
| (E,Z)-2,6-Nonadienal | 0.31 ± 0.03 | 31 |
| 2,4-Nonadienal | 1.66 ± 0.06 | 18 |
| Octanal | 12.37 ± 1.9 | 18 |
| (E)-2-Nonenal | 0.86 ± 0.12 | 11 |
| Hexanal | 36.85 ± 3.52 | 8 |
| 4-Heptenal | 0.81 ± 0.06 | 1 |
| 1-Dodecanol | 0.96 ± 0.09 | <1 |
| 3-Hexen-1-ol | 57.73 ± 10.8 | <1 |
| α-Terpineol | 6.01 ± 0.84 | <1 |
| (E)-2-Octenal | 0.37 ± 0.06 | <1 |
| Nonanoic acid | 1462.18 ± 228.82 | <1 |
| Benzyl alcohol | 20.44 ± 0.05 | <1 |
| (E,E)-2,4-Heptadienal | 21.27 ± 1.36 | <1 |
| γ-Dodecalactone | 0.06 ± 0.01 | <1 |
| Benzaldehyde | 3.56 ± 0.31 | <1 |
| Indole | 1.9 ± 0.07 | <1 |
| Compound | Concentration in µg/L | OAV |
|---|---|---|
| β-Ionone | 3.79 ± 0.31 | 541 |
| α-Ionone | 1.96 ± 0.06 | 65 |
| Decanal | 4.7 ± 0.54 | 47 |
| (E,Z)-2,6-Nonadienal | 0.39 ± 0.04 | 39 |
| 2,4-Nonadienal | 0.65 ± 0.06 | 7 |
| Octanal | 5.02 ± 0.19 | 7 |
| Hexanal | 31.71 ± 2.48 | 7 |
| 4-Heptenal | 2.84 ± 0.29 | 4 |
| (E)-2-Nonenal | 0.24 ± 0.03 | 3 |
| 1-Dodecanol | 0.66 ± 0.05 | <1 |
| 1-Octen-3-ol | 0.58 ± 0.11 | <1 |
| 3-Hexen-1-ol | 50.56 ± 6.39 | <1 |
| α-Terpineol | 0.89 ± 0.08 | <1 |
| (E)-2-Octenal | 0.19 ± 0.01 | <1 |
| Nonanoic acid | 949.75 ± 121.15 | <1 |
| Benzyl alcohol | 35.32 ± 3.23 | <1 |
| (E,E)-2,4-Heptadienal | 24.74 ± 1.93 | <1 |
| γ-Dodecalactone | 0.05 ± 0.01 | <1 |
| Benzaldehyde | 6.07 ± 0.93 | <1 |
| Indole | 3.14 ± 0.34 | <1 |
| Compound | Concentration in µg/L | OAV |
|---|---|---|
| β-Ionone | 6.49 ± 0.67 | 927 |
| α-Ionone | 2.66 ± 0.25 | 89 |
| Decanal | 7.38 ± 0.86 | 74 |
| (E,Z)-2,6-Nonadienal | 0.2 ± 0.03 | 20 |
| Octanal | 11 ± 0.89 | 16 |
| Hexanal | 42.82 ± 2.57 | 10 |
| 2,4-Nonadienal | 0.74 ± 0.09 | 8 |
| 4-Heptenal | 3.31 ± 0.07 | 4 |
| 1-Dodecanol | 0.38 ± 0.04 | <1 |
| 1-Octen-3-ol | 0.3 ± 0.05 | <1 |
| 3-Hexen-1-ol | 44.86 ± 5 | <1 |
| α-Terpineol | 1.7 ± 0.24 | <1 |
| (E)-2-Octenal | 0.19 ± 0.02 | <1 |
| Nonanoic acid | 1235.09 ± 11.07 | <1 |
| Benzyl alcohol | 35.18 ± 2.8 | <1 |
| (E,E)-2,4-Heptadienal | 11.5 ± 1.07 | <1 |
| γ-Dodecalactone | 0.05 ± 0 | <1 |
| Benzaldehyde | 5.84 ± 0.68 | <1 |
| Indole | 1.61 ± 0.13 | <1 |
| Benzaldehyde, 4-methoxy- | 0.9 ± 0.15 | <1 |
| Compound | Concentration in µg/L | OAV |
|---|---|---|
| β-Ionone | 2.57 ± 0.12 | 367 |
| α-Ionone | 0.97 ± 0.03 | 32 |
| Octanal | 7.97 ± 0.41 | 11 |
| 1-Octen-3-ol | 5.07 ± 0.19 | 5 |
| 2,4-Nonadienal | 0.22 ± 0.01 | 2 |
| 2-ethyl-3,5-dimethylpyrazine | 0.1 ± 0.01 | 2 |
| (E)-2-Nonenal | 0.1 ± 0.01 | 1 |
| Hexanal | 5.66 ± 0.24 | 1 |
| 2,3-dimethylpyrazine | 2.85 ± 0.11 | 1 |
| 1-Dodecanol | 0.43 ± 0.02 | <1 |
| 3-Hexen-1-ol | 29.8 ± 1.1 | <1 |
| α-Terpineol | 0.2 ± 0.02 | <1 |
| 1-Dodecanol | 0.29 ± 0.01 | <1 |
| (E)-2-Octenal | 0.1 ± 0.01 | <1 |
| Nonanoic acid | 951.9 ± 121.64 | <1 |
| Benzyl alcohol | 47.66 ± 5.34 | <1 |
| (E,E)-2,4-Heptadienal | 0.93 ± 0.05 | <1 |
| γ-Dodecalactone | 0.06 ± 0.01 | <1 |
| Benzaldehyde | 2.92 ± 0.2 | <1 |
| Indole | 6.58 ± 0.43 | <1 |
| 2,5-Dimethyl-3-(2-methylpropyl)-pyrazine | 2.6 ± 0.03 | <1 |


| Compound | Odour Threshold [ppb] | |
|---|---|---|
| α-Terpineol | 330 | Takeoka et al., 1990 [60] |
| 1-Dodecanol | 7.1 | Pal et al., 2014 [61] |
| 1-Octen-3-ol | 1 | Buttery et al., 1988 [62] |
| 2-ethyl-3,5-dimethylpyrazine | 0.04 | Buttery and Ling, 1997 [63] |
| 2-Nonenal, (E)- | 0.08 | Buttery et al., 1988 [62] |
| 2-Octenal, (E)- | 3 | Guadagni et al., 1972 [64] |
| 2,3-dimethylpyrazine | 2.5 | |
| 2,4-Heptadienal, (E,E)- | 778 | |
| 2,4-Nonadienal | 0.09 | Teranishi et al., 1974 [65] |
| 2,5-Dimethyl-3-(2-methylpropyl)-pyrazine | 800 | |
| 2,6-Nonadienal, (E,Z)- | 0.01 | Teranishi et al., 1974 [65] |
| 3-Hexen-1-ol | 70 | Takeoka et al., 1990 [60] |
| 4-Heptenal | 0.8 | |
| Benzaldehyde | 350 | Buttery et al., 1988 [62] |
| Benzaldehyde, 4-methoxy- | 47 | |
| Benzyl alcohol | 10000 | Buttery et al., 1988 [62] |
| Decanal | 0.1 | Guadagni et al., 1963 [66] |
| Hexanal | 04.05.05 | Buttery et al., 1988 [62] |
| Indole | 140 | Buttery et al., 1988 [62] |
| Nonanoic acid | 3000 | |
| Octanal | 0.7 | Buttery et al., 1988 [62] |
| α-Ionone | 0.03 | |
| β-Ionone | 0.007 | |
| γ-Dodecalactone | 7 | Engel et al., 1988 [67] |
References
- International Coffee Organisation (ICO). Coffee Market Report; International Coffee Organisation (ICO): London, UK, 2021. [Google Scholar]
- Murthy, P.S.; Madhava Naidu, M. Sustainable management of coffee industry by-products and value addition—A review. Resour. Conserv. Recycl. 2012, 66, 45–58. [Google Scholar] [CrossRef]
- European Comission. Commission Implementing Regulation (EU) 2020/917 of 1 July 2020 authorising the placing on the market of infusion from coffee leaves of Coffea arabica L. and/or Coffea cnephora Pierre Ex A. Froehner as a traditional food from a third country. Off. J. Eur. Union 2020, L209, 10–13. [Google Scholar]
- Lachenmeier, D.W.; Rajcic de Rezende, T.; Schwarz, S. An update on sustainable valorization of coffee by-products as novel foods within the European Union. Biol. Life Sci. Forum 2021, 6, 37. [Google Scholar] [CrossRef]
- Wintgens, J.N. Coffee: Growing, processing, sustainable production. In A Guidebook for Growers, Processors, Traders, and Researchers; Wiley-VCH Verlag GmbH & Co. KGaA: Weinheim, Germany, 2004. [Google Scholar] [CrossRef]
- Von Pröpper, L. Der Kaffee- und Theetisch nebst Rezepten und Servierkarten; Verlag von J. Engelhorn: Stuttgart, Germany, 1882. [Google Scholar]
- Klingel, T.; Kremer, J.I.; Gottstein, V.; De Rezende, T.R.; Schwarz, S.; Lachenmeier, D.W. A review of coffee by-products including leaf, flower, cherry, husk, silver skin, and spent grounds as novel foods within the European Union. Foods 2020, 9, 665. [Google Scholar] [CrossRef]
- Tritsch, N.; Steger, M.C.; Segatz, V.; Blumenthal, P.; Rigling, M.; Schwarz, S.; Zhang, Y.; Franke, H.; Lachenmeier, D.W. Risk assessment of caffeine and epigallocatechin gallate in coffee leaf tea. Foods 2022, 11, 263. [Google Scholar] [CrossRef]
- Novita, R.; Kasim, A.; Anggraini, T.; Putra, D.P. Kahwa Daun: Traditional knowledge of a coffee leaf herbal tea from West Sumatera, Indonesia. J. Ethn. Foods 2018, 5, 286–291. [Google Scholar] [CrossRef]
- Cramer, P.J.S. A Review of Literature of Coffee Research in Indonesia; SIC Editorial, Inter-American Institute of Agricultural Sciences: Turrialba, Costa Rica, 1957. [Google Scholar]
- Lamorde, M.; Tabuti, J.R.S.; Obua, C.; Kukunda-Byobona, C.; Lanyero, H.; Byakika-Kibwika, P.; Bbosa, G.S.; Lubega, A.; Ogwal-Okeng, J.; Ryan, M.; et al. Medicinal plants used by traditional medicine practitioners for the treatment of HIV/AIDS and related conditions in Uganda. J. Ethnopharmacol. 2010, 130, 43–53. [Google Scholar] [CrossRef] [PubMed]
- Ross, I.A. Coffea arabica. Med. Plants World 2005, 3, 155–195. [Google Scholar] [CrossRef]
- Giday, M.; Asfaw, Z.; Woldu, Z. Ethnomedicinal study of plants used by Sheko ethnic group of Ethiopia. J. Ethnopharmacol. 2010, 132, 75–85. [Google Scholar] [CrossRef]
- Martins, S.C.V.; Araújo, W.L.; Tohge, T.; Fernie, A.R.; DaMatta, F.M. In high-light-acclimated coffee plants the metabolic machinery is adjusted to avoid oxidative stress rather than to benefit from extra light enhancement in photosynthetic yield. PLoS ONE 2014, 9, e94862. [Google Scholar] [CrossRef]
- Pompelli, M.F.; Martins, S.C.V.; Antunes, W.C.; Chaves, A.R.M.; DaMatta, F.M. Photosynthesis and photoprotection in coffee leaves is affected by nitrogen and light availabilities in winter conditions. J. Plant Physiol. 2010, 167, 1052–1060. [Google Scholar] [CrossRef] [PubMed]
- Chen, X. A Review on coffee leaves: Phytochemicals, bioactivities and applications. Crit. Rev. Food Sci. Nutr. 2019, 59, 1008–1025. [Google Scholar] [CrossRef] [PubMed]
- Chaves, A.R.M.; Ten-Caten, A.; Pinheiro, H.A.; Ribeiro, A.; Damatta, F.M. Seasonal changes in photoprotective mechanisms of leaves from shaded and unshaded field-grown coffee (Coffea arabica L.) trees. Trees Struct. Funct. 2008, 22, 351–361. [Google Scholar] [CrossRef]
- The European Parliament and the Council of the European Union. Regulation (EU) 2015/2283 of the European Parliament and of the Council of 25 November 2015 on novel foods, amending Regulation (EU) No 1169/2011 of the European Parliament and of the Council and repealing Regulation (EC) No 258/97. Off. J. Eur. Union 2015, L327, 1–22. [Google Scholar]
- DIN 10809:1988-08; Analysis of Tea; Preparation of Liquor for Use in Sensory Tests. Beuth Verlag: Berlin, Germany, 1988. [CrossRef]
- ISO 1572:1980-08; Tea; Preparation of Ground Sample of Known Dry Matter Content. International Organization for Standardization: Geneva, Switzerland, 1980.
- Segatz, V.; Steger, M.C.; Blumenthal, P.; Gottstein, V.; Rigling, M.; Schwarz, S.; Zhang, Y.; Lachenmeier, D.W. Evaluation of analytical methods to determine regulatory compliance of coffee leaf tea. Biol. Life Sci. Forum 2021, 6, 45. [Google Scholar] [CrossRef]
- Claassen, L.; Rinderknecht, M.; Porth, T.; Röhnisch, J.; Seren, H.Y.; Scharinger, A.; Gottstein, V.; Noack, D.; Schwarz, S.; Winkler, G.; et al. Cold brew coffee-pilot studies on definition, extraction, consumer preference, chemical characterization and microbiological hazards. Foods 2021, 10, 865. [Google Scholar] [CrossRef]
- Rigling, M.; Yadav, M.; Yagishita, M.; Nedele, A.K.; Sun, J.; Zhang, Y. Biosynthesis of pleasant aroma by Enokitake (Flammulina velutipes) with a potential use in a novel tea drink. LWT Food Sci. Technol. 2021, 140, 110646. [Google Scholar] [CrossRef]
- Weatherley, P.E. Studies in the water relations of the cotton plant: I. The field measurement of water deficits in leaves. New Phytol. 1950, 49, 81–97. [Google Scholar] [CrossRef]
- Chabot, B.F.; Hicks, D.J. The ecology of leaf life spans. Annu. Rev. Ecol. Syst. 1982, 13, 229–259. [Google Scholar] [CrossRef]
- Zerbini, S. The pruning of ornamental plants: Why topping is such a common practice. Alberi Territ. 2006, 2, 26–28. [Google Scholar]
- Scherer, G.W. Theory of drying. J. Am. Ceram. Soc. 1990, 73, 3–14. [Google Scholar] [CrossRef]
- Arslan, D.; Özcan, M.M. Evaluation of drying methods with respect to drying kinetics, mineral content and colour characteristics of rosemary leaves. Energy Convers. Manag. 2008, 49, 1258–1264. [Google Scholar] [CrossRef]
- BMEL. Leitsätze für Tee, Teeähnliche Erzeugnisse, deren Extrakte und Zubereitungen vom 2.12.1998; Bundesministerium für Ernährung und Landwirtschaft: Berlin, Germany, 1998.
- Hanaa, A.R.M.; Sallam, Y.I.; El-Leithy, A.S.; Aly, S.E. Lemongrass (Cymbopogon citratus) essential oil as affected by drying methods. Ann. Agric. Sci. 2012, 57, 113–116. [Google Scholar] [CrossRef]
- Morsy, N.F. Quality Evaluation of The Essential Oil of Basil Plant Dried by Different Methods. Master’s Thesis, Cairo University, Giza, Egypt, 2004. [Google Scholar]
- Omidbaigi, R.; Sefidkon, F.; Kazemi, F. Influence of drying methods on the essential oil content and composition of Roman chamomile. Flavour Fragr. J. 2004, 19, 196–198. [Google Scholar] [CrossRef]
- Ratanamarno, S.; Surbkar, S. Caffeine and catechins in fresh coffee leaf (Coffea arabica) and coffee leaf tea. Maejo Int. J. Sci. Technol. 2017, 11, 211–218. [Google Scholar]
- Bowers, M.D.; Stamp, N.E. Effects of plant age, genotype, and herbivory on plantago performance and chemistry. Ecology 1993, 74, 1778–1791. [Google Scholar] [CrossRef]
- Blum-Silva, C.H.; Chaves, V.C.; Schenkel, E.P.; Coelho, G.C.; Reginatto, F.H. The influence of leaf age on methylxanthines, total phenolic content, and free radical scavenging capacity of Ilex paraguariensis aqueous extracts. Rev. Bras. Farmacogn. 2015, 25, 1–6. [Google Scholar] [CrossRef]
- Song, R.; Kelman, D.; Johns, K.L.; Wright, A.D. Correlation between leaf age, shade levels, and characteristic beneficial natural constituents of tea (Camellia sinensis) grown in Hawaii. Food Chem. 2012, 133, 707–714. [Google Scholar] [CrossRef]
- Astill, C.; Birch, M.R.; Dacombe, C.; Humphrey, P.G.; Martin, P.T. Factors affecting the caffeine and polyphenol contents of black and green tea infusions. J. Agric. Food Chem. 2001, 49, 5340–5347. [Google Scholar] [CrossRef]
- Ashihara, H.; Monteiro, A.M.; Gillies, F.M.; Crozier, A. Biosynthesis of caffeine in leaves of coffee. Plant Physiol. 1996, 111, 747–753. [Google Scholar] [CrossRef]
- Friedman, M.; Levin, C.E.; Choi, S.H.; Lee, S.U.; Kozukue, N. Changes in the composition of raw tea leaves from the Korean yabukida plant during high-temperature processing to pan-fried Kamairi-Cha green tea. J. Food Sci. 2009, 74, C406–C412. [Google Scholar] [CrossRef] [PubMed]
- Toschi, T.G.; Bordoni, A.; Hrelia, S.; Bendini, A.; Lercker, G.; Biagi, P.L. The protective role of different green tea extracts after oxidative damage is related to their catechin composition. J. Agric. Food Chem. 2000, 48, 3973–3978. [Google Scholar] [CrossRef] [PubMed]
- Li, N.; Taylor, L.S.; Ferruzzi, M.G.; Mauer, L.J. Kinetic study of catechin stability: Effects of pH, concentration, and temperature. J. Agric. Food Chem. 2012, 60, 12531–12539. [Google Scholar] [CrossRef]
- Turkmen, N.; Sarı, F.; Velioglu, Y.S. Factors affecting polyphenol content and composition of fresh and processed tea leaves. Akad. Gıda 2009, 7, 29–40. [Google Scholar]
- Oszmiański, J.; Wojdyło, A.; Kolniak, J. Effect of L-ascorbic acid, sugar, pectin and freeze-thaw treatment on polyphenol content of frozen strawberries. LWT Food Sci. Technol. 2009, 42, 581–586. [Google Scholar] [CrossRef]
- Loncaric, A.; Dugalic, K.; Mihaljevic, I.; Jakobek, L.; Pilizota, V. Effects of sugar addition on total polyphenol content and antioxidant activity of frozen and freeze-dried apple purée. J. Agric. Food Chem. 2014, 62, 1674–1682. [Google Scholar] [CrossRef]
- Monteiro, Â.; Colomban, S.; Azinheira, H.G.; Guerra-Guimarães, L.; Silva, M.D.C.; Navarini, L.; Resmini, M. Dietary antioxidants in coffee leaves: Impact of botanical origin and maturity on chlorogenic acids and xanthones. Antioxidants 2020, 9, 6. [Google Scholar] [CrossRef]
- Ścibisz, I.; Mitek, M. The changes of antioxidant properties in highbush blueberries (Vaccinium corymbosum L.) during freezing and long-term frozen storage. Acta Sci. Pol. Technol. Aliment 2007, 6, 75–82. [Google Scholar]
- Zhu, X.; Wang, C.; Wang, X.; Cai, M.; Deng, S. Effects of different processing methods on the determination of trigonelline in fructus Cannabis decoction pieces. J. Pharm. Res. 2016, 35, 19–21. [Google Scholar]
- Wang, L.F.; Lee, J.Y.; Chung, J.O.; Baik, J.H.; So, S.; Park, S.K. Discrimination of teas with different degrees of fermentation by SPME-GC Analysis of the characteristic volatile flavour compounds. Food Chem. 2008, 109, 196–206. [Google Scholar] [CrossRef]
- Borah, S.; Bhuyan, M. Non-destructive testing of tea fermentation using image processing. Insight Non-Destruct. Test. Cond. Monit. 2003, 45, 55–58. [Google Scholar] [CrossRef]
- Yuwono, S.S.; Fibrianto, K.; Wahibah, L.Y.; Wardhana, A.R. Sensory attributes profiling of dampit robusta coffee leaf tea (Coffea canephora). Carpathian J. Food Sci. Technol. 2019, 11, 165–176. [Google Scholar] [CrossRef]
- Zhu, J.C.; Xiao, Z.B. Characterization of the key aroma compounds in peach by gas chromatography–olfactometry, quantitative measurements and sensory analysis. Eur. Food Res. Technol. 2019, 245, 129–141. [Google Scholar] [CrossRef]
- Galmés, J.; Flexas, J.; Savé, R.; Medrano, H. Water relations and stomatal characteristics of Mediterranean plants with different growth forms and leaf habits: Responses to water stress and recovery. Plant Soil 2007, 290, 139–155. [Google Scholar] [CrossRef]
- Kawakami, M.; Kobayashi, A.; Kator, K. Volatile constituents of rooibos tea (Aspalathus linearis) as affected by extraction process. J. Agric. Food Chem. 1993, 41, 633–636. [Google Scholar] [CrossRef]
- Oomah, B.D.; Liang, L.S.Y.; Balasubramanian, P. Volatile compounds of dry beans (Phaseolus vulgaris L.). Plant Foods Hum. Nutr. 2007, 62, 177–183. [Google Scholar] [CrossRef] [PubMed]
- Bryan, J.L.; DiNenno, P.J.; Drysdale, D.; Beyler, C.L. Behavioral response to fire and smoke. In Handbook of Fire Protection Engineering; DiNenno, P.J., Drysdale, D., Beyler, C.L., Eds.; The Society of Fire Protection Engineers (SFPE): Washington, DC, USA, 2002; pp. 315–341. [Google Scholar]
- PubChem. National Library for Medicine. Available online: https://pubchem.ncbi.nlm.nih.gov/ (accessed on 10 March 2022).
- Ho, C.T.; Zheng, X.; Li, S. Tea aroma formation. Food Sci. Hum. Wellness 2015, 4, 9–27. [Google Scholar] [CrossRef]
- Paravisini, L.; Guichard, E. Interactions between aroma compounds and food matrix. In Flavour: From Food to Perception; Guichard, E., Salles, C., Morzel, M., Le Bon, A.-M., Eds.; John Wiley & Sons, Ltd.: Chichester, UK, 2016; pp. 208–234. [Google Scholar] [CrossRef]
- Doty, R.L. Psychophysical measurement of odor perception in humans. In The Human Sense of Smell; Springer: Berlin/Heidelberg, Germany, 1991; pp. 95–134. [Google Scholar] [CrossRef]
- Takeoka, G.R.; Flath, R.A.; Mon, T.R.; Teranishi, R.; Guentert, M. Volatile constituents of apricot (Prunus armeniaca). J. Agric. Food Chem. 1990, 38, 471–477. [Google Scholar] [CrossRef]
- Pal, P.; Mitra, I.; Roy, K. QSPR modeling of odor threshold of aliphatic alcohols using extended topochemical atom (ETA) indices. Croat. Chem. Acta 2014, 87, 29–37. [Google Scholar] [CrossRef]
- Buttery, R.G.; Turnbaugh, J.G.; Ling, L.C. Contribution of volatiles to rice aroma. J. Agric. Food Chem. 1988, 36, 1006–1009. [Google Scholar] [CrossRef]
- Buttery, R.G.; Ling, L.C. 2-Ethyl-3,5-dimethylpyrazine and 2-ethyl-3,6-dimethylpyrazine: Odor thresholds in water solution. LWT Food Sci. Technol. 1997, 30, 109–110. [Google Scholar] [CrossRef]
- Guadagni, D.G.; Buttery, R.G.; Turnbaugh, J.G. Odour thresholds and similarity ratings of some potato chip components. J. Sci. Food Agric. 1972, 23, 1435–1444. [Google Scholar] [CrossRef]
- Teranishi, R.; Buttery, R.G.; Gaudagni, D.G. Odor quality and chemical structure in fruit and vegetable flavors. Ann. N. Y. Acad. Sci. 1974, 237, 209–216. [Google Scholar] [CrossRef] [PubMed]
- Guadagni, D.G.; Buttery, R.G.; Okano, S. Odour Thresholds of some organic compounds associated with food flavours. J. Sci. Food Agric. 1963, 14, 761–765. [Google Scholar] [CrossRef]
- Engel, K.H.; Flath, R.A.; Buttery, R.G.; Mon, T.R.; Teranishi, R.; Ramming, D.W. Investigation of volatile constituents in nectarines. 1. Analytical and sensory characterization of aroma components in some nectarine cultivars. J. Agric. Food Chem. 1988, 36, 549–553. [Google Scholar] [CrossRef]


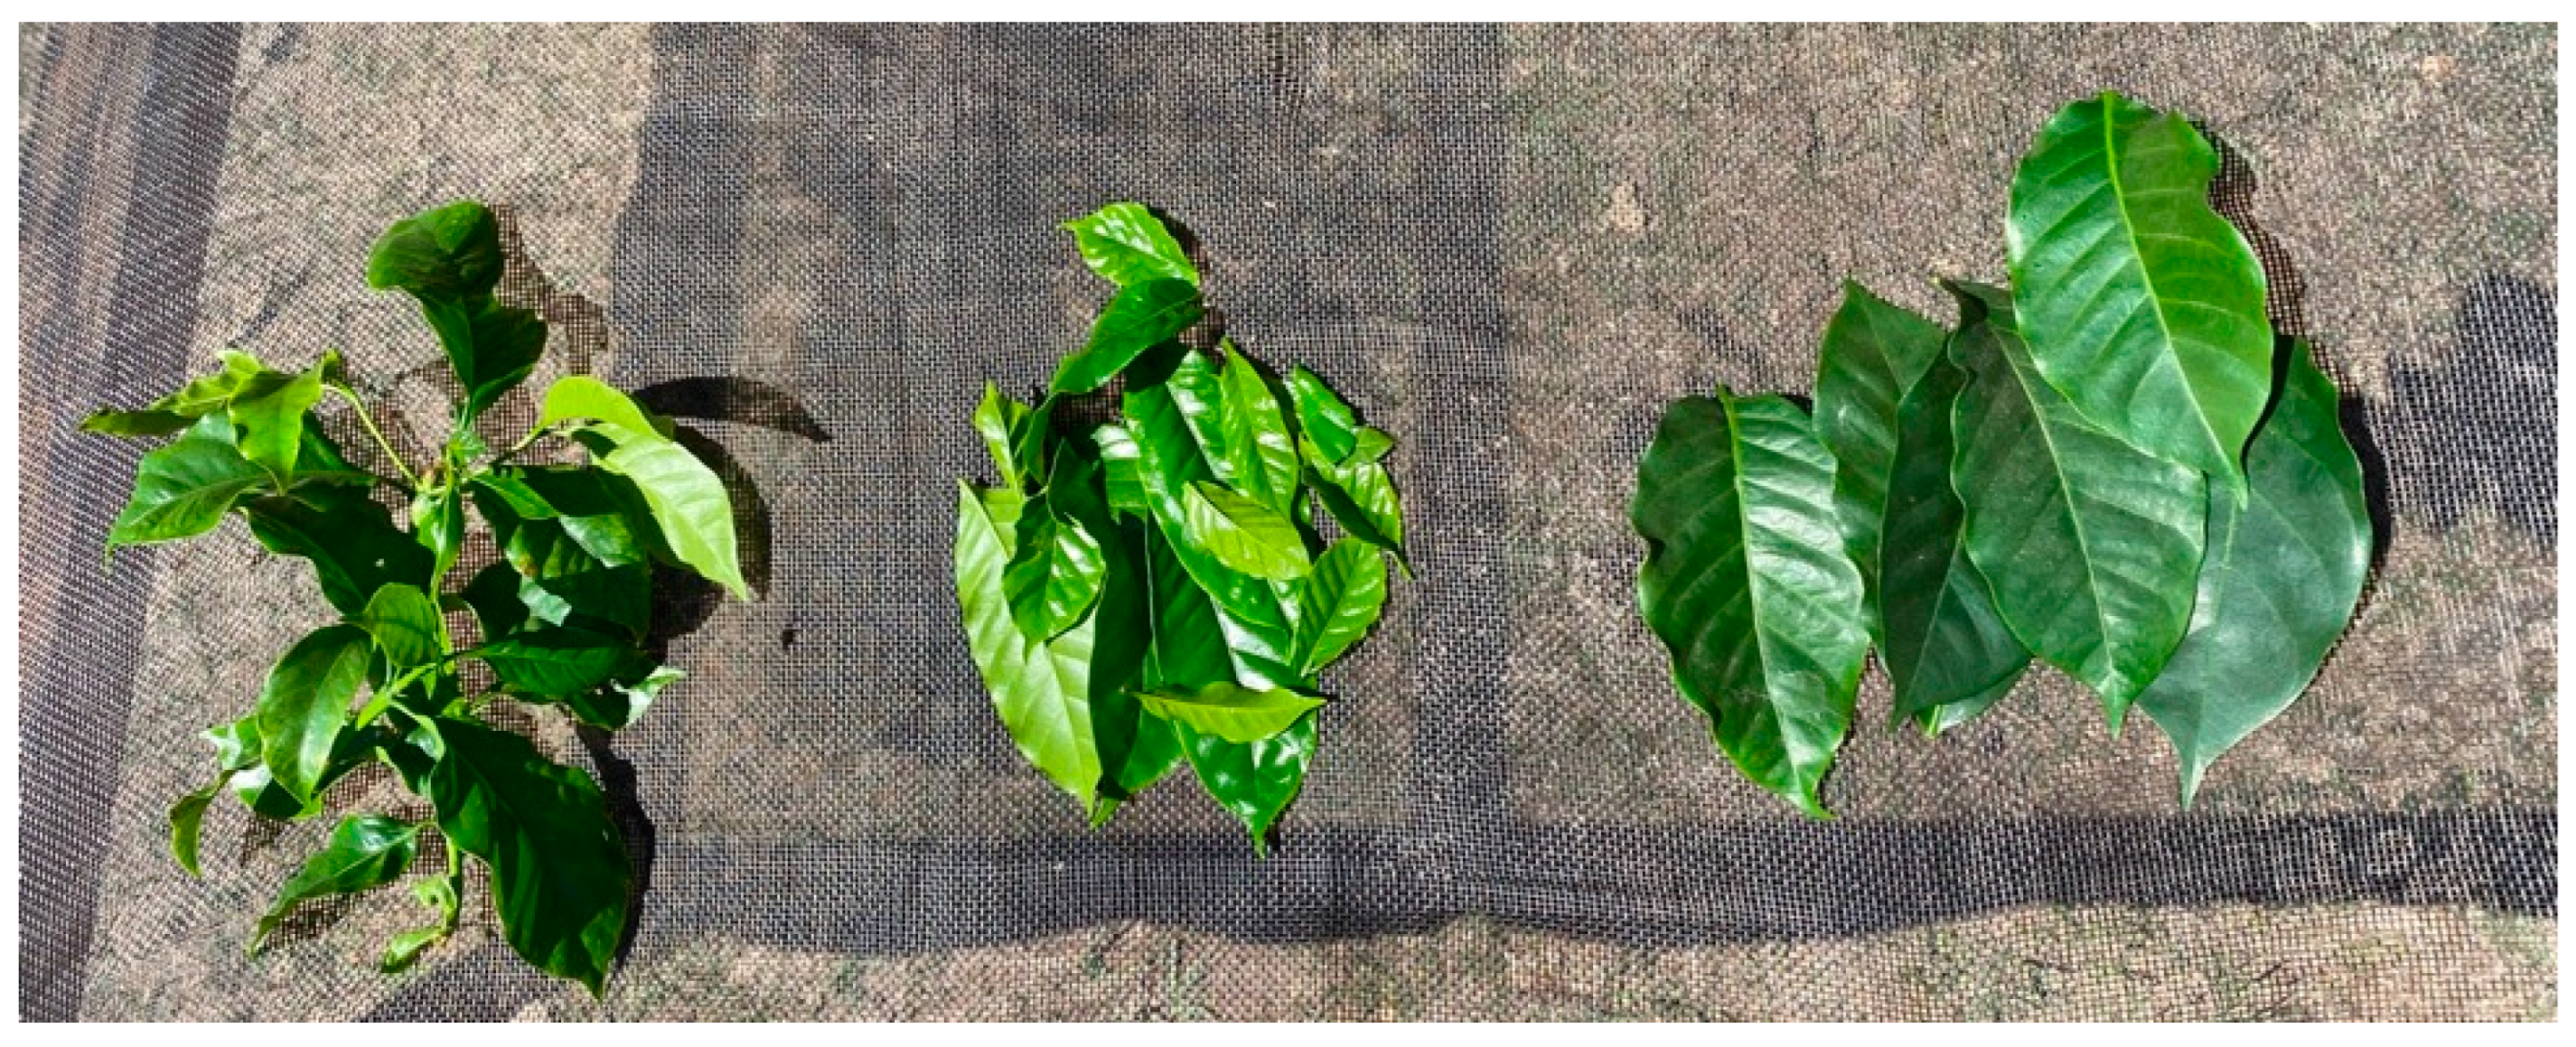
| Leaf Type | Coffea arabica Variety | Collection Place |
|---|---|---|
| Old leaf | Pacamara | Finca La Palma |
| Yellow leaf | Pacamara | Finca La Palma |
| Old leaf | Bourbon Tekisic | Finca La Quintanilla |
| Young leaf | Bourbon Tekisic | Finca La Quintanilla |
| Shoot | Bourbon Tekisic | Finca La Quintanilla |
| Processing | Explanation |
|---|---|
| None (whole leaf) | No further mechanical intervention. |
| Blending | The leaves were blended in a kitchen blender. For 100 g leaves, around 400 mL tap water was added. |
| Cutting | Leaves were cut with a kitchen knife to small strips (20 mm wide). |
| Rolling | The leaves were rolled by hand. |
| Freezing | The leaves were frozen in a freezer at −20 °C for 2 days. |
| Crumbling | Leaves were crumbled by hand. |
| Steaming | Leaves were steamed in a 50 L pot. A sieve was placed in the centre of the pot and approximately 2 L of tap water was boiled under the leaves. The temperature was measured at the lid of the pot. The process was stopped when the temperature reached around 100 °C. |
| Leaf Type | Moisture Content [%] |
|---|---|
| Pacamara yellow | 56.28 ± 1.02 |
| Shoots Bourbon whole | 72.74 ± 1.73 |
| Bourbon old | 62.83 ± 2.22 |
| Bourbon young | 72.89 ± 0.99 |
| Test No. | Coffea arabica Variety | Leaf Type | Processing | Drying | Fermentation | |
|---|---|---|---|---|---|---|
| 1 | 936 | Pacamara | old | whole | air | none |
| 2 | 324 | Pacamara | yellow | whole | air | none |
| 3 | 742 | Pacamara | old | crumbled | air | none |
| 4 | 183 | Pacamara | yellow | crumbled | air | none |
| 5 | 502 | Pacamara | old | cutted | air | none |
| 6 | 643 | Pacamara | old | blended | air | none |
| 7 | 842 | Pacamara | old | crumbled | air | Yeast |
| 8 | 234 | Pacamara | old | whole | oven | none |
| 9 | 238 | Pacamara | old | blended | air | Lactobacillus |
| 10 | 182 | Pacamara | old | blended | air | Yeast |
| 11 | 789 | Pacamara | old | blended | air | Wild |
| 12 | 156 | Pacamara | yellow | blended | air | Wild |
| 13 | 687 | Pacamara | yellow | blended | air | Yeast |
| 14 | 463 | Pacamara | yellow | blended | air | Lactobacillus |
| 15 | 289 | Bourbon | shoot | blended | air | Wild |
| 16 | 138 | Bourbon | old | blended | air | Yeast |
| 17 | 147 | Bourbon | young | blended | air | Wild |
| 18 | 392 | Bourbon | young | steamed/rolled | air | none |
| 19 | 305 | Bourbon | young | rolled/fermented | air | Wild |
| 20 | 930 | Bourbon | shoot | blended/steamed | air | none |
| 21 | 743 | Bourbon | old | whole | air | Wild |
| 22 | 901 | Bourbon | old | whole/frozen | air | none |
| 23 | 369 | Bourbon | old | whole | roasted | none |
| 24 | 220 | Bourbon | shoot | whole | air | none |
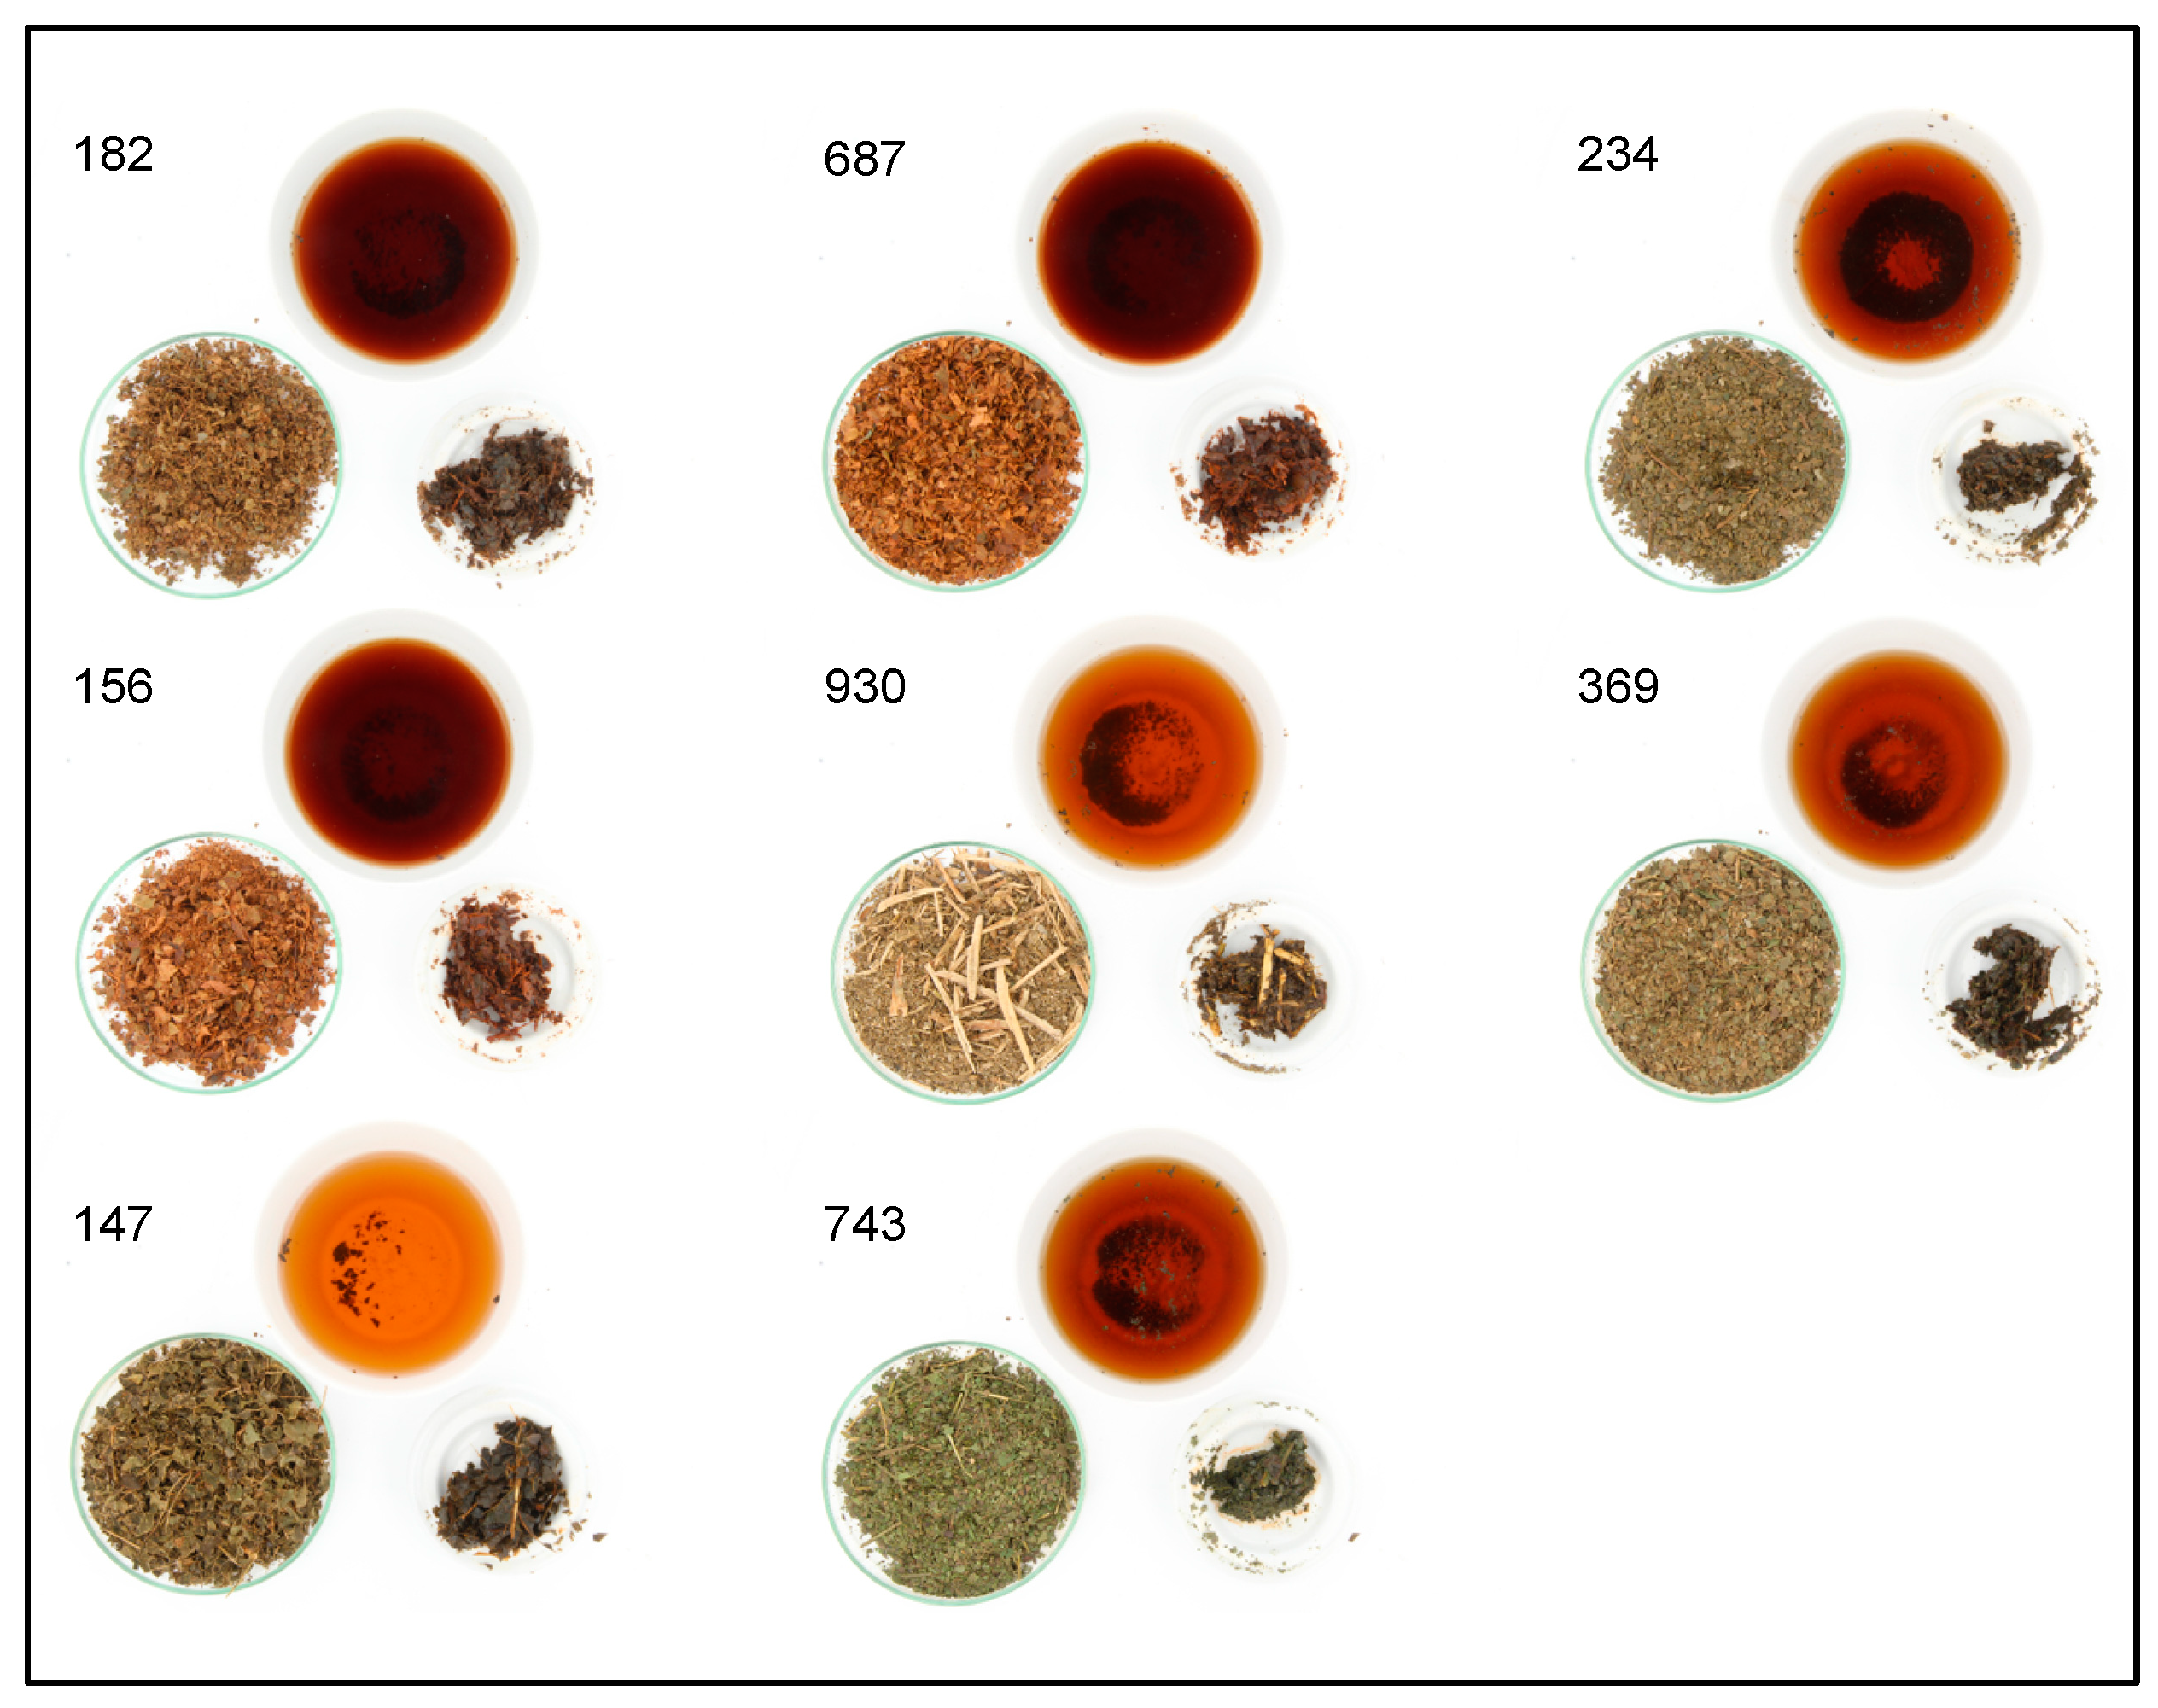
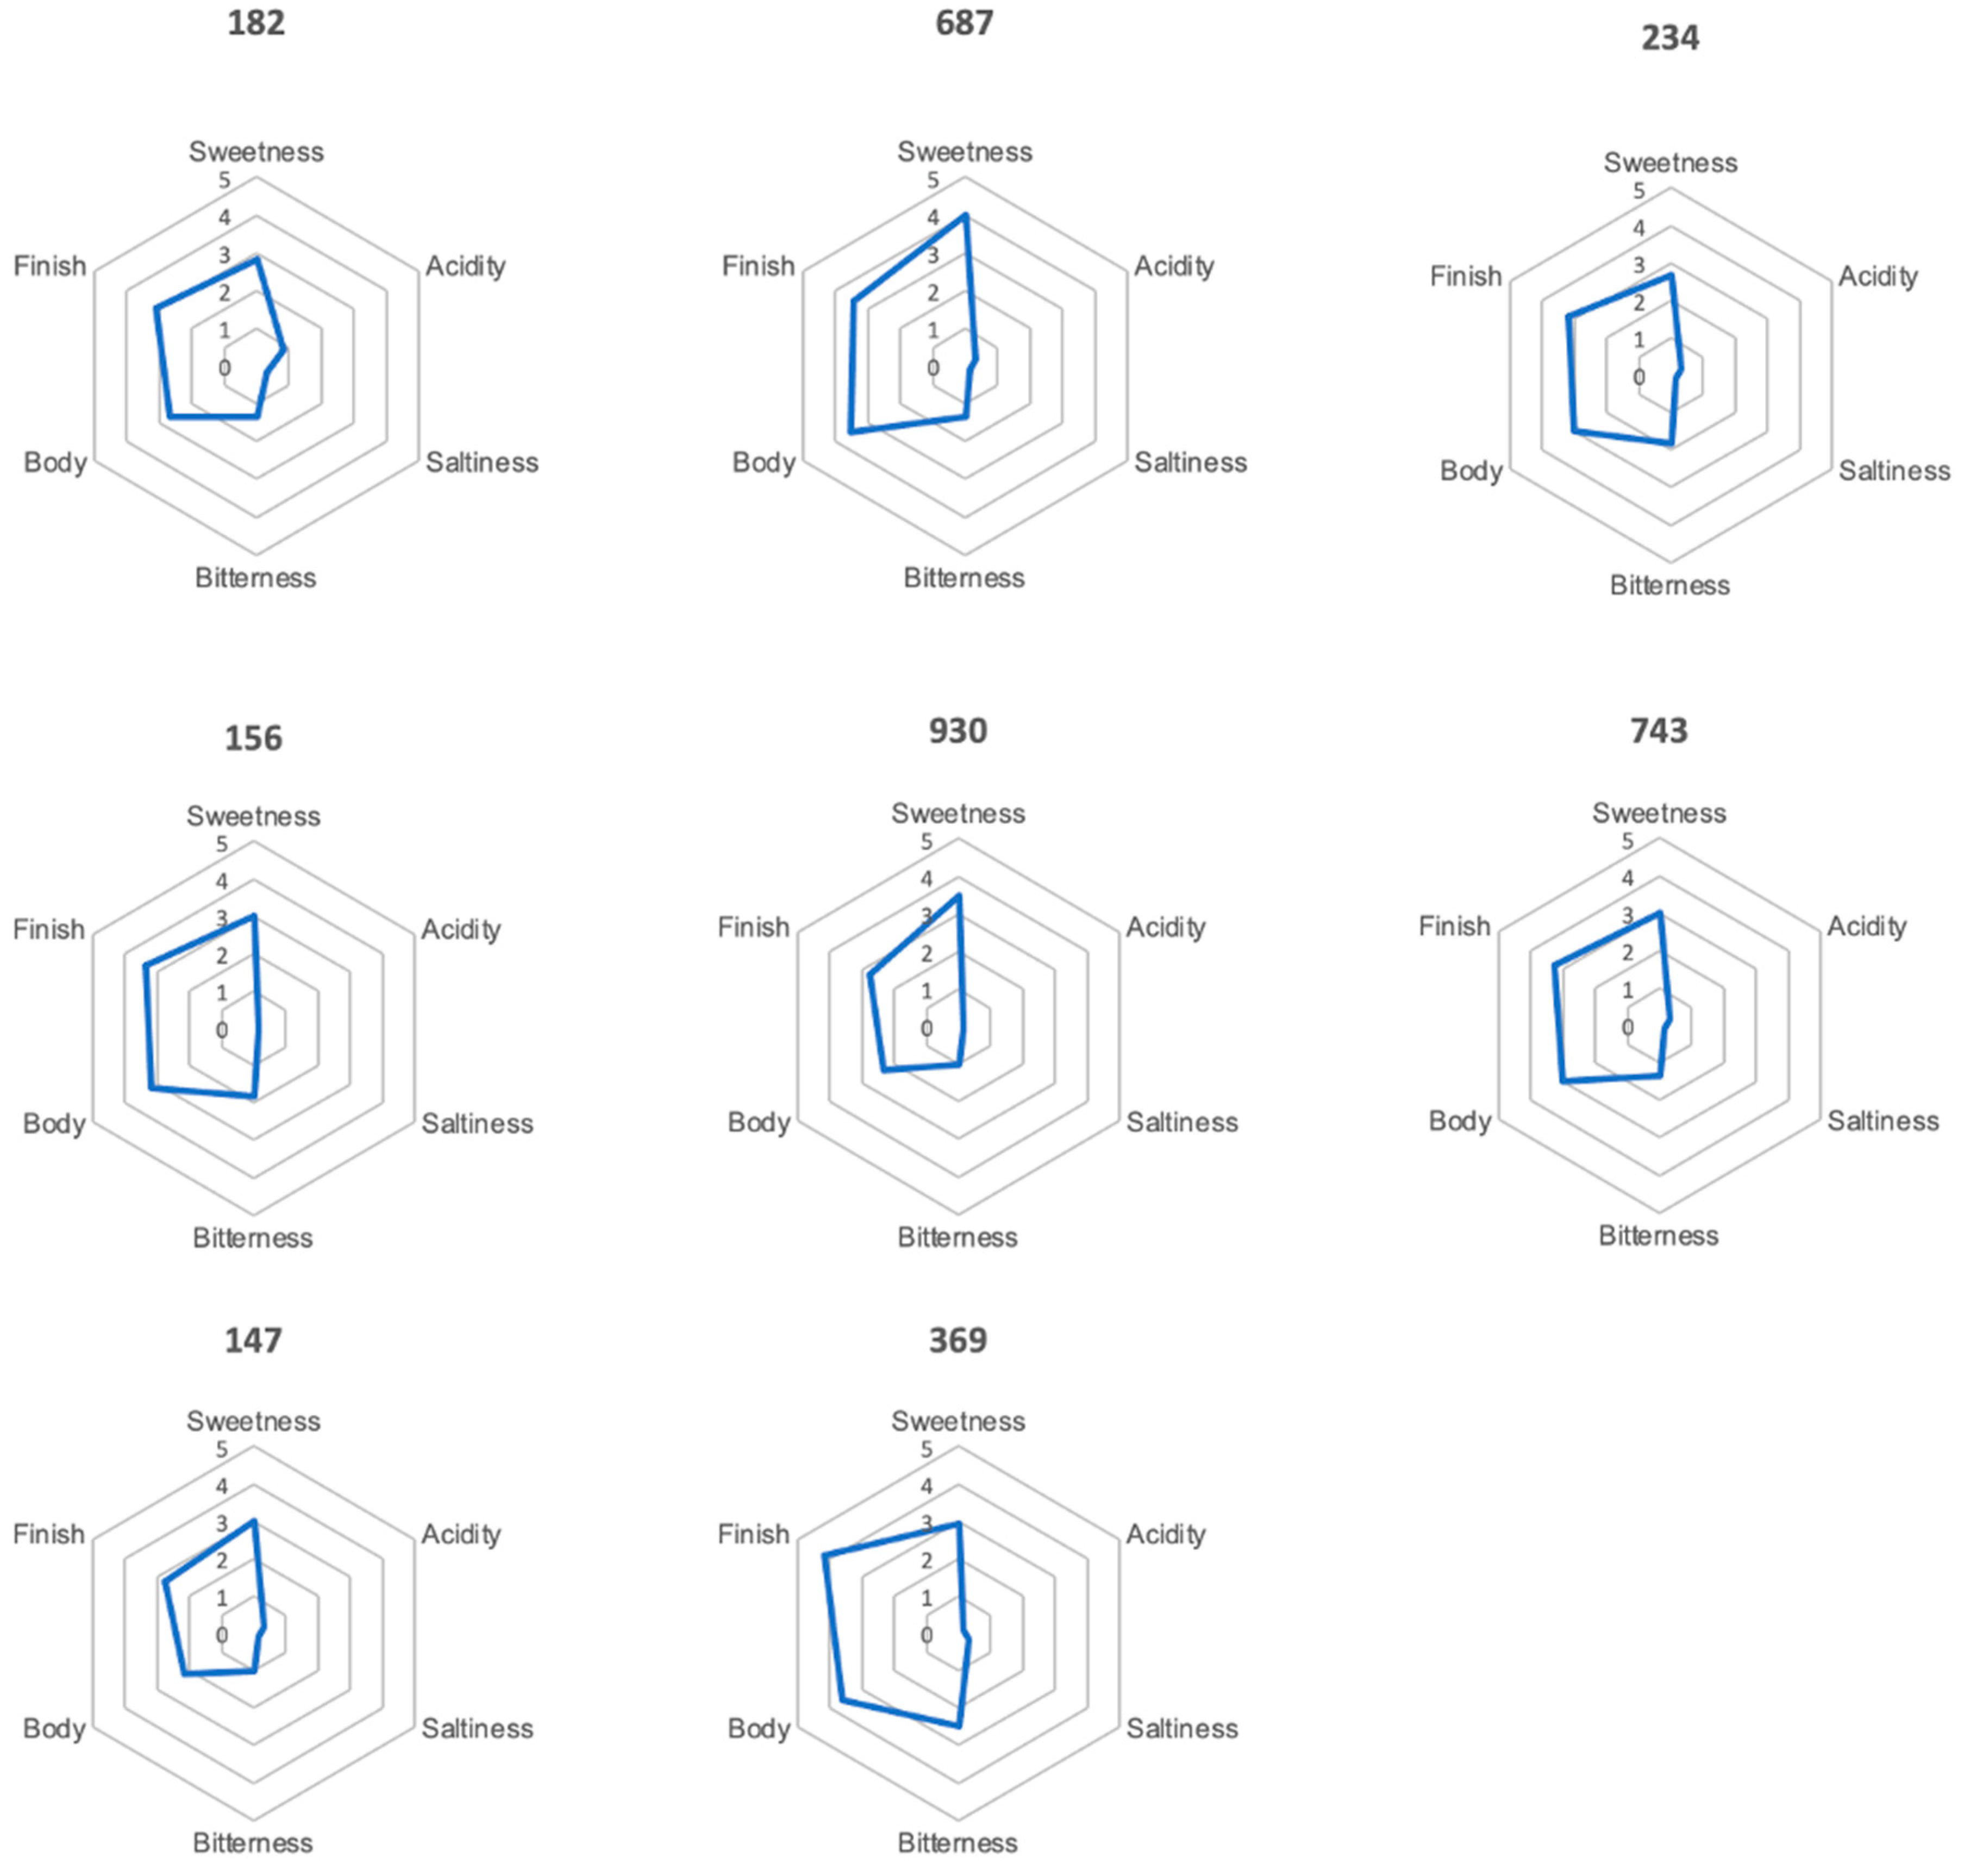
| Test Number | Ranking | Colour | Odour | Flavour |
|---|---|---|---|---|
| 687 | 1 | sediment turbid red-brown | peach-like | peach-like |
| 182 | 2 | clear red | floral woody | sweet peach-like |
| 369 | 3 | clear yellow-brown | popcorn-like smoky roasty | popcorn-like roasty |
| 147 | 4 | very clear yellow-brown | chestnut flower-like floral | honey-like grassy |
| 156 | 5 | red clear | honey floral | honey-like acacia flower-like |
| 234 | 6 | clear amber | grassy rooibos-like | green bean-like vegetal |
| 930 | 7 | clear yellow-green | floral sweet | floral basil-like |
| 743 | 8 | turbid light orange | green bean-like | grassy green bean-like broccoli-like |
Publisher’s Note: MDPI stays neutral with regard to jurisdictional claims in published maps and institutional affiliations. |
© 2022 by the authors. Licensee MDPI, Basel, Switzerland. This article is an open access article distributed under the terms and conditions of the Creative Commons Attribution (CC BY) license (https://creativecommons.org/licenses/by/4.0/).
Share and Cite
Steger, M.C.; Rigling, M.; Blumenthal, P.; Segatz, V.; Quintanilla-Belucci, A.; Beisel, J.M.; Rieke-Zapp, J.; Schwarz, S.; Lachenmeier, D.W.; Zhang, Y. Coffee Leaf Tea from El Salvador: On-Site Production Considering Influences of Processing on Chemical Composition. Foods 2022, 11, 2553. https://doi.org/10.3390/foods11172553
Steger MC, Rigling M, Blumenthal P, Segatz V, Quintanilla-Belucci A, Beisel JM, Rieke-Zapp J, Schwarz S, Lachenmeier DW, Zhang Y. Coffee Leaf Tea from El Salvador: On-Site Production Considering Influences of Processing on Chemical Composition. Foods. 2022; 11(17):2553. https://doi.org/10.3390/foods11172553
Chicago/Turabian StyleSteger, Marc C., Marina Rigling, Patrik Blumenthal, Valerie Segatz, Andrès Quintanilla-Belucci, Julia M. Beisel, Jörg Rieke-Zapp, Steffen Schwarz, Dirk W. Lachenmeier, and Yanyan Zhang. 2022. "Coffee Leaf Tea from El Salvador: On-Site Production Considering Influences of Processing on Chemical Composition" Foods 11, no. 17: 2553. https://doi.org/10.3390/foods11172553