Article

Multi-Scale Structures and Functional Properties of Quinoa Starch Extracted by Alkali, Wet-Milling, and Enzymatic Methods

1
State Key Laboratory of Food Nutrition and Safety, Tianjin University of Science and Technology, Tianjin 300457, China
2
State Key Laboratory of Tea Plant Biology and Utilization, Anhui Agricultural University, 130 Changjiang West Road, Hefei 230036, China
3
Joint International Research Laboratory of Agriculture and Agri-Product Safety, The Ministry of Education of China, Institutes of Agricultural Science and Technology Development, Yangzhou University, Yangzhou 225009, China
4
School of Food Science and Engineering, South China University of Technology, Guangzhou 510640, China
5
School of Tourism and Cuisine, Yangzhou University, Yangzhou 225127, China
6
Key Laboratory of Agricultural Products Processing Engineering of Anhui Province, School of Tea and Food Technology, Anhui Agricultural University, Hefei 230036, China
*
Authors to whom correspondence should be addressed.
Foods 2022, 11(17), 2625; https://doi.org/10.3390/foods11172625
Submission received: 3 July 2022 / Revised: 18 August 2022 / Accepted: 25 August 2022 / Published: 30 August 2022
(This article belongs to the Special Issue Plant-Based Food and Human Digestion Health)

Abstract

:
The purpose of this study is to investigate the effects of starch extraction methods (alkali, wet-milling, and enzymatic) on the multi-scale structures and functional properties of quinoa starch. When the enzymatic method was compared with alkali and wet-milling, it showed higher protein content (2.4%), larger mean size of aggregated granules (44.1 μm), higher relative crystallinity (29.0%), scattering intensity (17.8 α.u.), absorbance ratio of 1047/1022 (0.9), single and double helical content (8.2% and 23.1%), FWHM ratio (1.5), and average molecular weight and radius of gyration (1.58 × 10⁷ g/mol and 106.8 nm), respectively. Similarly, quinoa starch by enzymatic extraction had a higher onset (82.1 °C), peak (83.8 °C), and conclusion (86.3 °C) temperatures, as well as an enthalpy change (6.8 J/g). It further showed maximum hardness (238.8 N), gumminess (105.6 N), chewiness (80.2 N), SDS content (7.5% of raw and 4.8% of cooked), and RS content (15.4% of raw and 13.9% of cooked), whereas it contained minimum RDS content (77.1% of raw and 81.9% of cooked). The results suggest that extraction of starch by the enzymatic method could be a viable approach to retain the native structure of starch and may eventually improve the glycemic response.

1. Introduction

Quinoa (Chenopodium Quinoa Willd.) seeds are pseudo-cereals of the Chenopodiaceae family with dicotyledon plants and are widely grown as an edible and staple grain crop in South America [1]. Quinoa seeds are a useful source of starch, protein, fats, dietary fiber, minerals, vitamins, and polyphenols. The major component of quinoa seed is starch (∼30–70%), with small granule sizes (~1–3 μm) and amylose content (∼0.3–27.7%) [2]. Quinoa starch amylose is less branched, but amylopectin has a high proportion of short chains and fingerprint A-chains [3]. These structural characteristics of quinoa starch have led to some unique properties, including low gelatinization temperature and gel strength, high enzyme susceptibility, Pickering emulsifying property, and targeted delivery function [4]. Quinoa starch provides more than half of the energy, and its slow-digesting properties are nutritionally desirable. Thus, it can be used as a novel source for expanding food functional properties (i.e., texture, sensory attributes, and nutritional value).
Starch is an important raw material used in food (thickener, stabilizer, and weaning foods) and non-food industries (pharmaceuticals and textiles). The world’s annual production of starch is estimated at about 60 million tons [5], which is extracted from cereals, tubers, and root crops. Its 60% is used in foods (e.g., bakery products, soups, sauces, ice cream, sugar syrups, snack foods, baby foods, meat products, drinks, and fat substitutes), while the remaining 40% is used in pharmaceuticals and non-edible applications [6]. The various extracting techniques (i.e., alkali, wet-milling, and enzymatic method) are used with different processing conditions and chemicals to obtain starch, which dominates the chemical composition and multi-scale structure of isolated starch [7,8], resulting in desirable and undesirable effects on their physicochemical and functional properties. Alkali is the process of starch extraction that involves the steeping, physical shearing, and slightly high pH value induced by sodium hydroxide, which affects the multi-scale structure and causes changes in physical and chemical properties, improves the solubility of starch and protein, degrades the starch molecules through attacking functional groups, and reduces molecular weight [9,10,11]. Meanwhile, in the entire process of wet-milling extraction, large and long chains of molecules are either extracted poorly or are degraded easily. The sodium pyrosulfite in the soaking increases the water diffusion rate, disintegrates the matrix of protein-starch, and slows down the growth of microorganisms [12], whereas enzymatic extraction requires less grinding and smaller energy inputs, and also releases starch content from cell wall components with better recovery.
Since the methods of extraction induce structural differences among isolated starches, such changes may eventually affect the functional properties and lead to different industrial applications [7]. Therefore, three kinds of starch extraction techniques (i.e., alkali, wet-milling, and enzymatic method) were used to isolate quinoa starch, their basic composition (total starch, moisture, protein, lipid, and ash content), multi-scale structural characterization (scanning electron microscopy, particle size analyzer, X-ray diffraction, small-angle X-ray scattering analysis, attenuated total reflectance-fourier transformed infrared spectroscopy, laser confocal micro-Raman analysis, solid-state 13C nuclear magnetic resonance spectroscopy, and size exclusion chromatography) and functional properties (gelatinization, texture, and in vitro digestion) were explored, and their structure–function relationship was further studied. This study paves the way for designing a targeted functional starch source via the extraction technique of selection and optimization.

2. Materials and Methods

2.1. Materials

Quinoa seeds of good quality were provided by the Qinghai Farmer Co., Ltd. (Qinghai province, China). The protease of streptomyces griseus (type XIV), porcine pancreas α-amylase (P7545, 8 × USP), amyloglucosidase (A7095, ≥300 units/mL) enzymes, and glucose oxidase–peroxidase (GOPOD) were provided by Sigma-Aldrich Ltd. (St. Louis, MO, USA). The total starch testing assay kit (K-TSTA) was obtained from Megazyme International Ltd. (Bray, Co., Wicklow, Ireland). Other utilized chemicals or reagents are analytical grade.

2.2. Extraction of Starch Using the Alkali, Wet-Milling, and Enzymatic Methods

Quinoa starch was isolated using the alkali method as reported by Li, et al. [13] with slight modification. Quinoa seeds were ground into flour and dispersed in sodium hydroxide (0.3%) in a ratio of 1:5 (w/w), mixed, and left for 2 h. The mixture was passed through a mesh sieve with an opening of 0.18 mm. The milky starch precipitated and the upper supernatant layer was gradually poured out. The precipitated starch residues were thoroughly washed with distilled water and freeze-dried for further use.
The wet-milling method was used to isolate quinoa starch following the procedure described previously [14] with modification. Quinoa seeds (50 g) were soaked in a 0.45% sodium pyrosulfite solution (150 mL, w/v) overnight at 4 °C and ground by a kitchen blender (SMF01, SUPOR, Zhejiang Supor Co., Ltd., Hangzhou, China). The sodium pyrosulfite solution (350 mL) was added to the ground mixture and stirred continuously to separate proteins and lipids, then centrifuged at 3000× g for 10 min. This process was repeated at least 3 times. The resulting fractions were further purified (10 times) by sodium chloride-toluene (1: 9, w/v) solution. Starch residues were further thoroughly washed with ethanol and distilled water until the toluene odor was removed completely. Then it was filtered, rinsed again with ethanol and distilled water through cheesecloth, and freeze-dried for 48 h.
Isolation of quinoa starch was performed by an enzymatic method (protease) using the procedure described by Zhao, et al. [15]. The quinoa seeds were ground by a kitchen grinder (SMF01, SUPOR, Zhejiang Supor Co., Ltd., Hangzhou, China), thoroughly mixed by hand, and then passed through a mesh sieve opening of 75 μm. The sieved sample (1.5 g) was soaked in 40 mL of sodium bisulfite solution (0.45%, w/v) for 18 h at room temperature and centrifuged at 4000× g for 10 min. The upper yellowish layer (protein and fiber) of the supernatant was discarded, and the residues were deproteinized by a protease enzyme (2.5 units/mL) in tricine buffer at 37 °C overnight. The residues were further thoroughly washed several times with absolute ethanol (40 mL) and distilled water (40 mL) to remove soluble impurities (e.g., amino acids and lipids). The pure odorless starch residues were freeze-dried (BTP 9ES, SP Scientific Industries, Inc., Warminster, PA, USA) for 48 h.

2.3. Chemical Composition Analysis

The extracted starch samples were determined for chemical composition analysis. Total starch was quantified using a starch assay kit according to the manufacturer’s instructions. Total protein was obtained using the Kjeldahl instrument (VELP Scientifica UDK159, Milan, Italy), with protein-to-nitrogen conversing factor (N × 6.25). The moisture, ash, and lipid contents were measured using American Association of Cereal Chemists (AACC) reported protocols [16].

2.4. Multi-Scale Structure Analyses

2.4.1. Particle Size Analysis

Mastersizer 2000 (Malvern Instruments Co. Ltd., Solihull, UK) was used for particle size analysis according to a previous method [14]. Sample (1 g) was dispersed in distilled water (20 mL). The suspension was added drop-by-drop into the dispersion unit until it achieved 12% obscuration. The software recorded the mean diameter (D50), volume-weighted mean diameter (D[4, 3]), and surface-weighted mean diameter (D[3, 2]) of particle size in the range of 0.02 to 2000 μm, respectively.

2.4.2. Scanning Electron Microscopy (SEM)

Quinoa starch samples isolated by different extraction methods were pasted on an adhesive carbon tape followed by platinum coating with a sputter coater (Cressington Scientific Instruments, Cressington, UK). Sample scanning was performed at an accelerated voltage of 10 kV using the SEM (Carl ZEISS, EVO 18, Oberkochen, Germany) and images were snapped at 500×, 1000×, and 10,000× magnifications.

2.4.3. X-ray Diffraction (XRD)

The XRD patterns of the extracted starches were achieved by using D8 Advance (Bruker, Berlin, Germany). The diffractometer was set to 40 kV, 30 mA, and γ = 0.154 nm Cu Kα radiation. Scanning was performed at 0.5°/min from 4°–35° 2θ. The Jade software 6.5 version (Materials Data Inc., Livermore, CA, USA) was accessed to calculate the relative crystallinity as the ratio of peaks to the diffractogram area.

2.4.4. Small-Angle X-ray Scattering (SAXS) Analysis

The SAXS system (Anton Paar, Graz, Austria) analysis was performed at 40 kV, 50 mA, and Cu-Ka radiation with an X-ray wavelength of 0.1542 nm. The equilibrated (at 20 °C for 24 h) starch samples (60% moisture) were exposed to the X-ray pasting cell for 10 min [17]. The scattering data was recorded using the IP Reader software program, and the obtained data was further processed by the SAXS quant software 3.0 version (Bruker, Berlin, Germany).

2.4.5. Attenuated Total Reflectance-Fourier Transformed Infrared (ATR-FTIR) Spectroscopy

A spectrometer (Nicolet IS50, Thermo Fisher, Waltham, MA, USA) was used to determine the ATR-FTIR spectra according to the method reported by Mutungi et al. [18]. Sample scanning was performed automatically in the range from 1200 to 800 cm−1 spectrum baseline at 4 cm−1 resolution with an accumulation of 64 scans. The absorbance ratios (1047, 1022, and 998 cm−1) were recorded to analyze the short-range structures of starch.

2.4.6. Solid-State 13C Nuclear Magnetic Resonance (NMR) Spectroscopy

Samples were analyzed for NMR by a spectrometer (Bruker Advance III HD 400, Bruker, Berlin, Germany) at a frequency of 400 MHz. The sample (200 mg, dry starch basis) was loaded into a cylindrical partially stabilized zirconium oxide (PSZ) rotor with a diameter of 4 mm and spun at 5 kHz. The acquisition time was 50 ms with the accumulation of 2400 scans per spectrum. The NMR spectroscopy results were analyzed in accordance with the previous report [19]. The sample was boiled for 1 h and frozen immediately using liquid nitrogen to prevent retrogradation. The boiled sample was tested as an amorphous reference after XRD detection. The Peakfit software 4.0 version (Systat Software, San Jose, CA, USA) was acquired to analyze spectral peaks.

2.4.7. Laser Confocal Micro-Raman (LCM-Raman) Analysis

The Raman spectrometer equipped with a Leica microscope (Renishaw, Gloucestershire, UK) was used to analyze Raman spectra in extracted starches. The Raman system was calibrated at 532 cm−1 by using a silicon semiconductor [20]. Sample spectra were scanned in the range of 3500–0 cm−1 at a resolution of 5 cm−1. The starch molecular order was characterized by the full-width at half-maximum (FWHM) band at 480 cm−1 using the WIRE software 2.0 version (Wire Swiss GmbH, Zug, Switzerland).

2.4.8. Gel Permeation Chromatography Coupled with Multi-Angle Light Scattering (GPC-MALS)

The analysis was conducted using the GPC system (Waters, Milford, MA, USA) equipped with a MALS detector (Wyatt Technology Co., Santa Barbara, CA, USA), a refractive index detector and 2 GPC columns (Styragel HMW 7 DMF 7.8 mm × 300 mm, Styragel HMW 6E DMF 8 mm × 300 mm) detector to measure the weight-average molecular weight (Mw) and the molar mass distribution of starch samples according to the reported method [21]. The starch sample (6 mg) was accurately weighed, incubated in 1.5 mL DMSO (mobile phase filtered at 0.45 µm using a hydrophilic Teflon filter) at 80 °C for 24 h, and centrifuged at 4000× g for 10 min. The absolute ethanol (10 mL) was further added twice to the precipitate sample, again dissolved in DMSO (2 mg mL−1), and transferred to GPC phials. The sample volume (100 µL) was injected with a flow rate of 1.0 mL/min at 50 °C. Astra V software (Astra, lnc., Quezon, Philippines) was used to calculate Mw with Zimm model.

2.5. Functional Properties

2.5.1. Differential Scanning Calorimetry (DSC)

The DSC (Mettler Toledo, Schwerzenbach, Switzerland) was used to determine the thermal properties of extracted starches. The dried starch sample (3 mg) and distilled water (7 µL) were weighed accurately in a DSC pan, sealed hermetically, equilibrated at 25 °C overnight, and scanned at a 10 °C/min heating rate from 30–120 °C. The temperatures (onset, To; peak, Tp; and conclusion, Tc) and enthalpy change (ΔH) were calculated by using STARe software (Version 15.0, Mettler Toledo, Schwerzenbach, Switzerland).

2.5.2. Textural Analysis

The TA.XT Plus Texture Analyzer (Stable Micro Systems, Godalming, UK) equipped with a 36 mm diameter cylinder probe was operated at 50% compression rate and 1 mm/s speed to analyze textural analysis. The hardness, springiness, gumminess, chewiness, and resilience were analyzed by exponent software version 6 (Stable Micro Systems, Godalming, UK) according to the reported method [22].

2.5.3. In Vitro Digestion of Starch

Quinoa starch isolated by different extraction methods was subjected to cooking (100 mg dried starch in 5 mL distilled water at 100 °C for 30 min) followed by freeze-drying for 48 h. Raw (uncooked) and cooked starch samples were analyzed for in vitro digestion according to the previous method [23]. A dry starch sample (100 mg) was incubated at 37 °C in a sodium acetate buffer solution (10 mL, 0.2 M, pH 5.2) containing porcine pancreatic α-amylase (290 units/mL and amyloglucosidase (15 units/mL). The digesting aliquots (0.5 mL) were taken at different time intervals (0, 20, and 120 min) and combined with absolute ethanol (2 mL) to deactivate the enzyme. The amount of glucose released from the extracted starch was quantified by the GOPOD assay kit. The percentage of starch hydrolyzed was calculated as the multiplication of obtained glucose with a 0.9 factor. The contents of the rapidly digestible starch (RDS), slowly digestible starch (SDS), and resistant starch (RS) were obtained by the values of G20 (glucose released within 20 min) and G120 (glucose released within 120 min) as reported previously [24].

2.6. Statistical Analysis

Analyses were performed by the statistical product and service solution (SPSS, version 21.0, Inc., Chicago, IL, USA). The one-way analysis of variance (ANOVA) was conducted using Duncan’s test with a significant difference level (p ≤ 0.05). All results were shown of double experiments with their means and standard deviations, and graphs were plotted by Origin 2019b.

3. Results and Discussion

3.1. Proximal Composition

The proximate composition of quinoa starch extracted by three different methods (alkali, wet-milling, and enzymatic) is shown in Table 1. Generally, the lowest amount of lipid, protein, and mineral content obtained by an extraction method is considered the most efficient method of starch extraction, purification, and with a better product [25]. The alkali, wet-milling, and enzymatic methods exhibited no significant effect on the total starch content (98.7%, 98.6%, and 97.1%), whereas the protein (2.4%), lipid (0.5%), and ash (0.2%) contents of the enzymatic method were observed to be higher than alkali and wet-milling, and the alkali method showed the lowest amount of protein (0.6%), lipid (0.5%), and ash (0.1%) contents. It indicated that during the alkali extraction method, starch granules were steeped in sodium hydroxide (0.3% w/v), which effectively solubilized the protein matrix and largely removed the protein, the results are consistent with a previous report [25]. Moreover, a similar study conducted on tef starch extraction reported that milled tef grain steeped in sodium hydroxide produced the highest starch purity (95.0%) with the lowest protein content (0.6%) [26].

3.2. Multi-Scale Structure Characteristics

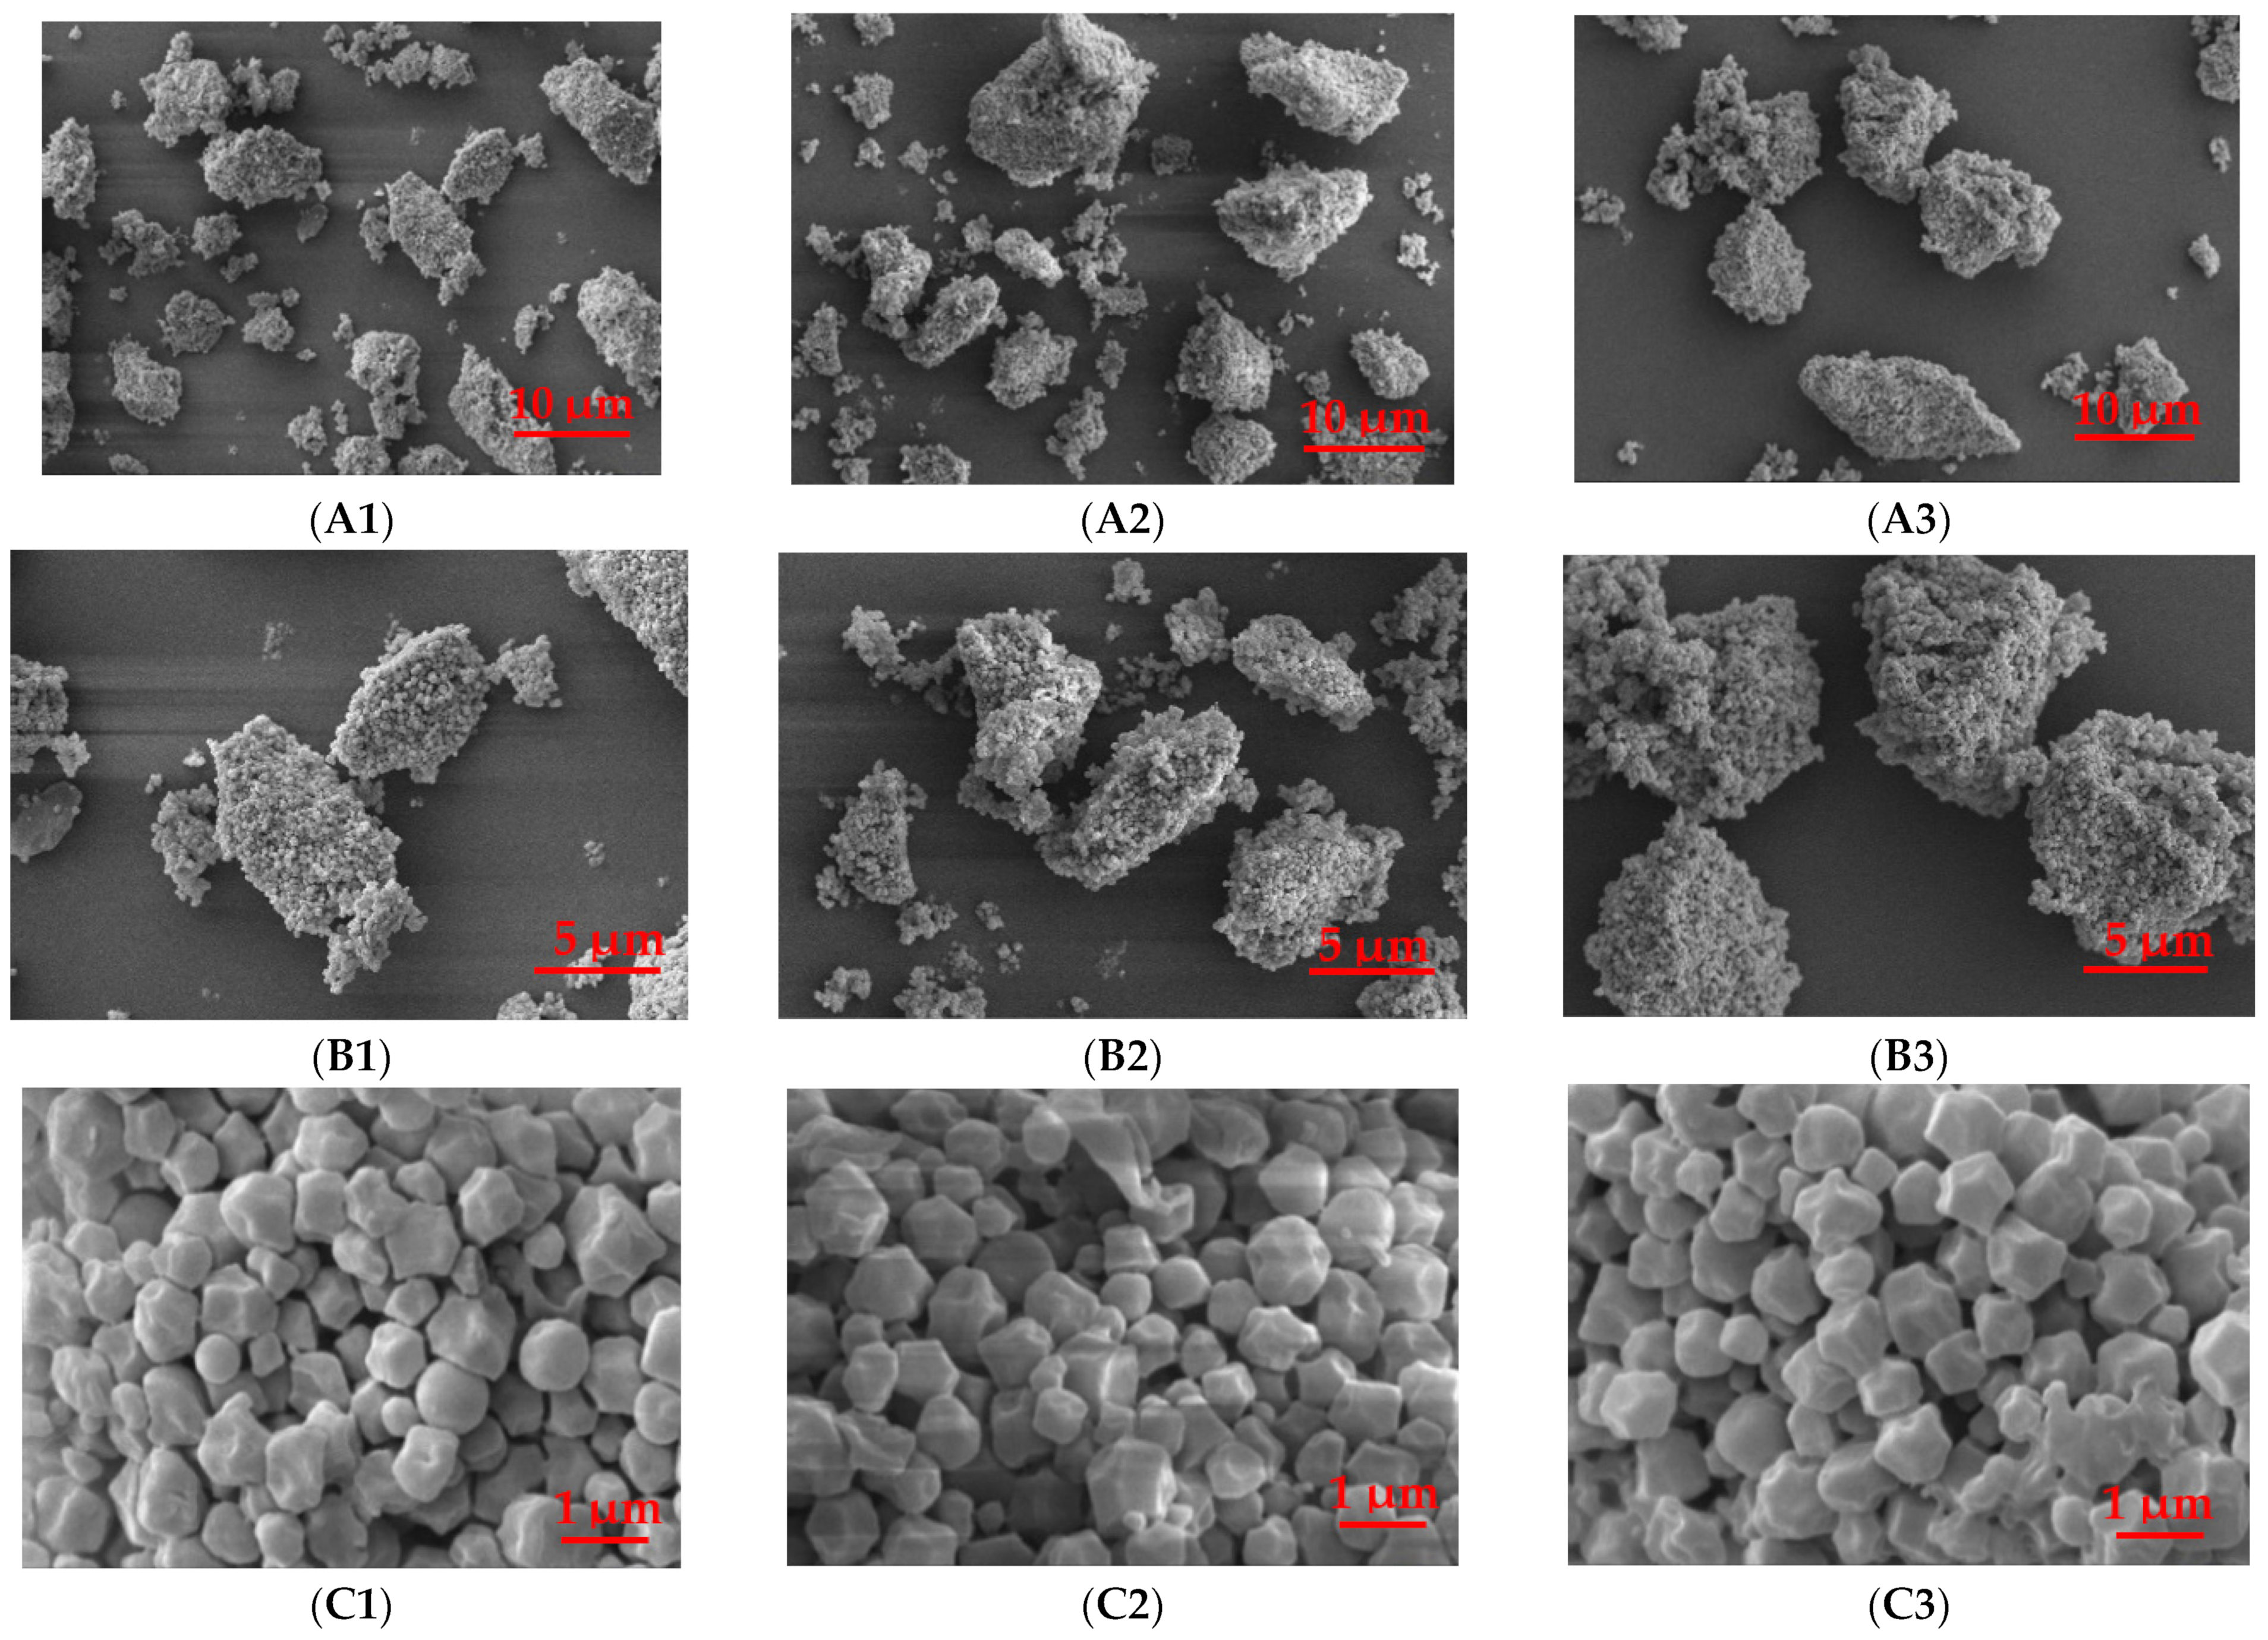
3.2.1. Starch Granule Morphology

The SEM micrographs and size distribution of quinoa starch extracted by three different methods (alkali, wet-milling, and enzymatic) are shown in Figure 1 and Table 1. The quinoa starch extracted by alkali, wet-milling, and enzymatic methods showed polygonal, angular, and irregular shapes of granules with no differences in their morphological structure, whereas the D50 (27.6, 34.9, and 44.1 μm), D[4, 3] (34.5, 39.9 and 47.7 μm), and D[3, 2] (6.2, 7.4 and 11.3 μm), respectively, showed significant differences. The size distribution of starch granules extracted by alkali, wet-milling, and enzymatic methods was observed higher (Figure 1 and Table 1) than previously suggested [2], possibly due to the aggregation of starch granules, evidenced by SEM images. A study conducted by Yu et al. on octenylsuccinylated taro starches suggested that the higher granule size could be due to the higher degree of aggregation of hydrophobically modified taro starch granules [27]. The enzymatic method showed the largest D50, D[4, 3], and D[3, 2] as compared to alkali and wet-milling. The higher D50, D[4, 3], and D[3, 2] of the enzymatic method suggests that the presence of sodium bisulfite in the enzymatic method facilitated the procurement of large starch granules [28], and could not effectively purify starch granules, while the lower D50, D[4, 3], and D[3, 2] of alkali and wet-milling methods indicated that sodium hydroxide present in the alkali method helped to penetrate water into starch followed by granule swelling and degraded amylose and amylopectin at the surface of the starch granules [29,30], whereas the wet-milling process also caused the loss of starch granules and ultimately changed the granule size distribution [9]. Moreover, Peng et al. compared the physicochemical properties and in vitro digestibility of different quinoa varieties and observed that quinoa starch was damaged due to different starch isolating methods [31].

3.2.2. Crystalline Structure

In Figure 2A and Table 2, the crystalline structure and relative crystallinity of quinoa starch extracted by alkali, enzymatic, and wet-milling methods are presented. The semi-crystalline system of starch granules is based on crystalline and amorphous regions. The XRD diffractogram exhibited the A-type structure patterns of quinoa starch samples with major peaks at 15.1°, 17.1°, 18.0° and 23.0° 2θ, consistent with previous reports [1,2]. All the extraction methods showed similar diffraction peaks with slightly lower peak intensity in alkali and wet-milling, whereas the relative crystallinity was recorded as 26.8%, 27.7%, and 29.0%, respectively, for alkali, wet-milling, and enzymatic samples. The low relative crystallinity of alkali and wet-milling methods suggests that the penetration of solvents and ions during extraction of starch possibly changed the original structure of amylose and amylopectin [32], and amylopectin is considered to be responsible for the formation of crystallites, which were possibly slightly and largely degraded at granule surface [29,30] in wet-milling and alkali methods of starch extraction.

3.2.3. Lamellar Structure

The double logarithmic SAXS patterns, including scattering vector (q), lamellar distance (D), fractal dimension (α), and scattering intensity (I) of quinoa starch extracted by different methods (alkali, wet-milling, and enzymatic) are presented in Figure 2B and Table 2. The scattering patterns of quinoa starch extracted by alkali, wet-milling, and enzymatic methods exhibited a scattering vector peak at about 0.60 nm−1, which is assumed to represent the crystalline and amorphous regions and corresponds to lamellae repeat distance or Bragg spacing [33]. No differences were found in the values of scattering vector and lamellar distance among the three methods, whereas, the fractal dimension and scattering intensity of starch granules extracted by alkali (2.3 and 13.4 nm) and wet-milling (2.5 and 13.6 nm) were reduced compared to the enzymatic (2.6 and 17.8 nm) method. The higher scattering intensity of enzymatic extraction could be related to the higher electron density between amorphous and crystalline lamellae [23]. Moreover, the higher values of fractal dimension and scattering intensity obtained by the enzymatic method suggested that possibly the amylose content of quinoa starch was partially disrupted by alkali and wet-milling methods, which caused low scattering intensity [34]. The scattering intensity of enzymatically extracted starch possessed thicker and stronger semi-crystalline lamellae, which indicated that this method has a least effect on the semi-crystalline lamellae of starch.

3.2.4. Ordered Short-Range Structure

The ATR-FTIR spectrum in other term is expressed as a short-range ordered structure or double-helical order observed in 2 µm depth of starch granules [35], and differs from the long-range ordered structure associated with packing of double helices often analyzed by XRD. The ATR-FTIR spectra of quinoa starch extracted by alkali, enzymatic, and wet-milling methods are presented in Figure 2C and Table 2. The absorbance bands at 1047, 1022, and 998 cm−1 were observed to be sensitive to starch conformation, which is related to amorphous regions of starch [36]. The absorbance ratio of 1047/1022 cm−1 and the molecular order of double helices are positively correlated with relative crystallinity than the absorbance ratio of 1047/998 cm−1 [37]. The enzymatic (0.9 and 1.2) and wet-milling (0.9 and 1.2) methods produced the higher ratios of 1047/1022 cm1 and lower ratios of 1022/998 cm1 than alkali (0.8 and 1.3). These results indicate that the alkali isolating method reduced the short-range molecular order of starch, which is consistent with the XRD data (Figure 2A). It is likely that the starch double helical structure of alkali was partially destroyed near the granule surface compared to the enzymatic and wet-milling methods, whose external granule regions were more ordered [36].

3.2.5. Solid-State NMR

NMR is a very helpful technique to determine the structural differences of samples similar in nature. The helical structure (single and double helix) changes of quinoa starch extracted by alkali, enzymatic, and wet-milling methods were analyzed by solid-state NMR spectra, and the results are shown in Figure 2D and Table 2. Generally, two types of helices are observed in the starch granules of amylopectin side chains: packed helices, which are determined by both XRD and solid-state NMR spectroscopy, whereas unpacked helices are only detected by solid-state NMR spectra [38]. The ordered proportion of solid-state NMR spectroscopy is always higher than XRD. Peaks at 97–104, 78–84, and 58–63 ppm in the spectra are attributed to C1, C4, and C6 resonances, respectively, whereas, overlapping peaks at 67–77 ppm represent C2, C3, and C5 resonances [36]. The C1 resonance in spectra corresponds to the helical and crystalline structure of A-type starch. The amorphous and helical conformation changes of starch are placed in Table 2. The single (8.2%) and double (23.1%) helical proportions of the enzymatic method were observed higher along with lower amorphous proportion (68.7%) when compared with alkali (6.7%, 21.1%, and 72.2%) and wet-milling (7.3%, 21.2%, and 71.5%). The lower proportions of single and double helices of the wet-milling method could be due to the disruption of starch intramolecular hydrogen bonds, which increased the proportion of amorphous components, possibly caused by the milling process [39]. Similarly, starch granules extracted by the alkali method contained sodium hydroxide (0.3%) that likely contributed to solubilize protein matrix [26] and degrade starch [30]. Our results are in agreement with a previous study, in which authors compared the structure of chestnut fruit starches isolated by alkali and enzymatic methods, and found that the amorphous resonances of the alkali method were higher than the enzymatic, suggesting that amorphous compounds provide broad resonances because the distribution of local molecular environment gives rise to a broad distribution of chemical shifts [7].

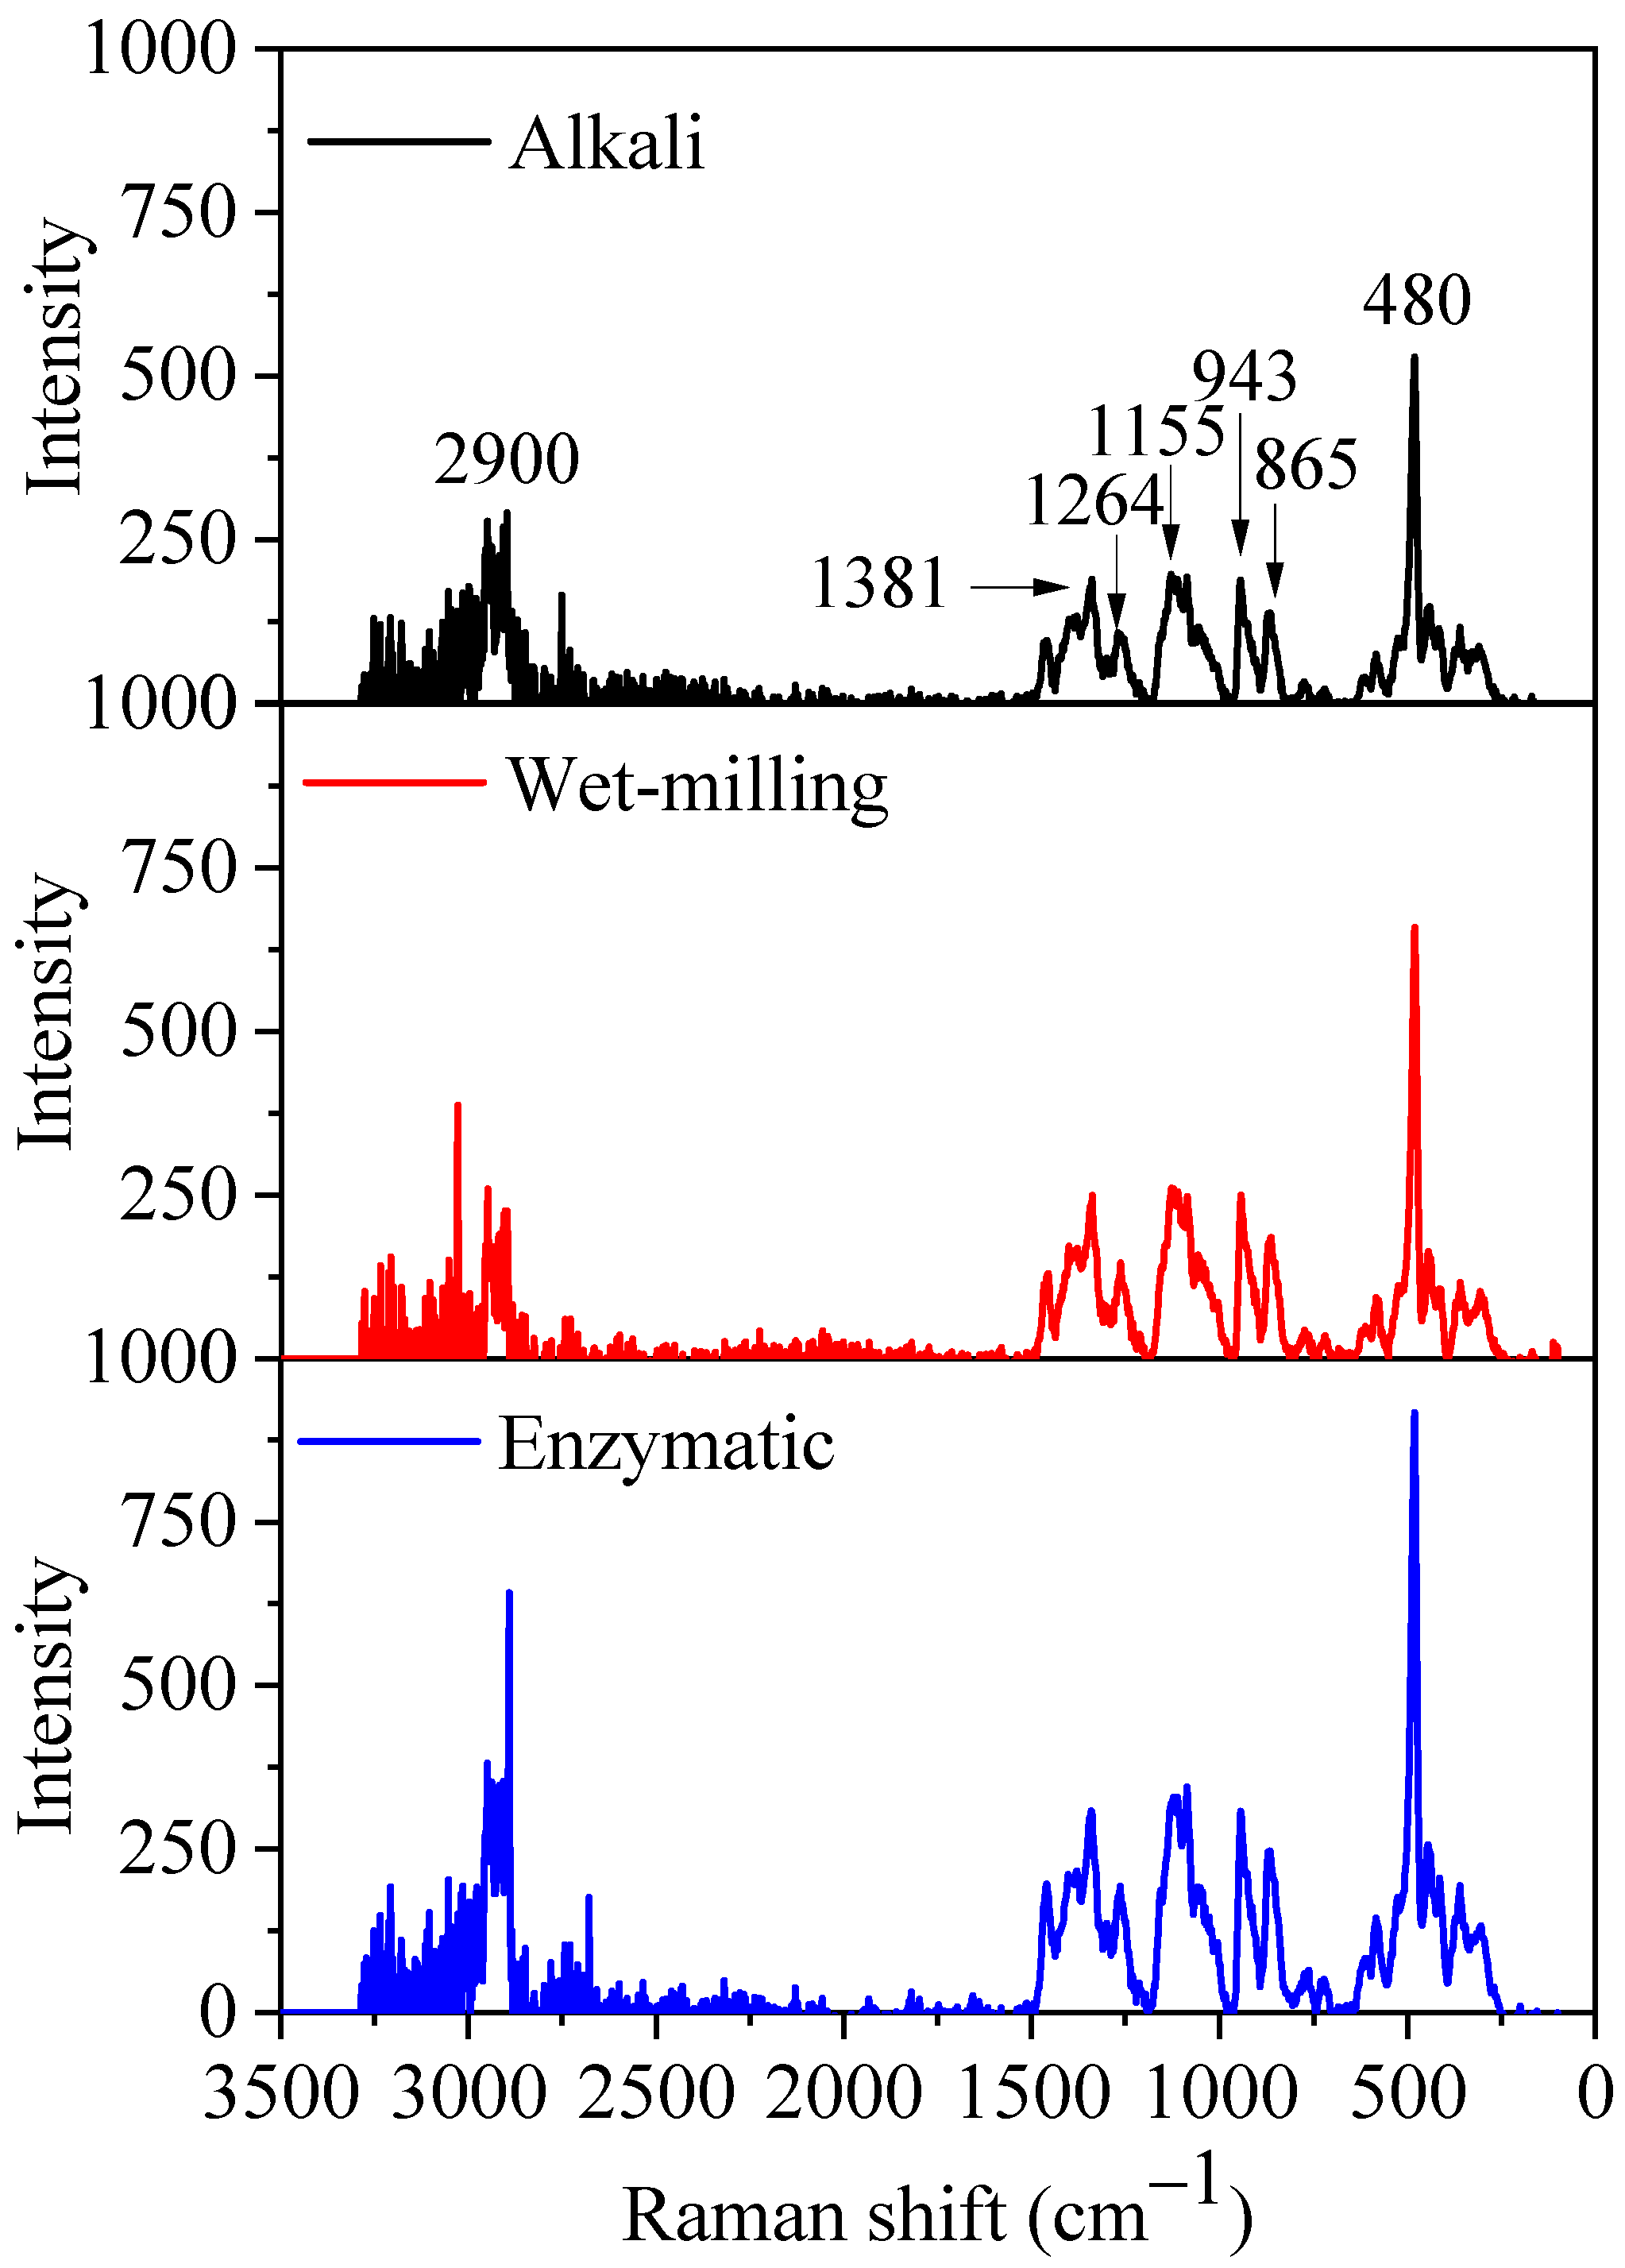
3.2.6. LCM-Raman Spectra

The LCM-Raman spectra of quinoa starch extracted by alkali, wet-milling, and enzymatic methods are shown in Figure 3. Starch Raman spectra are generally classified into three main regions: <800 cm1, 800–1500 cm1 (fingerprint region), and 2800–3000 cm1 (C–H stretch region). On the Raman spectra scale (0–3500 cm1), the sharpening bands at 480, 865, 943, 1264, and 2900 cm1 represent δ(CH2), νs(C1–O–C4′), νs(C1–O–C5), skeletal (C–C–O), and ν(C–H) modes, respectively, while the splitting bands at 1381 cm−1 and 1155 cm−1 are assigned to δ(C–OH) and δ(C–H) modes, and α-(C1–O–C4′) asymmetric stretch, respectively [40]. The narrow bands at 480 cm1 and 2900 cm1 represent the molecular order and its changes obtained from native quinoa starch granules with narrower bond energy distribution. The intensity of 480 cm1 and 2900 cm1 band was reduced in the starch samples extracted by alkali and wet-milling compared to the enzymatic method. Furthermore, the short-range ordered structural variations were studied with full-width at half-maximum (FWHM) at 480 cm1 and its results are presented in Table 2. The FWHM value of the band at 480 cm1 was recorded as 2.1, 1.7, and 1.5 for granules isolated by alkali, wet-milling, and enzymatic methods, the higher FWHM value of the alkali method confirming the disruption of the starch short-range ordered structure, consistent with XRD and FTIR results. Generally, the low FWHM values of 480 cm1 at short-range scale have been suggested to have a more ordered molecular structure with high relative crystallinity [20,41].

3.2.7. Molecular Weight and Molar Mass Ratio

The average molecular weight (Mw), average radius of gyration (Rz), and molar mass ratio (Mw/Mn) of quinoa starch extracted by different methods (alkali, wet-milling, and enzymatic) are presented in Table 2. The GPC-MALS analysis of enzymatically extracted granules revealed the higher Mw (1.58 × 10⁷ g/moL) and Rz (106.8 nm) than wet-milling (1.18 × 10⁷ g/moL and 101.1 nm) and alkali (1.13 × 10⁵ g/moL and 41.6 nm), whereas the Mw/Mn of the enzymatic method (1.3) was observed to be lower compared to alkali (2.7), but slightly higher than wet-milling (1.2). The higher Mw and Rz of the enzymatic method indicate the greater molecules with a larger molecular size of the amylopectin, whereas the low Mw and Rz values of the alkali and wet-milling methods suggest that amylose and amylopectin molecules of starch granules were possibly disintegrated into less super molecular components due to the high pH value in the alkali method [42], as well as high milling intensity [43], which eventually damage the morphological, crystalline, and molecular structure of starch. Furthermore, Zhao et al. soaked rice powder in 0.45% sodium metabisulfite for 18 h at 4 °C, followed by mixing with protease for overnight to extract rice starch and observed the largest amylopectin molecular weight, which suggested that protease had the least effect on extracted starch [15].

3.3. Functional Properties

3.3.1. Thermal Properties

The results of quinoa starch thermal properties extracted by alkali, wet-milling, and enzymatic methods are shown in Table 3. The DSC onset temperature (To), peak temperature (Tp), and conclusion temperature (Tc) of gelatinization represent the hydrothermal stability of the starch crystalline structure, and enthalpy change (ΔH) corresponds to the loss of the starch granule molecular (double-helical) structure [44]. The To, Tp, Tc, and ΔH of the enzymatic (82.1, 83.8, 86.3 °C, and 6.8 J/g) extraction method were significantly higher than wet-milling (66.3, 70.0, 76.2 °C, and 6.7 J/g), and alkali (61.7, 67.8, 75.9 °C, and 5.4 J/g). All the above characteristic temperatures and ΔH exhibited the order of enzymatic > wet-milling > alkali. The results contrast the previous study of Correia et al., who studied the thermal properties of Portuguese nuts starches isolated by alkaline and enzymatic methods and observed similar gelatinization temperatures (61.5–63.0 °C) [45]. However, the differences observed in our study could be due to the granule size, microstructure, order of crystalline regions, ratio of amylose to amylopectin, and minor components [45]. The higher To, Tp, Tc, and ΔH exhibited by the enzymatic method containing large starch granules inhibited the gelatinization, water absorption, and eventually lowered granule swelling, which were most likely exerted by the minor components (i.e., protein and lipids) [46,47]. The To, Tp, Tc, and ΔH of the enzymatic method are positively correlated to their particle size D50 (Table 1). A similar study conducted on large and small wheat starch granules suggested that large granules showed higher To, Tp, Tc, and ΔH with high relative crystallinity than compared to small granules [48]. Another study conducted on rice starch granules showed that small particles were observed with low To, Tp, Tc, and ΔH [49]. The gelatinization temperatures of alkali and wet-milling methods highly ranged from onset to end set temperatures, suggesting the presence of crystallites of varying stability in the granule crystalline domains, whereas enzymatically extracted starch of the higher To, Tp, and ΔH with narrow temperature range suggests that it possibly has higher molecular order [45]. Thus, enzymatic method better preserves the molecular order.

3.3.2. Textural Properties

Textural properties are described in terms such as hard, soft, liquid, solid, rough, smooth, creamy, crispy, lumpy, gritty, etc., to assess the quality of a product, which is related to density, viscosity, surface tension, and other physical properties of the specific product [50]. Table 3 shows the textural properties (hardness, springiness, gumminess, chewiness, and resilience) of quinoa starch extracted by alkali, wet-milling, and enzymatic methods. The enzymatic method of extraction showed the highest values of hardness (238.8 N), springiness (0.8), gumminess (105.6 N), chewiness (80.2 N), and resilience (0.2) compared with the wet-milling (192.7 N, 0.6, 91.3 N, 54.9 N, and 0.1) and alkali (160.5 N, 0.3, 41.5 N, 13.5 N, and 0.1) methods. On the other hand, the alkali had poor textural properties. The highest textural values of the enzymatic method suggest the presence of less compact gas cells with high specific volume [51] and elasticity [22]. We assume that the starch granules extracted by enzymatic method probably had rigid structure with higher proportion of long branch chains of amylopectin [52]. Furthermore, a study conducted on yam starch and observed the higher texture parameters with larger starch granule size and lower amylose content, whereas lower texture properties in counterparts was suggested due to partial hydrolysis of granules [53].

3.3.3. In Vitro Digestion Properties

The impact of starch extraction methods (alkali, wet-milling, and enzymatic) on in vitro digestion properties (RDS, SDS, and RS) of raw (uncooked) and cooked quinoa starch was investigated, and the obtained results are presented in Table 3. During the starch hydrolysis of 0–120 min, uncooked starch of the enzymatic extraction method showed the lowest RDS (77.1%) and SDS (7.5%), and the highest RS (15.4%) contents compared to alkali (86.6%, 5.2%, and 8.2%) and wet-milling (85.4%, 5.9%, and 8.6%). Similarly, the hydrolysis of cooked starch extracted by wet-milling and alkali was observed with the highest RDS (87.7% and 88.3%) and SDS (4.1% and 3.9%), and the lowest RS (7.6% and 7.9%) compared to the enzymatic method (81.9%, 4.8%, and 13.9%). The RDS, SDS, and RS contents of cooked starch were observed significantly higher than those of uncooked starch. The results suggested that the enzymatic method of starch extraction resisted more in vitro digestion in both uncooked and cooked conditions. Previous studies have reported that digestion of starch is affected by size, crystallinity, polymerization, non-starch components, and amylose/amylopectin ratio [54,55]. The resistance of the enzymatic extraction method might be due to its large granule size, which limited gelatinization by inhibiting hydration and swelling, prevented the enzyme from substrate accessibility, and eventually reduced starch digestion [56]. The small amounts of protein and lipids surrounded by starch possibly played their roles in reducing starch swelling [57]. Furthermore, SDS and RS contents are positively correlated with enthalpy and relative crystallinity, and higher crystallinity and enthalpy reduce starch digestion [58].

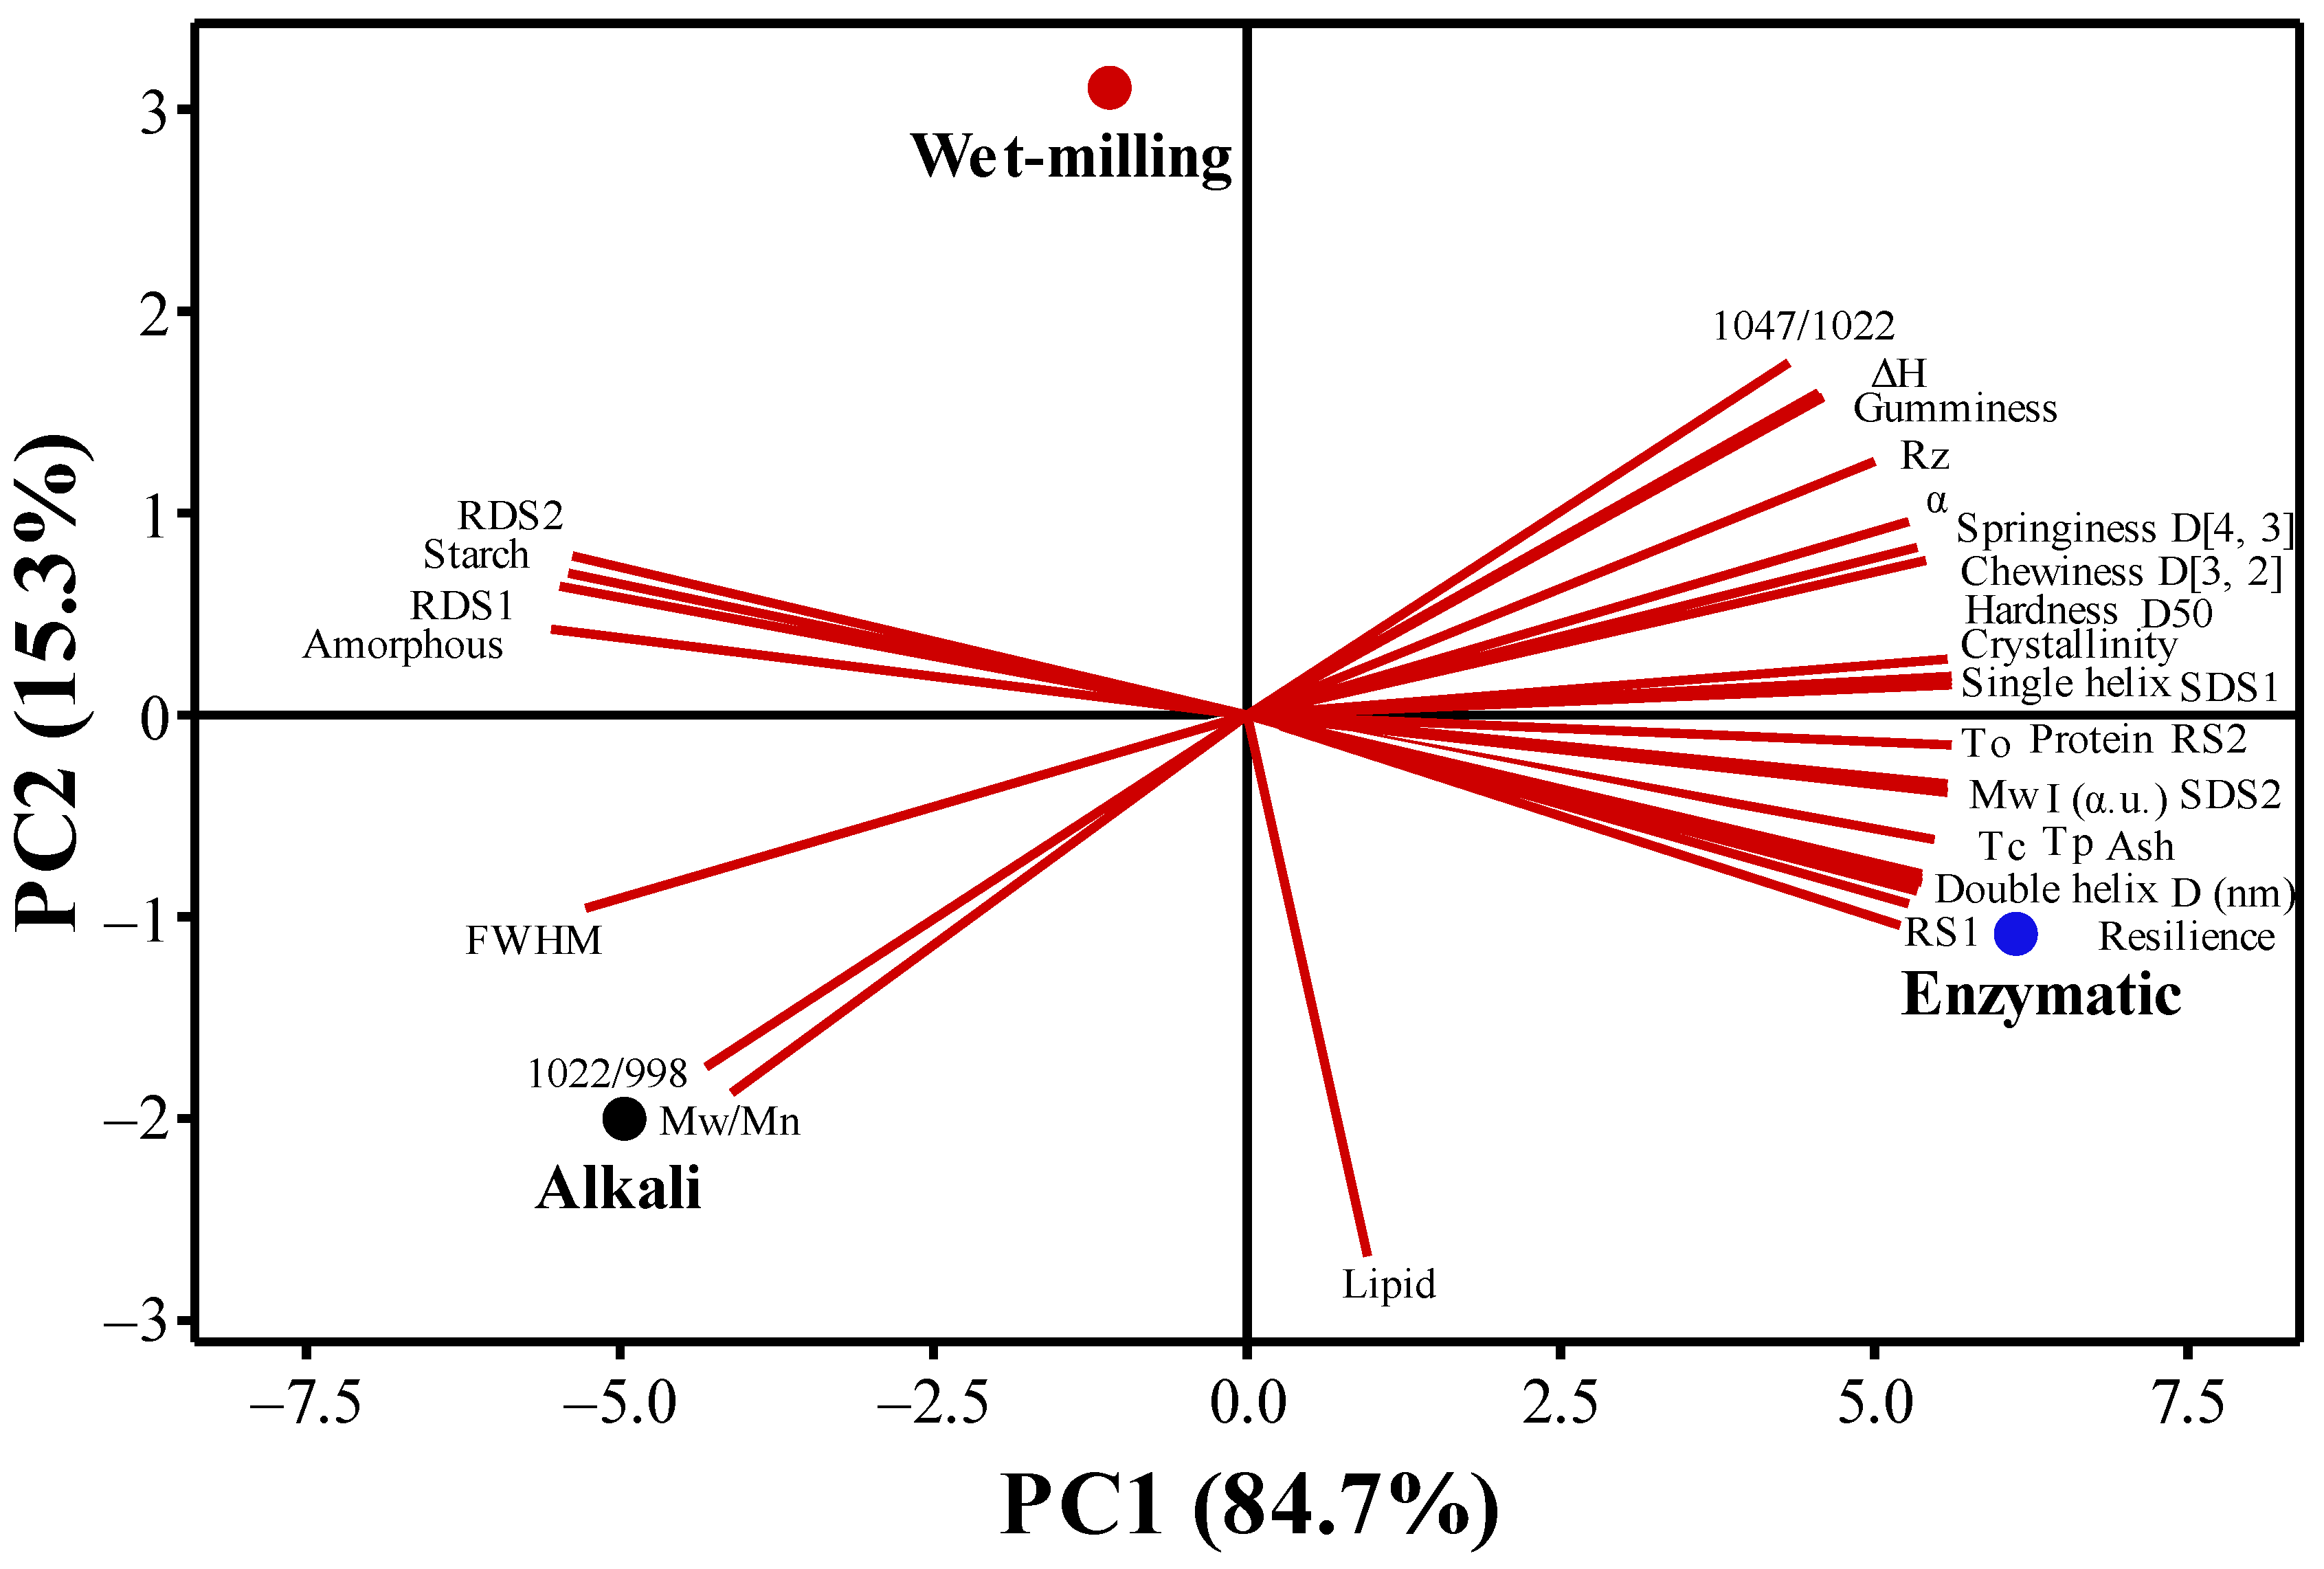
3.3.4. Principal Component Analysis (PCA)

The multi-scale structure and functional characteristics of quinoa starch obtained by different methods of extraction (alkali, wet-milling, and enzymatic) were compared by PCA. The similarities, differences, and distribution of quality attributes defined by the first and second PCA dimensions of the starch samples isolated by alkali, wet-milling, and enzymatic methods are shown in Figure 4. The PC1 principal component showed the majority of variability with 84.7% and PC2 exhibited 15.3% variability, while the sum of PC1 and PC2 was observed to have 100% of the variations among starch samples. The starch samples extracted by alkali and wet-milling methods were observed on the negative side of the PC1, while the enzymatic method remained on the positive side of the PC1. According to the principal component analysis score (Table 4), the quinoa starch extracted by the enzymatic method has better multi-scale structure and functional characteristics.

4. Conclusions

In this study, quinoa starch was extracted by alkali, wet-milling, and enzymatic methods to investigate the impact of extraction methods on starch multi-scale structures and functional properties. The morphological, compositional, multi-scale structural (i.e., XRD, SAXS, FTIR, NMR, LCM-Raman and GPC), thermal, textural, and in vitro digestion analyses were subsequently performed. Starch granules extracted by the enzymatic method exhibited the larger size of aggregated granules, higher protein content, relative crystallinity, semi-crystalline lamellae, absorbance ratios of 1047/1022 and 1022/998 cm−1, helical structure content, Mw, and lower FWHM ratio at 480 cm−1 compared with wet-milling and alkali methods. Furthermore, the enzymatic method increased the texture properties (i.e., hardness, springiness, gumminess, chewiness, and resilience), SDS, and RS content. The corresponding methods, on the other hand, reduced the gelatinization and RDS. From these results, it is concluded that extraction methods induce significant structural differences in starch granules. Enzymatic extraction is the more appropriate method to retain the intact structure of starch, whereas the alkali method is highly effective in the extraction and purification of starch, which may lead to different functional properties and industrial applications.

Author Contributions

S.A.J.: formal analysis, writing—original draft, review and editing; J.W.: investigation, writing—review and editing; Y.L.: writing—review and editing; R.J.: writing—review and editing; Y.Z.: conceptualization, methodology, writing—review and editing, correspondence, and supervision; S.L.: investigation, formal analysis, writing—review and editing, funding acquisition, correspondence, supervision. All authors have read and agreed to the published version of the manuscript.

Funding

This work is supported by the Open Project Program of State Key Laboratory of Food Nutrition and Safety, Tianjin University of Science & Technology (SKLFNS-KF-202107), the Open Fund of State Key Laboratory of Tea Plant Biology and Utilization (SKLTOF20200110 and SKLTOF20210114), the National Natural Science Foundation of China (82000791 and 32172162), the Natural Science Foundation of Jiangsu Province (BK20220585), the China Postdoctoral Science Foundation (2022M712692), and the Yangzhou Lvyangjinfeng Talent Support Program (YZLYJFJH2021YXBS172).

Institutional Review Board Statement

Not applicable.

Informed Consent Statement

Not applicable.

Data Availability Statement

Data is contained within the article.

Acknowledgments

We gratefully acknowledge the support of the Open Project Program of State Key Laboratory of Food Nutrition and Safety, Tianjin University of Science & Technology (SKLFNS-KF-202107), the Open Fund of State Key Laboratory of Tea Plant Biology and Utilization (SKLTOF20200110 and SKLTOF20210114), the National Natural Science Foundation of China (82000791 and 32172162), the Natural Science Foundation of Jiangsu Province (BK20220585), the China Postdoctoral Science Foundation (2022M712692), and the Yangzhou Lvyangjinfeng Talent Support Program (YZLYJFJH2021YXBS172). Shahid Ahmed Junejo gratefully acknowledges the financial support from the China Scholarship Council.

Conflicts of Interest

The authors confirm that they have no conflict of interest to declare for this publication.

Abbreviations

SPSS: Statistical product and service solution; GOPOD, glucose oxidase-peroxidase reagent; DSC, differential scanning calorimetry; ANOVA, analysis of variance; SEM, scanning electron microscopy; XRD, X-ray diffraction; ATR-FTIR, attenuated total reflectance-fourier transformed infrared; SAXS, small-angle X-ray scattering; LCM-Raman, laser confocal micro-Raman; MAS NMR, magic-angle spinning nuclear magnetic resonance; GPC-MALS, gel permeation chromatography coupled with multi-angle light scattering; FWHM, full-width at half-maximum; RDS, rapidly digestible starch; SDS, slowly digestible starch; RS, resistant starch; PCA, principal component analysis.

References

  1. Jan, K.N.; Panesar, P.; Rana, J.; Singh, S. Structural, thermal and rheological properties of starches isolated from Indian quinoa varieties. Int. J. Biol. Macromol. 2017, 102, 315–322. [Google Scholar] [CrossRef] [PubMed]
  2. Li, G.; Zhu, F. Quinoa starch: Structure, properties, and applications. Carbohydr. Polym. 2018, 181, 851–861. [Google Scholar] [CrossRef] [PubMed]
  3. Li, G.; Zhu, F. Amylopectin molecular structure in relation to physicochemical properties of quinoa starch. Carbohydr. Polym. 2017, 164, 396–402. [Google Scholar] [CrossRef] [PubMed]
  4. Li, G.; Zhu, F. Effect of high pressure on rheological and thermal properties of quinoa and maize starches. Food Chem. 2018, 241, 380–386. [Google Scholar] [CrossRef]
  5. Adigwe, O.P.; Egharevba, H.O.; Emeje, M.O. Starch: A Veritable Natural Polymer for Economic Revolution. In Starch—Evolution and Recent Advances; IntechOpen: London, UK, 2022. [Google Scholar] [CrossRef]
  6. Burrell, M.M. Starch: The need for improved quality or quantity--an overview. J. Exp. Bot. 2003, 54, 451–456. [Google Scholar] [CrossRef]
  7. Correia, P.; Cruz-Lopes, L.; Beirão-Da-Costa, L. Morphology and structure of chestnut starch isolated by alkali and enzymatic methods. Food Hydrocoll. 2012, 28, 313–319. [Google Scholar] [CrossRef]
  8. Correia, P.R.; Beirão-Da-Costa, M.L. Chestnut and acorn starch properties affected by isolation methods. Starch Stärke 2010, 62, 421–428. [Google Scholar] [CrossRef]
  9. Syahariza, Z.; Li, E.; Hasjim, J. Extraction and dissolution of starch from rice and sorghum grains for accurate structural analysis. Carbohydr. Polym. 2010, 82, 14–20. [Google Scholar] [CrossRef]
  10. Tan, I.; Wee, C.; Sopade, P.; Halley, P. Investigation of the starch gelatinisation phenomena in water–glycerol systems: Application of modulated temperature differential scanning calorimetry. Carbohydr. Polym. 2004, 58, 191–204. [Google Scholar] [CrossRef]
  11. Nadiha, M.N.; Fazilah, A.; Bhat, R.; Karim, A.A. Comparative susceptibilities of sago, potato and corn starches to alkali treatment. Food Chem. 2010, 121, 1053–1059. [Google Scholar] [CrossRef]
  12. Singh, N.; Sandhu, K.S.; Kaur, M. Characterization of starches separated from Indian chickpea (Cicer arietinum L.) cultivars. J. Food Eng. 2004, 63, 441–449. [Google Scholar] [CrossRef]
  13. Li, S.; Zhou, Y.; Liu, M.; Zhang, Y.; Cao, S. Nutrient composition and starch characteristics of Quercus glandulifera Bl. seeds from China. Food Chem. 2015, 185, 371–376. [Google Scholar] [CrossRef] [PubMed]
  14. Li, S.; Zhang, B.; Tan, C.P.; Li, C.; Fu, X.; Huang, Q. Octenylsuccinate quinoa starch granule-stabilized Pickering emulsion gels: Preparation, microstructure and gelling mechanism. Food Hydrocoll. 2019, 91, 40–47. [Google Scholar] [CrossRef]
  15. Zhao, Y.; Tan, X.; Wu, G.; Gilbert, R.G. Using molecular fine structure to identify optimal methods of extracting starch. Starch Stärke 2020, 72, 1900214. [Google Scholar] [CrossRef]
  16. AACC. Approved Methods of the American Association of Cereal Chemists, 10th ed.; AACC: St. Paul, MN, USA, 2000. [Google Scholar]
  17. Zhang, B.; Zhao, Y.; Li, X.; Li, L.; Xie, F.; Chen, L. Supramolecular structural changes of waxy and high-amylose cornstarches heated in abundant water. Food Hydrocoll. 2014, 35, 700–709. [Google Scholar] [CrossRef]
  18. Mutungi, C.; Onyango, C.; Doert, T.; Paasch, S.; Thiele, S.; Machill, S.; Jaros, D.; Rohm, H. Long- and short-range structural changes of recrystallised cassava starch subjected to in vitro digestion. Food Hydrocoll. 2011, 25, 477–485. [Google Scholar] [CrossRef]
  19. Tan, I.; Flanagan, B.M.; Halley, P.J.; Whittaker, A.K.; Gidley, M.J. A method for estimating the nature and relative proportions of amorphous, single, and double-helical components in starch granules by 13C CP/MAS NMR. Biomacromolecules 2007, 8, 885–891. [Google Scholar] [CrossRef] [PubMed]
  20. Li, X.; Yue, X.; Huang, Q.; Zhang, B. Effects of wet-media milling on multi-scale structures and in vitro digestion of tapioca starch and the structure-digestion relationship. Carbohydr. Polym. 2022, 284, 119176. [Google Scholar] [CrossRef]
  21. Liu, K.; Zhang, B.; Chen, L.; Li, X.; Zheng, B. Hierarchical structure and physicochemical properties of highland barley starch following heat moisture treatment. Food Chem. 2019, 271, 102–108. [Google Scholar] [CrossRef] [PubMed]
  22. Özkaya, B.; Baumgartner, B.; Özkaya, H. Effects of concentrated and dephytinized wheat bran and rice bran addition on bread properties. J. Texture Stud. 2018, 49, 84–93. [Google Scholar] [CrossRef]
  23. Yuan, T.; Ye, F.; Chen, T.; Li, M.; Zhao, G. Structural characteristics and physicochemical properties of starches from winter squash (Cucurbita maxima Duch.) and pumpkin (Cucurbita moschata Duch. ex Poir.). Food Hydrocoll. 2022, 122, 107115. [Google Scholar] [CrossRef]
  24. Englyst, H.N.; Kingman, S.M.; Cummings, J.H. Classification and measurement of nutritionally important starch fractions. Eur. J. Clin. Nutr. 1992, 46 (Suppl. S2), S33–S50. [Google Scholar] [PubMed]
  25. El Halal, S.L.M.; Kringel, D.H.; Zavareze, E.D.R.; Dias, A.R.G. Methods for extracting cereal starches from different sources: A Review. Starch Stärke 2019, 71, 1900128. [Google Scholar] [CrossRef]
  26. Nyakabau, T.; Wokadala, O.C.; Emmambux, M.N. Effect of steeping additives on tef starch extraction and its quality. Starch Stärke 2013, 65, 738–746. [Google Scholar] [CrossRef]
  27. Yu, Z.-Y.; Jiang, S.-W.; Zheng, Z.; Cao, X.-M.; Hou, Z.-G.; Xu, J.-J.; Wang, H.-L.; Jiang, S.-T.; Pan, L.-J. Preparation and properties of OSA-modified taro starches and their application for stabilizing Pickering emulsions. Int. J. Biol. Macromol. 2019, 137, 277–285. [Google Scholar] [CrossRef] [PubMed]
  28. Estrada-León, R.J.; Moo-Huchin, V.M.; Ríos-Soberanis, C.; Betancur-Ancona, D.; May, L.; Carrillo-Sánchez, F.; Cervantes-Uc, J.; Pérez-Pacheco, E. The effect of isolation method on properties of parota (Enterolobium cyclocarpum) starch. Food Hydrocoll. 2016, 57, 1–9. [Google Scholar] [CrossRef]
  29. Singh, S.; Thakur, S.; Singh, M.; Kumar, A.; Kumar, A.; Kumar, A.; Punia, R.; Kushwaha, J.; Kumar, R.; Singh, H. Influence of different isolation methods on physicochemical and rheological properties of native and heat-moisture-treated chickpea starch. J. Food Process. Preserv. 2018, 42, e13523. [Google Scholar] [CrossRef]
  30. Han, J. Structural changes in corn starches during alkaline dissolution by vortexing. Carbohydr. Polym. 2004, 55, 193–199. [Google Scholar] [CrossRef]
  31. Peng, M.; Yin, L.; Dong, J.; Shen, R.; Zhu, Y. Physicochemical characteristics and in vitro digestibility of starches from colored quinoa (Chenopodium quinoa) varieties. J. Food Sci. 2022, 87, 2147–2158. [Google Scholar] [CrossRef]
  32. Palacios-Fonseca, A.; Castro-Rosas, J.; Gómez-Aldapa, C.; Tovar-Benítez, T.; Millán-Malo, B.; Del Real, A.; Rodriguez-Garcia, M.E.; Gomez-Aldapa, C. Effect of the alkaline and acid treatments on the physicochemical properties of corn starch. CyTA-J. Food 2013, 11, 67–74. [Google Scholar] [CrossRef]
  33. Tan, X.; Zhang, B.; Chen, L.; Li, X.; Li, L.; Xie, F. Effect of planetary ball-milling on multi-scale structures and pasting properties of waxy and high-amylose cornstarches. Innov. Food Sci. Emerg. Technol. 2015, 30, 198–207. [Google Scholar] [CrossRef]
  34. Koroteeva, D.A.; Kiseleva, V.; Krivandin, A.V.; Shatalova, O.V.; Blaszczak, W.; Bertoft, E.; Piyachomkwan, K.; Yuryev, V.P. Structural and thermodynamic properties of rice starches with different genetic background: Part 2. Defectiveness of different supramolecular structures in starch granules. Int. J. Biol. Macromol. 2007, 41, 534–547. [Google Scholar] [CrossRef] [PubMed]
  35. Li, H.; Wen, Y.; Wang, J.; Sun, B. Relations between chain-length distribution, molecular size, and amylose content of rice starches. Int. J. Biol. Macromol. 2018, 120, 2017–2025. [Google Scholar] [CrossRef] [PubMed]
  36. Liu, C.; Jiang, Y.; Liu, J.; Li, K.; Li, J. Insights into the multiscale structure and pasting properties of ball-milled waxy maize and waxy rice starches. Int. J. Biol. Macromol. 2021, 168, 205–214. [Google Scholar] [CrossRef]
  37. Man, J.; Yang, Y.; Zhang, C.; Zhou, X.; Dong, Y.; Zhang, F.; Liu, Q.; Wei, C. Structural changes of high-amylose rice starch residues following in vitro and in vivo digestion. J. Agric. Food Chem. 2012, 60, 9332–9341. [Google Scholar] [CrossRef]
  38. Cooke, D.; Gidley, M.J. Loss of crystalline and molecular order during starch gelatinisation: Origin of the enthalpic transition. Carbohydr. Res. 1992, 227, 103–112. [Google Scholar] [CrossRef]
  39. Dhital, S.; Shrestha, A.K.; Flanagan, B.M.; Hasjim, J.; Gidley, M.J. Cryo-milling of starch granules leads to differential effects on molecular size and conformation. Carbohydr. Polym. 2011, 84, 1133–1140. [Google Scholar] [CrossRef]
  40. Mutungi, C.; Passauer, L.; Onyango, C.; Jaros, D.; Rohm, H. Debranched cassava starch crystallinity determination by Raman spectroscopy: Correlation of features in Raman spectra with X-ray diffraction and 13C CP/MAS NMR spectroscopy. Carbohydr. Polym. 2012, 87, 598–606. [Google Scholar] [CrossRef]
  41. Wang, S.; Wang, J.; Zhang, W.; Li, C.; Yu, J.; Wang, S. Molecular order and functional properties of starches from three waxy wheat varieties grown in China. Food Chem. 2015, 181, 43–50. [Google Scholar] [CrossRef]
  42. Praznik, W.; Buksa, K.; Ziobro, R.; Gambuś, H.; Nowotna, A. The effect of long-term alkali treatment on the molecular characteristics of native and extruded starches at 35 °C. Starch Stärke 2012, 64, 890–897. [Google Scholar] [CrossRef]
  43. Wang, Q.; Li, L.; Zheng, X. A review of milling damaged starch: Generation, measurement, functionality and its effect on starch-based food systems. Food Chem. 2020, 315, 126267. [Google Scholar] [CrossRef] [PubMed]
  44. Zhang, B.; Wang, K.; Hasjim, J.; Li, E.; Flanagan, B.M.; Gidley, M.J.; Dhital, S. Freeze-drying changes the structure and digestibility of B-polymorphic starches. J. Agric. Food Chem. 2014, 62, 1482–1491. [Google Scholar] [CrossRef] [PubMed]
  45. Correia, P.; Nunes, M.C.; Beirão-Da-Costa, M.L. The effect of starch isolation method on physical and functional properties of Portuguese nut starches. II. Q. rotundifolia Lam. and Q. suber Lam. acorns starches. Food Hydrocoll. 2013, 30, 448–455. [Google Scholar] [CrossRef]
  46. Edwards, C.H.; Warren, F.J.; Campbell, G.M.; Gaisford, S.; Royall, P.G.; Butterworth, P.J.; Ellis, P.R. A study of starch gelatinisation behaviour in hydrothermally-processed plant food tissues and implications for in vitro digestibility. Food Funct. 2015, 6, 3634–3641. [Google Scholar] [CrossRef] [PubMed]
  47. Waigh, T.A.; Gidley, M.J.; Komanshek, B.U.; Donald, A.M. The phase transformations in starch during gelatinisation: A liquid crystalline approach. Carbohydr. Res. 2000, 328, 165–176. [Google Scholar] [CrossRef]
  48. Vermeylen, R.; Goderis, B.; Reynaers, H.; Delcour, J.A. Gelatinisation related structural aspects of small and large wheat starch granules. Carbohydr. Polym. 2005, 62, 170–181. [Google Scholar] [CrossRef]
  49. Liu, J.; Zhaowei, L.; Zhou, L.; Cao, Z.; Shi, C.; Cheng, F. Influence of environmental temperature during grain filling period on granule size distribution of rice starch and its relation to gelatinization properties. J. Cereal Sci. 2017, 76, 42–55. [Google Scholar] [CrossRef]
  50. Pascua, Y.; Koç, H.; Foegeding, E.A. Food structure: Roles of mechanical properties and oral processing in determining sensory texture of soft materials. Curr. Opin. Colloid Interface Sci. 2013, 18, 324–333. [Google Scholar] [CrossRef]
  51. Patil, S.S.; Rudra, S.G.; Varghese, E.; Kaur, C. Effect of extruded finger millet (Eleusine coracan L.) on textural properties and sensory acceptability of composite bread. Food Biosci. 2016, 14, 62–69. [Google Scholar] [CrossRef]
  52. Wang, S.; Li, P.; Yu, J.; Guo, P.; Wang, S. Multi-scale structures and functional properties of starches from Indica hybrid, Japonica and waxy rice. Int. J. Biol. Macromol. 2017, 102, 136–143. [Google Scholar] [CrossRef]
  53. Reddy, C.K.; Haripriya, S.; Mohamed, A.N.; Suriya, M. Preparation and characterization of resistant starch III from elephant foot yam (Amorphophallus paeonifolius) starch. Food Chem. 2014, 155, 38–44. [Google Scholar] [CrossRef] [PubMed]
  54. Ye, J.; Hu, X.; Luo, S.; Liu, W.; Chen, J.; Zeng, Z.; Liu, C. Properties of starch after extrusion: A Review. Starch Stärke 2018, 70, 1700110. [Google Scholar] [CrossRef]
  55. Mahasukhonthachat, K.; Sopade, P.; Gidley, M. Kinetics of starch digestion and functional properties of twin-screw extruded sorghum. J. Cereal Sci. 2010, 51, 392–401. [Google Scholar] [CrossRef]
  56. Martens, B.M.J.; Gerrits, W.J.J.; Bruininx, E.M.A.M.; Schols, H.A. Amylopectin structure and crystallinity explains variation in digestion kinetics of starches across botanic sources in an in vitro pig model. J. Anim. Sci. Biotechnol. 2018, 9, 91. [Google Scholar] [CrossRef] [PubMed]
  57. Ye, J.; Hu, X.; Luo, S.; McClements, D.J.; Liang, L.; Liu, C. Effect of endogenous proteins and lipids on starch digestibility in rice flour. Food Res. Int. 2018, 106, 404–409. [Google Scholar] [CrossRef]
  58. Chung, H.-J.; Lim, H.S.; Lim, S.-T. Effect of partial gelatinization and retrogradation on the enzymatic digestion of waxy rice starch. J. Cereal Sci. 2006, 43, 353–359. [Google Scholar] [CrossRef]
Figure 1. SEM images of quinoa starch isolated by alkali (A1C1), wet-milling (A2C2), and enzymatic (A3C3) methods at 500×, 1000×, and 10000× magnifications.
Foods 11 02625 g001
Figure 2. XRD (A), SAXS (B), FTIR (C), and NMR (D) spectrum of quinoa starch isolated by three different methods (alkali, wet-milling, and enzymatic). The XRD values in parentheses show the relative crystallinity of quinoa starch.
Foods 11 02625 g002
Figure 3. Raman spectrum of quinoa starch subjected to three different methods (alkali, wet-milling, and enzymatic).
Foods 11 02625 g003
Figure 4. The PC1 and PC2 double dimensional plots of quinoa starch extracted by alkali, wet-milling, and enzymatic methods.
Foods 11 02625 g004
Table 1. Proximate composition and particle size of quinoa starch isolated by three different methods (alkali, wet-milling, and enzymatic) A.
VariablesAlkaliWet-millingEnzymatic
Composition (DB) B
Total starch content (%)98.7 ± 1.5 a98.6 ± 1.1 a97.1 ± 0.8 a
Protein content (%)0.6 ± 0.1 c0.9 ± 0.1 b2.4 ± 0.0 a
Lipid content (%)0.5 ± 0.0 a0.3 ± 0.0 b0.5 ± 0.0 a
Ash content (%)0.1 ± 0.0 b0.1 ± 0.0 b0.2 ± 0.0 a
Granule size distribution C
D50 (μm)27.6 ± 4.5 c34.9 ± 0.4 b44.1 ± 3.2 a
D[4, 3] (μm)34.5 ± 3.6 b39.9 ± 2.8 b47.7 ± 0.3 a
D[3, 2] (μm)6.2 ± 0.7 c7.4 ± 0.2 b11.3 ± 0.7 a
A The data are means and standard deviation of double experiments. The values in the row with different superscripted letters are significant (p < 0.05). B DB, dry basis. C D50, mean diameter; D[4, 3], volume-weighted mean diameter; and D[3, 2], surface-weighted mean diameter of quinoa starch granules.
Table 2. Multi-scale structure and molecular weight changes in quinoa starch isolated by three different methods (alkali, wet-milling, and enzymatic) A.
Structural Characteristics BVariables CAlkaliWet-millingEnzymatic
XRDRelative crystallinity (%)26.8 ± 0.2 b27.7 ± 0.5 b29.0 ± 0.3 a
SAXSα2.3 ± 0.3 b2.5 ± 0.2 a2.6 ± 0.1 a
I (α.u.)13.4 ± 0.7 b13.6 ± 0.3 b17.8 ± 0.5 a
q (1/nm)0.6 ± 0.0 a0.6 ± 0.0 a0.6 ± 0.0 a
D (nm)10.1 ± 0.1 a10.0 ± 0.1 a10.1 ± 0.2 a
ATR-FTIRRatio of 1047/1022 cm−10.8 ± 0.0 b0.9 ± 0.0 a0.9 ± 0.0 a
Ratio of 1022/998 cm−11.3 ± 0.0 a1.2 ± 0.0 b1.2 ± 0.0 b
13C CP/MAS NMRSingle helix (%)6.7 ± 0.2 b7.3 ± 0.3 b8.2 ± 0.0 a
Double helix (%)21.1 ± 0.2 b21.2 ± 0.2 b23.1 ± 0.4 a
Amorphous (%)72.2 ± 0.3 a71.5 ± 0.1 a68.7 ± 0.3 a
LCM-RamanFWHM at 480 cm−12.1 ± 0.0 a1.7 ± 0.0 b1.5 ± 0.0 c
GPC-MALSAverage Mw (g/moL)1.13 × 105 (2%)1.18 × 10⁷ (3%)1.58 × 10⁷ (3%)
Average Rz (nm)41.6 (4%)101.1 (1%)106.8 (1%)
Mw/Mn2.7 (10%)1.2 (6%)1.3 (5%)
A Values are means of two replicates with standard deviation, means in row with same superscripted letters are not significant (p > 0.05). B Multi-scale structure analyses were performed by XRD, X-ray diffraction; ATR-FTIR, attenuated total reflectance-Fourier transform infrared spectroscopy; LCM-Raman, laser confocal microscopy-Raman; 13C CP/MAS NMR, carbon-13 cross-polarization/magic angle spinning nuclear magnetic resonance; and GPC-MALS, Gel permeation chromatography coupled with multi-angle light scattering. C Multi-scale variables including α, fractal dimension; I, scattering intensity; q, scattering vector; D, lamellar distance; FWHM, full-width at half-maximum; Mw, molecular weight; Rz, radius of gyration; and Mw/Mn, mass molar ratio are shown.
Table 3. Thermal, textural, and in vitro digestion properties of quinoa starch isolated by three different methods (alkali, wet-milling, and enzymatic) A.
VariablesAlkaliWet-millingEnzymatic
Thermal properties B
To (°C)61.7 ± 0.9 c66.3 ± 0.9 b82.1 ± 1.2 a
Tp (°C)67.8 ± 0.5 b70.0 ± 0.5 b83.8 ± 0.5 a
Tc (°C)75.9 ± 0.5 b76.2 ± 0.9 b86.3 ± 0.2 a
ΔH (J/g)5.4 ± 0.8 b6.7 ± 0.5 a6.8 ± 0.5 a
Textural properties
Hardness (N)160.5 ± 2.1 c192.7 ± 2.3 b238.8 ± 2.4 a
Springiness0.3 ± 0.0 c0.6 ± 0.0 b0.8 ± 0.0 a
Gumminess (N)41.5 ± 0.6 c91.3 ± 0.8 b105.6 ± 1.1 a
Chewiness (N)13.5 ± 0.3 c54.9 ± 0.5 b80.2 ± 0.9 a
Resilience0.1 ± 0.0 b0.1 ± 0.0 b0.2 ± 0.0 a
In vitro digestion of raw (uncooked) samples C
RDS (%)86.6 ± 0.6 a85.4 ± 0.5 a77.1 ± 0.4 b
SDS (%)5.2 ± 0.6 b5.9 ± 0.4 b7.5 ± 0.8 a
RS (%)8.2 ± 0.0 b8.6 ± 0.9 b15.4 ± 0.4 a
In vitro digestion of cooked samples C
RDS (%)88.3 ± 0.5 a87.7 ± 0.2 a81.9 ± 2.0 b
SDS (%)3.9 ± 0.4 b4.1 ± 0.1 a4.8 ± 0.0 b
RS (%)7.9 ± 0.9 b7.6 ± 0.2 b13.9 ± 1.8 a
A The data are means and standard deviation of double experiments. Means in the row with different superscripted letters are significant (p < 0.05). B The terms To, Tp, Tc, and ΔH are represent the onset, peak, conclusion temperatures, and enthalpy change. C RDS, SDS, and RS are denoted as rapidly digestible starch, slowly digestible starch, and resistant starch.
Table 4. Principal component analysis score of quinoa starch extracted by alkali, wet-milling, and enzymatic method.
VariablesAlkaliWet-MillingEnzymatic
y1−4.98343−1.107656.09108
y2−2.014393.098931.05454
y6.997821.991288.9891
Publisher’s Note: MDPI stays neutral with regard to jurisdictional claims in published maps and institutional affiliations.

