Abstract
Personalized diets change the internal metabolism of organisms, which, in turn, affects the health of the body; this study was performed to explore the regulatory effects of polysaccharides extracted from Auricularia auricula on the overall metabolism and gut microbiota in normal C57BL/6J mice. The study was conducted using metabolomic and microbiomic methods to provide a scientific basis for further development and use of Auricularia auricula resources in the Qinba Mountains and in nutritional food with Auricularia auricula polysaccharides (AAP) as the main functional component. Based on LC-MS/MS metabolomic results, 51 AAP-regulated metabolites were found, mainly enriched in the arginine biosynthesis pathway, which had the highest correlation, followed by the following metabolisms: arginine and proline; glycine, serine and threonine; and glycerophospholipid, along with the sphingolipid metabolism pathway. Furthermore, supplementation of AAP significantly changed the composition of the mice intestinal flora. The relative abundance levels of Lactobacillus johnsonii, Weissella cibaria, Kosakonia cowanii, Enterococcus faecalis, Bifidobacterium animalis and Bacteroides uniformis were markedly up-regulated, while the relative abundance of Firmicutes bacterium M10-2 was down-regulated. The bioactivities of AAP may be related to the regulatory effects of endogenous metabolism and gut microbiota composition.
1. Introduction
Auricularia auricula-judae, commonly known as black fungus, is a common delicious and healthy food and in China has the reputation of being the “meat in plain food” [1]. The Chinese first cultivated Auricularia auricula 4000 years ago during the time of Emperor Shennong; it was noted in Li Shizhen’s Compendium of Materia Medica during the Ming dynasty that Auricularia auricula “benefits qi, no hunger, be light and better in memory” [2]. As the saying goes “Little fungus, big industry”, the Shaanxi Qinba Mountains, with its dense forests, sufficient sunlight, humidity and large summer-to-autumn temperature variation is also suitable for Auricularia auricula [3]. Polysaccharides, one of the most important active components in the fruiting body of Auricularia auricula, have strong antioxidant, immune regulation, weight-reduction, and fat-decreasing properties [4,5]. Although many recent studies have focused on using Auricularia auricula extract to prevent and treat metabolic and other disorders and as a cooking ingredient, its effect and potential mechanism on a healthy body remain unclear.
Numerous studies have shown that personalized diets change the internal metabolism of organisms, which, in turn, affects the health of the body [6]. Metabolomics is an important part of system biology, because it reveals changes in metabolites and metabolic pathways caused by the stimulation of endogenous substances [7]. In recent years, many researchers have used metabolomics to investigate the effects of food intervention on health. Esteban-Fernandez et al. developed an ultra-performance liquid chromatography-time-of-flight mass spectrometry metabolomics method to analyze the effects of moderate red wine consumption on the urine of healthy volunteers [8]. Liu et al. studied the changes in exogenous and endogenous metabolites in the plasma and urine of female college students and female SD rats induced by cranberry extract [9,10]; these metabolites can be used as biomarkers for cranberry juice consumption and to explain their health-promoting properties.
Host metabolism is controlled by metabolic pathways regulated by their own genomes and metabolic processes regulated by microbial genomes [11]. The influence of acquired external environmental factors, especially diet, on the composition and structure of flora cannot be ignored [12]. Many studies have shown that dietary polysaccharides with different structures could regulate the composition of intestinal flora precisely [13,14]. Xu et al. found that Auricularia auricula polysaccharides (AAP) elevated intestinal flora diversity and optimized microbial composition and function in T2D mice, characterized by increased Lactobacillus and Bacteroides and decreased Clostridium and Allobaculum [15]; however, there are few studies on the regulatory effects of AAP on gut microbiota in normal mice, especially concerning AAP from the Qinba Mountains.
In this study, metabolomic and intestinal microbiome methods were used to study the effects of Qinba mountain AAP on the serum metabolites and intestinal flora of normal male mice, and to reveal their regulatory effects on the overall metabolism and gut microbiota homeostasis of mammals.
2. Materials and Methods
2.1. Preparation of AAP
Thirty grams of Auricularia auricula-judae powder, purchased from Shaanxi Tianmei Green Industry Co., Ltd. (Hanzhong, China), and grown in the Qinba Mountains of northwest China, were weighed, and extracted using 100 °C water (solid–liquid ratio 1:50) for 2 h. The solution was centrifuged at 10,000 r/min for 10 min, and the supernatant was concentrated. Then, ethanol was added at a ratio of 1:4 (volume fraction), and alcohol precipitation was carried out for 12 h. The precipitates were separated under 10,000 r/min for 10 min, and fully dissolved in distilled water. After removing protein 4–5 times though the sevage (dichloromethane: n-butanol = 4:1, v/v) method, cellophane, with a molecular cut-off of 3000 Da, was used for dialysis in flowing tap water for 3 consecutive days, after which the solution was concentrated, freeze-dried, and bagged to obtain the AAP [4] (the relative mole percentage of mannose, glucuronic acid and xylose was 60.87:20.83:9.86).
2.2. Animal Experiment Design
C57BL/6J male mice (7-week-old, SPF-grade) were purchased from the Experimental Animal Center of Xi’an Jiaotong University (license number: SCXK 2018-001). The animal experiment protocol was approved by the Animal Ethics Committee of the Laboratory Animal Center of Northwest University (Approval Code: NWU-AWC-20200401M), and was carried out in accordance with the “Administrative Regulations on Laboratory Animals” of the National Science and Technology Commission of the People’s Republic of China. The mice were reared under standard conditions (temperature 25 ± 2 °C, relative humidity 40 ± 10%, light–dark cycle of 12/12 h, clean bedding, and water and food ad libitum). After one week of adaptation, the mice were randomly divided into 2 groups (n = 10): the mice on the normal diet (ND) group were fed with AIN93M standard feed (TROPHIC Animal Feed High-Tech Co., Ltd., Nantong, China) and distilled water, while the mice in the AAP group were given standard feed containing 200 mg/kg/day AAP (TROPHIC Animal Feed High-Tech Co., Ltd., Nantong, China) and distilled water. Both groups were fed for 12 weeks.
2.3. Collection of Blood and Faeces Samples
The formed faeces in the intestinal tract of mice were taken out and placed in a 2 mL sterile centrifuge tube, and stored at a −80 °C refrigerator for later use. Twenty-four hours after the last treatment, the mice were fasted without water overnight. Mouse blood was collected from the eyeballs and the plasma was centrifuged at 2500 r/min for 30 min at room temperature to obtain serum.
2.4. Fecal Bacteria 16S rRNA Sequencing Analysis
Genomic DNA of the samples were extracted by CTAB or SDS, and then the purity and concentrations were detected by agarose gel electrophoresis. An appropriate amount of DNA was taken and diluted to 1 ng/μL with sterile water. Using the diluted genomic DNA as a template, and according to the selection of sequencing region, PCR was performed using a specific primer with Barcode, Phusion® High-Fidelity PCR Master Mix with GC Buffer from New England Biolabs, and high-performance high-fidelity enzyme, to ensure amplification efficiency and accuracy. Shanghai Baiqu Biomedical Technology Co., Ltd. (Shanghai, China) was commissioned to perform sequencing analysis on the V3-V4 region. The original data were spliced and filtered, followed by operational taxonomic unit (OTU) clustering and species classification analysis to obtain information on species richness and uniformity within the samples, as well as common and unique OTU information among different samples or groups. Principal coordinate analysis (PCoA), principal component analysis (PCA) and other dimensionality reduction methods were used to analyze the differences in community structure among the samples or groups. The Student’s t test, LEfSe and other statistical analysis methods were conducted to test the significance of species composition and community structure.
2.5. Extraction and Detection of Serum Metabolites
A 50 μL sample was transfer into an EP tube, to which was added 200 μL of an extract solution (methanol–acetonitrile 1:1 (v/v) containing an isotope-labeled internal standard mixture) (methanol: LC-MS grade, CNW Technologies; acetonitrile: LC-MS grade, CNW Technologies), followed by vortexing and mixing for 30 s. After ultrasonic treatment for 10 min in an ice water bath, the solution was left to stand at −40 °C for 1 h. Then, the samples were centrifuged at 4 °C at 12,000 rpm (centrifugal force 13,800× g; radius 8.6 cm) for 15 min. The supernatant was then collected into sample vials and subjected to computer testing. In addition, another equal amount of supernatant was taken from all samples and mixed into QC samples for on-machine testing.
The target compounds were separated by Waters ACQUITY UPLC BEH Amide (2.1 mm × 100 mm, 1.7 μm) liquid chromatography column using the Vanquish Ultra Performance Liquid Chromtography (UHPLC). Phase A was aqueous, containing 25 mmol/L ammonium acetate (LC-MS grade, Sigma-Aldrich) and 25 mmoL/L ammonia water (LC-MS grade, Fisher Chemical), Phase B was acetonitrile (LC-MS grade, CNW Technologies). The sample disc temperature was 4 °C and the injection volume was 2 μL. The Thermo Q Exactive HFX mass spectrometer was controlled by software (Xcalibur, Thermo) for primary and secondary mass spectrometry data acquisition. Detailed parameters were as follows: sheath gas flow rate, 30 Arb; aux gas flow rate, 25 Arb; capillary temperature, 350 °C; full ms resolution, 60,000; MS/MS resolution, 7500; Collision energy, 10/30/60 in NCE mode; spray voltage, 3.6 kV (positive) or −3.2 kV (negative).
The original data were converted into mzXML format by ProteoWizard software, and peak recognition, extraction, alignment and integration were processed by an R program package (kernel XCMS) independently written. Then, the converted data were matched with the BiotreeDB (V2.1) self-built secondary mass spectrometry database for material annotation. Metabolic markers were screened in combination with multivariate statistical analysis, and the algorithm score cutoff value was set to 0.3.
3. Results
3.1. The Effects of AAP on α Diversity of Intestinal Flora in Mice
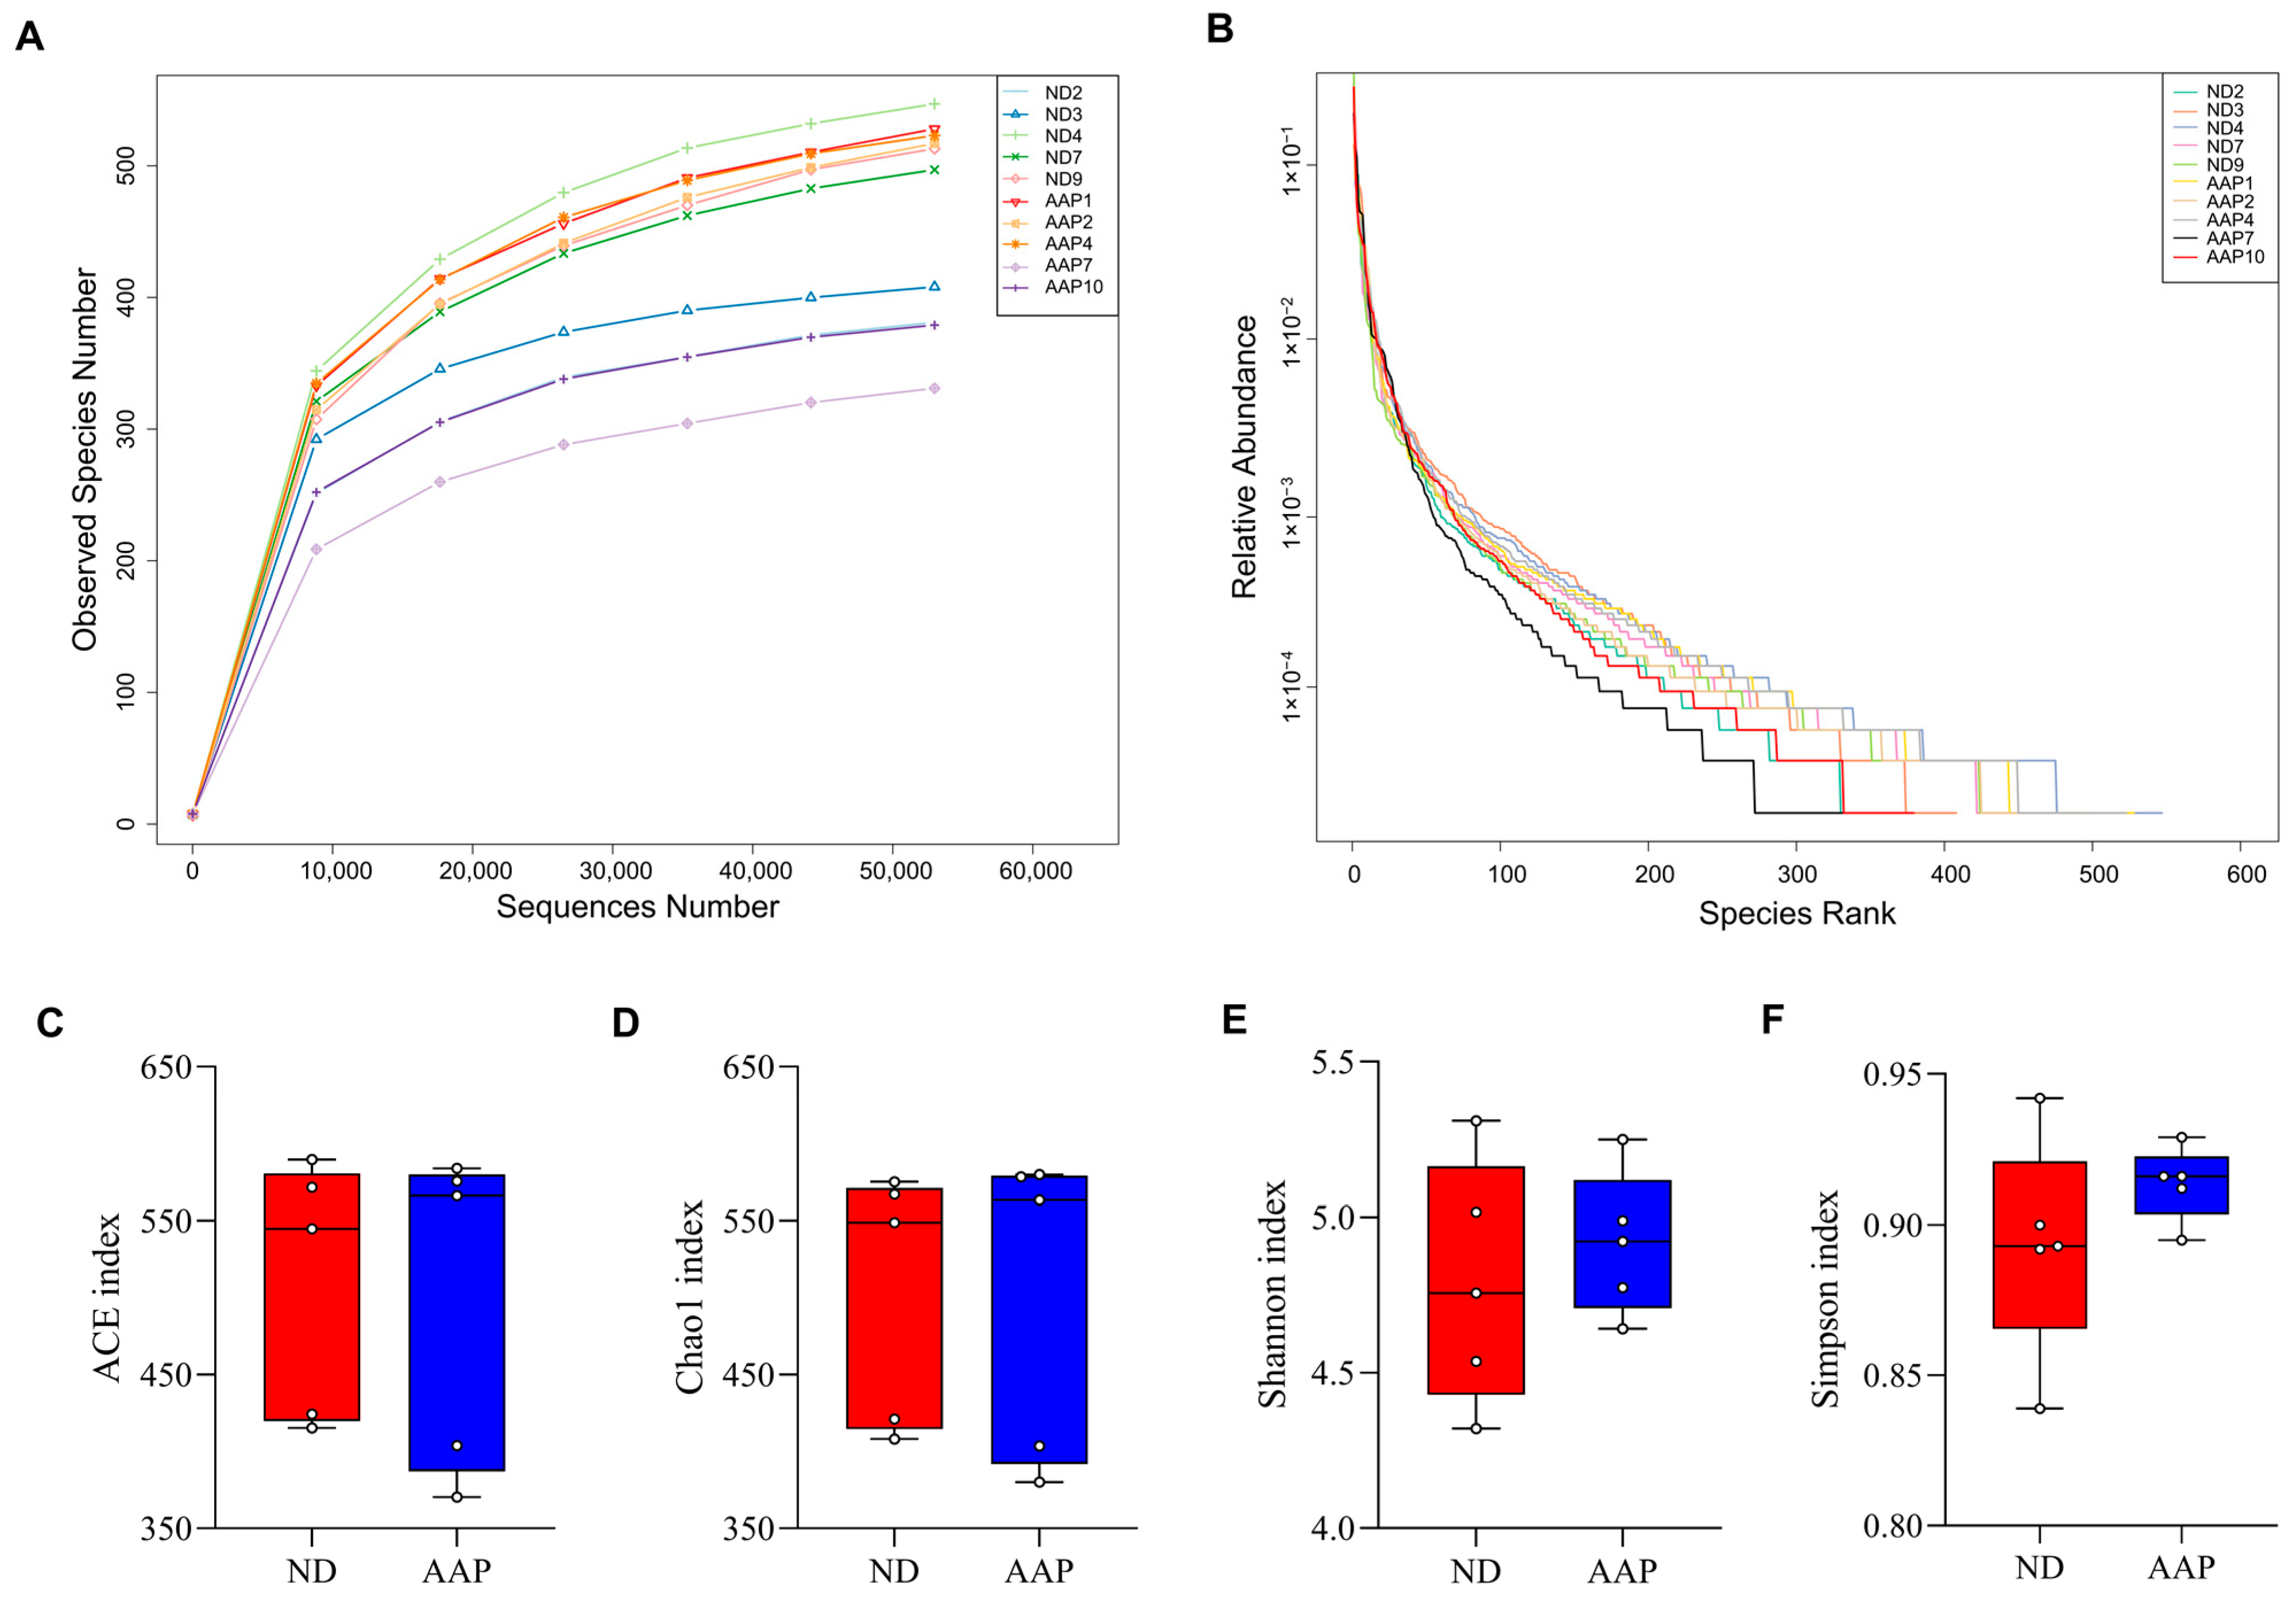
As shown in Figure 1A, the dilution curves of the ND and AAP groups gradually smoothed out, indicating that the species in the intestinal tract were not enhanced by the increase in the number of sequenced samples, which in this study was sufficient to reflect the flora characteristics of the samples. The rank-abundance curve visually reflected the abundance and uniformity of the species. Dietary supplementation with AAP did not destroy the homeostasis of the intestinal flora species in the mice (Figure 1B); however, there were no statistically significant differences in the Chao1, ACE, Shannon, or Simpson indexes (Figure 1C–F).

Figure 1.
The effects of Auricularia auricula polysaccharides on α diversity of intestinal flora in mice. (A) Dilution curve; (B) Rank Abundance curve; (C) Group difference box diagram of the ACE index; (D) Chao 1 index; (E) Shannon index; (F) Simpson index. ND = normal diets; AAP = Auricularia auricula polysaccharides. Data presented as mean ± SD, n = 5.
3.2. The Effects of AAP on β Diversity of Intestinal Flora in Mice
β diversity mainly describes the changes in species composition on a spatial scale to evaluate the similarity between the groups; it can be analyzed by PCoA, which can visually show the similarities and differences in microorganisms in differently treated samples. As illustrated in Figure 2A, the intestinal microbial structure of the ND and AAP groups were similar, indicating that dietary supplementation of AAP did not markedly change the β diversity of the intestinal microbes. The box diagram for the group difference analysis among β diversity is shown in Figure 2B. The median, maximum and minimum sample values of the ND and AAP groups were different to some extent.
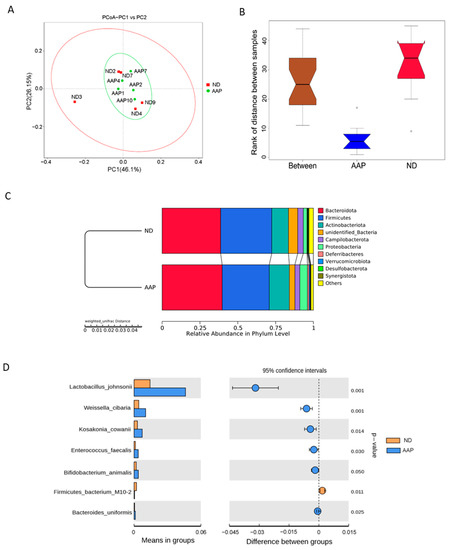
Figure 2.
The effects of Auricularia auricula polysaccharides on β diversity of intestinal flora in mice. (A) Principle component analysis (PCoA) based on weighted unifrac distance; (B) Anosim difference analysis between groups; (C) Unweighted pair group method with arithmetic mean (UPGMA) clustering tree based on weighted unifrac distance; (D) Group species difference analysis chart of Student’s t test at the species level. ND = normal diets; AAP = Auricularia auricula polysaccharides. Data presented as mean ± SD, n = 5.
Anosim and MRPP analyses were used to determine whether there was a significant difference in community structure between ND and AAP groups. Anosim analysis is a non-parametric test that measures whether the difference between groups is significantly greater than the difference within a group to determine if the groups are meaningful. The significance test of the intergroup difference was performed based on the rank of the Bray–Curtis distance value. The analysis demonstrated that the R-value and p-value between the ND and AAP groups were 0.864 and 0.001, respectively, indicating that there was a significant difference between them. Furthermore, MRPP is a parametric test based on the Bray–Curtis distance. The smaller the observed delta value, the smaller the difference within the group; the larger the expected delta value, the greater the difference between the groups. A value greater than zero indicated that the intergroup difference was greater than that within each group. A value less than zero indicated that the difference within each group was greater than the difference between the groups. A significance value less than 0.05 indicates significant difference. The observed delta value, expected delta value and the significance value between the ND and AAP groups were 0.0717, 0.2683, 0.289 and 0.008, respectively, indicating that there was a significant difference in microbial community structure between the groups.
From Figure 2C, it can be seen that the relative abundance of intestinal flora in the mice had changed after AAP intake. At the phylum level, the microbial community structure of the mice feces samples was mainly composed of Bacteroidetes, Firmicutes, Actinobacteria, Campilobacter, Deferribacteres and Proteobacteria. Among these, Firmicutes and Bacteroidetes were the dominant flora, which was consistent with the results in the previous study. Therefore, the intestinal flora of the two groups of mice were similar. Compared with the ND group, the abundance of Bacteroidetes, Actinobacteria and Proteobacteria in the AAP group was significantly boosted, while that of Firmicutes was significantly decreased.
Through an intergroup Student’s t test, strains with significant difference (p < 0.05) were found as shown in Figure 2D. Dietary supplementation with AAP remarkedly increased expression of Lactobacillus johnsonii, Weissella cibaria, Kosa Cosac Cowanii, Enterococcus faecalis, Bifidobacterium animalis and Bacteroides uniformis, while significantly reducing the abundance of Firmicutes bacterium M10-2.
3.3. Screening of Mouse Serum Biomarkers after AAP Consumption
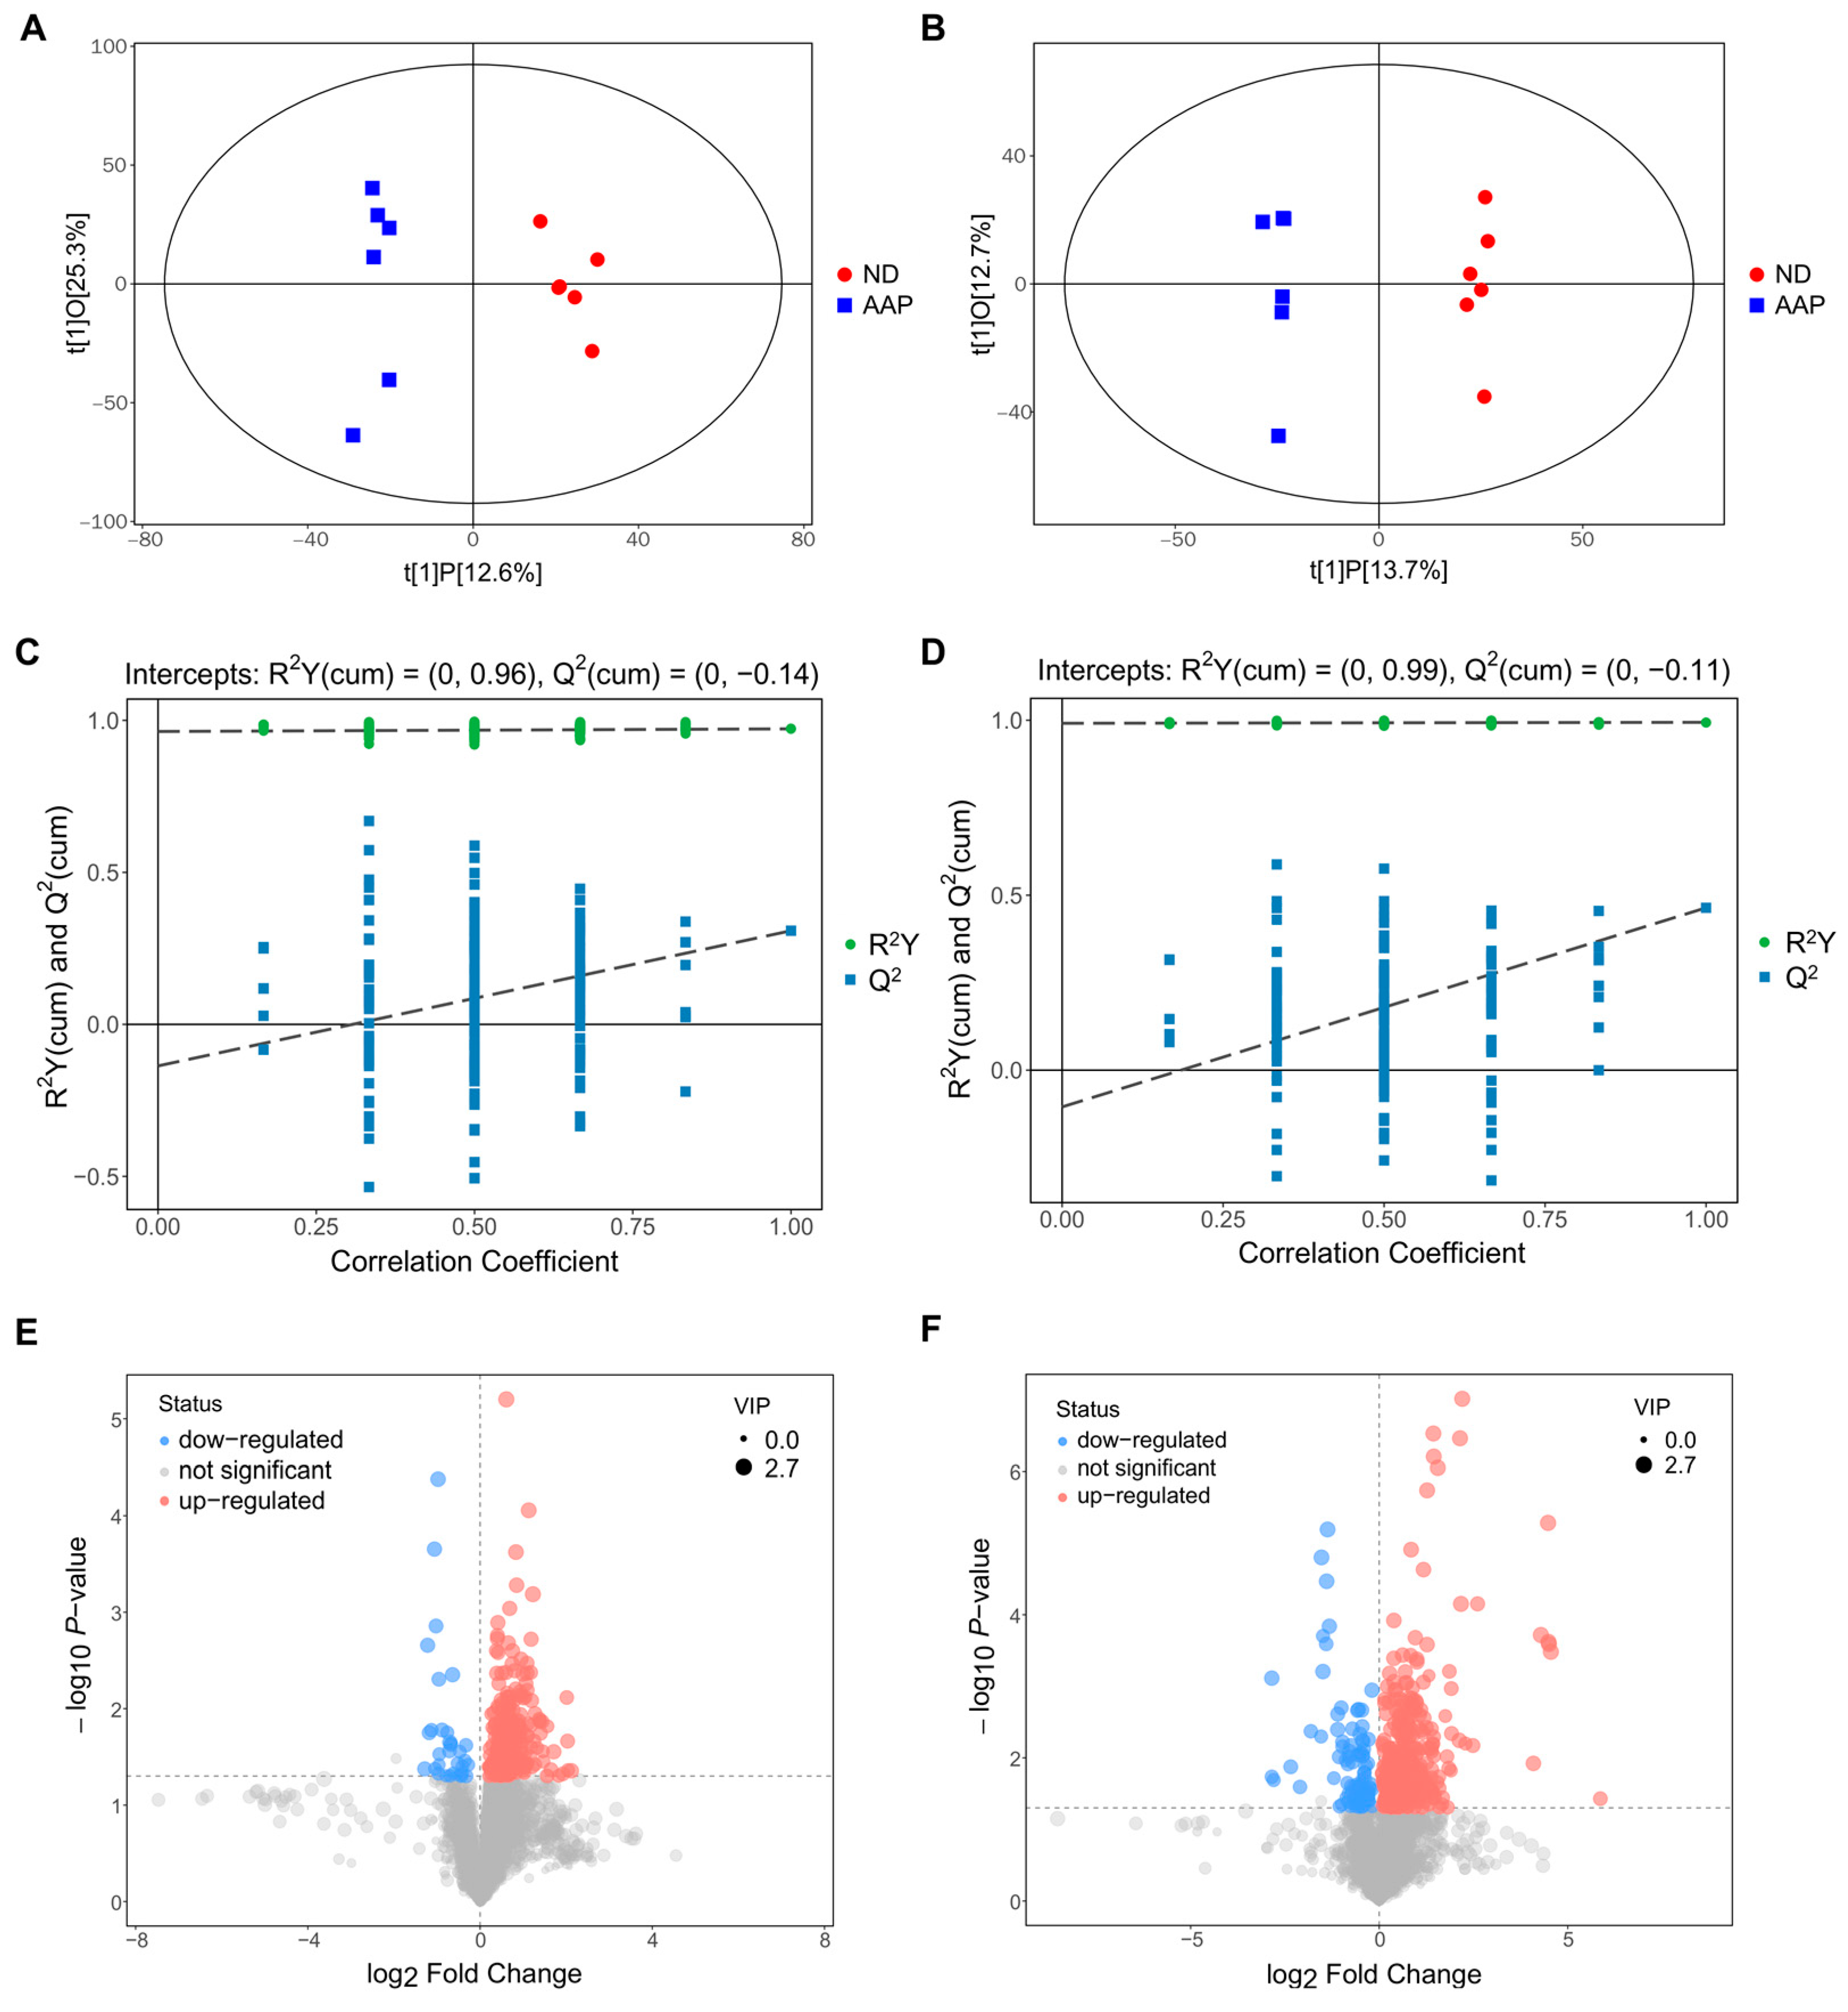
A total of 239 substances (in negative ion mode) and 368 substances (in positive ion mode) were detected by mass spectrometry. The screening strategy of the serum biomarkers was as follows: multivariate statistical analysis was used to analyze the serum metabolic material spectrum data of the ND and AAP group in both modes, and the supervised analysis method––partial least squares discriminant analysis (OPLS-DA) ––was used to find, screen and identify the differential metabolites.
The OPLS-DA analysis of the two sets of data are shown in Figure 3A,B. The abscissa t(1)P represents represented the predicted principal component score of the first principal component, showing the differences between the groups, and the ordinate t(1)O represents the orthogonal principal component score, which shows the differences within each sample group. Each dot represents a sample, and the shape and color of the dots represent different experimental groups. From the results of the OPLS-DA score chart, the serum samples of the ND and AAP group mice were significantly different, and all samples were within the 95% confidence interval (Hotelling’s T-squared ellipse).
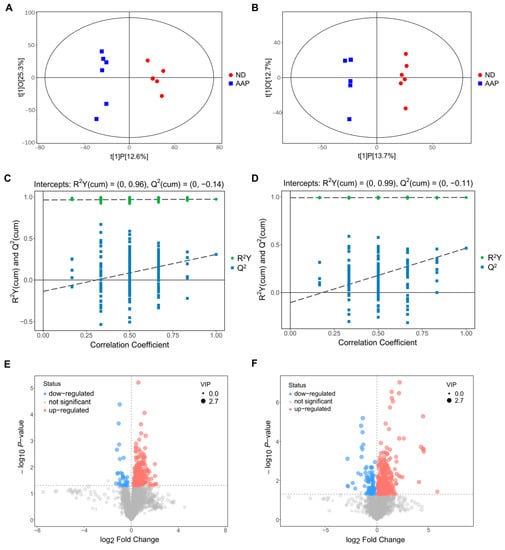
Figure 3.
Biomarkers identification after Auricularia auricula polysaccharides consumption by serum metabolomics. OPLS-DA score plot in (A) positive ion mode; (B) negative ion mode; OPLS-DA replacement test (200 times) in (C) positive ion mode; (D) negative ion mode; The slope of R2 is greater than 0, and the intercept of Q2 on the Y axis is less than 0.05, indicating that the model is effective; Volcano map of differential metabolite screening in (E) positive ion mode; (F) negative ion mode. ND = normal diets; AAP = Auricularia auricula polysaccharides. Data presented as mean ± SD, n = 6.
In addition, a replacement test was used to verify whether the model was over-fitted. As demonstrated in Figure 3C,D, the abscissa indicates the correlation between the random sample and the original sample, and the ordinate indicates the values of R2Y and Q2. In positive ion mode, R2Y(cum) and Q2(cum) of ND vs AAP were 0.96 and −0.14, while in negative ion mode R2Y(cum) and Q2(cum) were 0.99 and −0.11. The slope of R2Y was greater than 0, and the intercept of Q2 was less than 0.05, indicating that the model had good predictability and could be used for the next analysis without overfitting.
The results of screening for differential metabolites are visualized in the form of volcanic diagrams, as illustrated in Figure 3E,F. Each point in the diagram represents a metabolite. The abscissa represents multiple changes within a group in comparison to between groups (the logarithm with 2 as the bottom), and the ordinate represents the p-value of the Student’s t test (the negative number of the logarithm with 10 as the bottom). The scatter point size represents the variable importance projection (VIP) value of the OPLS-DA model. The larger the scatter point, the larger the value. The scatter colors represent the final screening results, with significantly up-regulated metabolites in red, significantly down-regulated metabolites in blue, and non-significantly different metabolites in grey. Substances that met the following requirements were identified as differential metabolites: (1) VIP value > 1; (2) significant difference p < 0.05; (3) exclusion of heterologous metabolites according to the references. The results showed that a total of 51 differential metabolites were screened out as potential biomarkers in the mice serum after the AAP dietary supplement. Of these, 1–20 were in positive ion mode and 21–54 were in negative ion mode. L-lysine, citrulline and indophenol sulfate were detected in both modes. Details of the selected biomarkers are shown in Table 1.

Table 1.
Identification of mice serum metabolites after administering Auricularia auricula polysaccharides.
3.4. Changes in Serum Biomarkers in Mice after Auricularia auricula Polysaccharides Intake
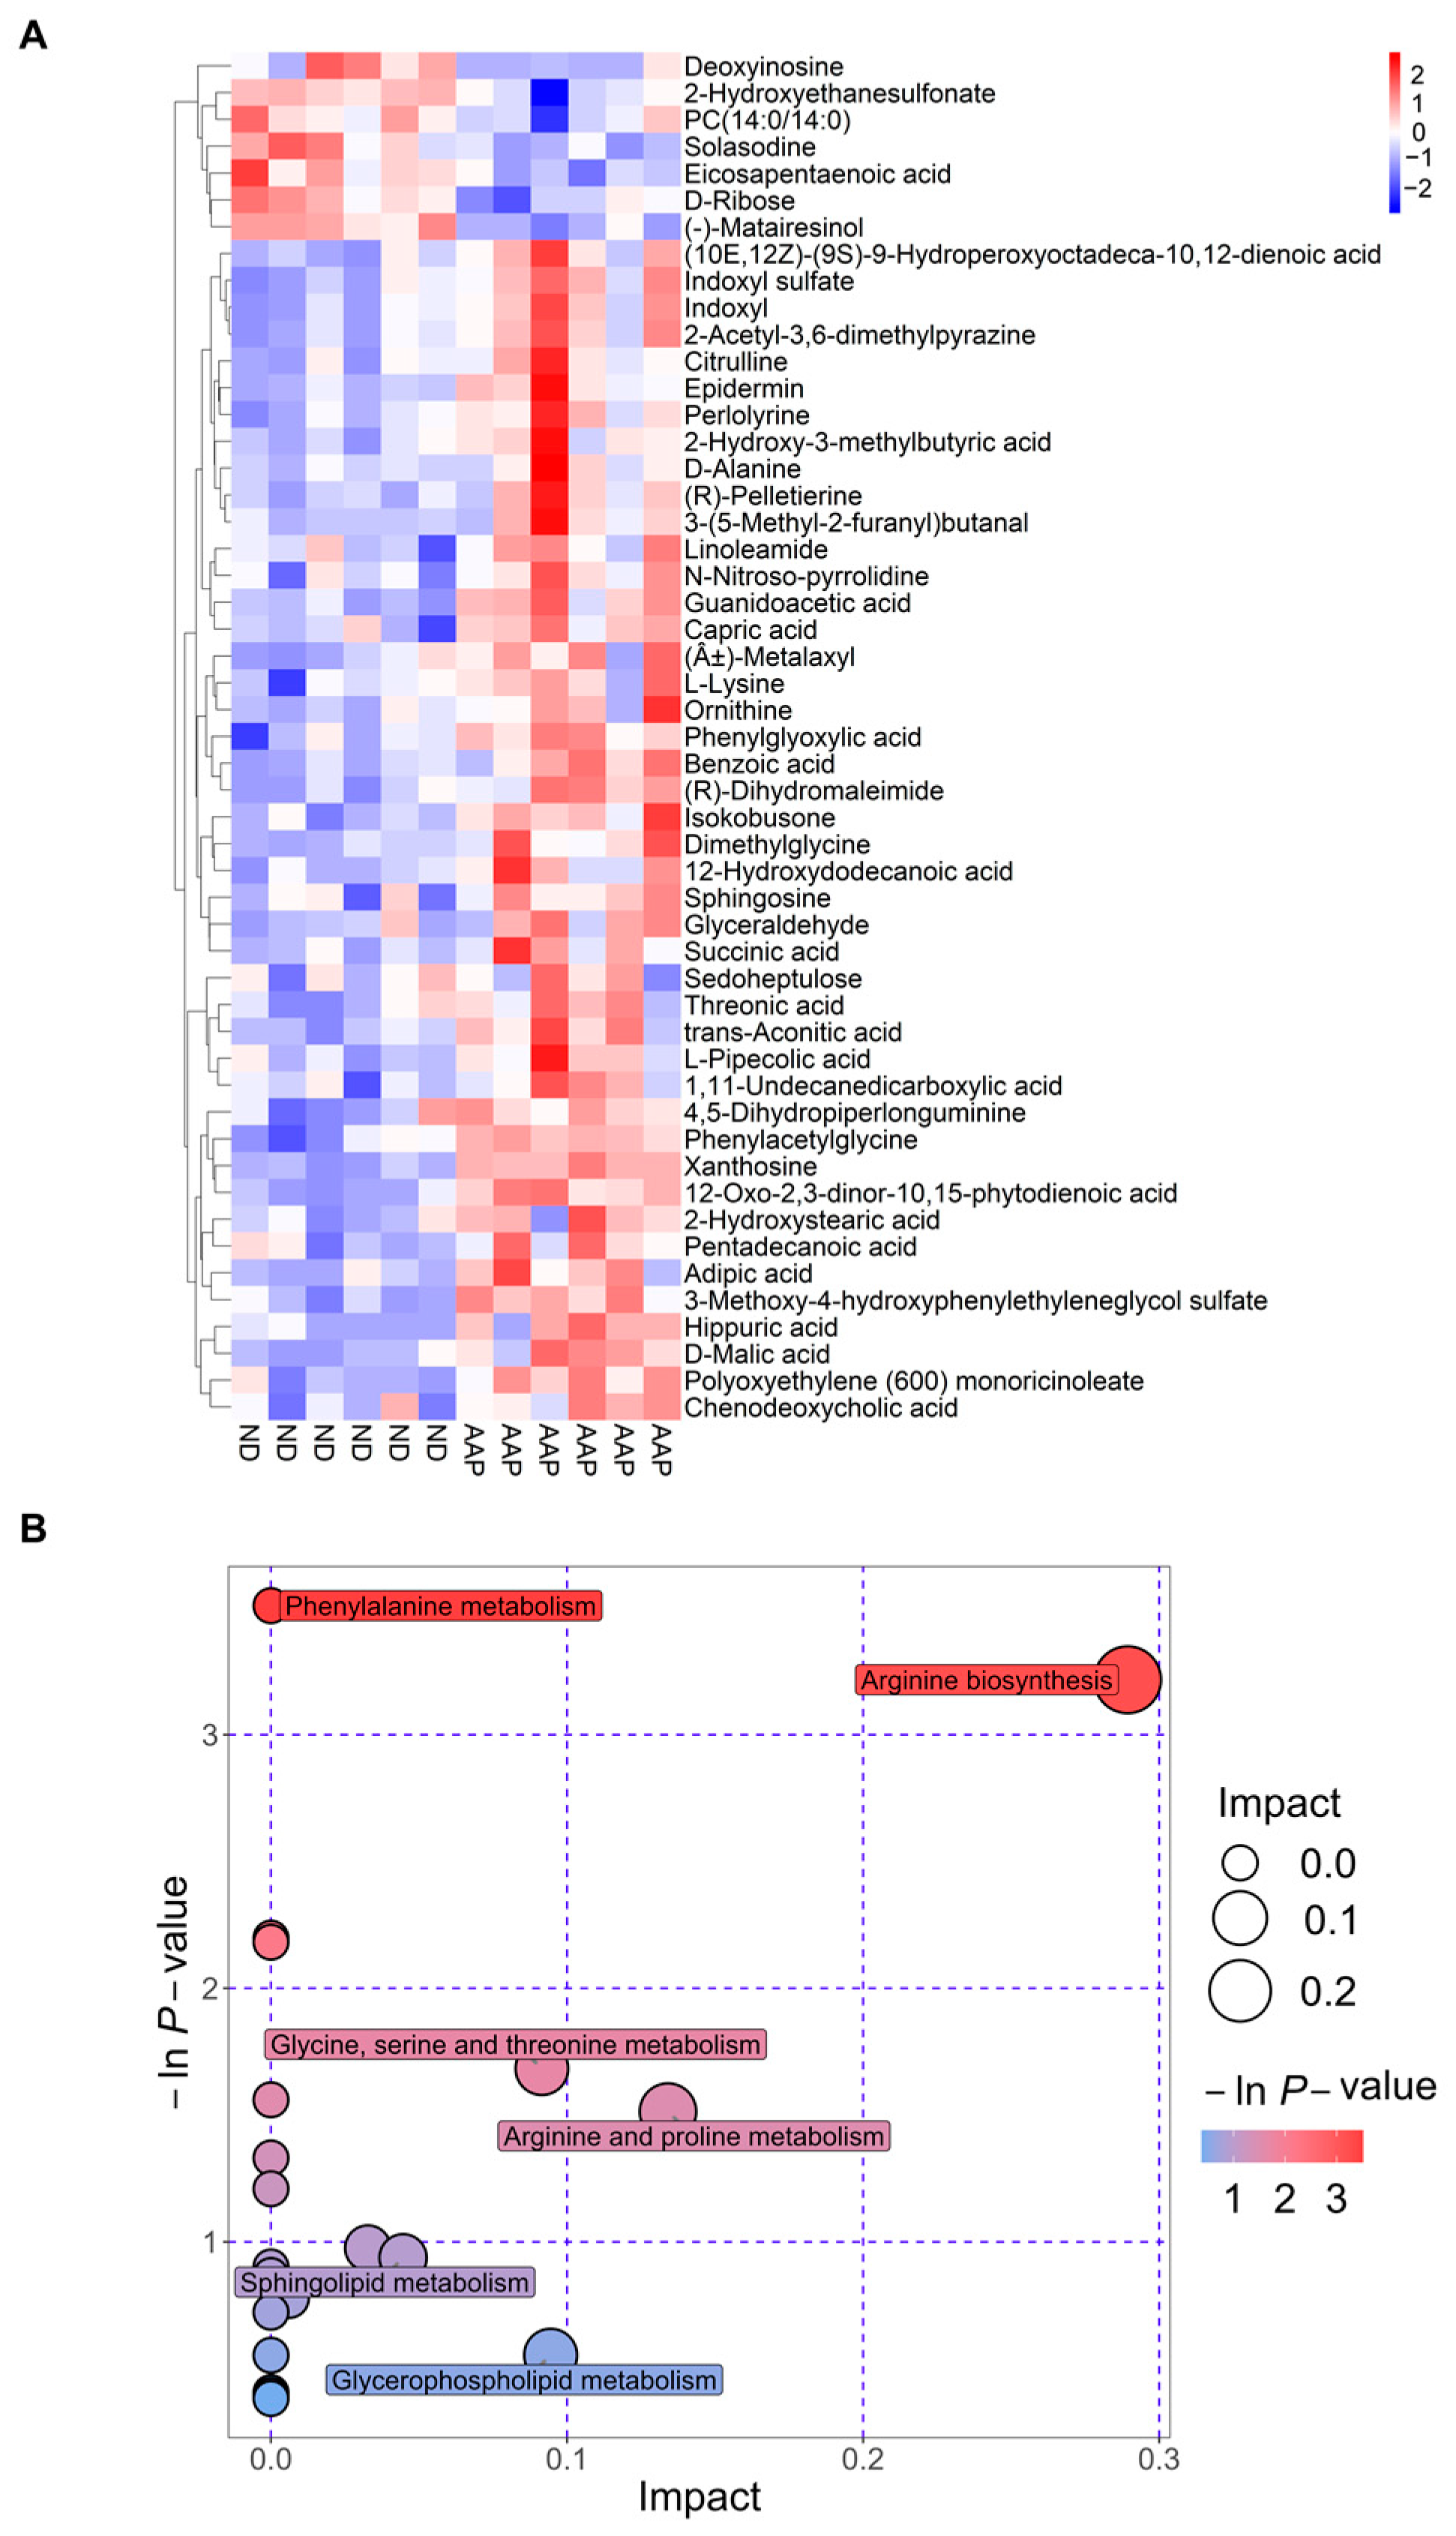
The Euclidean distance matrix was calculated based on the quantitative values of the differential metabolites; the differential metabolites were clustered using the complete linkage method and displayed in the thermal diagram. In Figure 4A, the abscissa represents different experimental groups, and the ordinate represents the comparative differential metabolites of the group (consistent with Table 1). The color patches at different positions represent the relative expression levels of the metabolites at the corresponding positions. Red indicates that the substance content was highly expressed, and blue indicates that it was low.
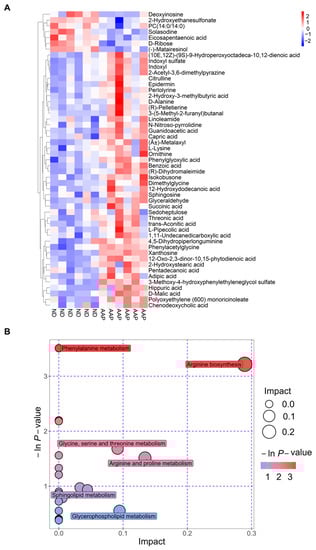
Figure 4.
Metabolic pathway analysis. (A) Thermogram of serum biomarker changes; (B) Bubble chart. ND = normal diets; AAP = Auricularia auricula polysaccharides.
The results of the metabolic pathway analysis are presented as bubble charts (Figure 4B) where each bubble represents a metabolic pathway. The abscissa of the bubble and the size of the bubble represents the size of the pathway influence factor in topology analysis. The larger the size, the larger the influence. The vertical coordinate where the bubble was located and the color of the bubble indicated the p value (negative natural log, i.e., −ln (p)) of the enrichment analysis. The darker the color, the smaller the p value, and the more significant the degree of enrichment. As shown in Figure 4 B, the differential genes caused by the AAP dietary supplement were mainly enriched in the arginine biosynthesis pathway, which had the highest correlation; this was followed by the arginine and proline metabolism; glycine, serine and threonine metabolism; glycerophospholipid metabolism; and sphingolipid metabolism pathways.
3.5. Correlation Analysis of Intestinal Flora and Metabolites in Mice after Intake of Auricularia auricula Polysaccharides
To further investigate the correlation between the intestinal flora of mice and the metabolites of the body after intake of AAP, the content of the metabolites with an abundance of significantly different flora (p ≤ 0.01) were analyzed by thermography. The results are illustrated in Figure 5. There were obvious positive correlations between Weissella cibaria and the following metabolites: capric acid, polyoxyethylene (600) monoricinoleate, guanidoacetic acid, 12-oxo-2,3-dinor-10,15-phytodienoic acid, 2-acetyl-3,6-dimethylpyrazine, 3-methoxy-4-hydroxyphenylethyleneglycol sulfate, D-malic acid, indoxyl, indoxyl sulfate, isokobusone, phenylglyoxylic acid. There were also markedly negative correlations with (-)-matairesinol, D-ribose, eicosapentaenoic acid, sedoheptulose, solasodine. Lactobacillus johnsonii and 3-methoxy-4-hydroxyphenylethyleneglycol sulfate, xanthosine, 12-oxo-2,3-dinor-10,15-phytodienoic acid, capric acid, D-malic acid, guanidoacetic acid, hippuric acid, isokobusone, L-lysine, phenylglyoxylic acid, polyoxyethylene (600) monoricinoleate, and trans-aconitic acid correlated positively, while (-)-matairesinol, D-ribose, eicosapentaenoic acid, and sedoheptulose correlated negatively; it was found that there were obvious positive correlations between Kosakonia cowanii and polyoxyethylene (600) monoricinoleate, 12-oxo-2,3-dinor-10,15-phytodienoic acid, 2-acetyl-3,6-dimethylpyrazine, 3-methoxy-4-hydroxyphenylethyleneglycol sulfate, capric acid, D-malic acid, hippuric acid, indoxyl, isokobusone, L-lysine, and xanthosine, while there were negative correlations with (-)-matairesinol, and eicosapentaenoic acid. Firmicutes bacterium M10-2 and metabolites such as (-)-matairesinol, D-ribose, eicosapentaenoic acid, sedoheptulose correlated positively, but negatively with isokobusone, 2-acetyl-3,6-dimethylpyrazine, benzoic acid, capric acid, guanidoacetic acid, hippuric acid, indoxyl, indoxyl sulfate, isokobusone, L-lysine, phenylglyoxylic acid, polyoxyethylene (600) monoricinoleate, and xanthosine. There were obvious positive correlations between Enterococcus faecalis and the following metabolites: (R)-dihydromaleimide, 12-oxo-2,3-dinor-10,15-phytodienoic acid, 2-acetyl-3,6-dimethylpyrazine, benzoic acid, D-malic acid, indoxyl, indoxyl sulfate, L-lysine, phenylglyoxylic acid, polyoxyethylene (600) monoricinoleate, and trans-aconitic acid. There were also markedly negative correlations with D-ribose, eicosapentaenoic acid, sedoheptulose, and solasodine. Bifidobacterium animalis and the following metabolites correlated positively: D-malic acid, trans-aconitic acid, xanthosine, (R)-dihydromaleimide, 12-oxo-2,3-dinor-10,15-phytodienoic acid, 2-acetyl-3,6-dimethylpyrazine, 3-methoxy-4-hydroxyphenylethyleneglycol sulfate, hippuric acid, indoxyl, indoxyl sulfate, isokobusone, L-lysine, phenylglyoxylic acid, and polyoxyethylene (600) monoricinoleate. Negative correlations were found with (-)-matairesinol, D-ribose, eicosapentaenoic acid, sedoheptulose, solasodine; it was found that there were obvious positive correlations between Bacteroides uniformis and indoxyl sulfate, (R)-dihydromaleimide, 12-oxo-2,3-dinor-10,15-phytodienoic acid, 2-acetyl-3,6-dimethylpyrazine, benzoic acid, D-malic acid, indoxyl, isokobusone, L-lysine, phenylglyoxylic acid, polyoxyethylene (600) monoricinoleate, trans-aconitic acid, and xanthosine. (-)-matairesinol and eicosapentaenoic acid correlated negatively.
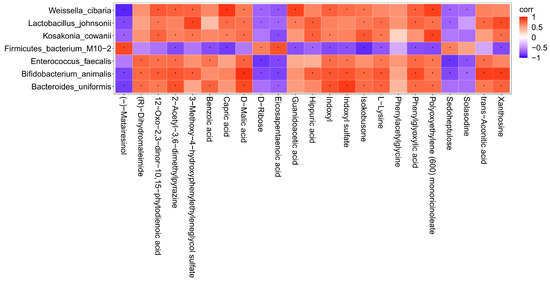
Figure 5.
Correlation analysis between characteristic bacteria and metabolites. corr = correlation. Red represents positive correlation and blue represents negative correlation. The deeper the color, the greater the correlation. * indicates p < 0.05.
4. Discussion
The United Nations has proposed “one meat, one vegetable and one mushroom” as a reasonable dietary structure for the 21st century. Polysaccharides are formed by the polymerization of more than 10 monosaccharides through glycosidic bonds that have high safety and low toxicity. Polysaccharides from edible and pharmaceutical bacteria are considered to be “biological response regulators” [16]. At present, more than 100 kinds of edible and medicinal fungal polysaccharides have been found: antioxidant, antidiabetic, hypolipidemic, immunomodulatory, antitumor and liver protective [17], among which Lentinus edodes, Ganoderma lucidum, Cordyceps sinensis and Tremella fuciformis have been widely used in medicine, life sciences and food fields [18]. Due to the lack of enzymes, most of the edible and medicinal fungal polysaccharides cannot be directly digested and absorbed by the body, while CAZymes encoded by intestinal microflora can convert oligosaccharides and polysaccharides into monosaccharides to generate SCFAs and other metabolites that are easy absorbed [19]. In addition, different types of polysaccharides can increase beneficial intestinal microorganisms and reduce harmful intestinal microorganisms [13]. HAO et al. found that after 28 days of administering Flammulina velutipes polysaccharides, the abundance of Firmicutes in the cecum of C57BL/6J mice increased, while the abundance of Bacteroides decreased, thus increasing the ratio of Firmicutes to Bacteroides [20]. KHAN et al. studied the effects of ganoderma lucidum polysaccharides and poria cocos polysaccharides on the intestinal flora of C57BL/6J mice; they found that two edible and medicinal fungal polysaccharides increased production of SCFAs and lactic acid and the abundance of probiotics resistant to obesity such as Bifidobacterium, Eubacterium rectal, Lactobacillus and Lactococcus. In addition, the proportion of pathogenic bacteria was reduced; thus playing a prebiotic role [21]. The results of this study demonstrated that dietary supplementation of AAP changed the composition of the intestinal flora in C57BL/6J male mice and significantly up-regulated Lactobacillus johnsonii, Weissella cibaria, Kosakonia cowanii, Enterococcus faecalis, Bifidobacterium animalis and Bacteroides uniformis, while down-regulating the relative abundance of Firmicutes bacterium M10-2.
There are hundreds of millions of bacterial communities in the intestines of mammals, which are interdependent of their hosts and participate in various physiological activities: metabolism, immunity, and regulation of endocrine and nervous system functions [22]. Emerging evidence suggests that low-grade inflammation is a marker of metabolic disorders such as obesity, type 2 diabetes, and non-alcoholic fatty liver disease [23,24]; these diseases are characterized by changes in the intestinal microbiota and its metabolites, which migrate from the intestinal tract through the damaged intestinal barrier, affecting metabolic organs such as the liver and adipose tissue [25]. Other studies found that obesity, the propensity to gain weight, dyslipidemia, insulin resistance and low-grade inflammation were more prevalent in subjects exhibiting low gut bacterial richness [26]. Additionally, it was suggested that certain “proinflammatory” bacterial strains such as Ruminococcus gnavus or Bacteroides species, might dominate, while “anti-inflammatory”’ strains, such as Faecalibacterium prausnitzii, are less prevalent [27]. Lactic acid bacteria (LAB) are best known for imparting beneficial health effects. Numerous studies showed that lactic acid bacteria resist oxidation, regulate immune function, reduce cholesterol, promote digestion and prevent cancer; thus the inclusion in the diet could be positive [28]. By definition, LAB produces large amounts of lactic acid using carbohydrates. Lactococcus, Enterococcus, Pediococcus, Leuconostoc, Lactobacillus, Bifidobacterium, Streptococcus, Vagococcus, Tetragenococcus and Weissella are some lactic acid bacterial genera that have been well studied for their health benefits [29]. As a probiotic, Lactobacillus johnsonii plays an important role in maintaining the balance of intestinal flora and regulating the immune system. Studies have found that it promotes the growth and development of animals, reduces inflammatory reactions, prevents diarrhea, increases the number of beneficial bacteria in the intestine, and regulates the balance of intestinal microflora [30]. After colonization by Lactobacillus yoelii, the number of CD4+ and CD8+ cells in the small intestine and spleen were the highest. Although less effective than fecal bacterial transplantation, colonization with Escherichia coli and Lactobacillus johnsonii both increased the proportion of regulatory T cells (Tregs) and activated DC and completely restored the intestinal memory/effector T cell population on Day 28. Interestingly, only L. johnsonii recolonization maintained colonic IL-10 production [31]. Other studies demonstrated that L. johnsonii increases the level of reduced glutathione in the blood, thus improving the mitochondrial morphology and function of the liver by reducing liver lipids and improving systemic glucose metabolism [32]. Weissella cibaria is the dominant heterotypic lactic acid fermentation bacterium found in the early stage of the natural fermentation of pickled cabbage. Due to the complexity of fermentation and the diversity of products, it can produce more flavor substances and give pickled cabbage a better flavor [33]. Shashank et al. isolated four new Weiss strains from fermented dosa batter and human infant fecal sample and found that all four tolerated gastric fluid (pH = 3.0) and bile salt, moderate cell surface hydrophobicity, reduced cholesterol, and adhered to CaCo2 cells and gastric mucin. The cell experiment proved that all four strains inhibited production of nitric oxide and IL-6 by a mouse macrophage induced by a lipopolysaccharide and inhibited the production of IL-8 in human epithelial cells [34]. In this study, it was found that dietary AAP supplementation can significantly up-regulate the abundance of L. johnsonii and Weissella cibaria, but its health promotion effect based on the regulation of intestinal flora needs to be further explored.
Different polysaccharides promote the growth of different intestinal flora, which is related to the structure of the polysaccharides. The relative molecular mass is an important factor affecting the biological activity of polysaccharides. You et al. compared the structural information, digestive behavior and effects on the intestinal microflora of three brown algal polysaccharides (alginate, laminarin, fucoidan), and found that the low molecular-weight polysaccharides had a greater effect on the intestinal microflora regulation [35]. Deng et al. explored the physicochemical properties, hypoglycemic effects, and mechanism analysis of low, medium and high molecular weight konjac glucomannan (KGM) and found that the medium molecular weight altered the ratio of Firmicutes to Bacteroides and reduced the abundance of Roma Boots and Klebsiella. The Bacteroides population increased by 6.14, 24.2, 18.38, and 12.28% in the KGM-H (1129.5 kDa), KGM-M1 (757.1 kDa), KGM-M2 (252.7 kDa), and KGM-L (87.3 kDa) groups, respectively [36]. Furthermore, the beneficial effects of polysaccharides are closely related to the monosaccharide types. β-glucan extracted from oat increased the number of Bifidobacterium and Lactobacillus in intestinal microflora [37]. Bacteroides effectively degraded fructan [38]; and xylan was metabolized by Prevotella bryantii [39]. In this study, the polysaccharides of Auricularia auricula from the Qinba Mountains prepared by hot water extraction was mainly composed of mannose (the relative molar percentage of mannose, glucuronic acid and xylose is 60.87: 20.83:9.86) [4], and its regulating effect on intestinal flora may be closely related to mannose. Studies found that mannose is not only an important monosaccharide for protein glycosylation in mammals but also an inefficient source of cell energy. Supplementing a certain amount of mannose could increase the ratio of Bacteroides to Firmicutes in the intestinal microflora of mice fed a high-fat diet. Functional transcriptomic analysis of the mice cecal microflora revealed that mannose induced coherent changes in microbial energy metabolism, and it was speculated that its effect came from reducing the energy produced by intestinal microbiota that metabolize complex carbohydrates and reduce energy intake [40]. Furthermore, Li et al. analyzed the effects of four galactoses (porphyrin, agarose, carrageenan, and arabinogalactan) with significant differences in molecular weight, polymerization glycosidic bonds, esterification, branching, and monosaccharide composition on intestinal microflora and SCFAs production. The results showed that all four galactoses can be used by intestinal bacteroides. In addition, the porphyran can be used by Lactobacillus and Bifidobacterium, while the arabinogalactan can be used by Lactobacillus, Bifidobacterium and Roseburia [41]. Although a large number of studies confirmed that the structure of polysaccharides affects their regulatory function of various intestinal microflora, how the intestinal microorganisms use different types of polysaccharides according to their structural characteristics remains to be studied further. Due to the lack of research into the primary and secondary polysaccharide structures, the different origins of edible and medicinal fungi, and the different polysaccharides extraction methods, the corresponding quality control indexes are lacking, which affects the repeatability of experiments and adds difficulty to the development of medicinal and nutrition products.
The body depends on the glycolysis of intestinal flora to absorb nutrients from the food that cannot be digested by its own enzymes, and to obtain energy. At the same time, intestinal flora regulate the normal physiological functions of the body and the occurrence and development of diseases [42]. Based on the metabolomics platform, this study carried out a systematic analysis on the serum of the endogenous metabolite spectrum of mice fed AAP from the Qinba Mountains, and analyzed the correlation between significant changes in intestinal flora and metabolic differences after AAP intake. The results demonstrated that AAP had a significant regulatory effect on the serum metabolite spectrum, and the metabolites had a marked correlation with Lactobacillus johnsonii, Weissella cibaria, Kosakonia cowanii, Enterococcus faecalis, Bifidobacterium animalis, Bacteroides uniformis and Firmicutes bacterium M10-2. After AAP intake, the differential genes were mainly enriched in the arginine biosynthesis pathway, where the correlation was the highest. L-arginine is a basic semi-essential amino acid. When the animal body is injured (especially the liver) or stressed, a large amount of arginase is released into the blood to accelerate the consumption of arginine, which also causes a lack of arginine [43,44]. There are four main pathways of arginine metabolism in mammals. One is the formation of ornithine and urea with ammonia catalyzed by arginase, also known as the urea cycle, which is also an important means of ammonia metabolism [45]. Urea produced by metabolism is excreted through the urine, and the main site of urea circulation is the liver. Ornithine can be decarboxylated by ornithine decarboxylase to generate putrescine, which further reacts with S-adenosylmethionine to generate spermidine and spermine. Putrescine, spermidine and spermine are collectively referred to as polyamines, which are substances that can regulate the synthesis of body DNA and protein, thus promoting cell proliferation and differentiation. The second pathway is the formation of agmatine under the catalysis of arginine decarboxylase, which has been proven to be a new neurotransmitter that can affect the release of hormones and promote the proliferation of lymphocytes and thymocytes. Agmatine can produce putrescine catalyzed by the agmatine enzyme, which is also another way that polyamine is produced in the body [46]. Third, guanidinoacetic acid is generated by the catalysis of arginine: glycine transferase and guanidinoacetic acid are methylated under the catalysis of guanidinoacetic acid-N-methyltransferase to form creatine, the main synthesis sites of which are the kidneys and pancreas. During blood circulation, creatine can be absorbed by skeletal muscle and neurons and further phosphorylated to form phosphocreatine, which is mainly involved in energy metabolism in the skeletal muscle [47]. In addition, creatine can also be irreversibly converted into dehydrated creatinine through a non-enzymatic pathway. The last metabolic pathway of arginine is the production of nitric oxide (NO) and citrulline catalyzed by nitric oxide synthase (NOS). NO is a crucial regulator in mammalian tissue cells, and citrulline can be used as a substrate to regenerate arginine [48].
Further studies are needed to explore the relationships among the “active components–intestinal flora–body metabolism” of Auricularia auricula and its effects on gut health and related metabolic diseases to develop and use edible and medicinal fungi resources.
5. Conclusions
This study showed that non-digestible AAP promoted the growth of Lactobacillus johnsonii, Weissella cibaria, Kosakonia cowanii, Enterococcus faecalis, Bifidobacterium animalis and Bacteroides uniformis in normal mice intestines. After AAP dietary supplementation, 51 differential metabolites were found, which were mainly enriched in arginine biosynthesis pathways, followed by arginine and proline metabolism; glycine, serine and threonine metabolism; glycerophospholipid metabolism; and the sphingolipid metabolism pathway. Furthermore, it was found that there is a close correlation between differential bacteria and differential metabolites, which may contribute to the bioactivity of AAP; these results laid the theoretical basis for the further development and use of Auricularia auricula resources from the Qinba Mountains and nutritional foods with AAP as the main functional component.
Author Contributions
Conceptualization, Q.L.; Data Curation, Q.L., X.A. and R.M.; Formal Analysis, X.A., Y.C., Y.D. and R.M.; Funding Acquisition, Q.L., H.N. and W.C.; Investigation, X.A., R.M., Y.C. and Y.D.; Methodology, Q.L. and H.Z.; Project Administration, H.N., W.C., X.W. and M.W.; Resources, Q.L., X.W. and M.W.; Supervision, Q.L., H.N. and W.C.; Validation, H.Z., X.A. and Y.D.; Visualization, Q.L., X.A. and Y.C.; Writing—Original Draft Preparation, Q.L. and X.A.; Writing—Review and Editing, Q.L. and H.Z. All authors have read and agreed to the published version of the manuscript.
Funding
This work was supported by the National Natural Science Foundation of China (32001697); General Special Project of Shaanxi Provincial Department of Education (20JK0936); National Key Research and Development Program (2019YFC1606704, 2021YFD1600400); Special Fund Project of Shaanxi Provincial Central Government Guiding Local Science and Technology Development (2022ZY2-CGZY-02).
Institutional Review Board Statement
The animal study protocol was approved by the Ethics Committee of the Laboratory Animal Center of Northwest University (protocol code: NWU-AWC-20200401M; Approval Date: 10 April 2020).
Informed Consent Statement
Not applicable.
Data Availability Statement
The data presented in the manuscript is available on request from the corresponding author.
Acknowledgments
The authors gratefully acknowledge Northwest University and Shaanxi Functional Food Engineering Center Co., Ltd.
Conflicts of Interest
Qian Liu, the corresponding author, comes from Northwest University and also Shaanxi Functional Food Engineering Center Co., Ltd. Xiaoru Wang and Meng Wang affiliates with Shaanxi Fucntional Food Engineering Center Co., Ltd. In this study, the engineering center provided assistance in the management, coordination and execution of animal experiments. This engineering center will not affect the conclusion of the manuscript. All authors have declared that there is no conflict of interest.
References
- Islam, T.; Ganesan, K.; Xu, B. Insights into health-promoting effects of Jew’s ear (Auricularia auricula-judae). Trends Food Sci. Technol. 2021, 114, 552–569. [Google Scholar]
- Liu, E.; Ji, Y.; Zhang, F.; Liu, B.; Meng, X. Review on Auricularia auricula-judae as a functional food: Growth, chemical composition, and biological activities. J. Agric. Food Chem. 2021, 69, 1739–1750. [Google Scholar]
- Li, L.; Zhong, C.H.; Bian, Y.B. The molecular diversity analysis of Auricularia auricula-judae in China by nuclear ribosomal DNA intergenic spacer. Electron. J. Biotechn. 2014, 17, 27–33. [Google Scholar]
- Liu, Q.; Ma, R.; Li, S.; Fei, Y.; Lei, J.; Li, R.; Wang, L. Dietary supplementation of auricularia auricula-judae polysaccharides alleviate nutritional obesity in mice via regulating inflammatory response and lipid metabolism. Foods 2022, 11, 942. [Google Scholar] [PubMed]
- Bian, C.; Wang, Z.; Shi, J. Extraction optimization, structural characterization, and anticoagulant activity of acidic polysaccharides from Auricularia auricula-judae. Molecules 2020, 25, 710. [Google Scholar] [CrossRef]
- Bashiardes, S.; Godneva, A.; Elinav, E.; Segal, E. Towards utilization of the human genome and microbiome for personalized nutrition. Curr. Opin. Biotech. 2018, 51, 57–63. [Google Scholar]
- Wu, J.; Gao, Y. Physiological conditions can be reflected in human urine proteome and metabolome. Expert Rev. Proteom. 2015, 12, 623–636. [Google Scholar] [CrossRef]
- Esteban-Fernández, A.; Ibanez, C.; Simo, C.; Bartolomé, B.; Moreno-Arribas, M.V. An ultrahigh-performance liquid chromatography-time-of-flight mass spectrometry metabolomic approach to studying the impact of moderate red-wine consumption on urinary metabolome. J. Proteome Res. 2018, 17, 1624–1635. [Google Scholar]
- Liu, H.; Garrett, T.J.; Su, Z.; Khoo, C.; Zhao, S.; Gu, L. Modifications of the urinary metabolome in young women after cranberry juice consumption were revealed using the UHPLC-Q-orbitrap-HRMS-based metabolomics approach. Food Funct. 2020, 11, 2466–2476. [Google Scholar]
- Liu, H.; Tayyari, F.; Edison, A.S.; Su, Z.; Gu, L. NMR-based metabolomics reveals urinary metabolome modifications in female Sprague-Dawley rats by cranberry procyanidins. J. Nutr. Biochem. 2016, 34, 136–145. [Google Scholar]
- Tremaroli, V.; Bäckhed, F. Functional interactions between the gut microbiota and host metabolism. Nature 2012, 489, 242–249. [Google Scholar] [PubMed]
- Zhang, L.; Zhang, Z.; Xu, L.; Zhang, X. Maintaining the balance of intestinal flora through the diet: Effective prevention of illness. Foods 2021, 10, 2312. [Google Scholar] [PubMed]
- Song, Q.; Wang, Y.; Huang, L.; Shen, M.; Yu, Y.; Yu, Q.; Xie, J. Review of the relationships among polysaccharides, gut microbiota, and human health. Food Res. Int. 2021, 140, 109858. [Google Scholar] [PubMed]
- Deehan, E.C.; Yang, C.; Perez-Muñoz, M.E.; Nguyen, N.K.; Cheng, C.C.; Triador, L.; Walter, J. Precision microbiome modulation with discrete dietary fiber structures directs short-chain fatty acid production. Cell Host Microbe 2020, 27, 389–404. [Google Scholar]
- Xu, N.; Zhou, Y.; Lu, X.; Chang, Y. Auricularia auricula-judae (Bull.) polysaccharides improve type 2 diabetes in HFD/STZ-induced mice by regulating the AKT/AMPK signaling pathways and the gut microbiota. J. Food Sci. 2021, 86, 5479–5494. [Google Scholar] [PubMed]
- Yin, Z.; Liang, Z.; Li, C.; Wang, J.; Ma, C.; Kang, W. Immunomodulatory effects of polysaccharides from edible fungus: A review. Food Sci. Hum. Wellness 2021, 10, 393–400. [Google Scholar]
- Maity, P.; Sen, I.K.; Chakraborty, I.; Mondal, S.; Bar, H.; Bhanja, S.K.; Maity, G.N. Biologically active polysaccharide from edible mushrooms: A review. Int. J. Biol. Macromol. 2021, 172, 408–417. [Google Scholar] [PubMed]
- Mingyi, Y.; Belwal, T.; Devkota, H.P.; Li, L.; Luo, Z. Trends of utilizing mushroom polysaccharides (MPs) as potent nutraceutical components in food and medicine: A comprehensive review. Trends Food Sci. Technol. 2022, 123, 144. [Google Scholar]
- Fang, Q.; Hu, J.; Nie, Q.; Nie, S. Effects of polysaccharides on glycometabolism based on gut microbiota alteration. Trends Food Sci. Technol. 2019, 92, 65–70. [Google Scholar]
- Hao, Y.; Wang, X.; Yuan, S.; Wang, Y.; Liao, X.; Zhong, M.; He, Q.; Shen, H.; Liao, W.; Shen, J. Flammulina velutipes polysaccharide improves C57BL/6 mice gut health through regulation of intestine microbial metabolic activity. Int. J. Biol. Macromol. 2021, 167, 1308–1318. [Google Scholar] [PubMed]
- Khan, I.; Huang, G.; Li, X.; Leong, W.; Xia, W.; Hsiao, W. Mushroom polysaccharides from Ganoderma lucidum and Poria cocos reveal prebiotic functions. J. Funct. Foods 2018, 41, 191–201. [Google Scholar]
- Costa, M.C.; Weese, J.S. Understanding the intestinal microbiome in health and disease. Vet. Clin. N. Am. Equine Pract. 2018, 34, 1–12. [Google Scholar]
- Panchal, S.K.; Brown, L. Cholesterol versus inflammation as cause of chronic diseases. Nutrients 2019, 11, 2332. [Google Scholar]
- Tsoupras, A.; Lordan, R.; Zabetakis, I. Inflammation, not cholesterol, is a cause of chronic disease. Nutrients 2018, 10, 604. [Google Scholar]
- Tilg, H.; Zmora, N.; Adolph, T.E.; Elinav, E. The intestinal microbiota fuelling metabolic inflammation. Nat. Rev. Immunol. 2020, 20, 40–54. [Google Scholar]
- Le Chatelier, E.; Nielsen, T.; Qin, J.; Prifti, E.; Hildebrand, F.; Falony, G.; Almeida, M.; Arumugam, M.; Batto, J.M.; Kennedy, S.; et al. Richness of human gut microbiome correlates with metabolic markers. Nature 2013, 500, 541–546. [Google Scholar] [PubMed]
- Cotillard, A.; Kennedy, S.P.; Kong, L.C.; Prifti, E.; Pons, N.; Le Chatelier, E.; Almeida, M.; Quinquis, B.; Levenez, F.; Galleron, N.; et al. Dietary intervention impact on gut microbial gene richness. Nature 2013, 500, 585–588. [Google Scholar]
- De Filippis, F.; Pasolli, E.; Ercolini, D. The food-gut axis: Lactic acid bacteria and their link to food, the gut microbiome and human health. FEMS Microbiol. Rev. 2020, 44, 454–489. [Google Scholar]
- Masood, M.I.; Qadir, M.I.; Shirazi, J.H.; Khan, I.U. Beneficial effects of lactic acid bacteria on human beings. Crit. Rev. Microbiol. 2011, 37, 91–98. [Google Scholar]
- Xin, J.; Zeng, D.; Wang, H.; Sun, N.; Zhao, Y.; Dan, Y.; Pan, K.; Jing, B.; Ni, X. Probiotic Lactobacillus johnsonii BS15 promotes growth performance, intestinal immunity, and gut microbiota in piglets. Probiotics Antimicrob. Proteins 2020, 12, 184–193. [Google Scholar]
- Ekmekciu, I.; Von Klitzing, E.; Neumann, C.; Bacher, P.; Scheffold, A.; Bereswill, S.; Heimesaat, M.M. Fecal microbiota transplantation, commensal Escherichia coli and Lactobacillus johnsonii strains differentially restore intestinal and systemic adaptive immune cell populations following broad-spectrum antibiotic treatment. Front. Microbiol. 2017, 8, 2430. [Google Scholar] [CrossRef] [PubMed]
- Rodrigues, R.R.; Gurung, M.; Li, Z.; García-Jaramillo, M.; Greer, R.; Gaulke, C.; Bauchinger, F.; You, H.; Pederson, J.W.; Vasquez-Perez, S.; et al. Transkingdom interactions between Lactobacilli and hepatic mitochondria attenuate western diet-induced diabetes. Nat. Commun. 2021, 12, 101. [Google Scholar] [PubMed]
- Yu, H.S.; Jang, H.J.; Lee, N.K.; Paik, H.D. Evaluation of the probiotic characteristics and prophylactic potential of Weissella cibaria strains isolated from kimchi. LWT 2019, 112, 108229. [Google Scholar] [CrossRef]
- Singh, S.; Bhatia, R.; Singh, A.; Singh, P.; Kaur, R.; Khare, P.; Purama, R.K.; Boparai, R.K.; Rishi, P.; Ambalam, P.; et al. Probiotic attributes and prevention of LPS-induced pro-inflammatory stress in RAW264. 7 macrophages and human intestinal epithelial cell line (Caco-2) by newly isolated Weissella cibaria strains. Food Funct. 2018, 9, 1254–1264. [Google Scholar] [CrossRef]
- You, L.; Gong, Y.; Li, L.; Hu, X.; Brennan, C.; Kulikouskaya, V. Beneficial effects of three brown seaweed polysaccharides on gut microbiota and their structural characteristics: An overview. Int. J. Food Sci. Technol. 2020, 55, 1199–1206. [Google Scholar] [CrossRef]
- Deng, J.; Zhong, J.; Long, J.; Zou, X.; Wang, D.; Song, Y.; Zhou, K.; Liang, Y.; Huang, R.; Wei, X.; et al. Hypoglycemic effects and mechanism of different molecular weights of konjac glucomannans in type 2 diabetic rats. Int. J. Biol. Macromol. 2020, 165 Pt B, 2231–2243. [Google Scholar] [CrossRef]
- Metzler-Zebeli, B.; Zijlstra, R.; Mosenthin, R.; Ganzle, M. Dietary calcium phosphate content and oat beta-glucan influence gastrointestinal microbiota, butyrate-producing bacteria and butyrate fermentation in weaned pigs. FEMS Microbiol. Ecol. 2011, 75, 402–413. [Google Scholar] [CrossRef]
- Sonnenburg, E.D.; Zheng, H.; Joglekar, P.; Higginbottom, S.K.; Firbank, S.J.; Bolam, D.N.; Sonnenburg, J.L. Specificity of polysaccharide use in intestinal bacteroides species determines diet-induced microbiota alterations. Cell 2010, 141, 1241–1252. [Google Scholar] [CrossRef]
- Dodd, D.; Mackie, R.I.; Cann, I.K. Xylan degradation, a metabolic property shared by rumen and human colonic Bacteroidetes. Mol. Microbiol. 2011, 79, 292–304. [Google Scholar] [CrossRef]
- Sharma, V.; Smolin, J.; Nayak, J.; Ayala, J.E.; Scott, D.A.; Peterson, S.N.; Freeze, H.H. Mannose alters gut microbiome, prevents diet-induced obesity, and improves host metabolism. Cell Rep. 2018, 24, 3087–3098. [Google Scholar] [CrossRef] [Green Version]
- Li, S.; Hu, J.; Yao, H.; Geng, F.; Nie, S. Interaction between four galactans with different structural characteristics and gut microbiota. Crit. Rev. Food Sci. 2021, 61, 1–11. [Google Scholar]
- Zmora, N.; Suez, J.; Elinav, E. You are what you eat: Diet, health and the gut microbiota. Nat. Rev. Gastro. Hepat. 2019, 16, 35–56. [Google Scholar]
- Martí i Líndez, A.A.; Reith, W. Arginine-dependent immune responses. Cell. Mol. Life Sci. 2021, 78, 5303–5324. [Google Scholar] [PubMed]
- Zou, S.; Wang, X.; Liu, P.; Ke, C.; Xu, S. Arginine metabolism and deprivation in cancer therapy. Biomed. Pharm. 2019, 118, 109210. [Google Scholar]
- Brosnan, J.T.; Brosnan, M.E. Creatine metabolism and the urea cycle. Mol. Genet. Metab. 2010, 100, S49–S52. [Google Scholar] [CrossRef] [PubMed]
- Halloran, K.M.; Stenhouse, C.; Wu, G.; Bazer, F.W. Arginine, agmatine, and polyamines: Key regulators of conceptus development in mammals. Adv. Exp. Med. Biol. 2021, 1332, 85–105. [Google Scholar]
- Newsholme, E.A.; Beis, I.S.; Leech, A.R.; Zammit, V.A. The role of creatine kinase and arginine kinase in muscle. Biochem. J. 1978, 172, 533–537. [Google Scholar] [CrossRef]
- Schwedhelm, E.; Maas, R.; Freese, R.; Jung, D.; Lukacs, Z.; Jambrecina, A.; Böger, R.H. Pharmacokinetic and pharmacodynamic properties of oral L-citrulline and L-arginine: Impact on nitric oxide metabolism. Br. J. Clin. Pharmacol. 2008, 65, 51–59. [Google Scholar] [CrossRef]


Publisher’s Note: MDPI stays neutral with regard to jurisdictional claims in published maps and institutional affiliations. |
© 2022 by the authors. Licensee MDPI, Basel, Switzerland. This article is an open access article distributed under the terms and conditions of the Creative Commons Attribution (CC BY) license (https://creativecommons.org/licenses/by/4.0/).