Article

Characterization of Two Zymomonas mobilis Wild Strains and Analysis of Populations Dynamics during Their Leavening of Bread-like Doughs

1
Department of Food, Environmental and Nutritional Sciences (DeFENS), Università degli Studi di Milano, Via Celoria 2, 20133 Milano, Italy
2
Faculty of Science and Technology, Free University of Bozen/Bolzano, Piazza Università 5, 39100 Bolzano, Italy
*
Author to whom correspondence should be addressed.
Foods 2022, 11(18), 2768; https://doi.org/10.3390/foods11182768
Submission received: 4 August 2022 / Revised: 1 September 2022 / Accepted: 6 September 2022 / Published: 8 September 2022
(This article belongs to the Special Issue Biotechnological Potential of Microorganisms in Food Industry)

Abstract

:
Two Zymomonas mobilis wild strains (UMB478 and 479) isolated from water kefir were characterized for their biomass production levels and leavening performance when used as the inoculum of a real bread-like dough formulation. The obtained baked product would be consumable by people with adverse responses to Saccharomyces cerevisiae. In liquid cultures, the two strains reached similar biomass concentration (0.7 g CDW/L). UMB479 showed an interesting resistance to NaCl (MBC 30 g/L), that may be useful in the bakery sector. When inoculated in doughs, UMB479 produced the maximum dough volume (650 mL) after 5 h, glucose was almost consumed and 1 g/100 g of ethanol produced, +200% respective to UMB478. Using S. cerevisiae for comparison purposes, the dough doubled its volume fast, in only 2 h, but reached a final level of 575 mL, lower than that achieved by Z. mobilis. The analysis of bacterial and fungal population dynamics during dough leavening was performed through the Automated Ribosomal Intergenic Spacer Analysis (ARISA); doughs leavened by UMB479 showed an interesting decrease in fungal richness after leavening. S. cerevisiae, instead, created a more complex fungal community, similar before and after leavening. Results will pave the way for the use of Z. mobilis UMB479 in commercial yeast-free leavened products.

1. Introduction

Bread represents a fundamental food in many societies; in its simplest form, bread is made using flour, baker’s yeast (Saccharomyces cerevisiae), salt and water as ingredients. Human exposure to baker’s yeast is frequent due to the massive consumption of bread but also of alcoholic beverages (beer, cider, wine) and even nutraceuticals and food supplement use [1]. So far, there are concerns that the incidence of yeast intolerance is increasing in Western countries.
The possibility of adverse responses related to baker’s yeast ingestion is mainly spread across patients affected by Inflammatory Bowel Disease (IBD), Crohn’s disease (CD) and other autoimmune disorders; in these cases, anti-S. cerevisiae antibodies (ASCA) directed against yeast phosphopeptidomannan can be used as specific diagnostic markers [2,3]. Recently, some researchers [4] stated that cases of yeast allergy in medical literature may be underestimated and should be considered in patients with adverse reactions to yeast-containing products. Among this population, a baker’s yeast-exclusion diet has to be proposed for the management of these patients, with immediate stabilization of their manifestations [5].
In this context, the opportunity of replacing S. cerevisiae with microorganisms possessing similar metabolic pathways is of utmost importance. The use of Zymonomas mobilis as a leavening agent may increase the variety of baked goods alternatives to those leavened by yeast. The potential product will be addressed to people having adverse responses to the ingestion of baked foods leavened with S. cerevisiae, providing a solution to the growing incidence of yeast hypersensitivity. This bacterium is able to metabolize only glucose, fructose and sucrose but not maltose through the Entner-Doudoroff (ED) pathway; in comparison with glycolysis, the ED route yields 1 ATP instead of 2 per every glucose molecule processed, as well as 1 NADH and 1 NADPH instead of 2 NADH. Nevertheless, the enzymes involved in alcoholic fermentation are analogous to those present in yeasts, therefore resulting in the production of an equimolar mixture of ethanol and CO2 [6]. Thanks to its high ethanol resistance (up to 12%), Z. mobilis is also gaining great interest in bioethanol production [6,7].
Musatti et al. [8] reported that Z. mobilis strains belonging to the official DSMZ collection (Deutsche Sammlung von Mikroorganismen und Zellkulturen GmbH), grown on a medium without yeast–derived compounds, were able to efficiently leaven model doughs when glucose was added to boost the ED catabolic pathway (20 g flour, 15 mL distilled water and 2 g glucose, leavening at 29 °C). Its interesting leavening performance was also confirmed in bread-like dough formulations (333 g flour, 167 mL distilled water) added with glucose or fructose [9,10]. However, when employing these strains, the addition of NaCl was found to slow down the dough rising. Doughs leavened by Z. mobilis DSMZ strains were also analyzed for their metabolomic profiles of the aromatic VOCs developed during leavening. This bacterial species developed proper fermentation products, such as ethanol, acetic acid and 2-butanone-4-hydroxy, similarly to traditional starter cultures used in bakery applications. However, these strains were also able to address a unique signature in fermented doughs for the production of nonanoic and undecanoic acids [11].
In the present research, we focused on the use of two Z. mobilis wild strains, isolated by water kefir. Water kefir is a slightly carbonated, acidic beverage produced by fermenting a solution of sucrose, to which figs or other dried fruits and lemon have been added. The fermentation process is generally driven by a combination of bacteria and yeasts which live in symbiosis in water kefir grains.
These two wild strains were first characterized for their biomass production levels in the absence or increasing presence of NaCl; successively, their leavening performance was tested in a real bread-like dough formulation, containing 1.5% NaCl (w/w on flour). The analysis of the population dynamics of bacterial and fungal communities during dough leavening was also performed through the Automated Ribosomal Intergenic Spacer Analysis (ARISA). This characterization allowed for changes to be monitored inside the microbial communities present in doughs over leavening time. Results were compared with data obtained from doughs leavened with S. cerevisiae, in order to understand how the presence of Z. mobilis may affect the dough’s microbial population and richness. The obtained results will pave the way for the safe use of selected wild strains of Z. mobilis in commercial yeast-free salty-leavened products.

2. Materials and Methods

2.1. Microorganisms and Maintenance

In the present study, two new isolates of Z. mobilis were used i.e., UMB 478 and UMB 479 (UMB: University of Milan Bacterial Collection). Strains were maintained in DSM liquid medium [8]. All ingredients were dissolved in distilled water, pH set at 6.8 and sterilized at 112 °C for 30 min. Stock cultures of both microorganisms were stored at −80 °C in the same medium with 20% (v/v) glycerol (VWR International, Leuven, Belgium).
Samples of compressed commercial baker’s yeast (S. cerevisiae) were purchased at a local supermarket (Carrefour, Milan, Italy). Yeast was stored at 4 °C and used within the first two weeks after purchase.

2.2. Z. mobilis Growth Kinetics

Cell growth of Z. mobilis was studied at 30 °C in 384-well plates containing DSM liquid medium with different percentages of inoculum, i.e., 5 and 10% (v/v); for both strains, glucose, fructose and sucrose (20 g/L) were alternatively used as carbon and energy sources, while maintaining the other ingredients of DSM medium (bacto-peptone and yeast extract) without changing the pH. Each condition was tested in five replicates.
Culture turbidity (OD) was measured spectrophotometrically at 600 nm every 30 min for 72 h in a PowerWave™ XS2 Microplate Spectrophotometer (BioTek, Winooski, VT, USA); lag phase (min) and maximum growth rate (OD/h) were determined by fitting data using the DMFit 3.5 Excel add-in [12].

2.3. Z. mobilis Biomass Production

The two strains were cultured in 1 L flasks with 600 mL of DSM-YF (yeast-free) liquid medium containing glucose, casein hydrolysate (10 g/L) and meat extract (5 g/L). Flasks were inoculated with 5% (v/v) of an 8 h pre-culture grown in DSM medium. Cultures were incubated at 30 °C for 16 h under stationary conditions.
Biomass growth was determined in terms of cell dry weight (CDW), as previously reported [8]. Briefly, an aliquot of culture broth was centrifuged at 8600× g for 20 min at 5 °C in a JA-10 centrifuge (Beckman Coulter, Cassina de Pecchi, Milan, Italy), and the recovered cell pellet was washed with deionized water and centrifuged again. Cell dry weight (CDW) was determined after drying the cell pellet at 105 °C for 18–24 h.

2.4. Z. mobilis Sensitivity to NaCl: MIC and MBC

Z. mobilis cell growth was evaluated at 30 °C in 96-well plates containing DSM liquid cultures (10% v/v inoculum) and different NaCl concentrations (Merck KGaA, Darmstadt, Germany): 0–1.25–2.5–5–10–15–20–30–40 g/L. Culture turbidity (OD) was measured spectrophotometrically at 600 nm every 15 min for 24 h, as reported in Section 2.2. The lag phase (min) and maximum growth rate (OD/h) were determined by fitting data on DMFit 3.5 Excel add-in [12]. Minimum Inhibitory Concentration (MIC) was determined as the lowest NaCl concentration that produced no visible growth, i.e., an OD not significantly different from that of non-inoculated wells. For the evaluation of Minimum Bactericidal Concentration (MBC), 10 µL of culture collected at the end of the analysis were inoculated on DSM agar plates (DSM added with 15 g/L of agar) and incubated for 24–48 h at 30 °C. MBC was determined as the lowest NaCl concentration producing less than 10 colonies on plates.

2.5. Doughs Production

Doughs were prepared with 288 g of 00 wheat flour (Molino Colombo, Paderno d’Adda, Lecco, Italy), glucose 8.64 g (3% w/w on flour), NaCl 4.32 g (1.5% w/w on flour) and adding 158 mL of distilled water in which the inoculum (Z. mobilis or S. cerevisiae) was suspended in terms of 1.5 mg CDW/g of dough (5 × 10⁸ cells/g dough). The amount of water was determined through the Brabender® Farinograph (Brabender OHG, Duisburg, Germany; 300 g chamber, 30 °C) in order to obtain a dough consistency of 500 ± 25 BU (Brabender Unit). Ingredients were mixed in a blender (CNUM5ST, Bosch, Stuttgart, Germany) at speed 1 for 1 min and at speed 2 for 3 min.
The dough was divided into 3 sections [10] as follows:
-
250 g, inserted into a 1 L graduate cylinder to evaluate the dough volume increase every 30 min for up to 6 h of leavening.
-
25 g, inserted into a double chamber flask connected to a graduate burette filled with 0.1 M NaCl, to evaluate the total amount of CO2 produced every 30 min for up to 6 h of leavening. Two other unconventional indices were extrapolated from the dough development curves: the lag leavening time (LLT, h), defined as the time before an increase in dough height was noticed, the leavening rate (LR, mm/h), as the slope of the first linear part of the curve after LLT, and maximum dough volume (DV max, mL) [12].
-
The remaining sample was left to leaven in 4 closed sterile containers, one for each sampling time. The doughs were incubated at 30 °C and samples were taken at 0, 2, 4 and 6 h to determine dough pH and to perform microbiological and HPLC (High-Performance Liquid Chromatography) analyses.

2.6. Microbiological Analyses

At appropriate leavening intervals, 5 g of dough was diluted in 45 mL sterile peptone water (10 g/L Bacto-peptone in distilled H2O, pH 6.8) and homogenized in a Stomacher (Seward, Worthing West Sussex, UK) for 3–4 min. After appropriate decimal dilutions, suspensions were plated in proper media: Z. mobilis onto DSM agar, incubated at 30 °C for 3 days under anaerobic conditions; and baker’s yeast (S. cerevisiae) onto MEA (Malt Extract Agar, Oxoid, Basinstoke, UK), then incubated at 30 °C for 48 h. Total mesophilic aerobic bacterial count (TBC) was determined by pour plating on Tryptic Soy Agar (TSA, Scharlab, Barcelona, Spain) after incubation at 30 °C for 24–48 h. When S. cerevisiae was used, TSA was added with 0.1% (v/v) cycloheximide (Sigma-Aldrich) to avoid TBC overestimation due to yeast growth. Yeasts and molds were determined by plating on Yeast Glucose Chloramphenicol Agar (YGC-Scharlab, Barcelona, Spain) and incubated at 25 °C for 3–5 days. Counts were reported as logarithms of the number of colony-forming units (Log CFU/g of dough) with means and standard deviation values of two technological replicates.

2.7. Analytical Determinations

Consumption of sugars (maltose and glucose) as well as ethanol, lactic and acetic acid produced during leavening, were determined through an HPLC system (L 7000, Merck Hitachi, Darmstadt, Germany) equipped with RI and UV (210 nm) detectors connected in series as reported by Musatti et al. [13]. Aliquots of 2–4 mL of homogenized and appropriately diluted dough samples were centrifuged (Eppendorf 5804, 10,600× g, 10 min) and the obtained supernatants were filtered through a 0.45 µm syringe filter (VWR International, Leuven, Belgium) before HPLC analysis. Data were referred to as 100 g of flour (g/100 g). Results represent the mean and standard deviation values of two technological replicates.
Dough pH was monitored at different intervals for the whole undiluted dough sample (pH-meter mod. pH 510, Eutech, Toronto, ON, Canada).

2.8. Automated Ribosomal Intergenic Spacer Analysis (ARISA)

Dough aliquots were collected immediately after dough production (t0) and after a 6 h leavening (t6) for the characterization of the bacterial and fungal communities at the beginning and at the end of leavening. Total DNA was extracted in triplicate from each aliquot. Each replica was powdered in liquid nitrogen using a sterilized mortar and then DNA was extracted through the DNeasy PowerSoil kit (QIAGEN, Hilden, Germany) according to manufacturer guidance with the first vortexing step performed in an Eppendorf ThermoMixer Comfort (Eppendorf, Wesseling, Germany) at 1400 rpm for 10 min. The purified DNA yield was quantified using Qubit™ (Thermo Fisher Scientific, Waltham, MA, USA), while the quality was determined through gel electrophoresis of 10 g/L 1 × TAE agarose gels. DNA was stored at −80 °C until analyses.
Polymerase chain reactions (PCRs) for the fingerprinting of fungal and bacterial analyses were executed as per Table A1. PCR products were checked through gel electrophoresis 15 g/L 1 × TAE agarose gels. For ARISA analyses, 3 μL of each PCR reaction, including negative controls and controls containing the DNA from Z. mobilis and S. cerevisiae cultures, were mixed with 14 μL of HiDi Formamide (Applied Biosystems—Life Technologies, Carlsbad, CA, USA), plus 0.8 μL of 1200 bp LIZ standards (Molecular probes—Life Technologies, USA). Samples were shipped to STAB Vida Lda. (Caparica, Portugal) for capillary electrophoresis. Raw peak profiles were analyzed using the AB Peak Scanner Software™ v1.0 (Applied Biosystems, Monza, Italy). Peaks below a fluorescence threshold of 50 units were discarded from the analyses [14], while all fragments between 150 and 1400 bp were considered. The output table was exported and converted using Microsoft-Excel macro Treeflap [15]. The data matrix obtained through Treeflap was further normalized and only peaks present in all replicates were kept for further analyses to remove rare species and facilitate interpretation.

2.9. Statistical Analysis

Analytical results were treated with one-way analyses of variance (ANOVA) and when the effect was significant (p < 0.05), the differences between the means were separated by the Tukey-b test with multiple comparisons. Data were processed by Sigma Plot (v. 14, Systat Sofware, Inc., San Jose, CA, USA).
All statistical analyses were performed on R studio (version 4.1.1, Ihaka R. and Gentleman R., Auckland, Australia; www.r-project.com; accessed on 1 September 2021). Taxonomic summaries were performed using the phyloseq package [16]. Richness and diversity indexes were calculated using the ‘vegan’ package [17]. After the Shapiro-Wilk test was used to test for normality, differences were tested by one-way analysis of variance (ANOVA) followed by Tukey’s post hoc test (p < 0.05), while non-normal data were analyzed through a non-parametric Kruskal-Wallis test followed by Dunn’s Test. T-test and Wilcoxon-signed rank test were used for normal and non-normal pairwise comparisons, respectively.
Multivariate analyses were performed on the peak’s relative abundances. Non-metric multidimensional scaling (NMDS) was constructed based on Bray-Curtis distances. Results were confirmed through the PERMANOVA test [17]. Furthermore, pairwise comparisons were performed with the ‘pairwiseAdonis’ package [18].

3. Results and Discussion

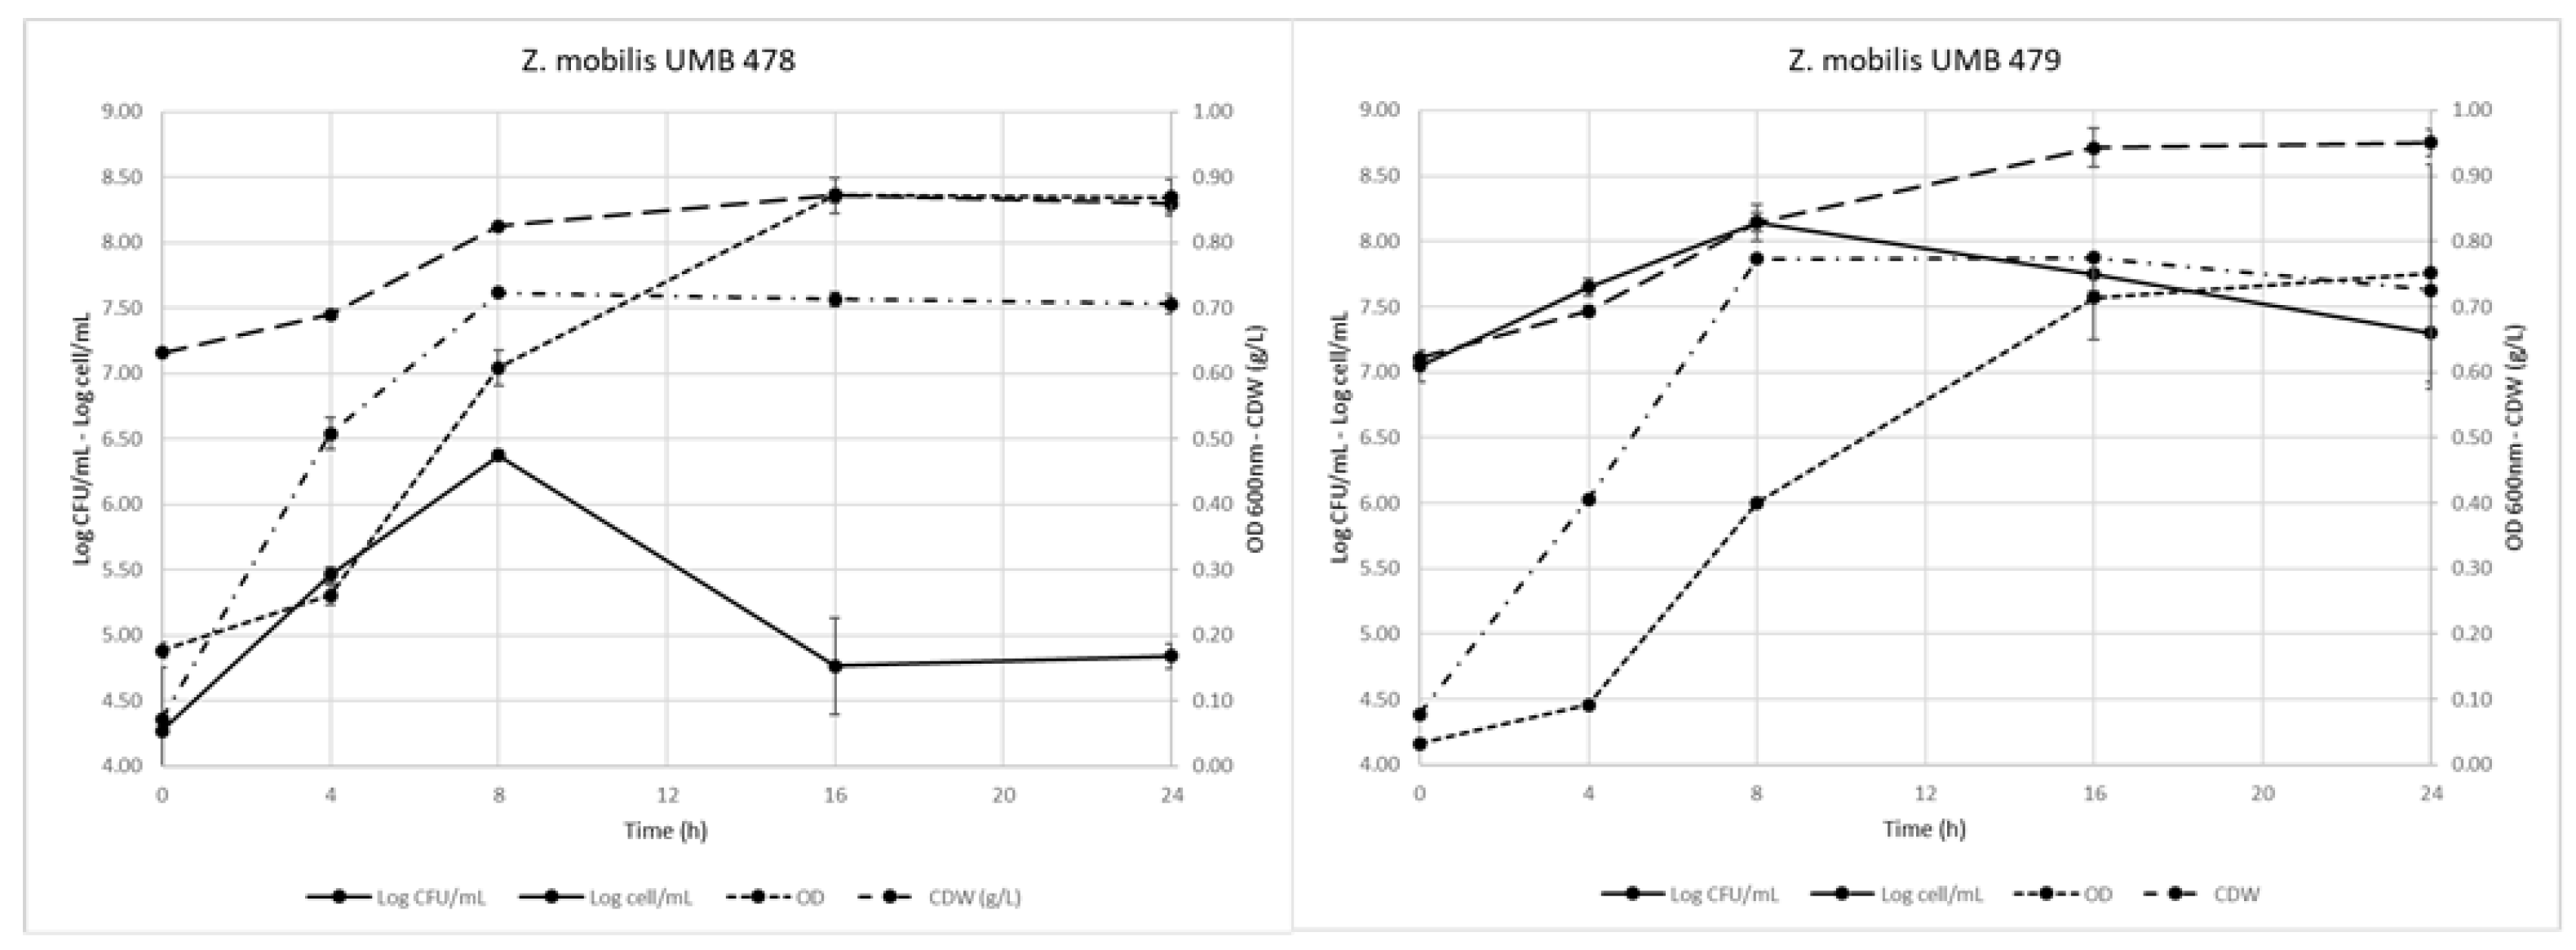
3.1. Z. mobilis Growth and Biomass Production

Cell growth of Z. mobilis was studied in cultures having alternatively used glucose, fructose or sucrose as carbon and energy source. The parametrization was carried out on time courses of culture turbidity by applying the DmFit Excel add-in to obtain the following indices: lag phase duration (min), maximum growth rate (OD/h) and final OD reached (Yend) (Table 1). The two strains presented a similar behavior: the shortest lag phase durations (2.60 ± 0.42–2.76 ± 0.18 h) were evidenced using the highest cell inoculum (10% v/v) and glucose as carbon and energy source both for UMB478 and UMB479; the longest and statistically different (p < 0.05) lag phase was instead obtained with 5% cell inoculum for UMB478 with fructose (around 6.06 ± 0.20 h). The maximum growth rate was found to be not statistically different (p < 0.05) between strains, with performances in the range of 0.08–0.14 OD/h; nevertheless, both strains have statistically lower growth rates with fructose as substrate. The highest Yend values (1.023 ± 0.041 OD for UMB478 and 1.078 ± 0.012 OD for UMB479, respectively) were again evidenced at 10% cell inoculum with sucrose for both strains. The higher growth parameters found for Z. mobilis with glucose may be explained by the fact that this bacterium is unique among prokariotes in that it relies solely on a facilitated diffusion system (uniport, GLF) to transport glucose and fructose without expending metabolic energy; however, GLF has a higher affinity (Km 2–4 mM) for glucose than for fructose (Km 40 mM). Sucrose, instead, is converted into glucose and fructose using up to three sucrose-splitting enzymes: an extracellular levansucrase (LevU), forming the fructose oligosaccharide levan and glucose; an extracellular invertase (InvB), forming glucose and fructose; and a second invertase (InvA), whose exact role and location in Z. mobilis is still unclear [19].
The two strains were then cultured in 1 L flasks containing 600 mL of DSM-YF (yeast free) liquid medium with glucose and incubated for up to 24 h. Biomass growth was evaluated in terms of both CFU/mL and cell concentration (cell/mL) as well as for turbidity increase (OD 600 nm). Both strains, but mainly UMB478, formed cell aggregates resulting in a 3 Log difference between colony and cell counts (Figure 1). Recently, Fuchino and Bruheim [20] highlighted that some Z. mobilis strains present a filamentous shape, in particular, a bulged pole as a consequence of stress or as an adaptation to the environment. Cultures reached similar OD (approximately 1.00) and cell concentrations (8.4 Log CFU/mL); as regards biomass production, both strains reached their maximum level (0.7 g CDW/L) after 8 h of incubation. These values agree with those already published (around 0.6 g CDW/L, OD close to 1.00) either for strains belonging to official collections or from mutants able to constitutively synthetize extracellular sucrose-hydrolyzing enzymes [8,21,22]. These mutants could be of interest also in the present research because of the possibility to set up biotechnological production of Z. mobilis biomass, employing low-cost raw ingredients (i.e., molasses).

3.2. Strains Sensitivity to NaCl: MIC and MBC

A disadvantage of all Z. mobilis strains, even for the industrial production of ethanol, is the low tolerance to inorganic ions, frequently present at inhibitory concentrations; they can be found in dough formulations (flour, water…) but also in industrial feedstocks, such as molasses and lignocellulosic residues [7], reducing the fermentation performance. One of the inorganic ions most frequently present in doughs is NaCl. To understand the sensitivity of the two Z. mobilis wild strains to NaCl, cell growth was studied at 10 different salt concentrations ranging from 0 to 40 g/L in cultures prepared with glucose as a carbon and energy source; in these trials, the percentage of inoculum was always maintained at 10% (v/v). The culture turbidity (OD) was measured, and the lag phase (min) and maximum growth rate (OD/h) were determined (Table 2 and Table 3). Minimum Inhibitory Concentration (MIC) and Minimum Bactericidal Concentration (MBC) were evaluated for each strain.
As for Z. mobilis UMB478, NaCl concentrations above 10 g/L significantly prolonged the lag phase duration (up to +75.2 ± 13.9%), while the growth rate was significantly reduced even at 2.5 g/L NaCl. The final population was reduced up to −61.0%. Both MIC and MBC were set at 20 g/L NaCl.
Z. mobilis UMB479 deeply modified the growth rate at 15 g/L NaCl (−46.8%). The lag phase duration significantly changed from 7.5 g/L NaCl, but with lower reduction respect to UMB478. This resistance to NaCl was also proven by the determination of MIC and MBC that were found at NaCl 20 g/L and 30 g/L, respectively.
The high physiological resistance proven by the Z. mobilis UMB 479 wild strain may be of interest not only in the bakery sector, in which NaCl might be present in dough formulation, but also for the commercial production of bioethanol; as Z. mobilis is known to be sensitive to saline stress at a mild concentration, hampering its industrial use as efficient biocatalysts, researchers have investigated adaptive evolutionary approaches to obtain salt-tolerant Z. mobilis strain able to growth at 10–20 g/L NaCl [20,22].

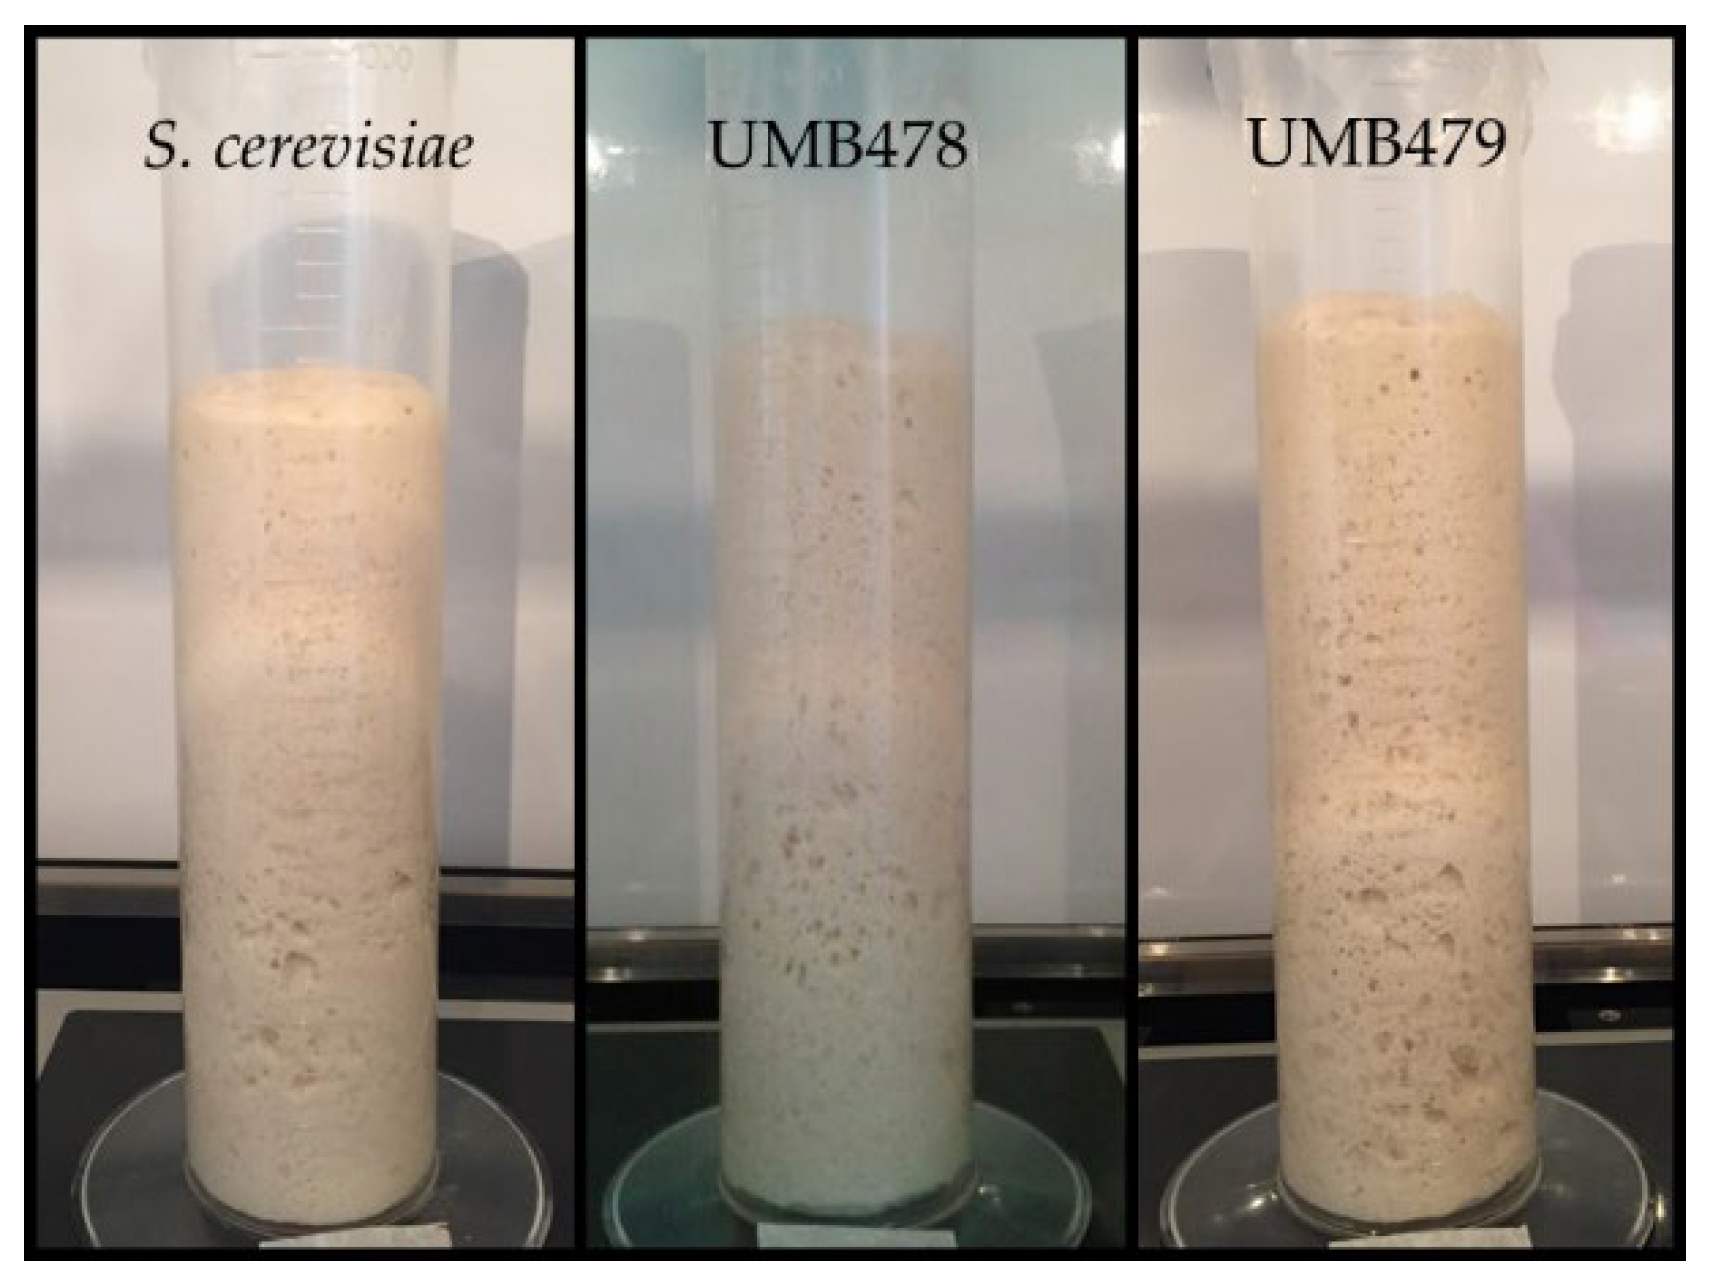
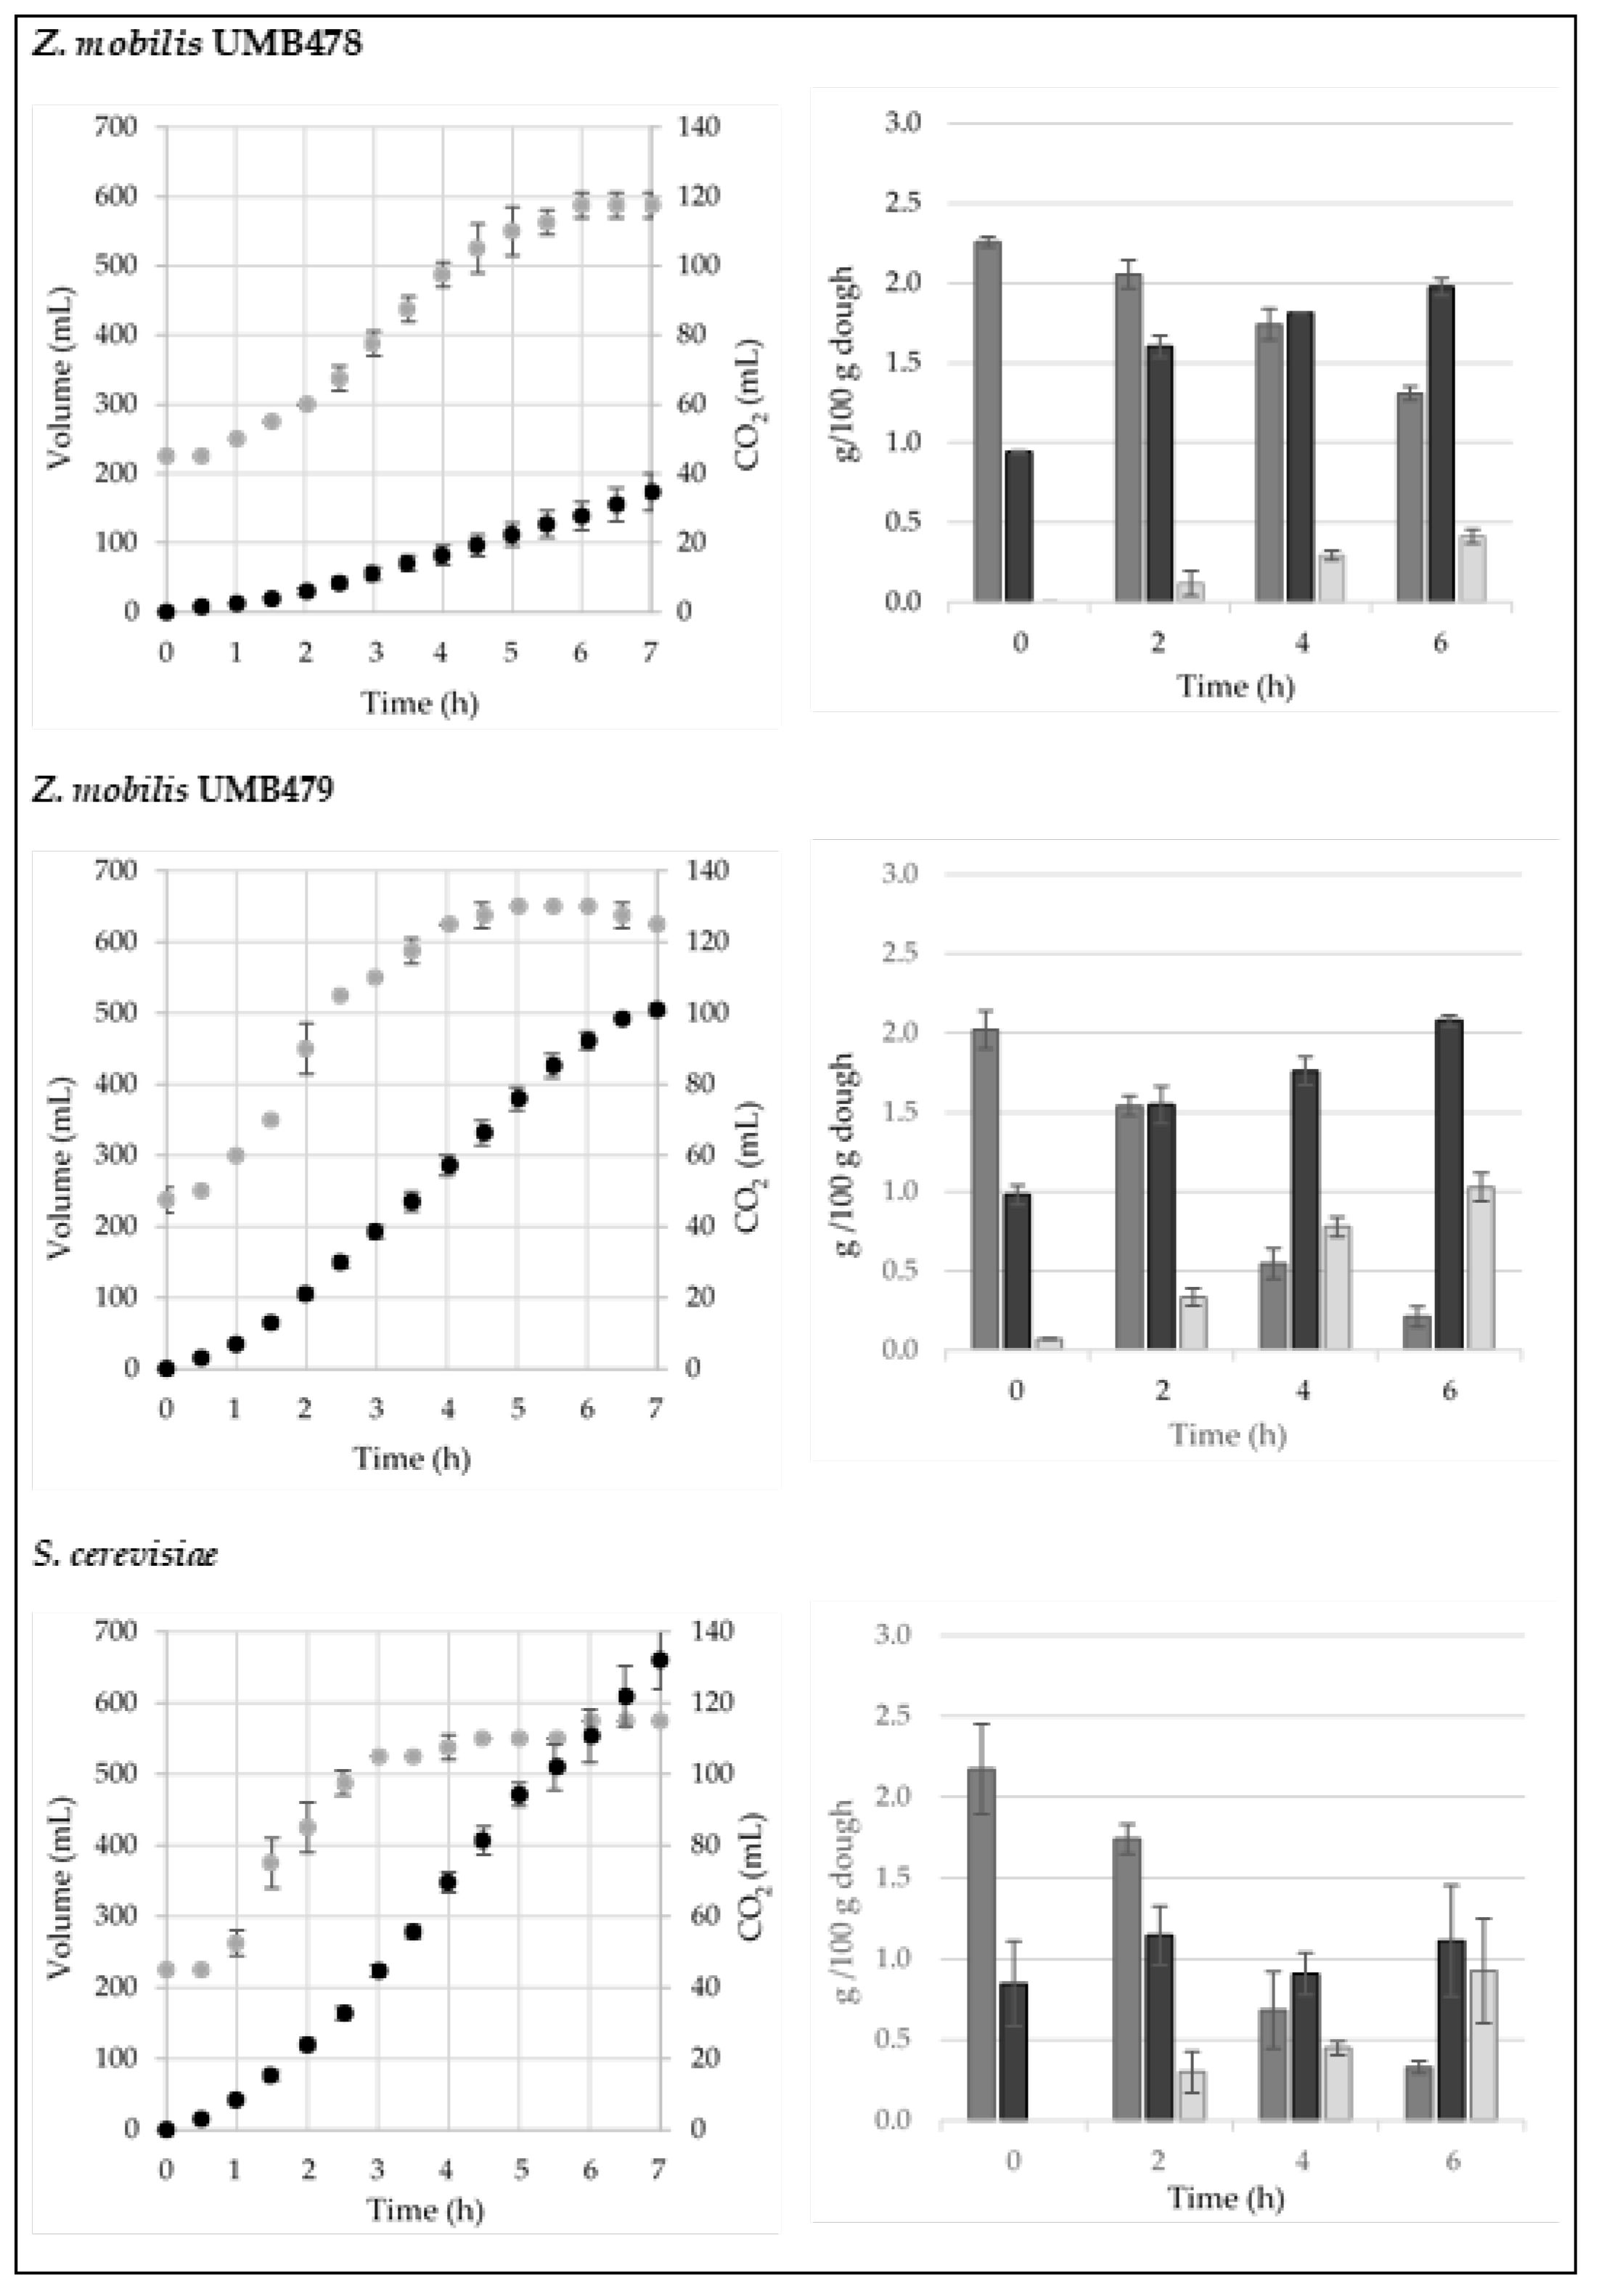
3.3. Doughs Production

Doughs were prepared by suspending the biomass in flour and H2O at a cell concentration of 5 × 10⁸ cells/g with the addition of NaCl 1.5% (w/w on flour). In this set of experiments, S. cerevisiae was used at the same cell concentration as Z. mobilis for comparison purposes. During leavening, the dough volume increased, and the total amount of produced CO2, the dough pH, the fermentable sugars content and the ethanol production were monitored (Figure 2).
Z. mobilis UMB478 produced a maximum dough volume increase of 588 ± 18 mL in 6 h of leavening, doubling the initial volume in 3.5 h. The total CO2 produced was only 34.6 ± 5.4 mL, and the dough pH decreased from 5.89 ± 0.00 to 5.27 ± 0.04. The data obtained by HPLC analysis confirmed the difficulty of this strain in leavening the dough (Figure 3, first row). As previously reported, this strain frequently produces cell aggregates, so far the viable count (UFC/g) was lower than the total count (cells/g): Z. mobilis UMB478 inoculated at 5.66 ± 0.19 Log (CFU/g) highlighted a 1 Log increase during leavening.
Z. mobilis UMB479 produced a high amount of CO2 during the leavening trials (approximately 101.0 ± 1.8 mL), doubling the initial dough volume in 2 h and reaching a final volume of 650 mL after 5 h. Glucose was almost consumed with a high amount of ethanol produced: approximately 1 g/100 g, nearly +200% respect to the ethanol produced by UMB478 (Figure 3, second row).
Using S. cerevisiae, the dough doubled its volume in 2 h, reaching a final level of 575 mL, lower than Z. mobilis UMB479 (Figure 3, third row). However, the amount of CO2 was the highest, reaching 132 ± 8.2 mL. As expected, baker’s yeast fermented the maltose present in the dough, consuming about 1 g/100 g during 6 h—that is half of the residual maltose present in Z. mobilis leavened doughs. Note that Z. mobilis UMB479 produced a higher and faster volume increase than S. cerevisiae at a similar initial cell concentration. The obtained data were higher than those reported in Musatti et al. [9] using Z. mobilis strains belonging to the DSMZ official collection without adding NaCl; in those trials, the lag leavening time (LLT) was in the range of 6–7 h and the leavening rate (LR) was 5–6 mL/h. Here, the two Z. mobilis wild strains provided faster LLT (0.6–1.2 h) and very high LR, 92–139 mL/h, confirming their interesting fermentation performance (Table 4).
Microbiological determinations relating to the beginning and end of the leavening trials are reported in Table 5. TBC values at 6 h were found significantly different between S. cerevisiae and Z. mobilis UMB478 but not with UMB479. The TBC reduction of near 0.5 Log CFU/g was also evidenced in Nissen et al. [11] employing Z. mobilis collection strains. Yeast and mold counts were obviously higher when the baker’s yeast was used; however, both Z. mobilis strains reduced the initial eumycetes naturally present in flour during dough leavening, again around 0.5 Log CFU/g. As previously reported, UMB478 accounted for a lower colony number due to its aggregation ability. The pH of the dough was found to decrease to a greater extent during Z. mobilis leavening (about 0.6 pH unit) compared to S. cerevisiae. This behavior is to be attributed to the production of organic acids by the bacterium and may be the reason for the lower TBC evidenced in these doughs.

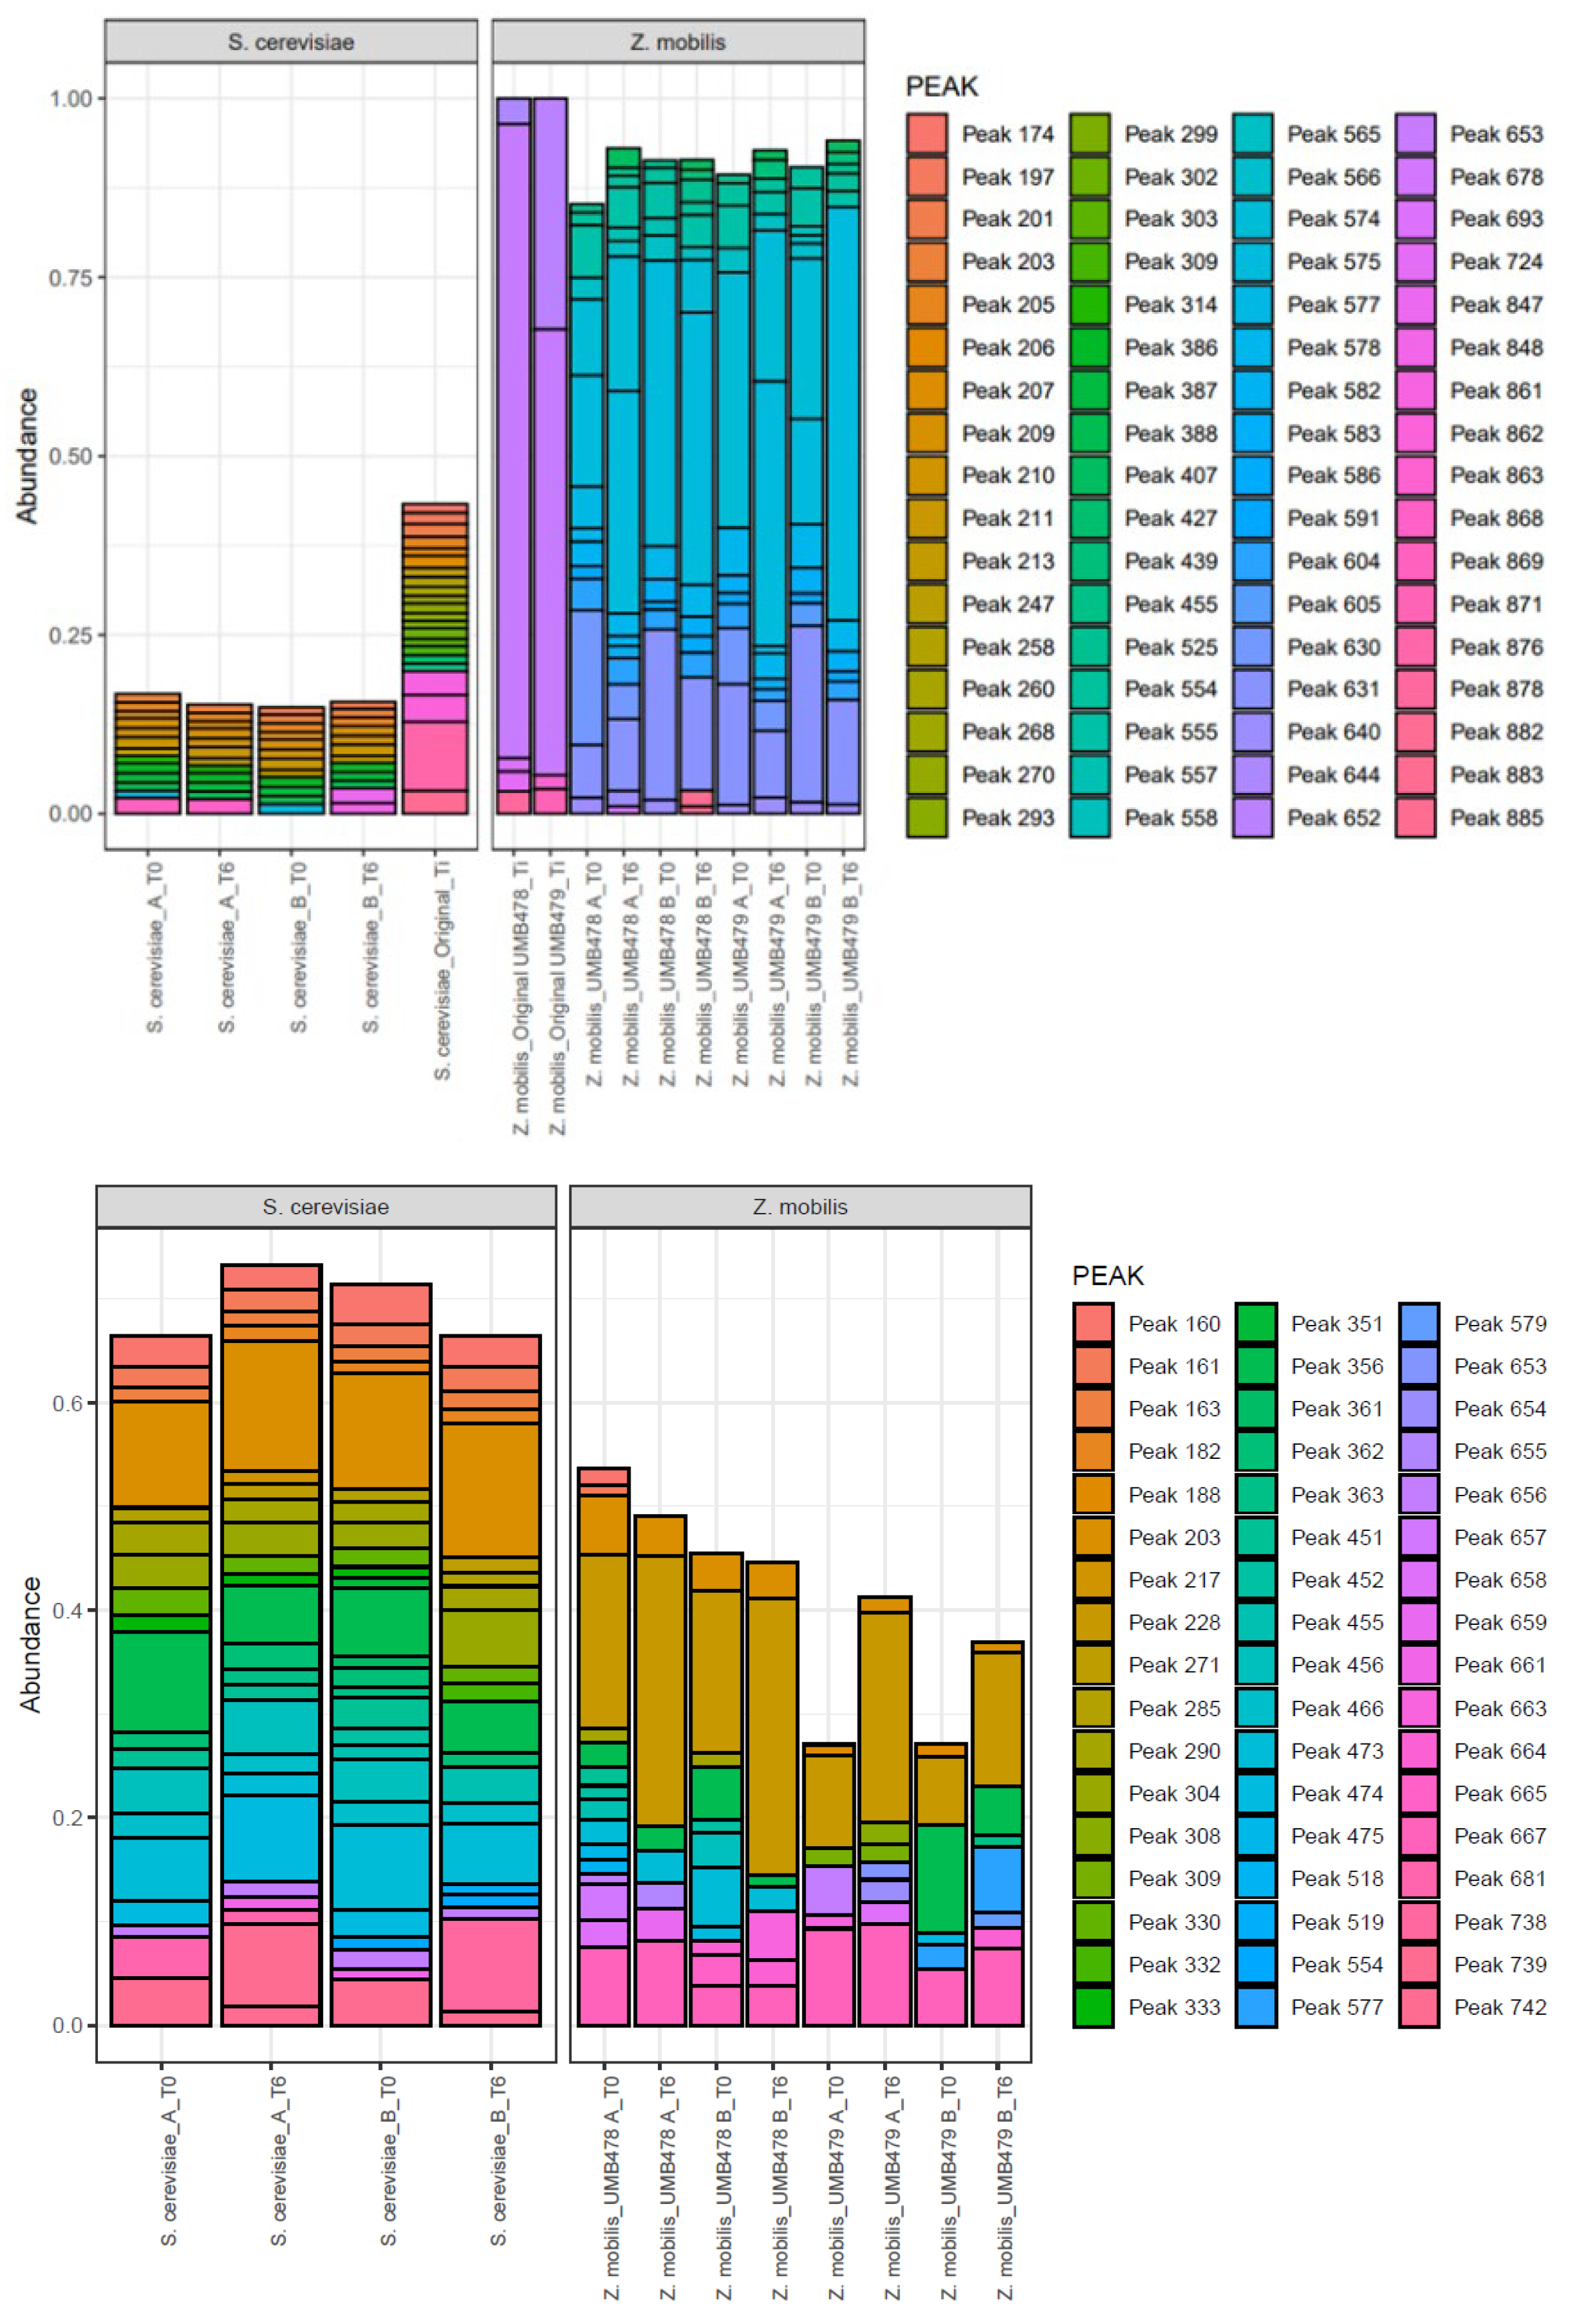
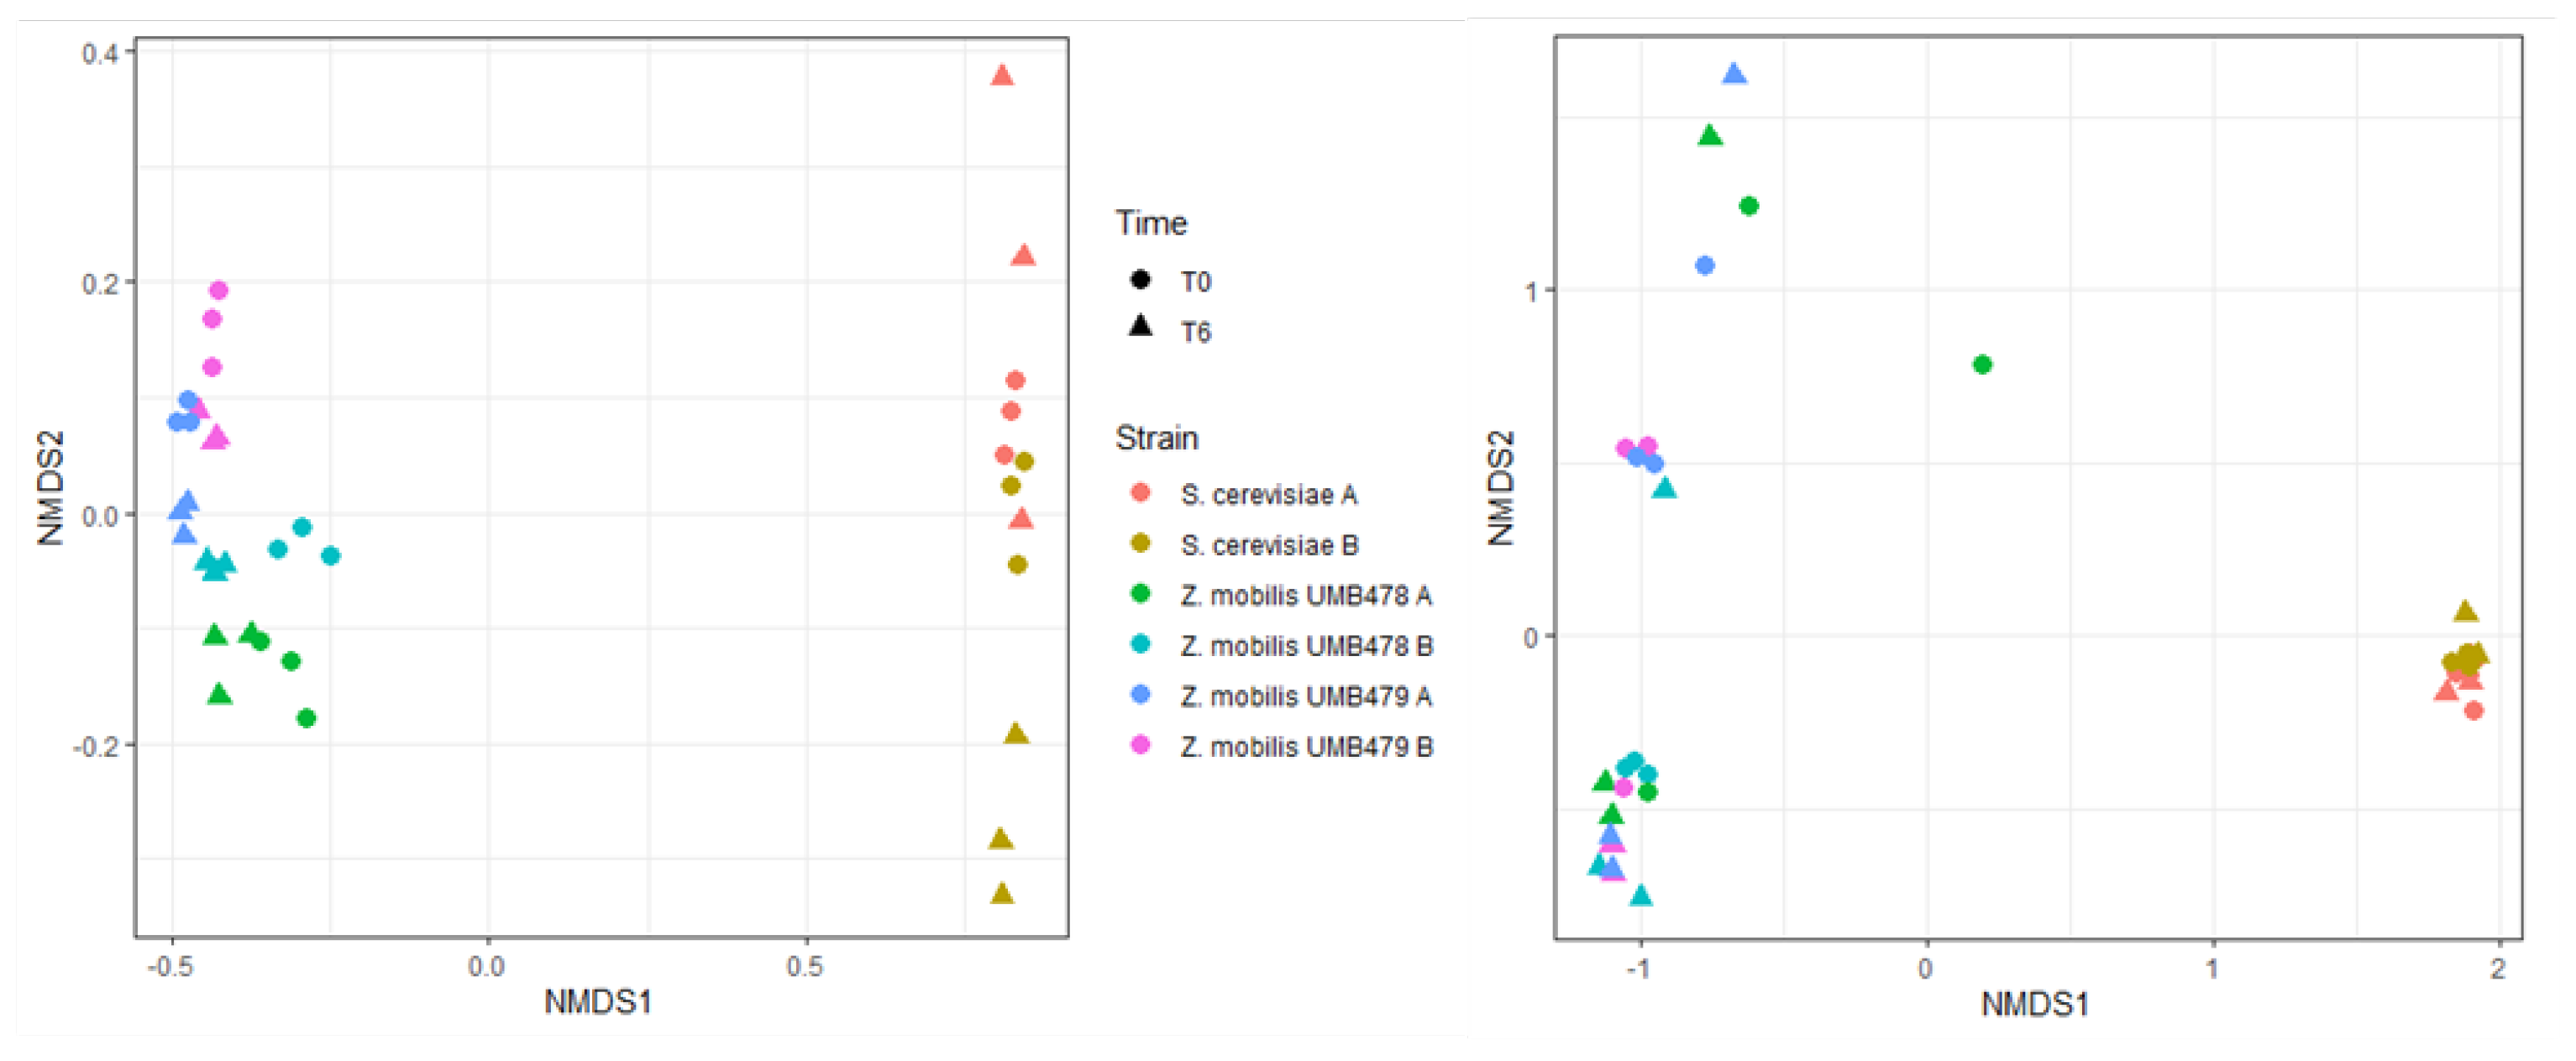
3.4. Population Dynamics

The ARISA analysis is known to produce reliable correlations between microbial-community structure and environmental conditions [23,24]. ARISA was further selected for this study, as it enables a quick and cheap high-resolution fingerprint analysis, especially useful for monitoring changes in microbial communities over time for a high number of samples. Although this technique has been used in a range of studies to characterize and produce a snapshot of fungal and bacterial communities and their development within food systems [25,26], very few studies are present for dough production and focus mainly on sourdough [27]. Here, the ARISA analysis was used to understand the development of fungal and bacterial communities in doughs inoculated with S. cerevisiae and Z. mobilis, comparatively, before (t0) and after (t6) dough leavening. For each strain, two technological replicates (A and B) were analyzed.
Ecological factors and the nature of the cereals have a major impact on the establishment of a characteristic microbial community [28]. Generally, Saccharomycetales are found driving fermentation alone in culture-based methods. However, in bakery doughs, Saccharomyces has been found to be isolated at a higher frequency and together with a number of other yeasts (e.g., Torulaspora delbrueckii, Kazachstania servazzii, Pichia fermentans, Wickerhamomyces anomalus, Kazachstania bulderi and Meyerozyma guilliermondii) possibly in symbiotic or mutualistic interactions, probably due also to environmental and flour conditions of species diversity [29].
Z. mobilis is a relatively unknown bacterium in the context of dough production, with studies focusing more on the leavening performance and dough-quality assessment rather than on the bacterial community [9,11,16]. Musatti et al. [16] investigated the association of Z. mobilis with Fructilactobacillus sanfranciscensis; however, most community studies of association with both fungi and other bacteria involving Z. mobilis are still limited to the context of beverages, mainly alcoholic, in relation to fermentation and spoilage [30,31,32].
In general, fungal ARISA for doughs prepared with S. cerevisiae produced a higher number of species and a higher alpha diversity and evenness than those with Z. mobilis (p < 0.001) (Table 6). These high values can be attributed to the contribution of compressed yeast: it should be noted that the fungal richness and evenness of the commercial yeast preparation are considerably high (162 and 0.9, respectively). On the other hand, the low fungal richness of the doughs prepared with Z. mobilis may be due only to the fungal species present in the flour. After 6 h of leavening, the fungal richness remained almost constant in doughs prepared with S. cerevisiae and Z. mobilis UMB 478, while statistically decreased for Z. mobilis UMB 479 (p < 0.01).
As expected, doughs prepared with the bacterium Z. mobilis evidenced higher bacterial richness (max. 344) than those inoculated with compressed yeast (max. 245) (p < 0.001). During leavening, values remained almost constant with Z. mobilis, while they decreased by about 15–20% in samples produced with compressed yeast (p < 0.01).
Population dynamics, in terms of the number of peaks and their relative abundances (the higher the peak the higher the abundance), showed a higher number of low abundant peaks in the fungal community of doughs leavened by S. cerevisiae (Figure A1). Doughs prepared with Z. mobilis, on the other hand, showed a higher presence of highly abundant peaks. When looking at the bacterial ARISA, Z. mobilis showed a slightly higher portion of lower abundant peaks than S. cerevisiae.
S. cerevisiae created a more complex fungal community which showed a higher complexity from inoculum to the dough matrices, similar before and after leavening. The same was valid for the fungal community evolved by Z. mobilis; however, here a higher diversity was seen between the original strains and the doughs.
In terms of beta diversity, as shown by the NMDS, two main clusters occurred, for both fungal and bacterial populations of doughs, associated with the leavening agent: Z. mobilis or S. cerevisiae (Figure 4). More in-depth, Permanova analyses indicated that for Z. mobilis, the type of strain (p = 0.001) and the leavening time (p = 0.014) but not their interaction affected the fungal population. As regards S. cerevisiae, again data evidenced that the fungal community was not affected by the leavening time. The bacterial population of S. cerevisiae seemed to be influenced by both leavening time (p = 0.001), dough replicates (p = 0.001) and their interaction (p = 0.004). The bacterial population of Z. mobilis showed influences of leavening time, type of strain and their interaction (p = 0.001); pairwise comparison further confirmed differences among strains (p < 0.005) and between leavening times (p < 0.05).
Given the varied communities retrieved and the influence of the inoculum in shaping the communities, it is likely that the obtained variation across samples is the result of the interaction between a wide number of both bacterial and fungal species evolving across time together with Z. mobilis and S. cerevisiae.

4. Conclusions

In the present study, two Z. mobilis wild strains isolated from water kefir (UMB478 and UMB479) were cultured in a yeast-free liquid medium and the obtained cells were used as inoculum to produce bread-like doughs. The leavening performances and the microbial population dynamics were characterized, comparing the data with those obtained employing a commercially available baker’s yeast in compressed form (S. cerevisiae).
The growing performance of the two strains was similar to strains belonging to the official collection; however, UMB479 proved a very interesting resistance to NaCl (MBC 30 g/L) that may be of interest not only in the bakery sector in which NaCl might be present in dough formulation but also for the commercial production of bioethanol. Dough leavening performances were, therefore, higher than those already reported in the literature, confirming their interest in the bakery sector. The ARISA analysis, applied to understand the development of fungal and bacterial communities of doughs inoculated with S. cerevisiae and Z. mobilis comparatively, highlighted that the doughs leavened by UMB479 showed an interesting decrease in fungal richness after 6 h leavening; this feature deserves investigation as it may represent a positive aspect to be correlated with the possible increase in the shelf life of baked products.
These data will pave the way for the use of Z. mobilis, with particular attention to the wild strain UMB479, in bread-like formulations for the production of yeast-free baked goods.

Author Contributions

Conceptualization, M.R. and C.P.; methodology, A.M., L.B. and E.C.; software, A.M., L.B. and E.C.; validation, M.R., L.B. and C.P.; formal analysis, A.M. and E.C.; investigation, M.R. and C.P.; writing—original draft preparation, M.R., L.B. and E.C.; writing—review and editing, M.R., C.P. and E.C.; funding acquisition, M.R. and L.B. All authors have read and agreed to the published version of the manuscript.

Funding

This research received no external funding.

Data Availability Statement

Data are not available in public datasets; please contact the authors.

Acknowledgments

Authors would like to thank Matthias Ehrmann of the Technische Universität München (Germany) for kindly donating the strains used in our study. The Department of Food, Environmental and Nutritional Sciences, Università degli Studi di Milano, partially covered the open access APC (APC = Article processing charge).

Conflicts of Interest

The authors declare no conflict of interest.

Appendix A

Table A1. PCR condition for ARISA analysis.
TargetPrimers (Sequence 5′→3′)PCR ConditionReferences
16S rRNA (Bacteria)F: ITSF
GTCGTAACAAGGTAGCCGTA
R: ITSReub-6FAM
GCCAAGGCATCCACC
94 °C 3 min; 35 cycles: 94 °C 45 s, 55 °C 1 min, 72 °C 2 min; 72 °C 10 min.
30 µL TOT: 3 µL DNA, 15 µL DreamTaq
(2×) (Thermo Fisher Scientific, USA), 0.6 µL of each primer 10 µM, 10.8 µL H2O.
[33]
Internal Transcribed
Spacer region (ITS) (Fungi)
F: ITS1F-6FAM
CTTGGTCATTTAGAGGAAGTAA
R: ITS4
TCCTCCGCTTATTGATATGC
95 °C 2 min; 35 cycles: 95 °C 1 min, 53 °C 30 s, 72 °C 1 min; 72 °C 10 min.
25 µL TOT: 3 µL DNA, 15 µL DreamTaq (2×) (Thermo Fisher Scientific, USA), 0.75 µL of each primer at 10 µM, 5.5 µL H2O.
[34,35,36]
Figure A1. Population dynamics showing composition of ITS peaks (>1%) (top) and of 16S peaks (>1%) (bottom). Average values of three replicates are shown for each bar.
Foods 11 02768 g0a1

References

  1. Sicard, D.; Legras, J.-L. Bread, beer and wine: Yeast domestication in the Saccharomyces sensu stricto complex. Comptes Rendus-Biol. 2011, 334, 229–236. [Google Scholar] [CrossRef] [PubMed]
  2. Rinaldi, M.; Perricone, R.; Blank, M.; Perricone, C.; Shoenfeld, Y. Anti-Saccharomyces cerevisiae autoantibodies in autoimmune diseases: From bread baking to autoimmunity. Clin. Rev. Allergy Immunol. 2013, 45, 152–161. [Google Scholar] [CrossRef] [PubMed]
  3. Salamati, S.; Martins, C.; Kulseng, B. Baker’s yeast (Saccharomyces cerevisiae) antigen in obese and normal weight subjects. Clin. Obes. 2015, 5, 42–47. [Google Scholar] [CrossRef] [PubMed]
  4. Bansal, R.A.; Tadros, S.; Bansal, A.S. Beer, Cider, and Wine Allergy. Case Reports Immunol. 2017, 2017, 7958924. [Google Scholar] [CrossRef]
  5. Colboc, H.; Fite, C.; Cannistra, C.; Chaby, G.; Maillard, H.; Bouscarat, F.; Crickx, B.; Gabison, G.; Ezzedine, K.; Descamps, V.; et al. Interest of Brewer’s Yeast-Exclusion Diet in the Management of Hidradenitis Suppurativa. J. Clin. Exp. Dermatol. Res. 2016, 7, 1000371. [Google Scholar]
  6. Panesar, P.S.; Marwaha, S.S.; Kennedy, J.F. Zymomonas mobilis: An alternative ethanol producer. J. Chem. Technol. Biotechnol. 2006, 81, 623–635. [Google Scholar] [CrossRef]
  7. Vriesekoop, F.; Rasmusson, M.; Pamment, N.B. Respective effects of sodium and chloride ions on filament formation and growth and ethanol production in Zymomonas mobilis fermentations. Lett. Appl. Microbiol. 2002, 35, 27–31. [Google Scholar] [CrossRef]
  8. Musatti, A.; Rollini, M.; Sambusiti, C.; Manzoni, M. Zymomonas mobilis: Biomass production and use as a dough leavening agent. Ann. Microbiol. 2015, 65, 1583–1589. [Google Scholar] [CrossRef]
  9. Musatti, A.; Cappa, C.; Mapelli, C.; Alamprese, C.; Rollini, M. Zymomonas mobilis in Bread Dough: Characterization of Dough Leavening Performance in Presence of Sucrose. Foods 2020, 9, 89. [Google Scholar] [CrossRef]
  10. Musatti, A.; Mapelli, C.; Rollini, M.; Foschino, R.; Picozzi, C. Can Zymomonas mobilis Substitute Saccharomyces cerevisiae in Cereal Dough Leavening? Foods 2018, 7, 61. [Google Scholar] [CrossRef]
  11. Nissen, L.; Rollini, M.; Picozzi, C.; Musatti, A.; Foschino, R.; Gianotti, A. Yeast-Free Doughs by Zymomonas mobilis: Evaluation of Technological and Fermentation Performances by Using a Metabolomic Approach. Microorganisms 2020, 8, 792. [Google Scholar] [CrossRef]
  12. Baranyi, J.; Roberts, T.A. A dynamic approach to predicting bacterial growth in food. Int. J. Food Microbiol. 1994, 23, 277–294. [Google Scholar] [CrossRef]
  13. Musatti, A.; Mapelli, C.; Foschino, R.; Picozzi, C.; Rollini, M. Unconventional bacterial association for dough leavening. Int. J. Food Microbiol. 2016, 237, 28–34. [Google Scholar] [CrossRef]
  14. Pancher, M.; Ceol, M.; Corneo, P.E.; Longa, C.M.O.; Yousaf, S.; Pertot, I.; Campisano, A. Fungal endophytic communities in grapevines (Vitis vinifera L.) Respond to crop management. Appl. Environ. Microbiol. 2012, 78, 4308–4317. [Google Scholar] [CrossRef]
  15. Rees, G.N.; Baldwin, D.S.; Watson, G.O.; Perryman, S.; Nielsen, D.L. Ordination and significance testing of microbial community composition derived from terminal restriction fragment length polymorphisms: Application of multivariate statistics. Int. J. Gen. Mol. Microbiol. 2005, 86, 339–347. [Google Scholar] [CrossRef]
  16. McMurdie, P.J.; Holmes, S. Phyloseq: An R Package for Reproducible Interactive Analysis and Graphics of Microbiome Census Data. PLoS ONE 2013, 8, e61217. [Google Scholar] [CrossRef]
  17. Oksanen, J.; Blanchet, F.G.; Friendly, M.; Kindt, R.; Legendre, P.; McGlinn, D.; Minchin, P.R.; O’Hara, R.B.; Simpson, G.L.; Solymos, P.; et al. Vegan: Community Ecology Package. R Package Version 2.5-7. 2020. Available online: https://CRAN.R-project.org/package=vegan (accessed on 1 September 2021).
  18. Martinez Arbizu, P. PairwiseAdonis: Pairwise Multilevel Comparison Using Adonis. R Package Version 0.4. 2020. Available online: https://github.com/pmartinezarbizu/pairwiseAdonis (accessed on 1 September 2021).
  19. Sprenger, G.A. Carbohydrate metabolism in Zymomonas mobilis: A catabolic highway with some scenic routes. FEMS Microbiol. Lett. 1996, 145, 301–307. [Google Scholar] [CrossRef]
  20. Fuchino, K.; Bruheim, P. Increased salt tolerance in Zymomonas mobilis strain generated by adaptative evolution. Microb. Cell Fact. 2020, 19, 147. (accessed on 1 September 2021). [Google Scholar] [CrossRef]
  21. Oda, Y.; Tonomura, K. Dough-leavening by Zymomonas mobilis and Its Application to Breadmaking. J. Food Sci. 1994, 59, 171–174. [Google Scholar] [CrossRef]
  22. Wang, J.L.; Wu, B.; Qin, H.; You, Y.; Liu, S.; Shui, Z.X.; Tan, F.R.; Wang, Y.W.; Zhu, Q.L.; Li, Y.; et al. Engineered Zymomonas mobilis for salt tolerance using EZ-Tn5-based transposon insertion mutagenesis system. Microb. Cell Fact. 2016, 15, 101. [Google Scholar] [CrossRef]
  23. van Dorst, J.; Bissett, A.; Palmer, A.S.; Brown, M.; Snape, I.; Stark, J.S.; Raymond, B.; McKinlay, J.; Ji, M.; Winsley, T.; et al. Community fingerprinting in a sequencing world. FEMS Microbiol. Ecol. 2014, 89, 316–330. [Google Scholar] [CrossRef]
  24. Pioli, S.; Antonucci, S.; Giovannelli, A.; Traversi, M.L.; Borruso, L.; Bani, A.; Brusetti, L.; Tognetti, R. Community fingerprinting reveals increasing wood-inhabiting fungal diversity in unmanaged Mediterranean forests. For. Ecol. Manag. 2018, 408, 202–210. [Google Scholar] [CrossRef]
  25. Arteau, M.; Labrie, S.; Roy, D. Terminal-restriction fragment length polymorphism and automated ribosomal intergenic spacer analysis profiling of fungal communities in Camembert cheese. Int. Dairy J. 2010, 20, 545–554. [Google Scholar] [CrossRef]
  26. Bagheri, B.; Bauer, F.F.; Setati, M.E. The impact of Saccharomyces cerevisiae on a wine yeast consortium in natural and inoculated fermentations. Front. Microbiol. 2017, 8, 1988. [Google Scholar] [CrossRef] [PubMed]
  27. De Angelis, M.; Di Cagno, R.; Gallo, G.; Curci, M.; Siragusa, S.; Crecchio, C.; Parente, E.; Gobbetti, M. Molecular and functional characterization of Lactobacillus sanfranciscensis strains isolated from sourdoughs. Int. J. Food Microbiol. 2007, 114, 69–82. [Google Scholar] [CrossRef] [PubMed]
  28. Hammes, W.P.; Brandt, M.J.; Francis, K.L.; Rosenheim, J.; Seitter, M.F.H.; Vogelmann, S.A. Microbial ecology of cereal fermentations. Trends Food Sci. Technol. 2005, 16, 4–11. [Google Scholar] [CrossRef]
  29. Chiva, R.; Celador-Lera, L.; Uña, J.A.; Jiménez-López, A.; Espinosa-Alcantud, M.; Mateos-Horganero, E.; Vega, S.; Santos, M.Á.; Velázquez, E.; Tamame, M. Yeast biodiversity in fermented doughs and raw cereal matrices and the study of technological traits of selected strains isolated in Spain. Microorganisms 2021, 9, 47. [Google Scholar] [CrossRef]
  30. Alcántara-Hernández, R.J.; Rodríguez-Álvarez, J.A.; Valenzuela-Encinas, C.; Gutiérrez-Miceli, F.A.; Castañón-González, H.; Marsch, R.; Ayora-Talavera, T.; Dendooven, L. The bacterial community in “taberna” a traditional beverage of Southern Mexico. Lett. Appl. Microbiol. 2010, 51, 558–563. [Google Scholar] [CrossRef]
  31. Misery, B.; Legendre, P.; Rue, O.; Bouchart, V.; Guichard, H.; Laplace, J.M.; Cretenet, M. Diversity and dynamics of bacterial and fungal communities in cider for distillation. Int. J. Food Microbiol. 2021, 339, 108987. [Google Scholar] [CrossRef]
  32. Weir, P.M. The ecology of Zymomonas: A review. Folia Microbiol. 2016, 61, 385–392. [Google Scholar] [CrossRef]
  33. Cardinale, M.; Brusetti, L.; Quatrini, P.; Borin, S.; Puglia, A.M.; Rizzi, A.; Zanardini, E.; Sorlini, C.; Corselli, C.; Daffonchio, D. Comparison of different primer sets for use in automated ribosomal intergenic spacer analysis of complex bacterial communities. Appl. Environ. Microbiol. 2004, 70, 6147–6156. [Google Scholar] [CrossRef] [Green Version]
  34. Gardes, M.; Bruns, T.D. ITS primers with enhanced specificity for basidiomycetes-application to the identification of mycorrhizae and rusts. Mol. Ecol. 1993, 2, 113–118. [Google Scholar] [CrossRef]
  35. Gleeson, D.B.; Clipson, N.; Melville, K.; Gadd, G.M.; McDermott, F.P. Characterization of fungal community structure on a weathered pegmatitic granite. Microb. Ecol. 2005, 50, 360–368. [Google Scholar] [CrossRef]
  36. White, T.J.; Bruns, T.; Lee, S.; Taylor, J. Amplification and direct sequencing of fungal ribosomal RNA genes for phylogenetics. In PCR Protocols; Academic Press: London, UK, 1990; pp. 315–322. [Google Scholar]
Figure 1. Z. mobilis UMB478 (left) and UMB479 (right) biomass growth evaluated in terms of colony count (Log CFU/mL), total cell count (Log cell/mL), culture turbidity (OD 600 nm) and cell dry weight (CDW g/L).
Foods 11 02768 g001
Figure 2. Doughs leavened (6 h) by S. cerevisiae, Z. mobilis UMB478 and UMB479.
Foods 11 02768 g002
Figure 3. CO2 production (mL, black) and dough volume increase (mL, grey) of dough samples inoculated with Z. mobilis UMB478, UMB479 and compressed baker’s yeast (S. cerevisiae) (left); time course of glucose (dark grey), maltose (black) and ethanol (light grey) (g/100 g of dough) in dough samples (right).
Foods 11 02768 g003
Figure 4. Non-metric multidimensional scaling (NMDS) of fungal (left) and bacterial (right) communities based on Bray-Curtis dissimilarities.
Foods 11 02768 g004
Table 1. Growth curves fitting parameters of liquid cultures of Z. mobilis UMB478 and UMB479 containing glucose, fructose and sucrose, respectively, inoculated at 5 and 10% (v/v): lag phase duration (h), growth rate (OD/h) and final OD reached (Yend). Mean and standard deviation of four replicates.
Carbon SourceStrainInoculum
(% v/v)
Lag Phase
(h)
Growth Rate (OD/h)Yend
(OD)
GlucoseUMB47854.32 ± 0.050.12 ± 0.000.887 ± 0.008
102.76 ± 0.180.12 ± 0.010.949 ± 0.035
UMB47954.47 ± 0.270.10 ± 0.010.810 ± 0.046
102.60 ± 0.420.10 ± 0.020.832 ± 0.074
FructoseUMB47856.06 ± 0.200.09 ± 0.010.850 ± 0.057
103.49 ± 0.180.09 ± 0.000.909 ± 0.018
UMB47955.19 ± 0.550.08 ± 0.010.815 ± 0.077
104.10 ± 0.440.08 ± 0.000.736 ± 0.020
SucroseUMB47855.14 ± 0.090.11 ± 0.010.923 ± 0.049
103.51 ± 0.260.14 ± 0.021.023 ± 0.041
UMB47955.20 ± 0.170.11 ± 0.010.985 ± 0.018
103.20 ± 0.340.12 ± 0.001.078 ± 0.012
Table 2. Variations (%) in lag phase duration, growth rate and final OD reached (Yend) of Z. mobilis UMB478 grown in liquid culture in presence of NaCl (1.25–15 g/L) respect to control culture (no NaCl). Mean and standard deviation of two replicates compound; different superscript letters within a column indicate significantly different samples (p < 0.05).
NaCl (g/L)Lag Phase (%)Growth Rate (%)Yend (OD) (%)R2
1.25−1.1 ± 8.1 a−14.5 ± 4.5 c−17.5 ± 0.3 d0.995
2.5−7.4 ± 7.9 a−25.3 ± 3.0 b−23.0 ± 0.3 b0.996
3.75−6.4 ± 11.0 a−33.7 ± 4.0 b−18.0 ± 0.5 d0.989
5+8.2 ± 5.9 a−21.7 ± 3.1 b−20.7 ± 0.3 c0.999
7.5+13.7 ± 9.8 a−36.1 ± 2.7 b−23.2 ± 0.3 b0.994
10+55.6 ± 11.3 b−37.4 ± 3.9 b−14.9 ± 0.3 e0.994
15+75.2 ± 13.9 b−79.5 ± 1.7 a−61.0 ± 0.3 a0.994
Table 3. Variations (%) in lag phase duration, growth rate and final OD reached (Yend) of Z. mobilis UMB479 grown in liquid culture in presence of NaCl (1.25–15 g/L) respect to control culture (no NaCl). Mean and standard deviation of two replicates; different superscript letters within a column indicate significantly different samples (p < 0.05).
NaCl (g/L)Lag Phase (%)Growth Rate (%)Yend (OD) (%)R2
1.25−8.1 ± 3.8 a−6.4 ± 3.1 c−3.9 ± 0.5 c0.998
2.5−13.5 ± 3.6 a−12.8 ± 2.9 b−9.7 ± 0.5 a0.998
3.75−14.4 ± 3.6 a−13.8 ± 2.9 b−10.6 ± 0.5 a0.998
5−12.3 ± 3.7 a−7.5 ± 4.1 bc−3.6 ± 0.5 c0.998
7.5+3.5 ± 4.3 b−6.4 ± 4.1 bc−7.2 ± 0.5 b0.997
10+12.1 ± 4.9 c−3.2 ± 4.2 c+8.8 ± 0.7 d0.997
15+47.0 ± 5.3 d−46.8 ± 2.2 a−5.2 ± 0.5 c0.999
Table 4. Dough leavening properties (mean and standard deviation values of two technological replicates): lag leavening time (LLT, h), leavening rate (LR, mL/h) and maximum dough volume (DV max, mL) of dough samples leavened with the two Z. mobilis wild strains and baker’s yeast for comparison purposes.
MicrorganismLLT (h)LR (mL/h)DV Max (mL)R2
Z. mobilis UMB4781.2 ± 0.192.1 ± 12.8586.5 ± 13.80.999
Z. mobilis UMB4790.6 ± 0.0139.1 ± 2.3642.7 ± 8.21.000
S. cerevisiae0.6 ± 0.1153.6 ± 10.6551.1 ± 5.20.999
Table 5. Total bacterial count (TBC), yeasts and molds (Y&M) and Z. mobilis population (Log CFU/g) in doughs at time 0 and after 6 h of leavening with Z. mobilis UMB478 and UMB479 and S. cerevisiae. Mean and standard deviation of two replicates; different superscript letters within a column indicate significantly different samples (p < 0.05).
StrainTime
(h)
TBC
(Log CFU/g)
Y&M
(Log CFU/g)
Z. mobilis
(Log CFU/g)
pH
Z. mobilis UMB47805.21 ± 0.072.72 ± 0.095.66 ± 0.195.89± 0.01 c
64.71 ± 0.08 ab2.32 ± 0.195.65 ± 0.025.27 ± 0.04
Z. mobilis UMB47905.15 ± 0.112.23 ± 0.148.41 ± 0.175.73 ± 0.01 b
64.63 ± 0.16 b1.57 ± 0.248.39 ± 0.195.14 ± 0.01
S. cerevisiae05.28 ± 0.097.28 ± 0.29-5.31 ± 0.02 a
65.07 ± 0.02 a7.37 ± 0.17-5.13 ± 0.10
Table 6. Species richness, diversity indices (Shannon and Simpson) and Pielou’s evenness of the bacterial and fungal communities of doughs at time 0 and after 6 h of leavening with Z. mobilis UMB478, UMB479 and S. cerevisiae. Data are indicated for both technological replicates (A and B).
Dough SampleFungal Bacterial
Species RichnessShannonSimpsonPielou’s EvennessSpecies RichnessShannonSimpsonPielou’s Evenness
Z. mobilis UMB478 A t0106 ± 492.7 ± 0.50.8 ± 0.10.6 ± 0.1274 ± 224.4 ± 0.11.0 ± 0.00.8 ± 0.0
Z. mobilis UMB478 A t640 ± 22.2 ± 0.10.7 ± 0.00.6 ± 0.0291 ± 134.2 ± 0.00.9 ± 0.00.7 ± 0.0
Z. mobilis UMB478 B t063 ± 32.3 ± 0.00.8 ± 0.00.6 ± 0.0278 ± 54.6 ± 0.01.0 ± 0.00.8 ± 0.0
Z. mobilis UMB478 B t655 ± 292.3 ± 0.50.7 ± 0.10.6 ± 0.0269 ± 114.3 ± 0.00.9 ± 0.00.8 ± 0.0
Z. mobilis UMB479 A t070 ± 42.4 ± 0.10.8 ± 0.00.6 ± 0.0344 ± 115.1 ± 0.21.0 ± 0.00.9 ± 0.0
Z. mobilis UMB479 A t634 ± 31.9 ± 0.10.7 ± 0.00.5 ± 0.0310 ± 134.6 ± 0.01.0 ± 0.00.8 ± 0.0
Z. mobilis UMB479 B t068 ± 152.3 ± 0.20.8 ± 0.00.6 ± 0.0313 ± 125.1 ± 0.11.0 ± 0.00.9 ± 0.0
Z. mobilis UMB479 B t635 ± 131.9 ± 0.10.7 ± 0.00.5 ± 0.0326 ± 114.9 ± 0.11.0 ± 0.00.9 ± 0.0
S. cerevisiae162 ± 04.7 ± 01.0 ± 00.9 ± 0----
S. cerevisiae A t0214 ± 295.2 ± 0.21.0 ± 0.01.0 ± 0.0236 ± 234.2 ± 0.11.0 ± 0.00.8 ± 0.0
S. cerevisiae A t6219 ± 195.2 ± 0.11.0 ± 0.01.0 ± 0.0179 ± 174.1 ± 0.11.0 ± 0.00.8 ± 0.0
S. cerevisiae B t0243 ± 135.3 ± 0.01.0 ± 0.01.0 ± 0.0245 ± 24.3 ± 0.01.0 ± 0.00.8 ± 0.0
S. cerevisiae B t6274 ± 295.4 ± 0.01.0 ± 0.01.0 ± 0.0207 ± 154.2 ± 0.01.0 ± 0.00.8 ± 0.0
Publisher’s Note: MDPI stays neutral with regard to jurisdictional claims in published maps and institutional affiliations.

