1. Introduction
In response to the current momentum towards legume-based ingredients in the food industry, research is needed to critically assess their impacts, especially on the quality perceived by consumers in food applications. Among a diverse range of potential sources, pea (
Pisum sativum L.) is of particular interest because of its high nutritional value, low cost, specific functional properties, and agronomic crop benefits [
1,
2,
3]. Moreover, in view of the rapid growth of the market for gluten-free foods, alternatives to wheat flours are necessary for the increasing number of people diagnosed with celiac disease, wheat allergy, or gluten sensitivity [
4]. Although several studies have reported on the potential of dry pea ingredients in traditional products [
5,
6,
7] as well as in novel meat analogues and dairy substitutes [
3,
8], their unpleasant flavor still hinders widespread use, especially their green-beany aroma and bitter taste [
9,
10,
11]. Moreover, when aiming to develop new functional plant ingredients with improved organoleptic profiles which avoid resource-intensive processing steps, a comparison of quality parameters between more and less refined ingredients is needed [
12,
13].
The bitter flavor of pea ingredients may be influenced by numerous chemical compounds and phenomena such as saponins [
11], polyphenols [
14], lipid oxidation products [
15], protein hydrolysates [
16], and Maillard reaction products [
17]. However, saponins, non-volatile triterpenoidal glycosides, were selected for this study because of their reported sensory bitterness and thermolability [
11,
18,
19]. In addition, along with other dry pulses, peas are one of the main sources of dietary saponins, and their health benefits are well documented [
19,
20]. Two main types have been described in peas: soyasaponin I or Bb (saponin Bb) and soyasaponin VI or βg (saponin βg), whose only chemical difference is a 2,3-dihydro-2,5-dihydroxy-6-methyl-4H-pyran-4-one (DDMP) attached to the aglycone C22 of saponin βg, which is substituted by a hydroxyl group in saponin Bb. It is hypothesized that βg is the native form in pea while Bb is only the product of decomposition of the former, which releases the DDMP moiety upon heating, storage, and pH changes [
11,
18]. Interestingly, in aqueous solutions, βg has been found to be significantly more bitter than Bb [
11].
It was the thermolability of saponin βg, coupled with the loss of bittering potency, which drove this study on pea-based ingredients and sponge cakes. Although these compounds have been studied in pea as raw materials [
18,
21] and for canned applications [
19], their characteristics in more complex foods are little understood. Sponge cakes were therefore chosen as the system to study the relationship between product quality and pea ingredient reactivity. In these studies, researchers mostly investigated odorants, while taste received less attention [
7,
22,
23]. During the present study, two yellow pea flours, whole pea flour (PF) and a pea flour reconstituted by replacing whole pea flour with the two main purified fractions (PS + PPI, pea starch and pea protein isolate) were used for cake formulation (PFC and PSPPIC). The PS and PPI were mixed in order to maintain a constant level of the protein/starch ratio found naturally in whole pea flour, so that both flours displayed similar technological and nutritional characteristics in the cakes.
The aim of this study was threefold: first, to investigate the presence of the two saponins in both pea ingredients and sponge cakes containing pea flour and the composite pea flour; second, to elucidate the impact of baking on the chemical state of saponins quantified in PFC, and third, to explore the evolution of perceived bitterness as assessed by a trained panel at different baking times in the cakes and its link with the saponin composition of the ingredients.
2. Materials and Methods
2.1. Ingredients
Pea flour (PF), protein isolate (PPI), and starch (PS) from the same batch of yellow peas were supplied by Cargill (Vilvoorde, Belgium). PPI and PS were sub-fractions that resulted from the wet fractionation of PF [
7]. The reconstructed PS + PPI flour was a 2:1 mixture (
w/
w) of PS and PPI. Sucrose was purchased from Tereos (Lille, France), sunflower oil from Lesieur (Asnières-sur-Seine, France), and whole pasteurized eggs came from AgroDoubs (Flagey, France).
2.2. Chemicals
For saponin extraction, ultrapure water obtained by a Simplicity® system (Millipore, Saint Quentin, Yvelines, France), HPLC-grade ethanol (Carlo Erba, Val de Reuil, France) and Leucine-enkephalin (Sigma Aldrich, Saint Quentin Fallavier, France) were used. For HPLC analyses, deionized water, acetonitrile (Biosolve Chimie, Dieuze, France) and 99% formic acid from (Fisher Chemical, Illkirch, France) were used and were all LC/MS grade.
2.3. Sponge Cake Formulations
Sponge cakes were produced according to the method described by [
7], which consisted of the following summarized steps: (i) eggs (45%
w/
w) and sucrose (25%
w/
w) were beaten for 10 min using a mixer equipped with a vertical whisk (KitchenAid Artisan 5KSM150, St. Joseph, MI, USA); (ii) non-sifted flours (PF or PS + PPI) (25%
w/
w) were gently folded into the mixture within 1.5 min; (iii) after mixing for 30 s, the sunflower oil (5%
w/
w) was incorporated within 15 s and the batter beaten for a further 1 min; (iv) the batter (25 g) was poured into baking molds and baked at 170 °C. Five cakes made with PF (PFC) were baked at 170 °C for 10, 15, 20, 25, and 30 min.
Using the same temperature and time points, five cakes made with PS + PPI (PSPPIC) were also produced. The cakes were labelled according to the flour type and baking time used (See
Table 1).
Table 1 also details the experiments for which they were used. PFD0 was the dough analyzed as the starting point of the saponin kinetics prior to cooking. All the cakes baked were used for sensory analyses, except PDF0. The two pea flour formulations were compared after 25 min baking (PSPPIC25 and PFC25) regarding their chemical and sensory characteristics.
2.4. Physical Characterization of Cakes
All cakes were characterized in terms of their density, moisture content, and color. Density was determined in quadruplicate by calculating the mass-to-volume ratio. Volume was calculated using a laser-based scanner (VolScan Profiler, Stable Micro Systems, Surrey, UK). Moisture content was determined in sextuplicate by the desiccation of about 4 g, accurately weighed, of ground cake for 24 h at 105 °C in a ventilated oven (Memmert, Schwabach, Germany). Grinding was performed for 20 s at 6000 rpm using a Grindomix GM200 knife mill equipped with a stainless-steel bowl and titanium blades (Retsch GmbH, Haan, Germany). The CIE L*a*b* color parameters of the upper surface of the crust were measured at three different points using a spectro-guide sphere gloss colorimeter (BYK-Gardner, Geretsried, Germany). All physical characterization data are presented in
Appendix A.
2.5. Saponin Analysis
2.5.1. Extraction
Six hundred milligrams of either ground cake or ingredient powders (in triplicate) were extracted with 4 mL of ethanol/ultrapure water (70/30 v/v) containing 1 mg·L−1 Leucine-enkephalin. The latter was added as an internal standard to correct the MS detection signal over time. The suspensions were kept under constant stirring at 350 rpm at room temperature for 1 h then centrifuged at 20 °C and 3600× g for 10 min. The supernatants were diluted (1:10 for cake and 1:500 for ingredient powders), filtered through a 0.20 µm nylon filter, and placed in HPLC vials. These were stored at −20 °C until used for analysis.
2.5.2. Identification
Pea saponins were analyzed by HPLC using a Dionex Ultimate 3000 separation module (ThermoFisher Scientific, Germering, Germany) coupled with an Orbitrap Q Exactive Focus HR-MS (ThermoFisher Scientific, Bremen, Germany). Separation was performed with an InfinityLab Poroshell 120 EC-C18 column (2.1 × 100 mm; particle diameter 2.7 µm, Agilent Technologies, Les Ulis, France). The mobile phases used were (A) deionized water containing 0.1% formic acid (
v/
v) and (B) acetonitrile containing 0.1% formic acid (
v/
v). The mobile phase flow rate was 0.5 mL·min
−1 and the gradient program was set as follows: 20% B was held for 1 min, then B was increased from 20% to 100% within 4 min, held at 100% for 2 min and then decreased to 20% B within 0.1 min, and kept for 2.9 min for system equilibration prior to the next injection. The injection volume was 1 µL. Column temperature was set at 30 °C. MS detection was performed in negative polarity for higher sensitivity with respect to the investigated compounds. The scan type was full MS and ranged from 120.0 to 1500.0
m/z. The in-source CID fragmentation was 5.0 eV but no further fragmentation was applied. The monoisotopic masses of the chemical formulas of the investigated compounds were calculated: 942.5188 Da and 1068.5505 Da for saponins Bb and βg, respectively. Peak areas were calculated by extracting the chromatograms (XIC) of each pseudo molecular ion at specific mass ranges (3–5 ppm error),
m/z 1067.5432 [M − H]
− and
m/z 941.5115 [M − H]
− for saponins βg and saponin Bb, respectively. The peak area of Leucine-enkephalin was also obtained by integrating the peak of the specific pseudo molecular ion
m/z 554.2611 [M − H], which then was used for peak area normalization. Identification of the two saponins was also confirmed by comparing their masses with those reported by [
24] and their chemical formula were checked by looking at the specific masses and major ions.
2.5.3. Quantification
External calibration curves were prepared by injecting 1 µL of the solutions prepared with the standard saponin Bb (PhytoLab, Vestenbergsgreuth, Germany) at eight different concentrations: 0.01017, 0.05085, 0.1017, 0.2034, 0.5085, 1.017, 5.085, and 10.17 mg·L−1 extraction solvent using the same HPLC-HRMS technique. Two sequences were run to cover the analysis of all samples prepared in triplicate and two rounds of calibration points were run at both the beginning and end of each sequence. The mean values of the normalized peak areas of saponin Bb per sequence were calculated and two linearity ranges were used to construct the regression lines. Thus, four calibration curves were obtained whose correlation coefficients were 0.9996, 0.9981, 0.9994, and 0.9979. The limit of detection (LOD) and limit of quantification (LOQ) were calculated as the signal-to-noise ratio (S/N) equal to 3 and 10, respectively, for the lowest standard concentration (0.01017 mg·L−1) and resulted in LOD = 0.488 µg·L−1 and LOQ = 1.627 µg·L−1. Since no standard for saponin βg is commercially available, the experimentally determined saponin βg concentrations should be considered an approximation. Results were expressed in mg of saponin per g of dry matter.
2.6. Descriptive Sensory Analysis
Sensory Evaluations
Sixteen panelists (14 female/2 male, aged between 21 and 45 years) were recruited and trained to perform a descriptive sensory analysis of the cakes. They were either students or workers at Université Paris-Saclay/UMR SayFood (AgroParisTech/INRAE). Five of the sixteen panelists had previous experience in performing sensory analyses. All samples were consumed at room temperature and were labelled with a randomized three-digit code. The whole sensory study was performed in eight sessions (one introductory session, five training sessions and two final evaluation sessions). The first four sessions were carried out in groups of eight and the final four sessions were completed in individual sensory analysis cubicles. Each training session lasted between 25 and 45 min. Reference samples were used to help the panelists identify and evaluate the sensory qualities being investigated (
Table 2).
During the first training session, participants were trained to taste/smell reference samples such as caffeine (0.4–0.8 g·L−1), aluminum and potassium sulfate (1–2 g·L−1), tartaric acid (2 g·L−1) and sucrose (5 g·L−1) solutions, and a pea flour suspension (10–25 g·L−1). In the second session, references at different concentrations were provided to acquaint panelists with the intensity scale. This time, the reference samples were solutions of caffeine, aluminum and potassium sulfate and a suspension of pea flour in water. Based on this, over the next four sessions, panelists were trained to discriminate and rate the intensity of reference samples spread on 1 cm thick cake slices and finally rate these attributes in non-enriched cakes (PFC10, PFC15, PFC25 and PSPPIC25), in duplicate. Intensity ratings were entered manually on 10-cm unstructured line scales. During the final evaluation sessions, PFC were evaluated in the first session and PSPPIC in the second. Panelists analyzed six cakes per session because PFC25 and PSPPIC25 were duplicated in each session. Attributes were evaluated in order: first bitterness (nose clipped), then astringency and, finally, global aromatic intensity. The participants were instructed to eat a small piece of apple and rinse their mouths with water before and after eating each cake sample. Once panelists moved on to the next attribute, they were no longer able to re-evaluate the previous attribute or change their previous answers.
2.7. Data Analysis
Data analysis was performed using XLSTAT (version Premium 2021.2, Addinsoft, Paris, France). For saponin analysis, a one-way Analysis of Variance (ANOVA) was performed and significant differences were evaluated by Tukey’s Honest Significant Difference (HSD) post hoc test (p < 0.05).
For sensory analysis, a linear complete mixed three-way ANOVA model was used, with the product, replicate, and position effects as fixed factors and panelist and product × panelist interaction effects as random factors. This initial model, Y = µ + Panelist + Product + Replicate + Product × Panelist + ɛ was simplified iteratively by removing non-significant factors until significant model parameters were obtained. Further, if a non-significant factor was included in a significant interaction, the parameter was not removed. This simplification process is detailed in
Appendix C (
Table A4 and
Table A5). A 95% level of confidence was chosen. The post hoc test used for pairwise comparisons was Student–Newman–Keuls (SNK).
4. Discussion
This study aimed to characterize the fate of saponins in pea ingredients undergoing different degrees of fractionation as well as in baked products made using these more or less refined flours. Sponge cake-like products were used as models to illustrate the applicability of legume ingredients in traditional foods and to study the chemical transformations induced by the process that could have an impact on the quality perceived by consumers. As saponins are bitter compounds, it was interesting to be able to relate differences in chemical composition to a human sensory perception of bitterness. Indeed, bitterness is generally described as an obstacle to the use of pea flour, but its evolution under the effect of processing remains unexplored. Saponin βg was found in significantly higher quantities in unrefined pea flour (PF), while Bb was clearly dominant in PPI. Furthermore, PPI displayed the highest concentration of saponin among the pea ingredients, whereas PS contained very low levels of both compounds. This result illustrates the impact of refining which removes a large quantity of the native saponin. Other studies carried out on the same type of ingredients also reported that the fractionation process was primarily responsible for inactivating endogenous enzymes such as lipoxygenase and for changes to the chemical composition of reactive precursors, impacting the aroma profile and functionality of PFC compared to PSPPIC [
27].
Based on this knowledge, the selection of ingredients for foods can be optimized toward flavor quality, functionality, and environmental sustainability. The use of a reformulated flour based on purified fractions (PS + PPI, 2:1 w/w, designed to have the same starch:protein ratio as in the flour), therefore appears to be a good strategy to enable a 50% reduction in the amount of bitter pea components, such as saponins, when compared to a raw pea flour. Nevertheless, this new ingredient will be less sustainable than raw flour and will not perform well under life cycle assessment, so a comprehensive cost/benefit analysis should be carried out.
Moreover, if the heat treatment applied to food could in itself degrade the most bitter βg, this would be a clever way to use less refined ingredients (i.e., PF) that might still be better accepted by consumers of the end products. The kinetic results on PFC indeed showed that during baking, saponin βg levels fell, while those of Bb rose, thus confirming the results on βg thermolability obtained using simple and liquid model systems [
11]. These results, therefore, show that, in the case of processed foods containing different reactive compounds, the reactivity potential of the pea ingredients should be taken into account during the different processing steps in order to optimize the product and process. Interestingly, PFC and PSPPIC displayed quite similar total amounts of saponins after a standard baking time (25 min at 170 °C,
Figure 2) that were much closer than in the original ingredients (
Figure 1).
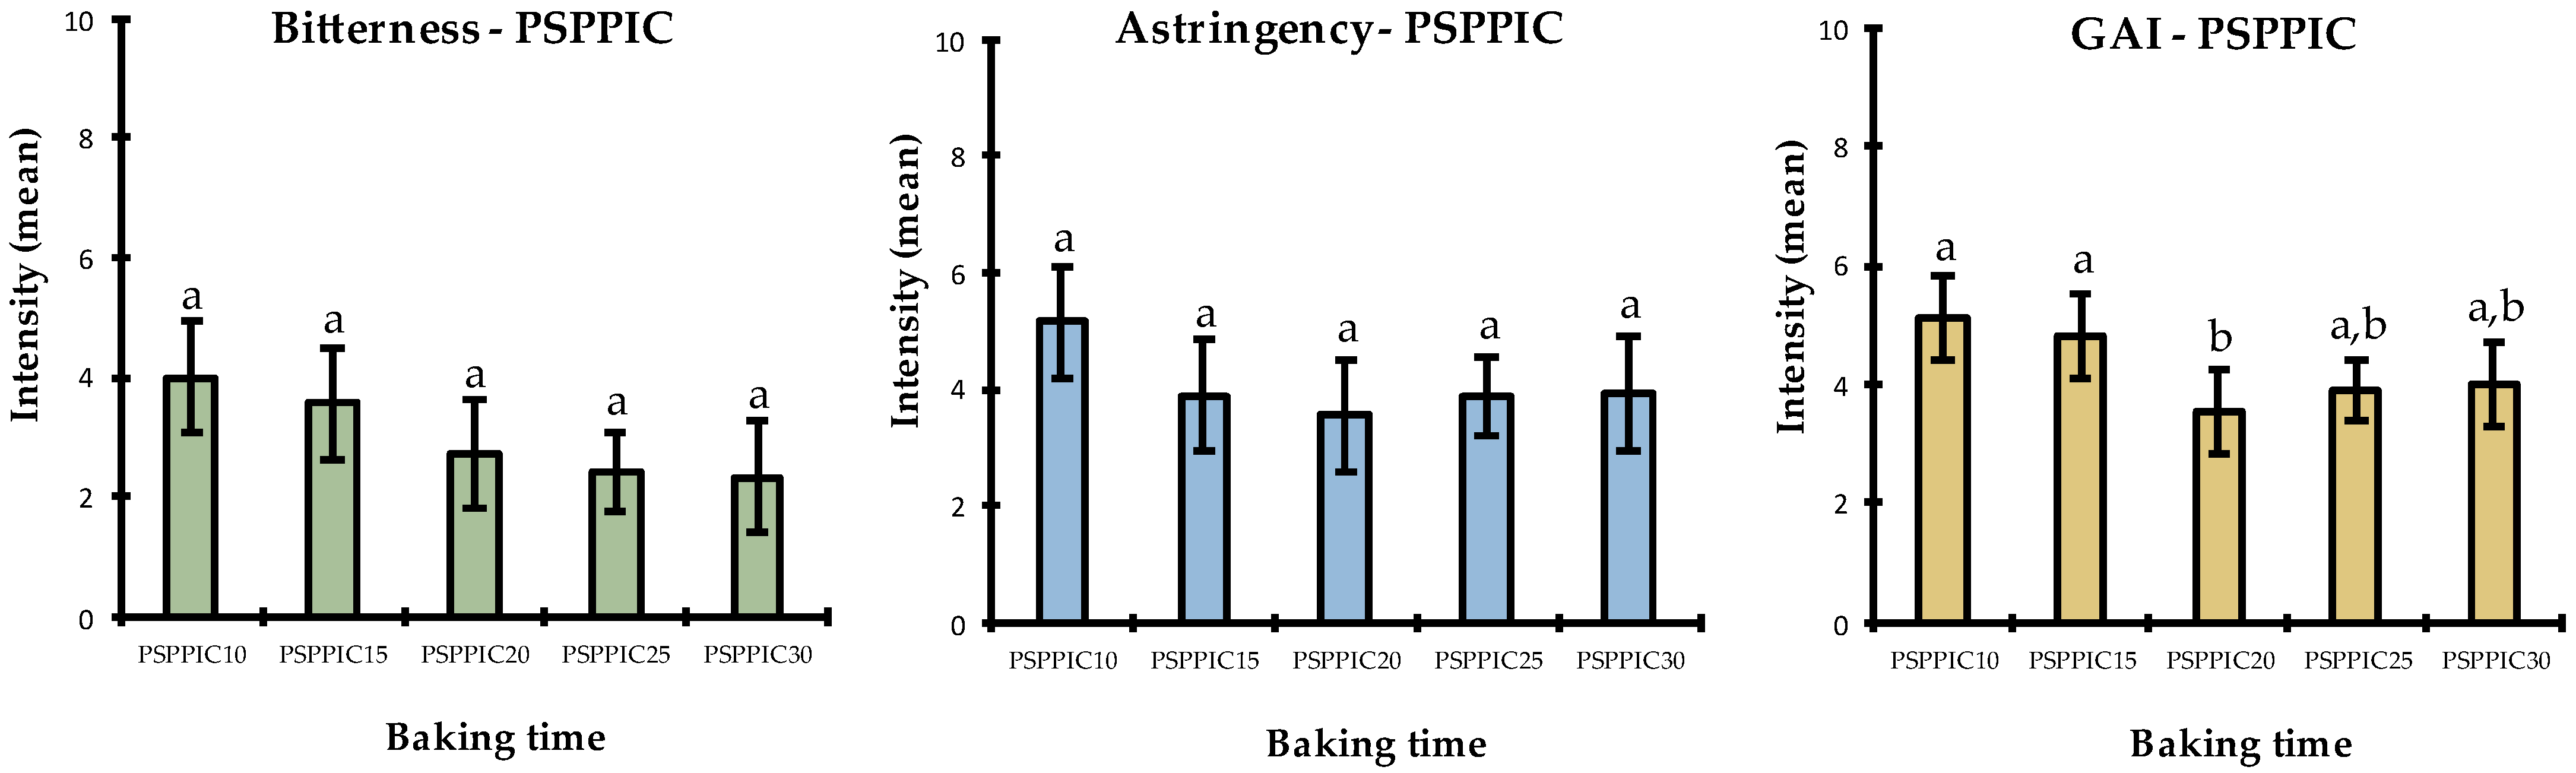
However, the results of this study show that the sensory perception of bitterness after baking varied depending on the degree of refinement of the pea flour (whole flour or flour reconstituted from protein isolates and starch); it decreased significantly during baking for PSPPIC but not for PFC. Indeed, the clear decrease observed for saponin βg during baking might have been too subtle for sensory discrimination in PFC, and we cannot exclude that other bitter compounds might also have participated in sensory perception [
15,
16,
17] and to a different degree between PFC (with a more complex initial chemical composition) and PSPPIC. In addition, other factors not considered might explain this decrease in the bitter sensation of PSPPI, such as protein denaturation and a consequent reduction in saponin bioavailability. Recovery studies might have helped to obtain a more accurate estimate of the original saponin concentration, but the results presented in this study only considered a readily available fraction of saponins, while those bound to proteins or other ingredients may have been overlooked.
A clearer understanding of these interactions both in raw materials and complex foods, and experiments to investigate saponin–protein interactions and the degree of protein denaturation–hydrolysis in cakes during baking may constitute future avenues of research to understand the bitter perception of saponins in pea-based foods. Moreover, the interactions between food formulation and processing factors, and their effects on other flavor compounds related to ingredient reactivity, should also be addressed in future studies.


 ,
, 


