
Whole Wheat Crackers Fortified with Mixed Shrimp Oil and Tea Seed Oil Microcapsules Prepared from Mung Bean Protein Isolate and Sodium Alginate


Abstract
:
1. Introduction
2. Materials and Methods
2.1. Materials
2.2. Preparation of Mung Bean Protein Isolate
2.3. Preparation of MBPI/SA/SO-TSO Emulsions
2.4. Spray-Drying Microencapsulation of MBPI/SA/SO-TSO Emulsions
2.5. Characterization of Microcapsules
2.5.1. Encapsulation Efficiency
2.5.2. Flowability
2.6. Characterization of SO-TSO Microcapsules
2.6.1. Particle Size, Poly-Dispersity Index (PDI), and Zeta Potential
2.6.2. Microstructure
2.6.3. FTIR Spectra
2.6.4. Differential Scanning Calorimetry
2.7. Oxidative Stability of SO-TSO and Microcapsules Loaded with SO-TSO
2.7.1. Lipid Oxidation
2.7.2. Fatty Acid Profile
2.8. Fortification of Selected Microcapsules Loaded with SO-TSO in Whole Wheat Crackers
2.8.1. Preparation of Whole Wheat Crackers Fortified with Microcapsules
2.8.2. Sensory Evaluation of Whole Wheat Crackers
2.8.3. Chemical Composition of Selected Whole Wheat Cracker
2.9. Statistical Analysis
3. Results and Discussion
3.1. Encapsulation Efficiency (EE) and Flowability
3.2. Particle Size, Poly-Dispersity Index (PDI), and Zeta Potential
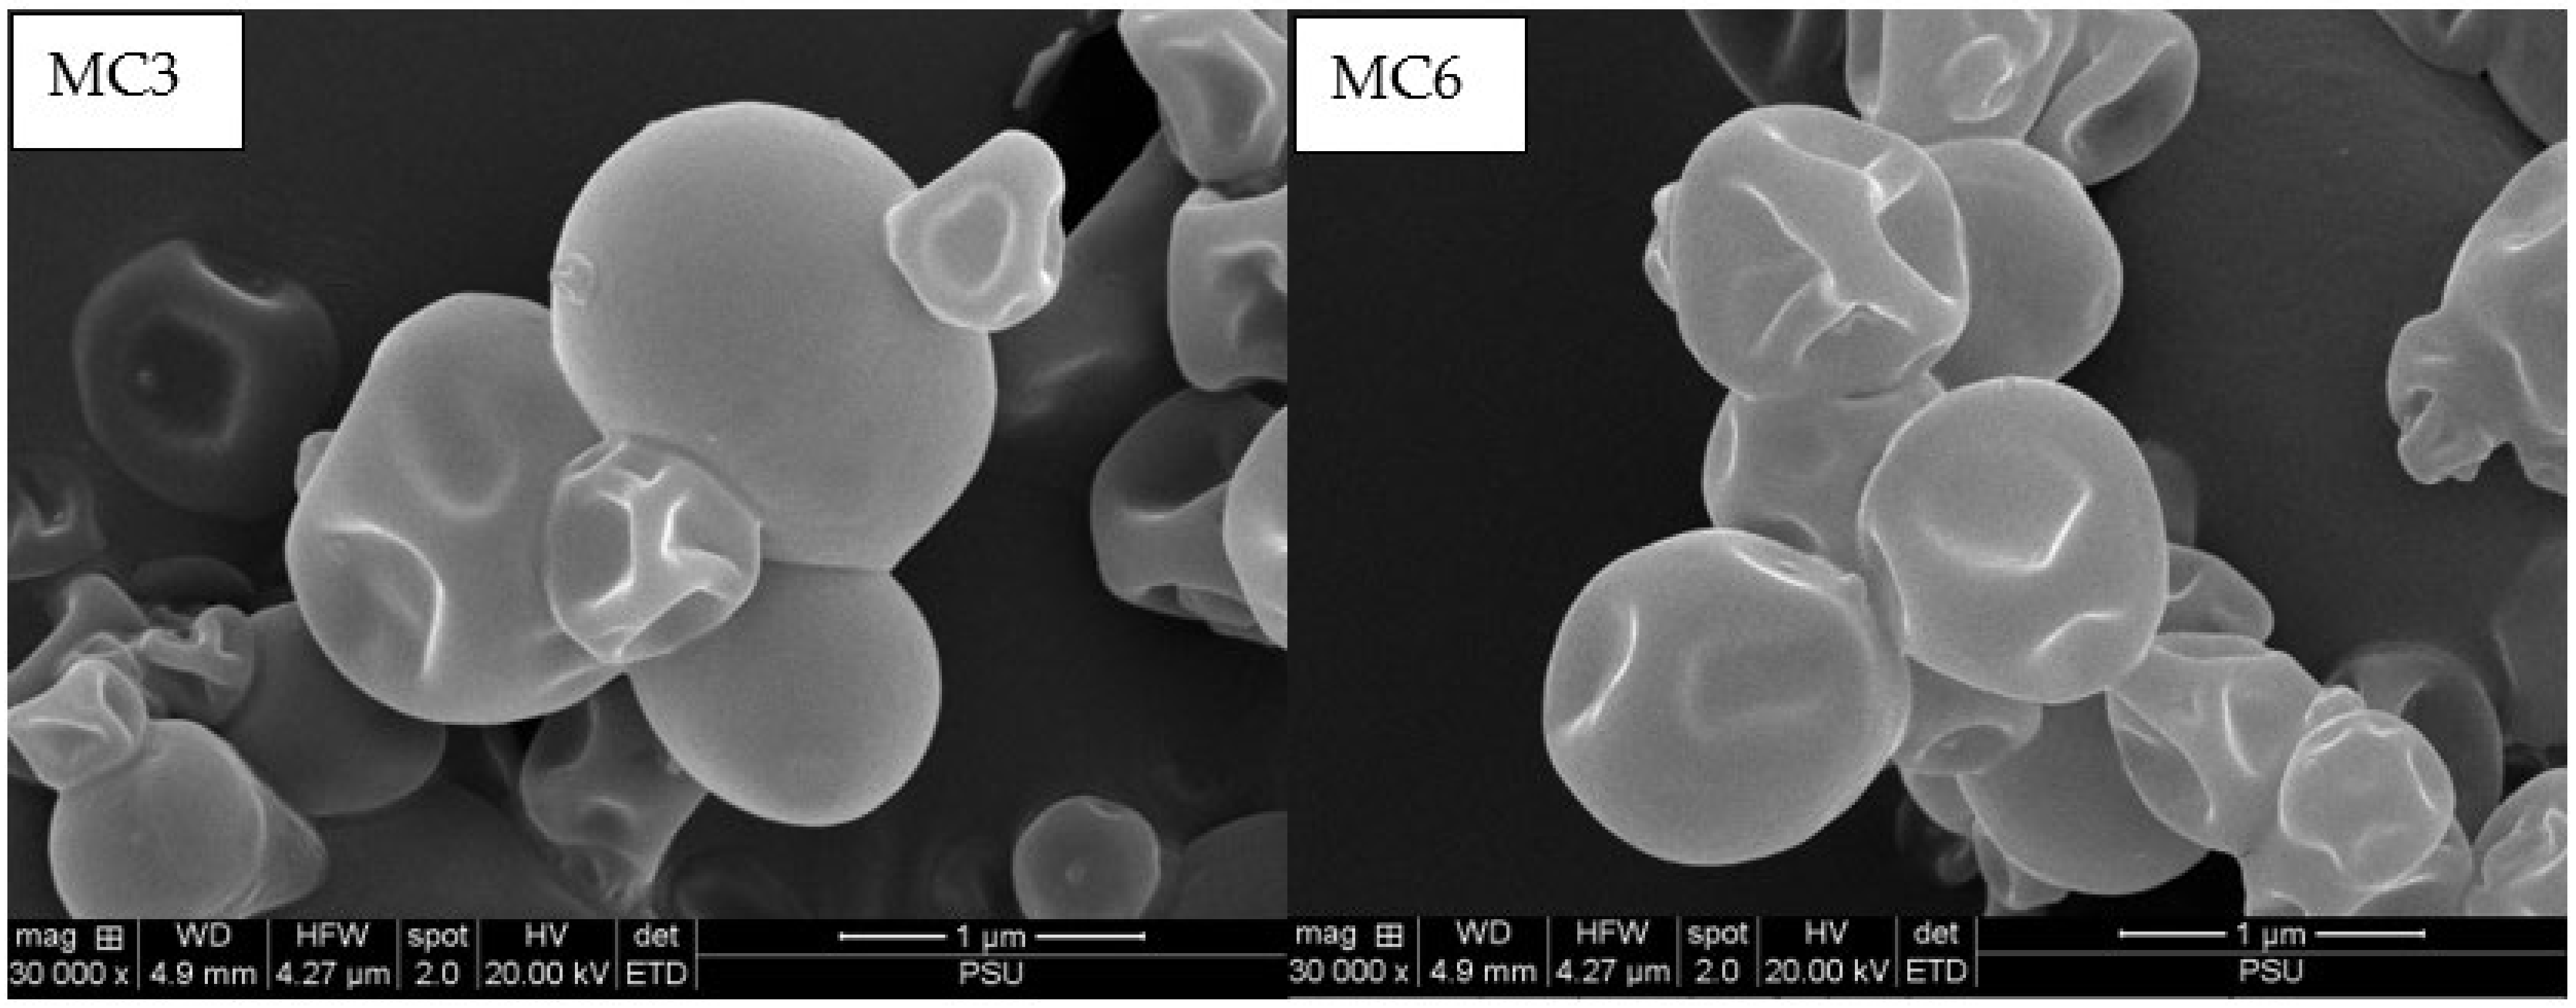
3.3. Microstructure
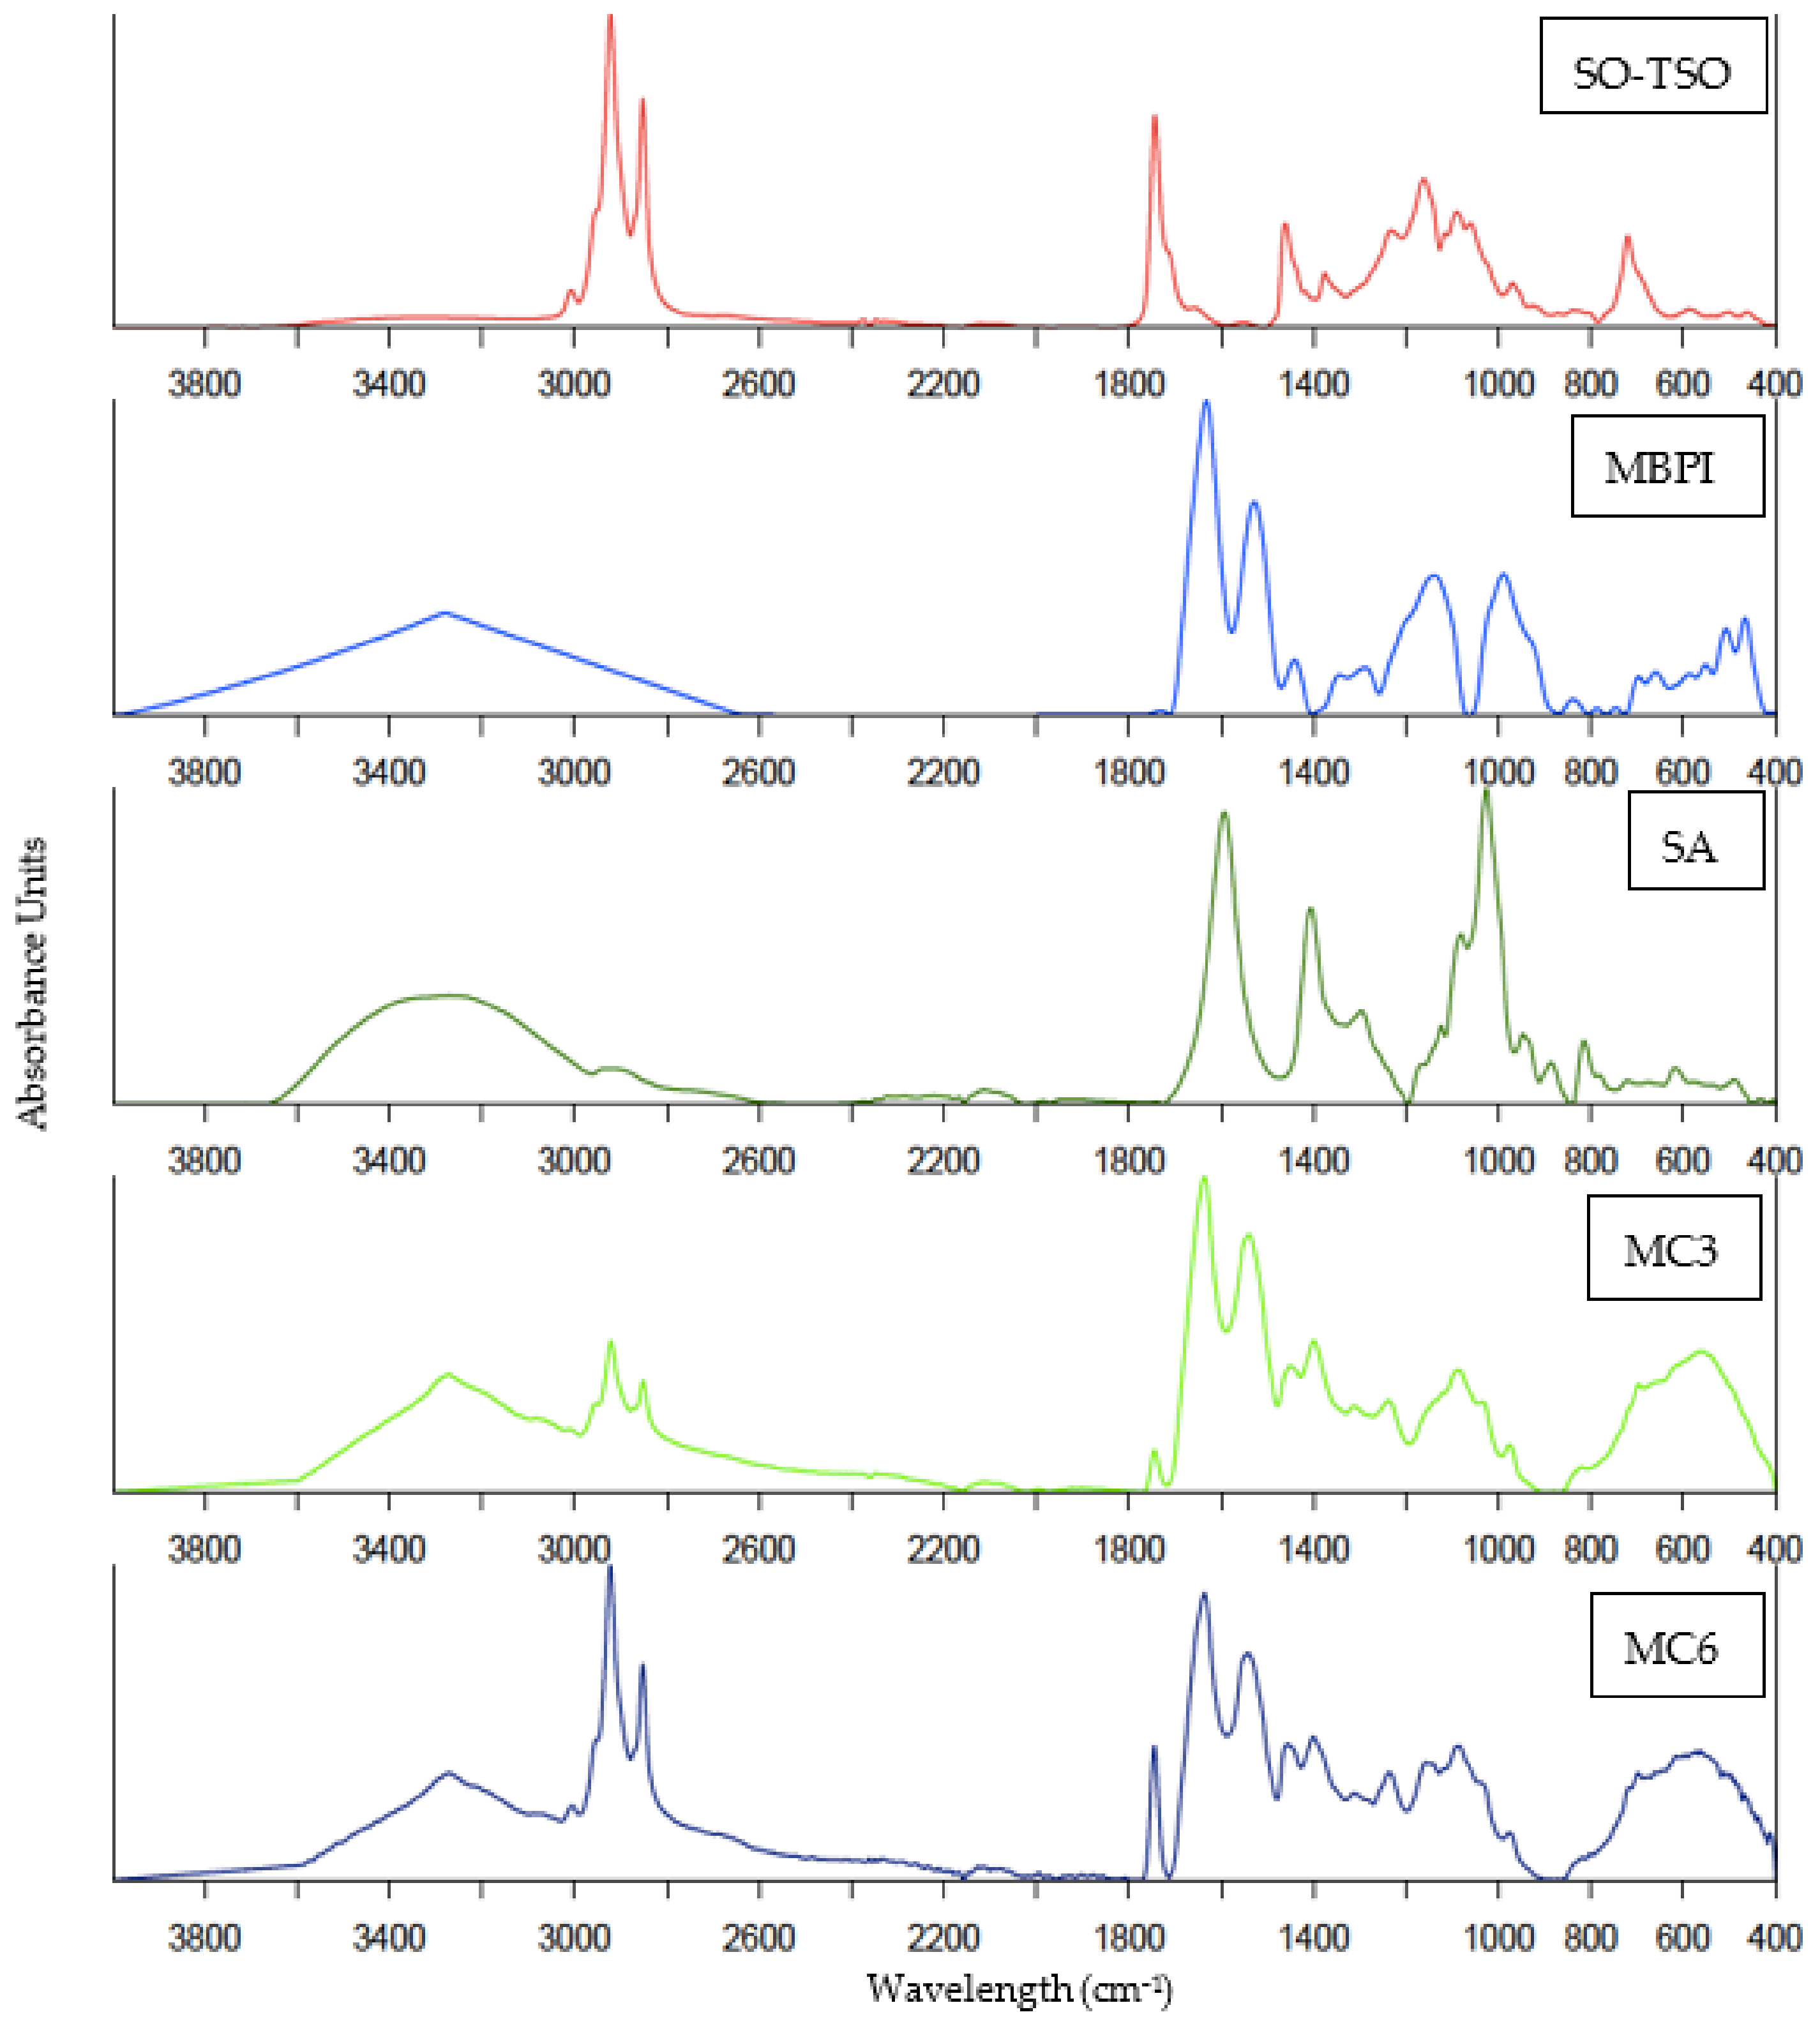
3.4. FTIR Spectra
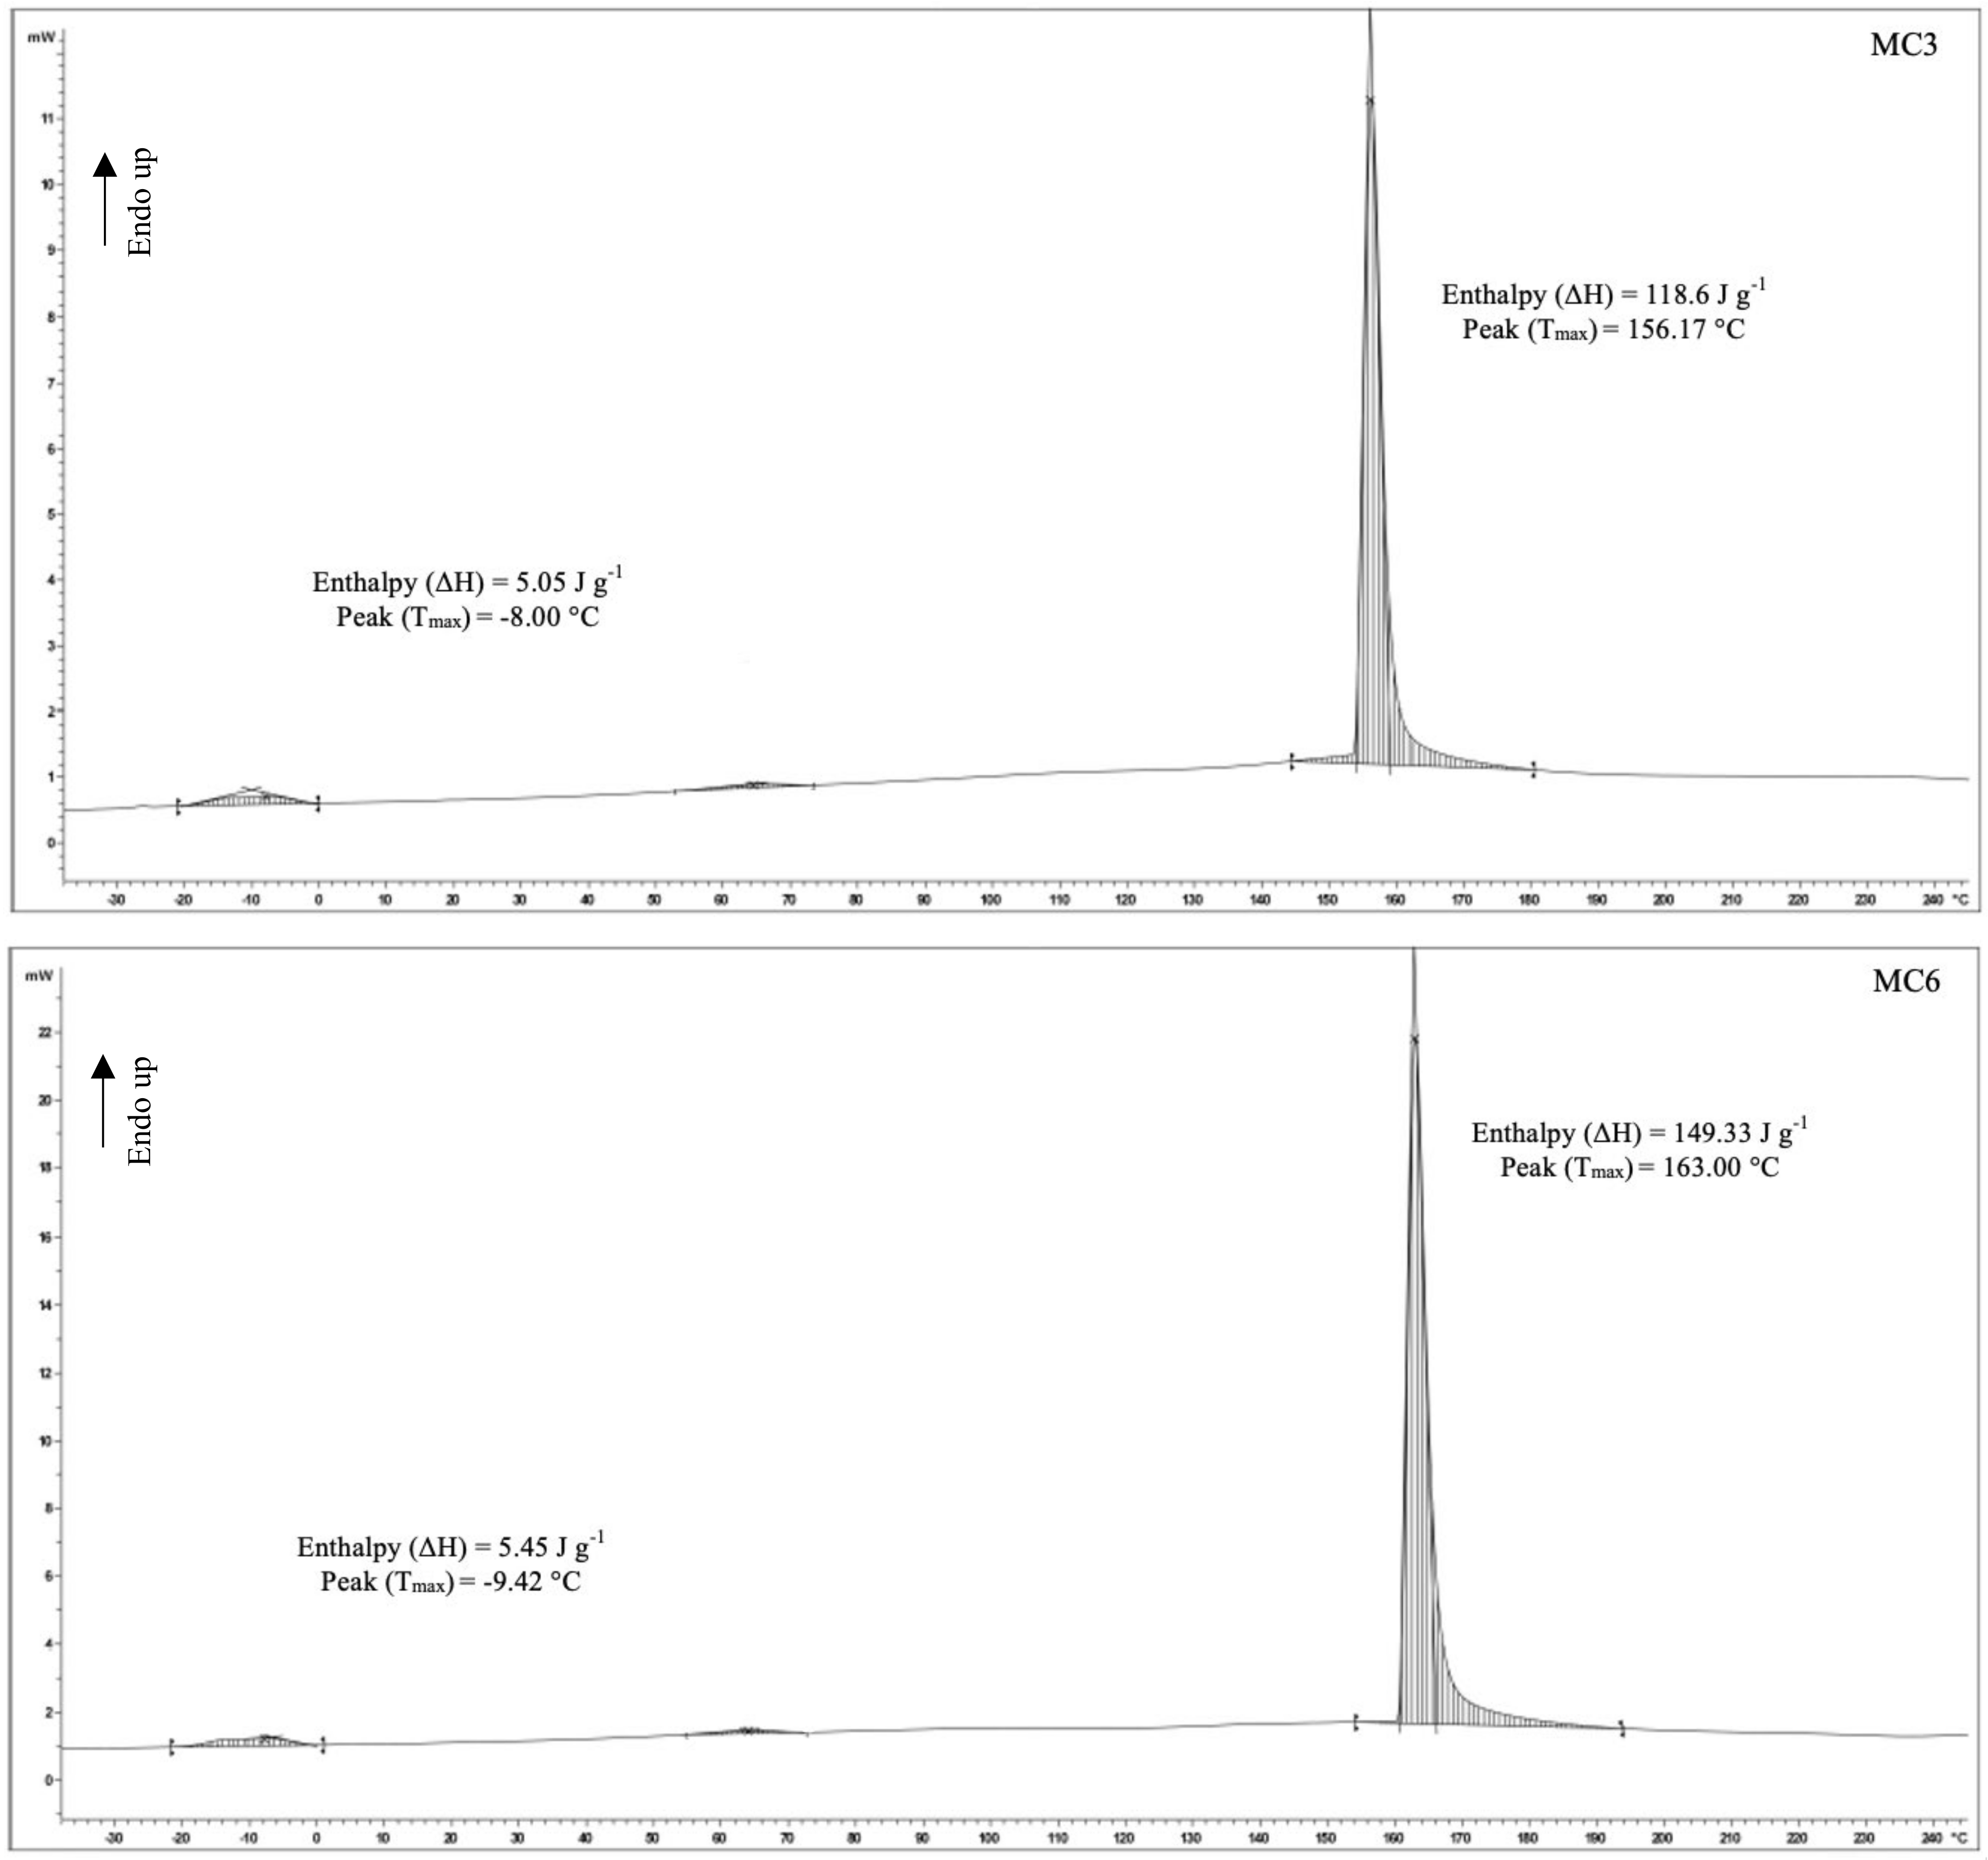
3.5. Differential Scanning Calorimetry
3.6. Oxidative Stability of Microcapsules Loaded with SO-TSO
3.6.1. Lipid Oxidation
3.6.2. Fatty acid Profile
3.7. Acceptability of Whole Wheat Crackers Fortified with MC3
3.8. Chemical Composition of Cracker
4. Conclusions
Author Contributions
Funding
Institutional Review Board Statement
Informed Consent Statement
Data Availability Statement
Conflicts of Interest
References
- Takeungwongtrakul, S.; Benjakul, S.; H-kittikun, A. Micro-encapsulation of Pacific white shrimp oil as affected by emulsification condition. Food Sci. Hum. Wellness 2014, 3, 175–182. [Google Scholar] [CrossRef] [Green Version]
- Kolanowski, W.; Ziolkowski, M.; Weißbrodt, J.; Kunz, B.; Laufenberg, G. Microencapsulation of fish oil by spray drying--impact on oxidative stability. Part 1. Eur. Food Res. Technol. 2006, 222, 336–342. [Google Scholar] [CrossRef]
- Gulzar, S.; Benjakul, S. Nanoliposome powder containing shrimp oil increases free flowing behavior and storage stability. Eur. J. Lipid Sci. Technol. 2020, 122, 2000049. [Google Scholar] [CrossRef]
- Miki, W. Biological functions and activities of animal carotenoids. Pure Appl. Chem. 1991, 63, 141–146. [Google Scholar] [CrossRef]
- Takeungwongtrakul, S.; Benjakul, S.; H-Kittikun, A. Lipids from cephalothorax and hepatopancreas of Pacific white shrimp (Litopenaeus vannamei): Compositions and deterioration as affected by iced storage. Food Chem. 2012, 134, 2066–2074. [Google Scholar] [CrossRef]
- Shahidi, F.; Ambigaipalan, P. Omega-3 polyunsaturated fatty acids and their health benefits. Annu. Rev. Food Sci. Technol. 2018, 9, 345–381. [Google Scholar] [CrossRef]
- Chaicharoenpong, C.; Petsom, A. Chapter 132—Use of tea (Camellia oleifera Abel.) seeds in human health. In Nuts and Seeds in Health and Disease Prevention; Preedy, V.R., Watson, R.R., Eds.; Academic Press: San Diego, CA, USA, 2011; pp. 1115–1122. ISBN 978-0-12-375688-6. [Google Scholar]
- Muangrat, R.; Jirarattanarangsri, W. Physicochemical properties and antioxidant activity of oil extracted from Assam tea seeds (Camellia sinensis var. assamica) by supercritical CO2 extraction. J. Food Process. Preserv. 2020, 44, e14364. [Google Scholar] [CrossRef]
- Wei, C.-C.; Yu, C.-W.; Yen, P.-L.; Lin, H.-Y.; Chang, S.-T.; Hsu, F.-L.; Liao, V.H.-C. Antioxidant activity, delayed aging, and reduced amyloid-β toxicity of methanol extracts of tea seed pomace from Camellia tenuifolia. J. Agric. Food Chem. 2014, 62, 10701–10707. [Google Scholar] [CrossRef] [PubMed]
- Lee, C.-P.; Yen, G.-C. Antioxidant activity and bioactive compounds of tea seed (Camellia oleifera Abel.) oil. J. Agric. Food Chem. 2006, 54, 779–784. [Google Scholar] [CrossRef]
- Liu, G.; Zhu, W.; Zhang, J.; Song, D.; Zhuang, L.; Ma, Q.; Yang, X.; Liu, X.; Zhang, J.; Zhang, H. Antioxidant capacity of phenolic compounds separated from tea seed oil in vitro and in vivo. Food Chem. 2022, 371, 131122. [Google Scholar] [CrossRef]
- Olson, R.; Gavin-Smith, B.; Ferraboschi, C.; Kraemer, K. Food Fortification: The advantages, disadvantages and lessons from sight and life programs. Nutrients 2021, 13, 1118. [Google Scholar] [CrossRef]
- Jacobsen, C. Enrichment of foods with omega-3 fatty acids: A multidisciplinary challenge. Ann. N. Y. Acad. Sci. 2010, 1190, 141–150. [Google Scholar] [CrossRef]
- Anwar, F.; Hussain, A.I.; Iqbal, S.; Bhanger, M.I. Enhancement of the oxidative stability of some vegetable oils by blending with Moringa oleifera oil. Food Chem. 2007, 103, 1181–1191. [Google Scholar] [CrossRef]
- Desai, K.G.H.; Jin Park, H. Recent developments in microencapsulation of food ingredients. Dry. Technol. 2005, 23, 1361–1394. [Google Scholar] [CrossRef]
- Gharsallaoui, A.; Roudaut, G.; Chambin, O.; Voilley, A.; Saurel, R. Applications of spray-drying in microencapsulation of food ingredients: An overview. Food Res. Int. 2007, 40, 1107–1121. [Google Scholar] [CrossRef]
- Yemenicioğlu, A.; Farris, S.; Turkyilmaz, M.; Gulec, S. A review of current and future food applications of natural hydrocolloids. Int. J. Food Sci. Technol. 2020, 55, 1389–1406. [Google Scholar] [CrossRef]
- Jarpa-Parra, M. Lentil protein: A review of functional properties and food application. An overview of lentil protein functionality. Int. J. Food Sci. Technol. 2018, 53, 892–903. [Google Scholar] [CrossRef] [Green Version]
- Sharif, H.R.; Williams, P.A.; Sharif, M.K.; Abbas, S.; Majeed, H.; Masamba, K.G.; Safdar, W.; Zhong, F. Current progress in the utilization of native and modified legume proteins as emulsifiers and encapsulants—A review. Food Hydrocoll. 2018, 76, 2–16. [Google Scholar] [CrossRef]
- Yi-Shen, Z.; Shuai, S.; FitzGerald, R. Mung bean proteins and peptides: Nutritional, functional and bioactive properties. Food Nutr. Res. 2018, 62, 1290–1301. [Google Scholar] [CrossRef] [PubMed] [Green Version]
- Ghorbani Gorji, E.; Waheed, A.; Ludwig, R.; Toca-Herrera, J.L.; Schleining, G.; Ghorbani Gorji, S. Complex coacervation of milk proteins with sodium alginate. J. Agric. Food Chem. 2018, 66, 3210–3220. [Google Scholar] [CrossRef] [PubMed]
- Gulzar, S.; Benjakul, S. Impact of pretreatment and atmosphere on quality of lipids extracted from cephalothorax of Pacific white shrimp by ultrasonic assisted process. Food Chem. 2020, 309, 125732. [Google Scholar] [CrossRef] [PubMed]
- El Adawy, T.A. Chemical, nutritional and functional properties of mung bean protein isolate and concentrate. Menofiya J. Agric. Res. 1996, 21, 657–672. [Google Scholar]
- Takeungwongtrakul, S.; Benjakul, S.; H-kittikun, A. Wall materials and the presence of antioxidants influence encapsulation efficiency and oxidative stability of micro-encapsulated shrimp oil. Eur. J. Lipid Sci. Technol. 2015, 117, 450–459. [Google Scholar] [CrossRef]
- Pudtikajorn, K.; Benjakul, S. Simple wet rendering method for extraction of prime quality oil from skipjack tuna eyeballs. Eur. J. Lipid Sci. Technol. 2020, 122, 2000077. [Google Scholar] [CrossRef]
- Buege, J.A.; Aust, S.D. Microsomal lipid peroxidation. Methods Enzymol. 1978, 52, 302–310. [Google Scholar] [CrossRef]
- Gulzar, S.; Benjakul, S. Impact of pulsed electric field pretreatment on yield and quality of lipid extracted from cephalothorax of Pacific white shrimp (Litopenaeus vannamei) by ultrasound-assisted process. Int. J. Food Sci. Technol. 2020, 55, 619–630. [Google Scholar] [CrossRef] [Green Version]
- Benjakul, S.; Karnjanapratum, S. Characteristics and nutritional value of whole wheat cracker fortified with tuna bone bio-calcium powder. Food Chem. 2018, 259, 181–187. [Google Scholar] [CrossRef]
- Meilgaard, M.C.; Carr, B.T.; Civille, G.V. Sensory evaluation techniques; CRC Press: Boca Raton, FL, USA, 1999; ISBN 1439832277. [Google Scholar]
- AOAC. Official Methods of Analysis; Association of Official Analytical Chemists: Washington, DC, USA, 2002. [Google Scholar]
- Damodaran, S. Protein stabilization of emulsions and foams. J. Food Sci. 2005, 70, R54–R66. [Google Scholar] [CrossRef]
- Le Priol, L.; Dagmey, A.; Morandat, S.; Saleh, K.; El Kirat, K.; Nesterenko, A. Comparative study of plant protein extracts as wall materials for the improvement of the oxidative stability of sunflower oil by microencapsulation. Food Hydrocoll. 2019, 95, 105–115. [Google Scholar] [CrossRef]
- Kudre, T.G.; Benjakul, S.; Kishimura, H. Comparative study on chemical compositions and properties of protein isolates from mung bean, black bean and bambara groundnut. J. Sci. Food Agric. 2013, 93, 2429–2436. [Google Scholar] [CrossRef]
- Tolstoguzov, V.B. Protein-polysaccharide interactions. In Food Proteins and Their Applications; CRC Press: Boca Raton, FL, USA, 2017; pp. 171–198. ISBN 0203755618. [Google Scholar]
- Tan, C.; McClements, D.J. Application of advanced emulsion technology in the food industry: A review and critical evaluation. Foods 2021, 10, 812. [Google Scholar] [CrossRef]
- Fioramonti, S.A.; Rubiolo, A.C.; Santiago, L.G. Characterisation of freeze-dried flaxseed oil microcapsules obtained by multilayer emulsions. Powder Technol. 2017, 319, 238–244. [Google Scholar] [CrossRef] [Green Version]
- Liu, C.; Tan, Y.; Xu, Y.; McCleiments, D.J.; Wang, D. Formation, characterization, and application of chitosan/pectin-stabilized multilayer emulsions as astaxanthin delivery systems. Int. J. Biol. Macromol. 2019, 140, 985–997. [Google Scholar] [CrossRef]
- Yao, X.; Xiang, S.; Nie, K.; Gao, Z.; Zhang, W.; Fang, Y.; Nishinari, K.; Phillips, G.O.; Jiang, F. Whey protein isolate/gum arabic intramolecular soluble complexes improving the physical and oxidative stabilities of conjugated linoleic acid emulsions. RSC Adv. 2016, 6, 14635–14642. [Google Scholar] [CrossRef]
- Weinbreck, F.; Minor, M.; De Kruif, C.G. Microencapsulation of oils using whey protein/gum arabic coacervates. J. Microencapsul. 2004, 21, 667–679. [Google Scholar] [CrossRef]
- Turchiuli, C.; Fuchs, M.; Bohin, M.; Cuvelier, M.-E.; Ordonnaud, C.; Peyrat-Maillard, M.N.; Dumoulin, E. Oil encapsulation by spray drying and fluidised bed agglomeration. Innov. Food Sci. Emerg. Technol. 2005, 6, 29–35. [Google Scholar] [CrossRef]
- Fitzpatrick, J.J.; Iqbal, T.; Delaney, C.; Twomey, T.; Keogh, M.K. Effect of powder properties and storage conditions on the flowability of milk powders with different fat contents. J. Food Eng. 2004, 64, 435–444. [Google Scholar] [CrossRef]
- Hogan, S.A.; McNamee, B.F.; O’Riordan, E.D.; O’Sullivan, M. Emulsification and microencapsulation properties of sodium caseinate/carbohydrate blends. Int. Dairy J. 2001, 11, 137–144. [Google Scholar] [CrossRef]
- Ramakrishnan, S.; Ferrando, M.; Aceña-Muñoz, L.; Mestres, M.; De Lamo-Castellví, S.; Güell, C. Influence of emulsification technique and wall composition on physicochemical properties and oxidative stability of fish oil microcapsules produced by spray drying. Food Bioprocess Technol. 2014, 7, 1959–1972. [Google Scholar] [CrossRef]
- Gulzar, S.; Raju, N.; Prodpran, T.; Benjakul, S. Chitosan-tripolyphosphate nanoparticles improves oxidative stability of encapsulated shrimp oil throughout the extended storage. Eur. J. Lipid Sci. Technol. 2021, 2100178. [Google Scholar] [CrossRef]
- Danaei, M.; Dehghankhold, M.; Ataei, S.; Hasanzadeh Davarani, F.; Javanmard, R.; Dokhani, A.; Khorasani, S.; Mozafari, M.R. Impact of particle size and polydispersity index on the clinical applications of lipidic nanocarrier systems. Pharmaceutics 2018, 10, 57. [Google Scholar] [CrossRef] [PubMed] [Green Version]
- Toro-Sierra, J.; Schumann, J.; Kulozik, U. Impact of spray-drying conditions on the particle size of microparticulated whey protein fractions. Dairy Sci. Technol. 2013, 93, 487–503. [Google Scholar] [CrossRef] [Green Version]
- Elversson, J.; Millqvist-Fureby, A. Particle size and density in spray drying—effects of carbohydrate properties. J. Pharm. Sci. 2005, 94, 2049–2060. [Google Scholar] [CrossRef] [PubMed]
- Mlalila, N.; Swai, H.; Kalombo, L.; Hilonga, A. Effects of spray-drying on w/o/w multiple emulsions prepared from a stearic acid matrix. Nanotechnol. Sci. Appl. 2014, 7, 105–112. [Google Scholar] [CrossRef] [PubMed] [Green Version]
- Agustinisari, I.; Mulia, K.; Nasikin, M. The effect of eugenol and chitosan concentration on the encapsulation of eugenol using whey protein–maltodextrin conjugates. Appl. Sci. 2020, 10, 3205. [Google Scholar] [CrossRef]
- Vishnu, K.V.; Chatterjee, N.S.; Ajeeshkumar, K.K.; Lekshmi, R.G.K.; Tejpal, C.S.; Mathew, S.; Ravishankar, C.N. Microencapsulation of sardine oil: Application of vanillic acid grafted chitosan as a bio-functional wall material. Carbohydr. Polym. 2017, 174, 540–548. [Google Scholar] [CrossRef] [PubMed]
- Ofir, E.; Oren, Y.; Adin, A. Electroflocculation: The effect of zeta-potential on particle size. Desalination 2007, 204, 33–38. [Google Scholar] [CrossRef]
- Charoensuk, D.; Brannan, R.G.; Chanasattru, W.; Chaiyasit, W. Physicochemical and emulsifying properties of mung bean protein isolate as influenced by succinylation. Int. J. Food Prop. 2018, 21, 1633–1645. [Google Scholar] [CrossRef] [Green Version]
- Nishad, J.; Selvan, C.J.; Mir, S.A.; Bosco, S.J.D. Effect of spray drying on physical properties of sugarcane juice powder (Saccharum officinarum L.). J. Food Sci. Technol. 2017, 54, 687–697. [Google Scholar] [CrossRef] [PubMed] [Green Version]
- Klinkesorn, U.; Sophanodora, P.; Chinachoti, P.; Decker, E.A.; McClements, D.J. Characterization of spray-dried tuna oil emulsified in two-layered interfacial membranes prepared using electrostatic layer-by-layer deposition. Food Res. Int. 2006, 39, 449–457. [Google Scholar] [CrossRef]
- Kagami, Y.; Sugimura, S.; Fujishima, N.; Matsuda, K.; Kometani, T.; Matsumura, Y. Oxidative stability, structure, and physical characteristics of microcapsules formed by spray drying of fish oil with protein and dextrin wall materials. J. Food Sci. 2003, 68, 2248–2255. [Google Scholar] [CrossRef]
- Andersson, I.M.; Bergenståhl, B.; Millqvist-Fureby, A.; Alexander, M.; Paulsson, M.; Glantz, M. Particle morphology and rehydration properties of spray-dried microgels and fractal aggregates with varying fractions of native milk serum proteins. Int. Dairy J. 2021, 112, 104862. [Google Scholar] [CrossRef]
- Soottitantawat, A.; Partanen, R.; Neoh, T.L.; Yoshii, H. Encapsulation of hydrophilic and hydrophobic flavors by spray drying. Japan J. Food Eng. 2015, 16, 37–52. [Google Scholar] [CrossRef] [Green Version]
- Siddaramaiah; Swamy, T.M.M.; Ramaraj, B.; Lee, J.H. Sodium alginate and its blends with starch: Thermal and morphological properties. J. Appl. Polym. Sci. 2008, 109, 4075–4081. [Google Scholar] [CrossRef]
- Binsi, P.K.; Nayak, N.; Sarkar, P.C.; Jeyakumari, A.; Ashraf, P.M.; Ninan, G.; Ravishankar, C.N. Structural and oxidative stabilization of spray dried fish oil microencapsulates with gum arabic and sage polyphenols: Characterization and release kinetics. Food Chem. 2017, 219, 158–168. [Google Scholar] [CrossRef]
- Guillén, M.D.; Cabo, N. Characterization of edible oils and lard by fourier transform infrared spectroscopy. Relationships between composition and frequency of concrete bands in the fingerprint region. JAOCS, J. Am. Oil Chem. Soc. 1997, 74, 1281–1286. [Google Scholar] [CrossRef]
- Gulzar, S.; Benjakul, S. Ultrasound waves increase the yield and carotenoid content of lipid extracted from cephalothorax of Pacific white shrimp (Litopenaeus vannamei). Eur. J. Lipid Sci. Technol. 2018, 120, 1700495. [Google Scholar] [CrossRef]
- Carbonaro, M.; Nucara, A. Secondary structure of food proteins by Fourier transform spectroscopy in the mid-infrared region. Amino Acids 2010, 38, 679–690. [Google Scholar] [CrossRef]
- Barth, A. Infrared spectroscopy of proteins. Biochim. Biophys. Acta (BBA)-Bioenerg. 2007, 1767, 1073–1101. [Google Scholar] [CrossRef] [PubMed] [Green Version]
- Zeng, H.-Y.; Cai, L.-H.; Cai, X.-L.; Wang, Y.-J.; Li, Y.-Q. Structure characterization of protein fractions from lotus (Nelumbo nucifera) seed. J. Mol. Struct. 2011, 1001, 139–144. [Google Scholar] [CrossRef]
- Badita, C.R.; Aranghel, D.; Burducea, C.; Mereuta, P. Characterization of sodium alginate based films. Rom. J. Phys 2020, 65, 1–8. [Google Scholar]
- Branch, S.; Maria, S. Evaluation of the functional properties of mung bean protein isolate for development of textured vegetable protein. Int. Food Res. J. 2017, 24, 1595–1605. [Google Scholar]
- Arntfield, S.D.; Murray, E.D. The influence of processing parameters on food protein functionality I. Differential scanning calorimetry as an indicator of protein denaturation. Can. Inst. Food Sci. Technol. J. 1981, 14, 289–294. [Google Scholar] [CrossRef]
- Li, R.; Huang, J.; Huang, L.; Teng, J.; Xia, N.; Wei, B.; Zhao, M. Comparison of GC and DSC monitoring the adulteration of camellia oil with selected vegetable oils. J. Therm. Anal. Calorim. 2016, 126, 1735–1746. [Google Scholar] [CrossRef]
- Quispe-Condori, S.; Saldaña, M.D.A.; Temelli, F. Microencapsulation of flax oil with zein using spray and freeze drying. LWT - Food Sci. Technol. 2011, 44, 1880–1887. [Google Scholar] [CrossRef]
- Chen, Q.; Zhong, F.; Wen, J.; McGillivray, D.; Quek, S.Y. Properties and stability of spray-dried and freeze-dried microcapsules co-encapsulated with fish oil, phytosterol esters, and limonene. Dry. Technol. 2013, 31, 707–716. [Google Scholar] [CrossRef]
- Sowmya, R.; Sachindra, N.M. Evaluation of antioxidant activity of carotenoid extract from shrimp processing byproducts by in vitro assays and in membrane model system. Food Chem. 2012, 134, 308–314. [Google Scholar] [CrossRef]
- Sahari, M.A.; Ataii, D.; Hamedi, M. Characteristics of tea seed oil in comparison with sunflower and olive oils and its effect as a natural antioxidant. J. Am. Oil Chem. Soc. 2004, 81, 585–588. [Google Scholar] [CrossRef]
- Gulzar, S.; Benjakul, S. Effect of pre-treatments on yield and properties of lipid extracted from cephalothorax of Pacific white shrimp (Litopenaeus vannamei) by ultrasonic assisted process. LWT 2019, 100, 106–113. [Google Scholar] [CrossRef]
- Takeungwongtrakul, S.; Benjakul, S. Biscuits fortified with micro-encapsulated shrimp oil: Characteristics and storage stability. J. Food Sci. Technol. 2017, 54, 1126–1136. [Google Scholar] [CrossRef] [PubMed] [Green Version]
- Gulzar, S.; Benjakul, S. Characteristics and storage stability of nanoliposomes loaded with shrimp oil as affected by ultrasonication and microfluidization. Food Chem. 2020, 310, 125916. [Google Scholar] [CrossRef] [PubMed]
- Khalid, K.H.; Ohm, J.-B.; Simsek, S. Whole wheat bread: Effect of bran fractions on dough and end-product quality. J. Cereal Sci. 2017, 78, 48–56. [Google Scholar] [CrossRef]


| Sample | Wall Materials (w/w/w) | EE (%) | Carr Index (Ci) (%) |
|---|---|---|---|
| MC1 | MBPI:SA:SO-TSO (1:0.1:0.5) | 45.27 ± 1.09 d,* | 23.92 ± 1.04 c |
| MC2 | MBPI:SA:SO-TSO (2:0.2:0.5) | 65.61 ± 2.23 b | 22.25 ± 1.28 c,d |
| MC3 | MBPI:SA:SO-TSO (3:0.3:0.5) | 72.09 ± 2.97 a | 20.02 ± 1.17 d |
| MC4 | MBPI:SA:SO-TSO (1:0.1:0.75) | 33.74 ± 1.64 e | 27.61 ± 1.34 b |
| MC5 | MBPI:SA:SO-TSO (2:0.2:0.75) | 56.44 ± 1.98 c | 21.31 ± 1.15 d |
| MC6 | MBPI:SA:SO-TSO (3:0.3:0.75) | 63.62 ± 2.64 b | 21.18 ± 1.09 d |
| MC7 | MBPI:SA:SO-TSO (1:0.1:1) | 32.26 ± 1.33 e | 31.63 ± 1.19 a |
| MC8 | MBPI:SA:SO-TSO (2:0.2:1) | 43.22 ± 1.87 d | 27.09 ± 1.67 b |
| MC9 | MBPI:SA:SO-TSO (3:0.3:1) | 58.29 ± 2.72 c | 21.39 ± 1.34 d |
| Sample | Size (µm) | PDI | Zeta Potential (mV) |
|---|---|---|---|
| MC3 | 1.796 ± 0.043 a | 0.403 ± 0.01 a | −54.81 ± 0.53 a |
| MC6 | 1.592 ± 0.043 b | 0.372 ± 0.01 b | −53.41 ± 0.69 b |
| Fatty Acids (%) | Week 0 | Week 6 | ||||
|---|---|---|---|---|---|---|
| SO-TSO | MC3 | MC6 | SO-TSO | MC3 | MC6 | |
| C14:0 (Myristic) | 1.32 ± 0.08 a | 1.33 ± 0.07 a | 1.34 ± 0.04 a | 1.36 ± 0.05 a | 1.34 ± 0.04 a | 1.37 ± 0.08 a |
| C15:0 (Pentadecanoic) | 0.47 ± 0.01 b | 0.49 ± 0.01 a,b | 0.50 ± 0.01 a | 0.51 ± 0.01 a | 0.50 ± 0.01 a | 0.51 ± 0.02 a |
| C16:0 (Palmitic) | 13.99 ± 0.27 b | 14.07 ± 0.24 b | 14.01 ± 0.22 b | 14.79 ± 0.18 a | 14.41 ± 0.21 a,b | 14.52 ± 0.19 a |
| C16:1 (Palmitoleic) | 1.61 ± 0.09 a | 1.59 ± 0.11 a | 1.57 ± 0.07 a | 1.27 ± 0.06 b | 1.51 ± 0.07 a | 1.50 ± 0.08 a |
| C17:0 (Heptadecanoic) | 1.09 ± 0.04 b | 1.11 ± 0.02 b | 1.13 ± 0.04 b | 1.21 ± 0.07 a | 1.14 ± 0.03 a,b | 1.16 ± 0.01 a,b |
| C17:1 cis 10 (cis-10-Heptadecanoic) | 0.31 ± 0.01 a | 0.30 ± 0.01 a | 0.28 ± 0.02 a,b | 0.19 ± 0.03 c | 0.28 ± 0.01 a,b | 0.26 ± 0.03 b |
| C18:0 (Stearic) | 4.98 ± 0.09 b,c | 4.93 ± 0.07 c | 4.95 ± 0.10 b,c | 5.99 ± 0.11 a | 5.05 ± 0.09 b,c | 5.11 ± 0.08 b |
| C18:1 (Oleic) | 50.55 ± 0.67 a | 50.24 ± 0.71 a | 50.36 ± 0.64 a | 48.27 ± 0.78 b | 50.02 ± 0.69 a | 49.82 ± 0.81 a |
| C18:2 (Linoleic) | 8.51 ± 0.19 a | 8.36 ± 0.25 a | 8.32 ± 0.22 a | 5.52 ± 0.21 c | 7.56 ± 0.19 b | 7.49 ± 0.18 b |
| C18:3 (alpha-Linolenic) | 0.91 ± 0.02 a | 0.89 ± 0.01 a | 0.88 ± 0.01 a | 0.41 ± 0.01 c | 0.78 ± 0.02 b | 0.77 ± 0.03 b |
| C20:0 (Arachidic) | 0.54 ± 0.01 c | 0.53 ± 0.01 c | 0.54 ± 0.01 c | 0.66 ± 0.01 a | 0.54 ± 0.01 c | 0.57 ± 0.01 b |
| C20:1 (Eicosenoic) | 0.82 ± 0.03 a | 0.81 ± 0.02 a | 0.78 ± 0.03 a | 0.71 ± 0.04 b | 0.79 ± 0.02 a | 0.77 ± 0.04 a |
| C20:2 (Eicosadienoic) | 0.56 ± 0.02 a | 0.54 ± 0.03 a,b | 0.53 ± 0.01 a,b,c | 0.36 ± 0.03 d | 0.50 ± 0.04 b,c | 0.49 ± 0.01 c |
| C20:5 (EPA) | 2.21 ± 0.12 a | 2.13 ± 0.11 a | 2.15 ± 0.09 a | 1.29 ± 0.14 b | 2.01 ± 0.09 a | 1.98 ± 0.15 a |
| C22:6 (DHA) | 6.58 ± 0.11 a | 6.47 ± 0.09 a | 6.45 ± 0.12 a | 4.40 ± 0.13 c | 6.04 ± 0.12 b | 5.91 ± 0.17 b |
| C23:0 (Tricosanoic) | 1.02 ± 0.07 a | 1.01 ± 0.05 a | 1.03 ± 0.01 a | 1.07 ± 0.04 a | 1.04 ± 0.06 a | 1.06 ± 0.01 a |
| C24:1 (Nervonic) | 0.31 ± 0.01 a | 0.30 ± 0.01 a,b | 0.30 ± 0.01 a,b | 0.26 ± 0.02 c | 0.29 ± 0.01 a,b | 0.28 ± 0.02 b,c |
| Others | 4.19 ± 0.12 b | 4.37 ± 0.20 a,b | 4.26 ± 0.18 b | 4.67 ± 0.24 a | 4.44 ± 0.17 a,b | 4.34 ± 0.16 a,b |
| Saturated fatty acid (SFA) | 23.71 ± 0.28 c,d | 22.97 ± 0.22 e | 23.49 ± 0.33 d | 25.62 ± 0.29 a | 24.01 ± 0.27 b,c | 24.31 ± 0.19 b |
| Monounsaturated fatty acid (MUFA) | 53.71 ± 0.72 a | 53.25 ± 0.63 a | 53.31 ± 0.52 a | 50.69 ± 0.66 b | 52.91 ± 0.54 a | 52.62 ± 0.67 a |
| Polyunsaturated fatty acid (PUFA) | 18.90 ± 0.29 a | 18.41 ± 0.27 b | 18.36 ± 0.22 b | 11.97 ± 0.19 d | 16.91 ± 0.25 c | 16.65 ± 0.23 c |
| MC3 Level (%, w/w) | Appearance | Color | Fishy Odor ** | Rancid Flavor ** | Texture | Taste | Overall Likeness |
|---|---|---|---|---|---|---|---|
| 0 | 7.20 ± 0.75 a | 6.80 ± 1.47 a | 7.80 ± 0.60 a | 8.10 ± 0.54 a | 5.90 ± 1.22 a,b | 6.30 ± 0.90 a | 6.40 ± 1.02 a,b |
| 2.5 | 7.10 ± 1.14 a | 6.80 ± 1.33 a | 7.70 ± 0.78 a | 7.70 ± 0.64 a | 5.90 ± 0.83 a,b | 6.00 ± 1.18 a | 6.50 ± 1.28 a,b |
| 5.0 | 6.80 ± 0.98 a | 6.50 ± 1.20 a | 7.40 ± 0.92 a | 7.60 ± 0.66 a | 6.20 ± 0.60 a,b | 6.40 ± 0.80 a | 6.40 ± 0.80 a,b |
| 7.5 | 6.80 ± 1.25 a | 6.50 ± 0.81 a | 7.80 ± 0.60 a | 7.50 ± 0.67 a | 6.40 ± 0.80 a | 6.10 ± 0.54 a | 6.60 ± 0.49 a |
| 10.0 | 6.80 ± 1.47 a | 6.40 ± 0.80 a | 7.50 ± 0.81 a | 7.50 ± 0.77 a | 5.50 ± 1.02 b | 5.60 ± 0.80 a | 5.70 ± 0.64 b |
| MC3 Level (%, w/w) | Composition (%, w/w, Wet Basis) | ||||
|---|---|---|---|---|---|
| Moisture ** | Lipid | Protein (g/100 g) | Ash | Carbohydrate | |
| 0 | 3.05 ± 0.02 a | 2.90 ± 0.10 b | 12.84 ± 0.11 b | 3.23 ± 0.14 b | 77.97 ± 0.17 a |
| 7.5 | 2.06 ± 0.07 b | 3.51 ± 0.11 a | 16.39 ± 0.14 a | 4.28 ± 0.06 a | 73.77 ± 0.16 b |
| Fatty Acids (%) | MC3 Level (%, w/w) | |
|---|---|---|
| 0 | 7.5 | |
| C14:0 (Myristic) | ND | 1.85 ± 0.09 a |
| C15:0 (Pentadecanoic) | ND | 0.89 ± 0.07 a,b |
| C16:0 (Palmitic) | 16.09 ± 0.21 b | 18.37 ± 0.44 a |
| C16:1 (Palmitoleic) | 1.37 ± 0.19 a | 1.56 ± 0.10 a |
| C17:0 (Heptadecanoic) | ND | 1.52 ± 0.13 a |
| C18:0 (Stearic) | 5.68 ± 0.13 a | 5.37 ± 0.08 b |
| C18:1 (Oleic) | 17.37 ± 0.42 b | 23.18 ± 0.52 a |
| C18:2 (Linoleic) | 4.96 ± 0.28 a | 6.42 ± 0.51 a |
| C18:3 (alpha-Linolenic) | 48.91 ± 0.49 a | 28.17 ± 0.17 b |
| C20:0 (Arachidic) | 0.67 ± 0.04 a | 0.33 ± 0.01 b |
| C20:2 (Eicosadienoic) | ND | 0.34 ± 0.01 a |
| C20:5 (EPA) | ND | 1.63 ± 0.17 a |
| C22:6 (DHA) | ND | 4.59 ± 0.19 a |
| C23:0 (Tricosanoic) | ND | 1.92 ± 0.08 a |
| C24:1 (Nervonic) | ND | 0.21 ± 0.01 a |
| Saturated fatty acid (SFA) | 22.46 ± 0.58 b | 26.15 ± 0.28 a |
| Monounsaturated fatty acid (MUFA) | 18.71 ± 0.42 b | 25.27 ± 0.63 a |
| Polyunsaturated fatty acid (PUFA) | 53.78 ± 0.36 a | 41.31 ± 0.31 b |
Publisher’s Note: MDPI stays neutral with regard to jurisdictional claims in published maps and institutional affiliations. |
© 2022 by the authors. Licensee MDPI, Basel, Switzerland. This article is an open access article distributed under the terms and conditions of the Creative Commons Attribution (CC BY) license (https://creativecommons.org/licenses/by/4.0/).
Share and Cite
Gulzar, S.; Nilsuwan, K.; Raju, N.; Benjakul, S. Whole Wheat Crackers Fortified with Mixed Shrimp Oil and Tea Seed Oil Microcapsules Prepared from Mung Bean Protein Isolate and Sodium Alginate. Foods 2022, 11, 202. https://doi.org/10.3390/foods11020202
Gulzar S, Nilsuwan K, Raju N, Benjakul S. Whole Wheat Crackers Fortified with Mixed Shrimp Oil and Tea Seed Oil Microcapsules Prepared from Mung Bean Protein Isolate and Sodium Alginate. Foods. 2022; 11(2):202. https://doi.org/10.3390/foods11020202
Chicago/Turabian StyleGulzar, Saqib, Krisana Nilsuwan, Navaneethan Raju, and Soottawat Benjakul. 2022. "Whole Wheat Crackers Fortified with Mixed Shrimp Oil and Tea Seed Oil Microcapsules Prepared from Mung Bean Protein Isolate and Sodium Alginate" Foods 11, no. 2: 202. https://doi.org/10.3390/foods11020202
APA StyleGulzar, S., Nilsuwan, K., Raju, N., & Benjakul, S. (2022). Whole Wheat Crackers Fortified with Mixed Shrimp Oil and Tea Seed Oil Microcapsules Prepared from Mung Bean Protein Isolate and Sodium Alginate. Foods, 11(2), 202. https://doi.org/10.3390/foods11020202