
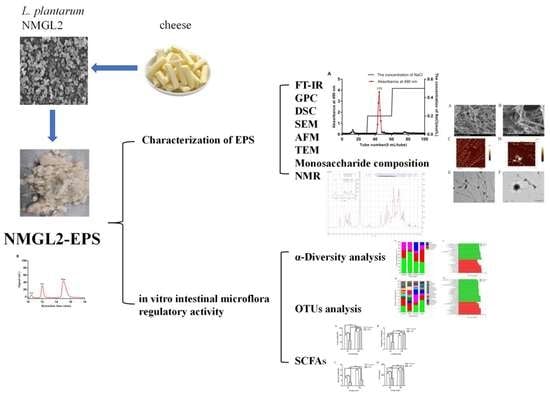
Characterization and In Vitro Fecal Microbiota Regulatory Activity of a Low-Molecular-Weight Exopolysaccharide Produced by Lactiplantibacillus plantarum NMGL2


Abstract
:
1. Introduction
2. Materials and Methods
2.1. Bacterial Strain and Culture Condition
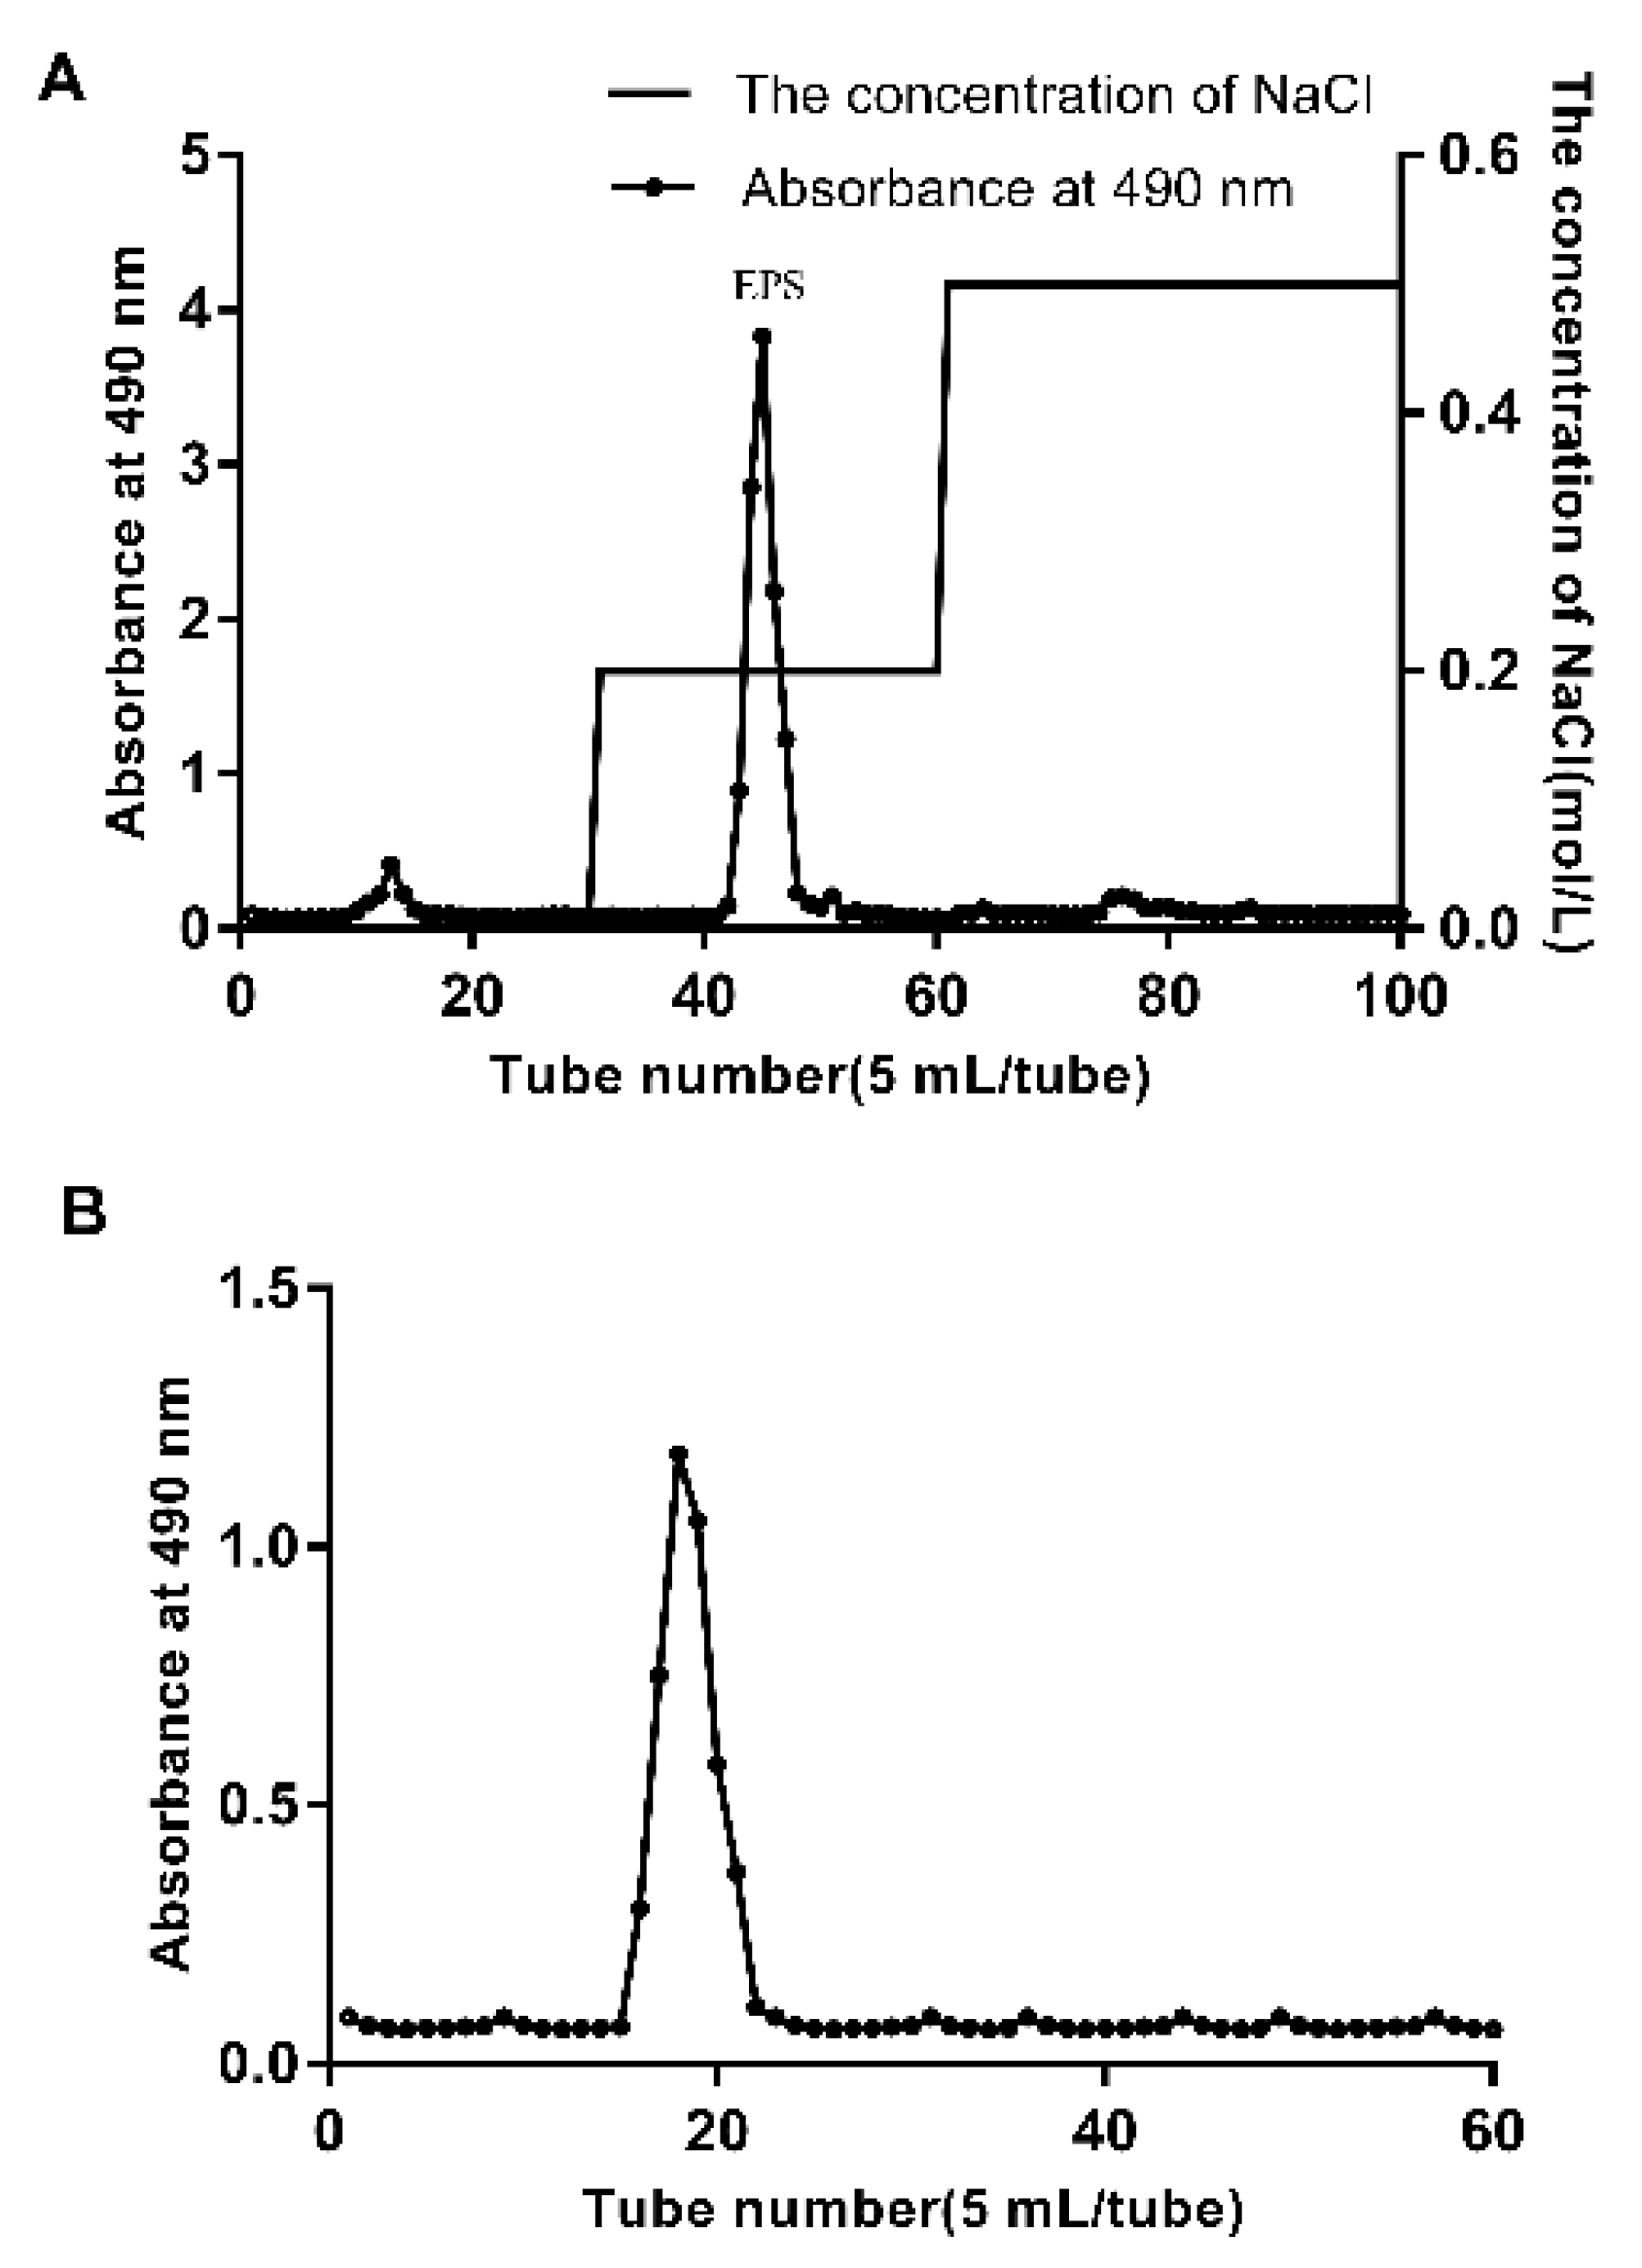
2.2. Extraction and Purification of EPS
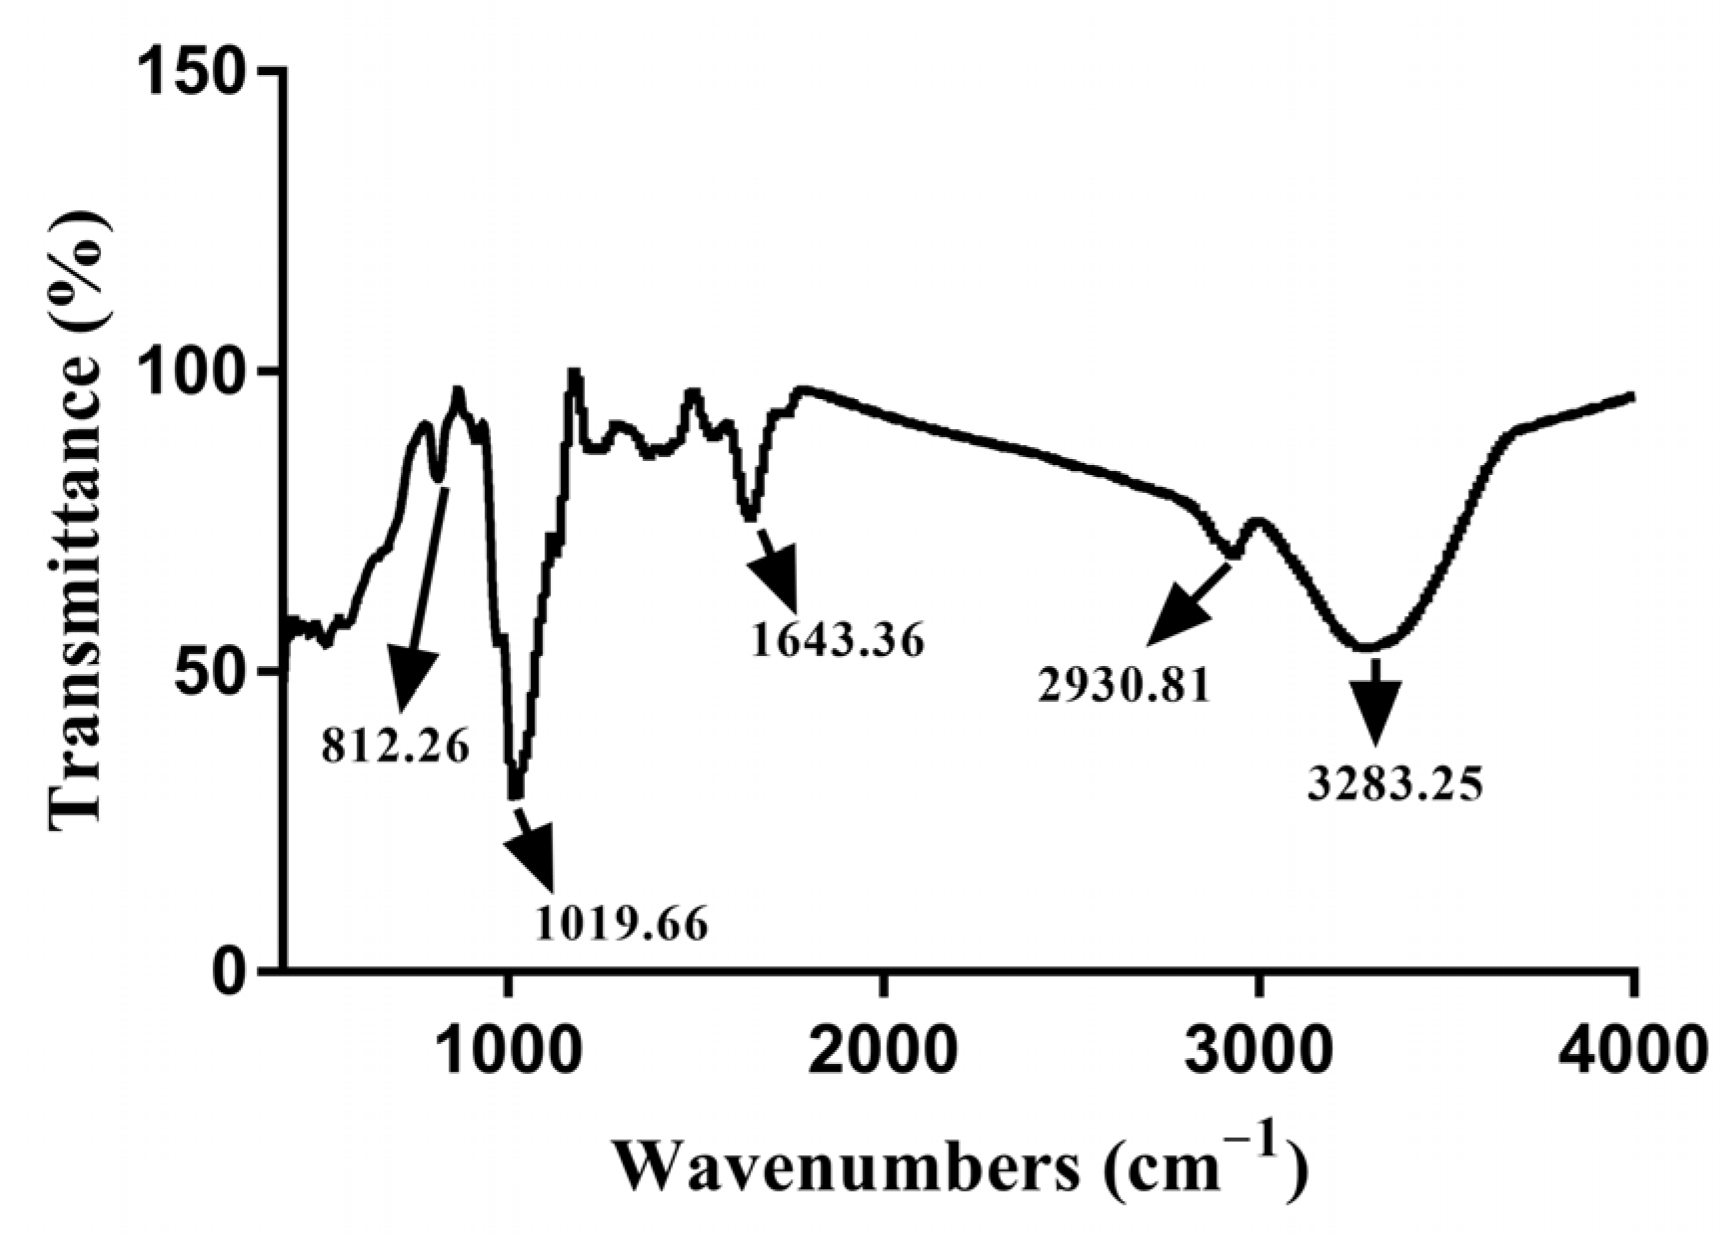
2.3. Fourier Transform Infrared Spectroscopy Analysis
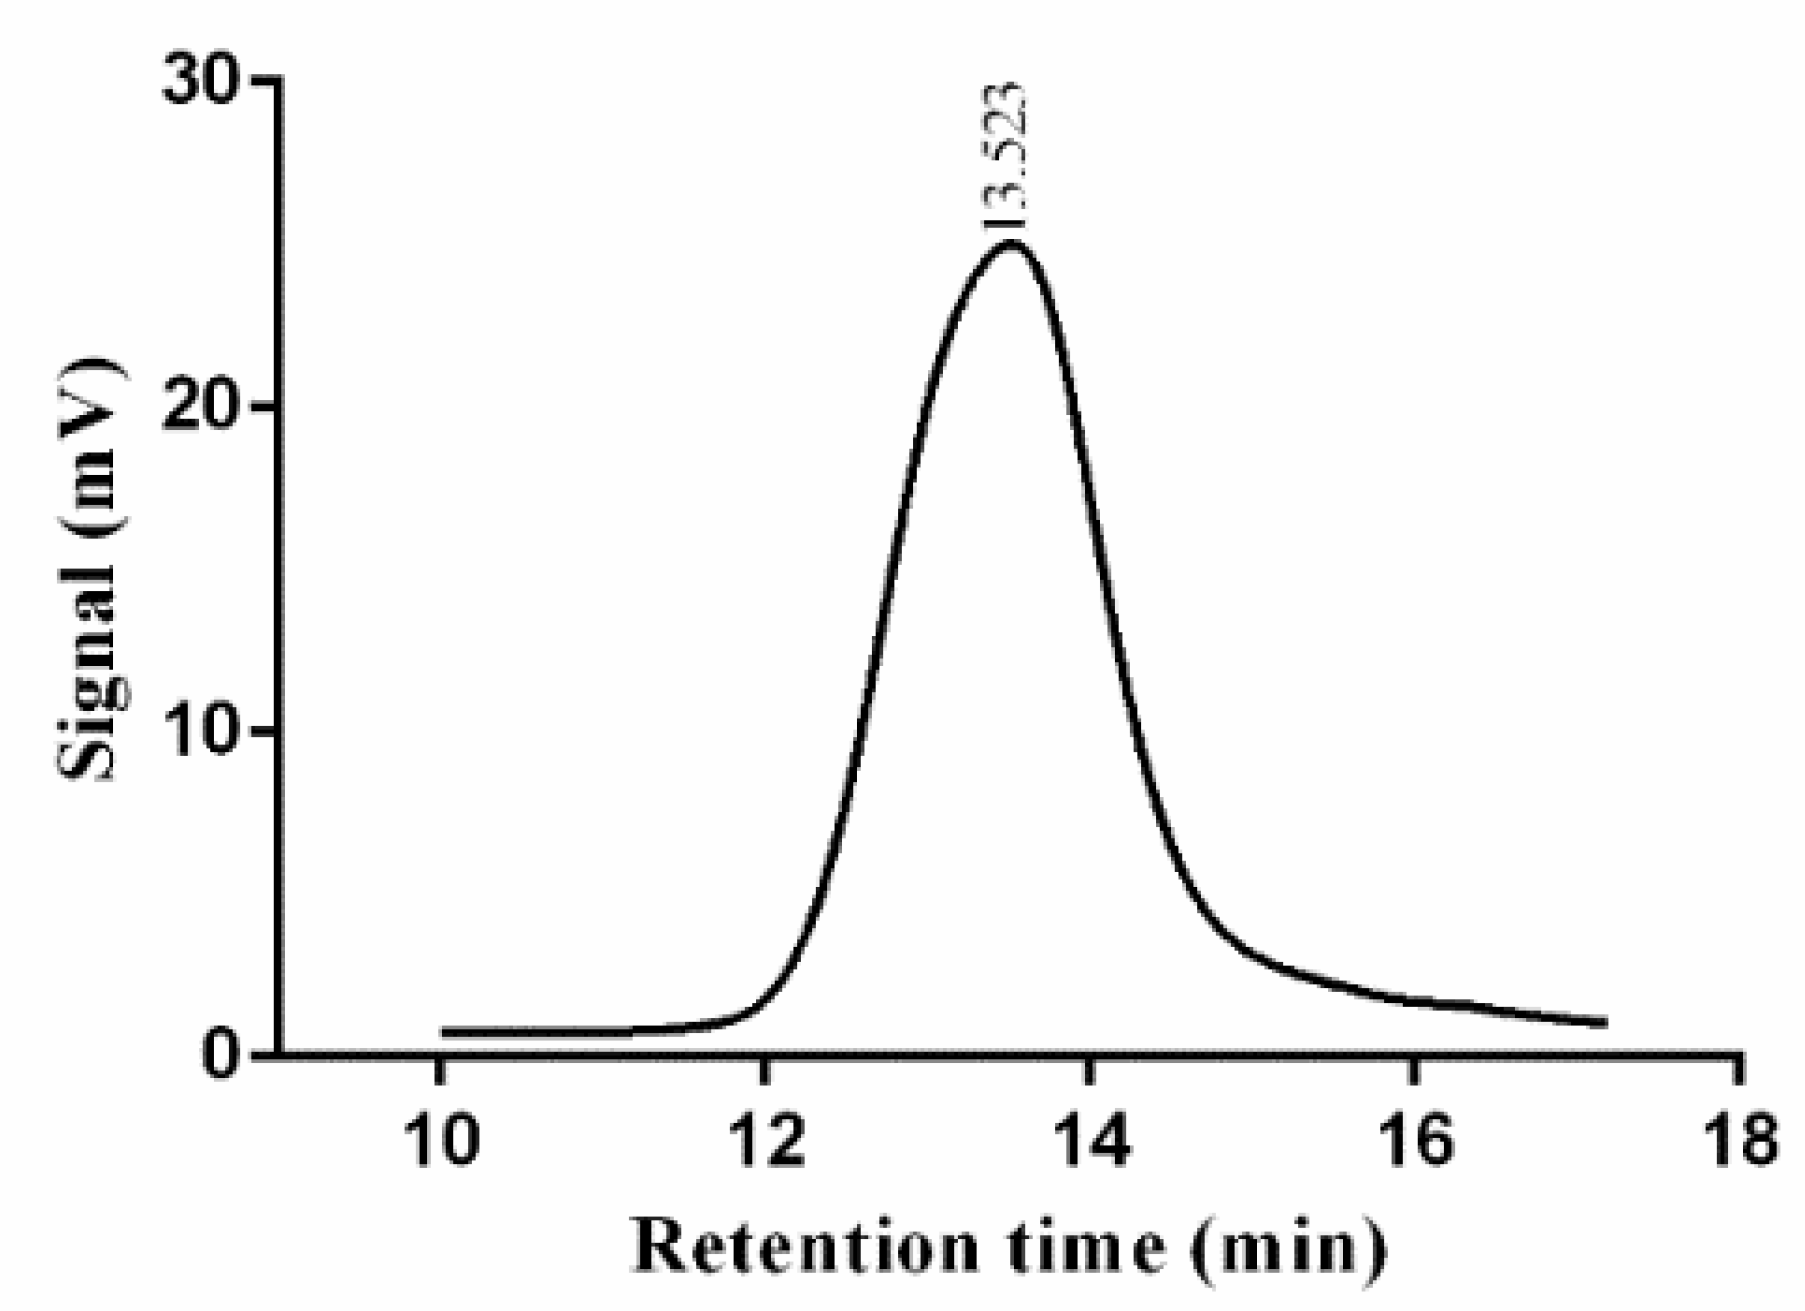
2.4. Molecular Weight Determination
2.5. Thermodynamic Stability Analysis
2.6. Microstructural Analysis of EPS
2.6.1. Scanning Electron Microscopy Analysis
2.6.2. Atomic Force Microscopy Analysis
2.6.3. Transmission Electron Microscopy Analysis
2.7. Monosaccharide Composition Analysis
2.8. Nuclear Magnetic Resonance Spectroscopy Analysis
2.9. In Vitro Digestibility of EPS
2.10. Fecal Microbiota Regulatory Activity of EPS
2.10.1. Fecal Slurry Preparation
2.10.2. In Vitro Fecal Fermentation
2.10.3. Extraction of Genomic DNA and Amplicon Sequencing of 16S rRNA Gene
2.10.4. Determination of Short-Chain Fatty Acids
2.11. Statistical Analysis
3. Results and Discussion
3.1. Extraction and Purification of EPS
3.2. Infrared Spectrum Analysis of EPS
3.3. Molecular Weight Determination of EPS
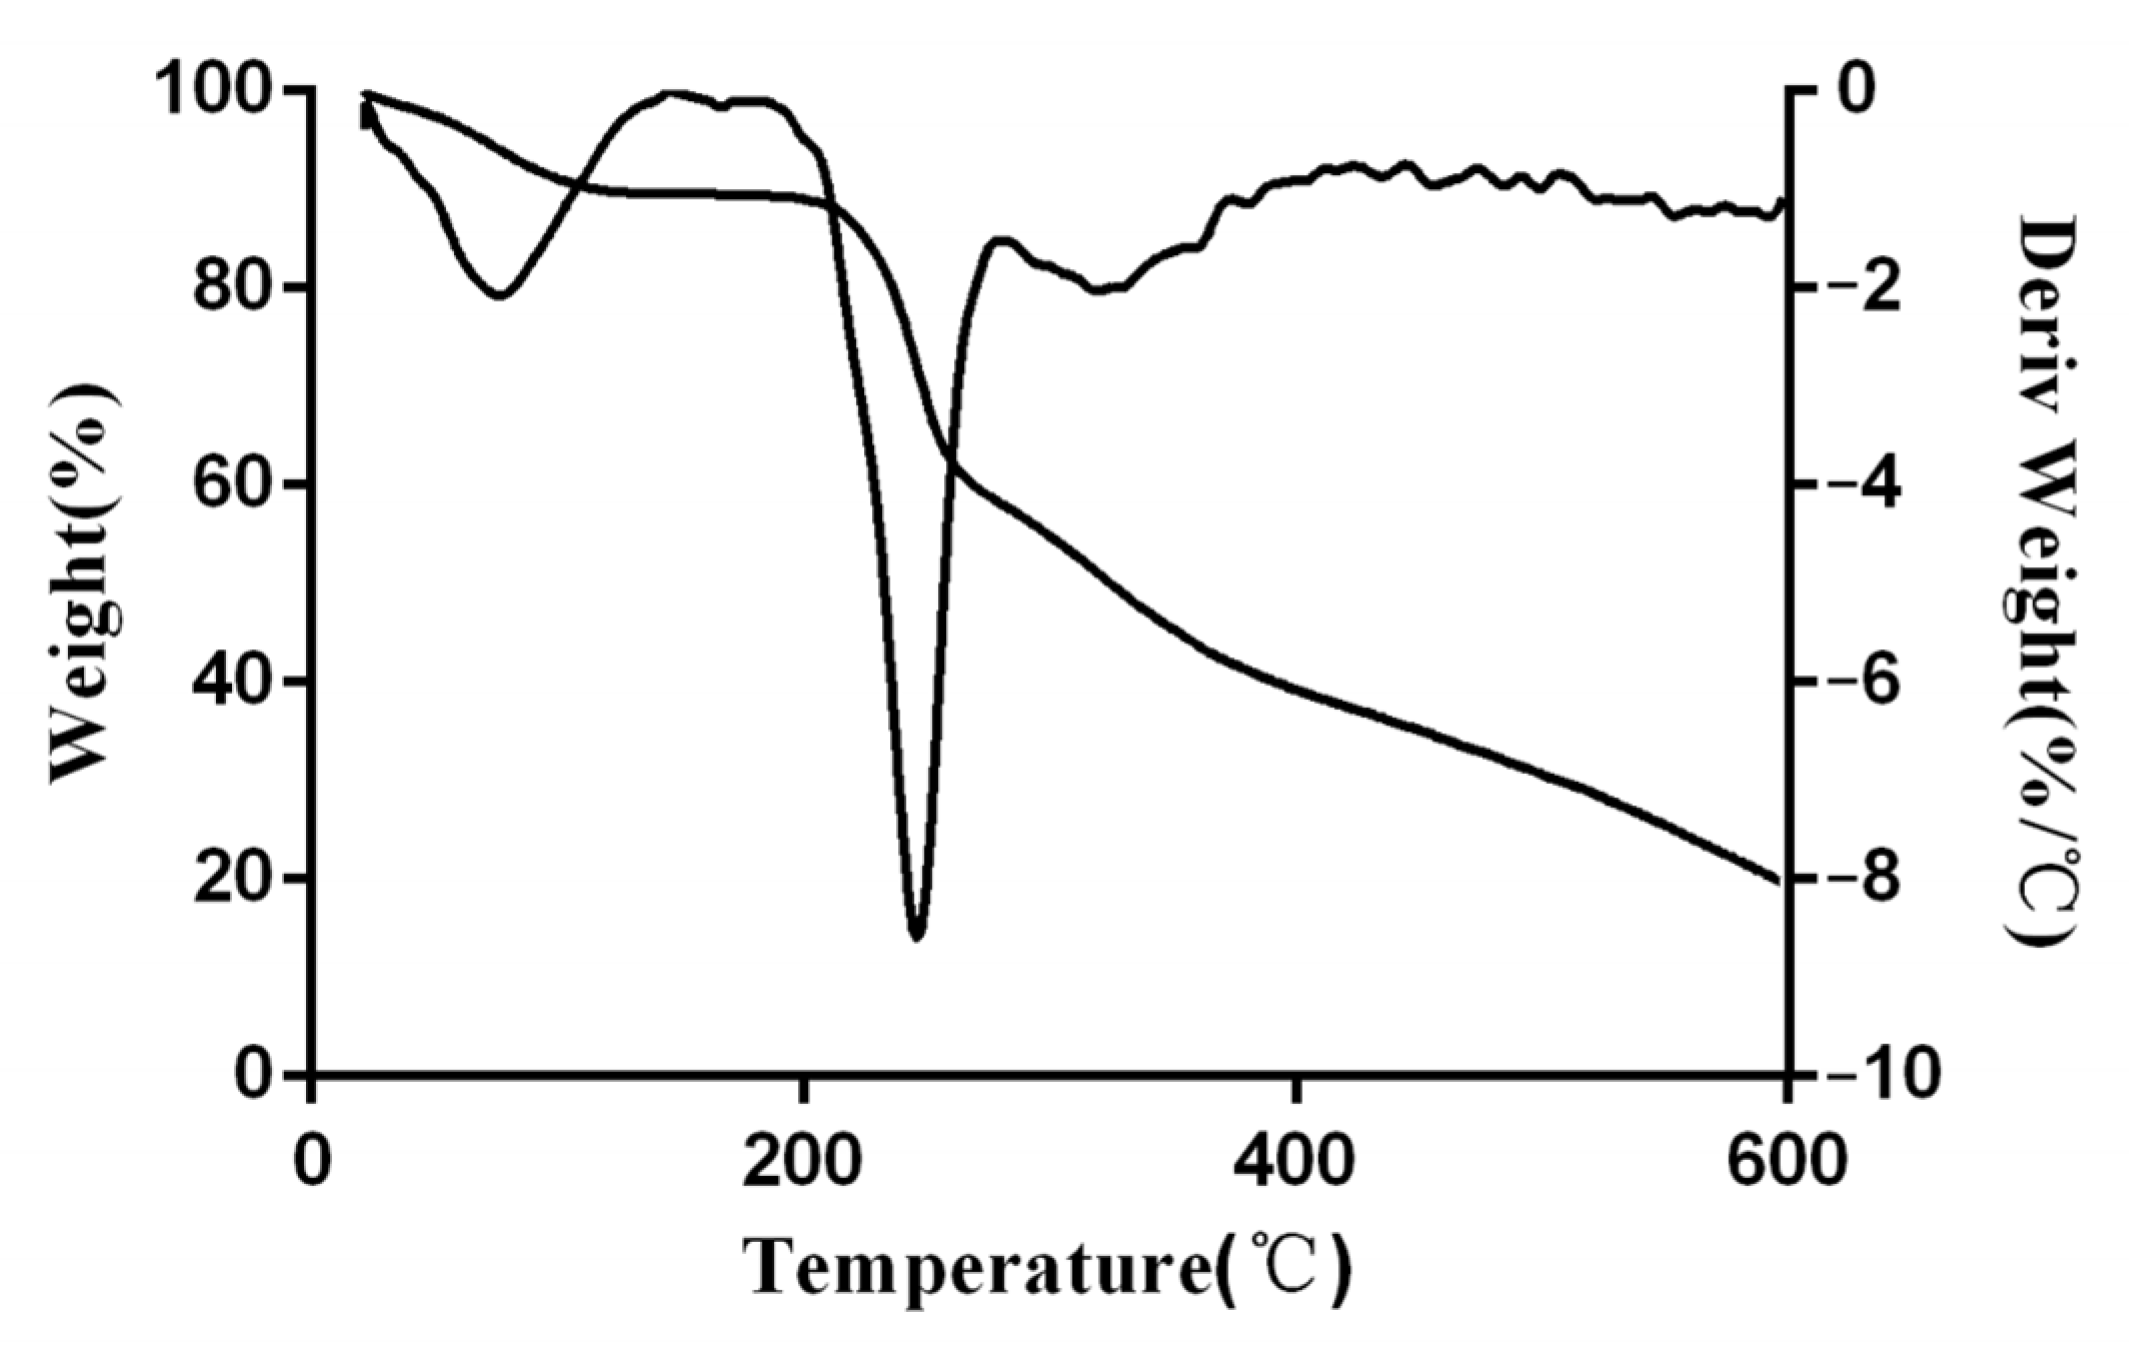
3.4. Thermogram Analysis of EPS
3.5. Microstructural Analysis of EPS
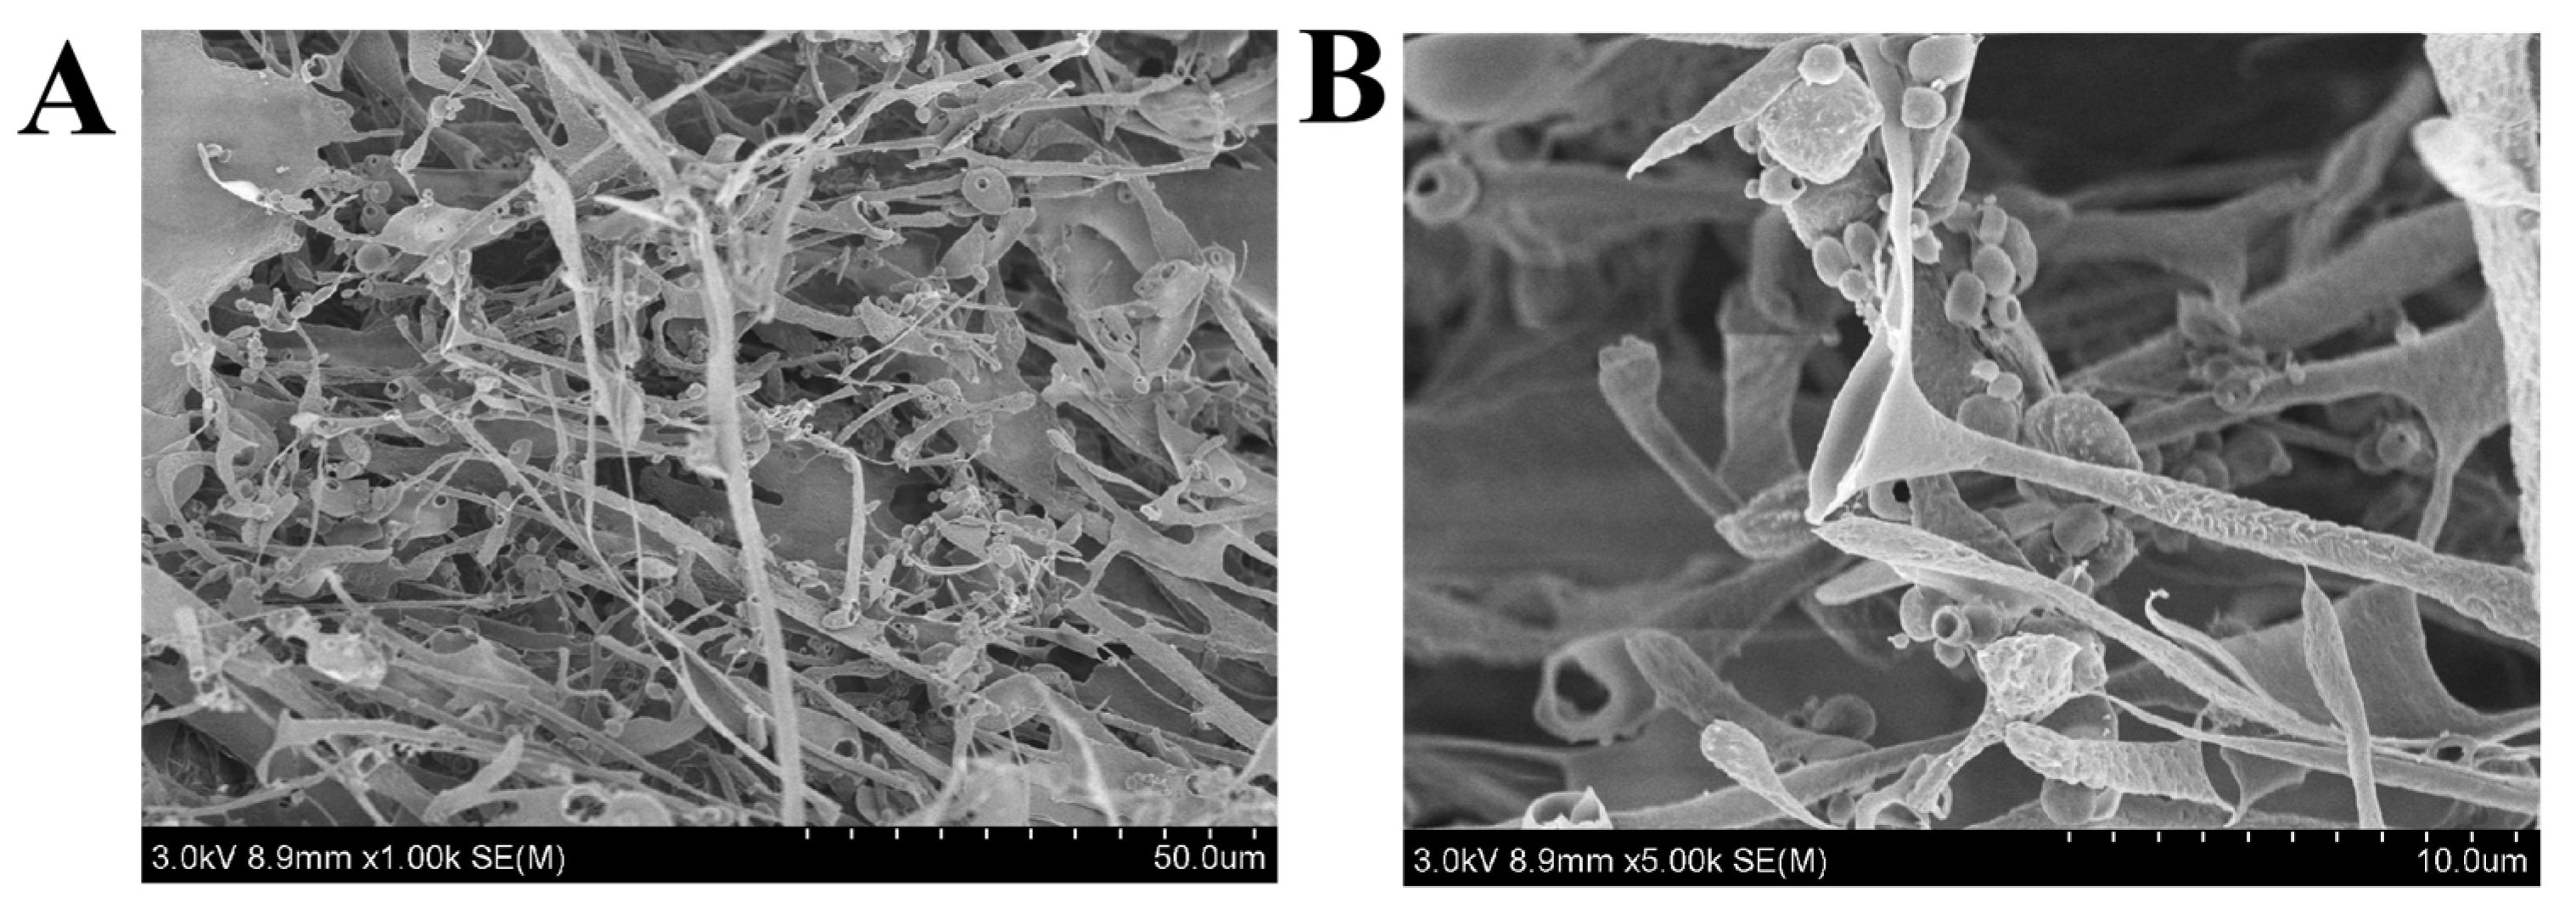
3.5.1. SEM Analysis
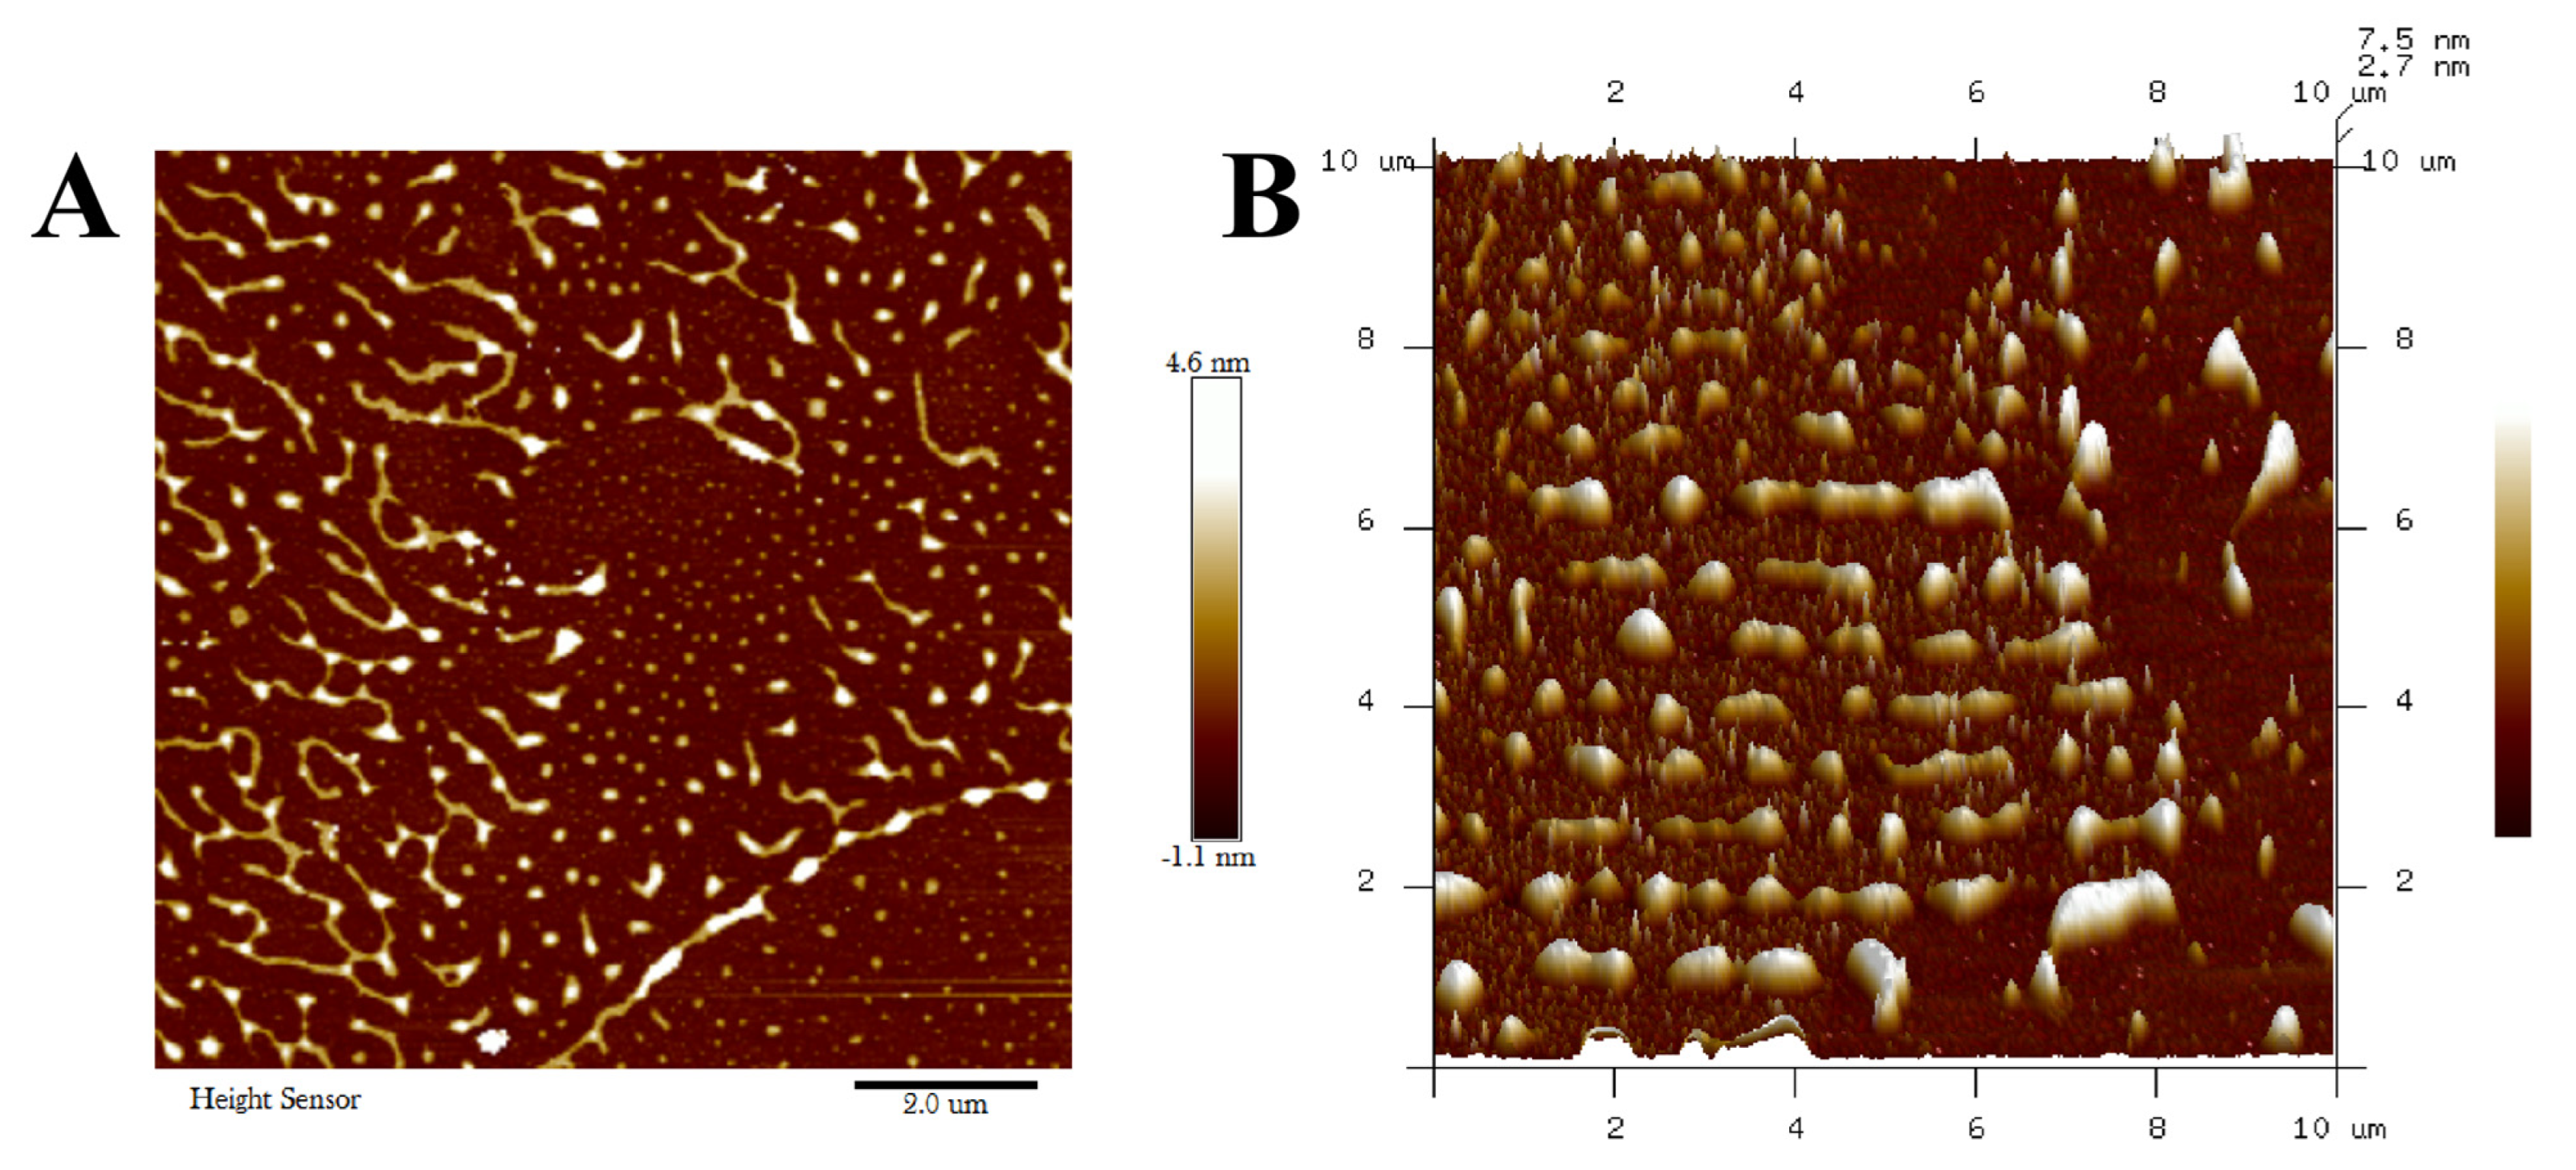
3.5.2. AFM Analysis
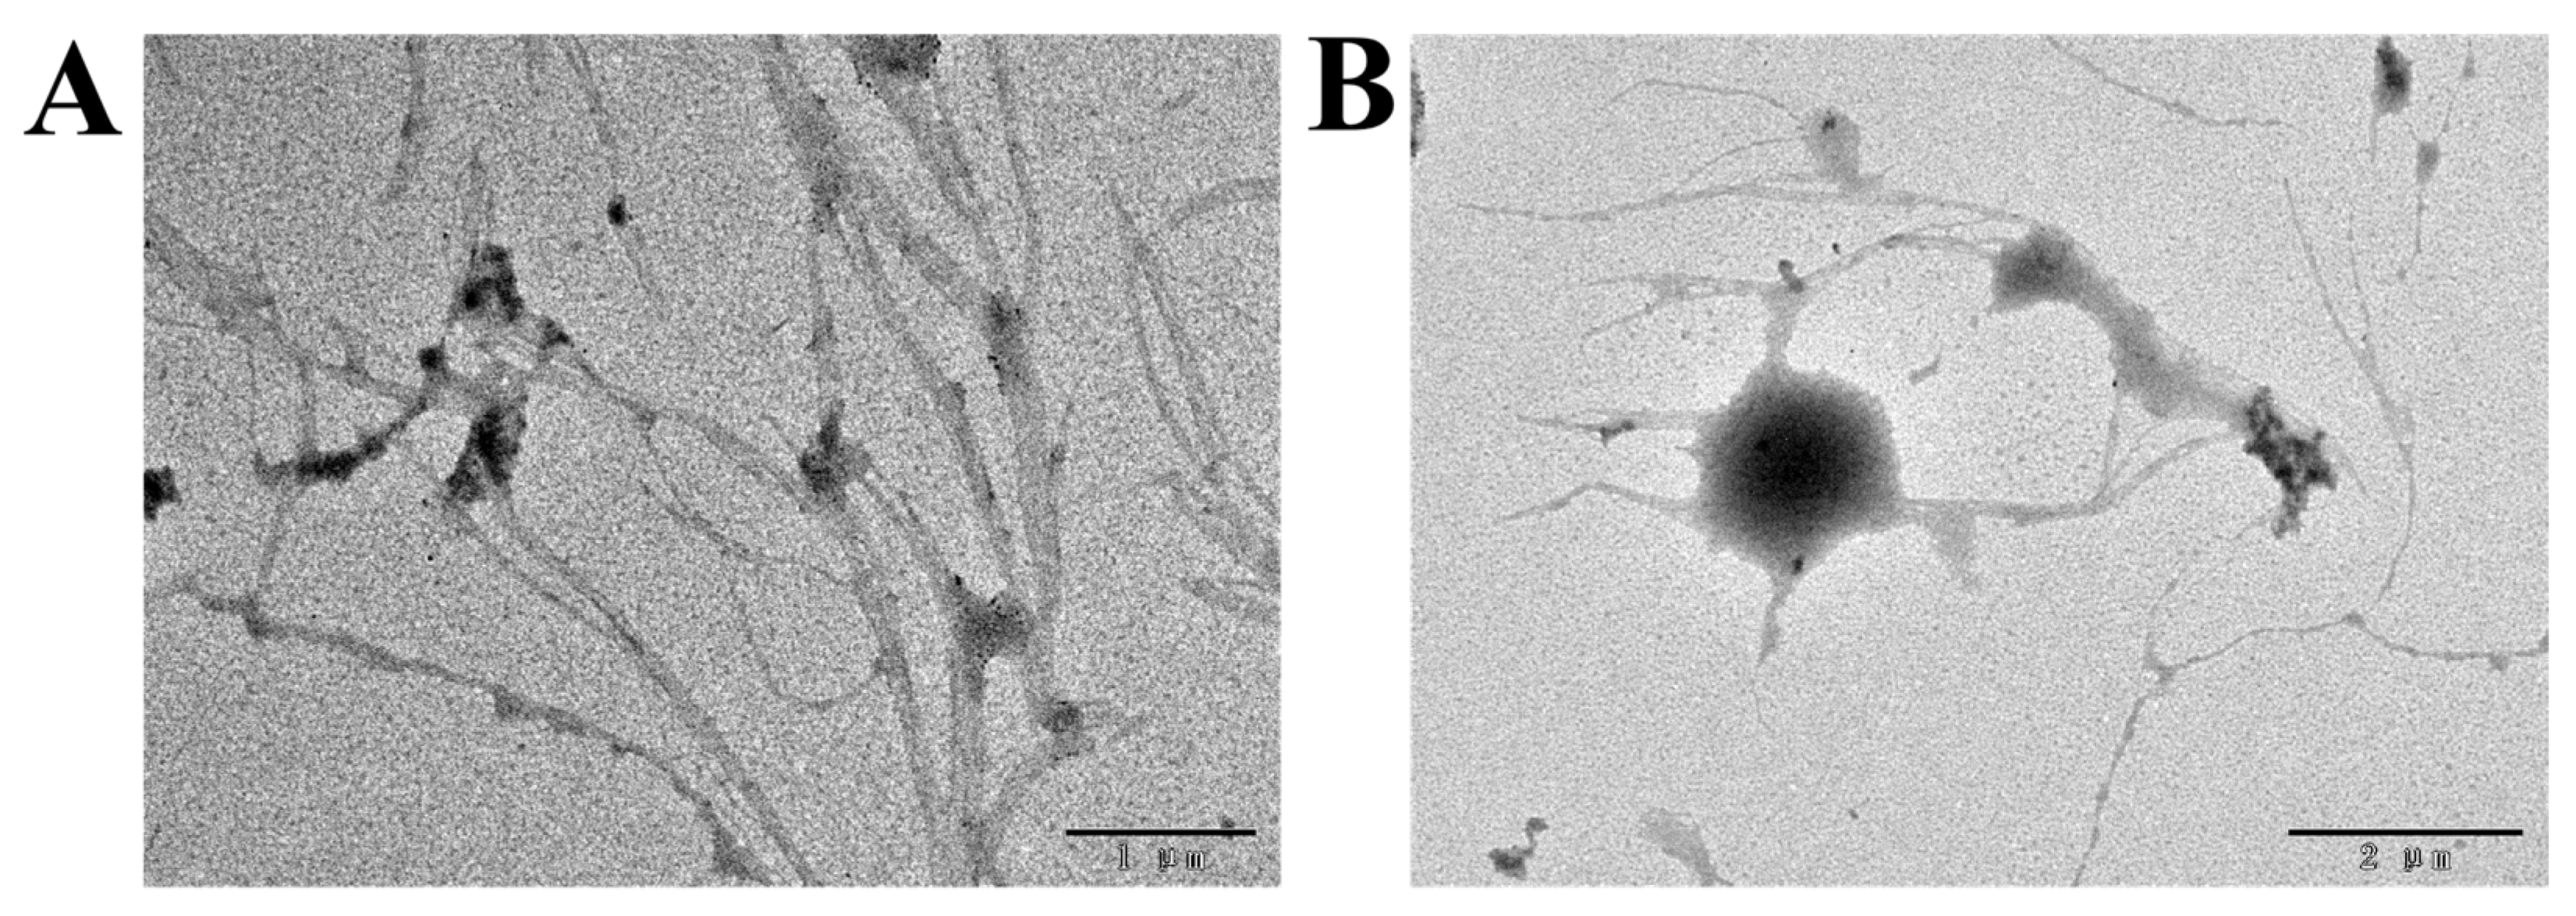
3.5.3. TEM Analysis
3.6. Monosaccharide Composition and NMR Spectroscopy of EPS
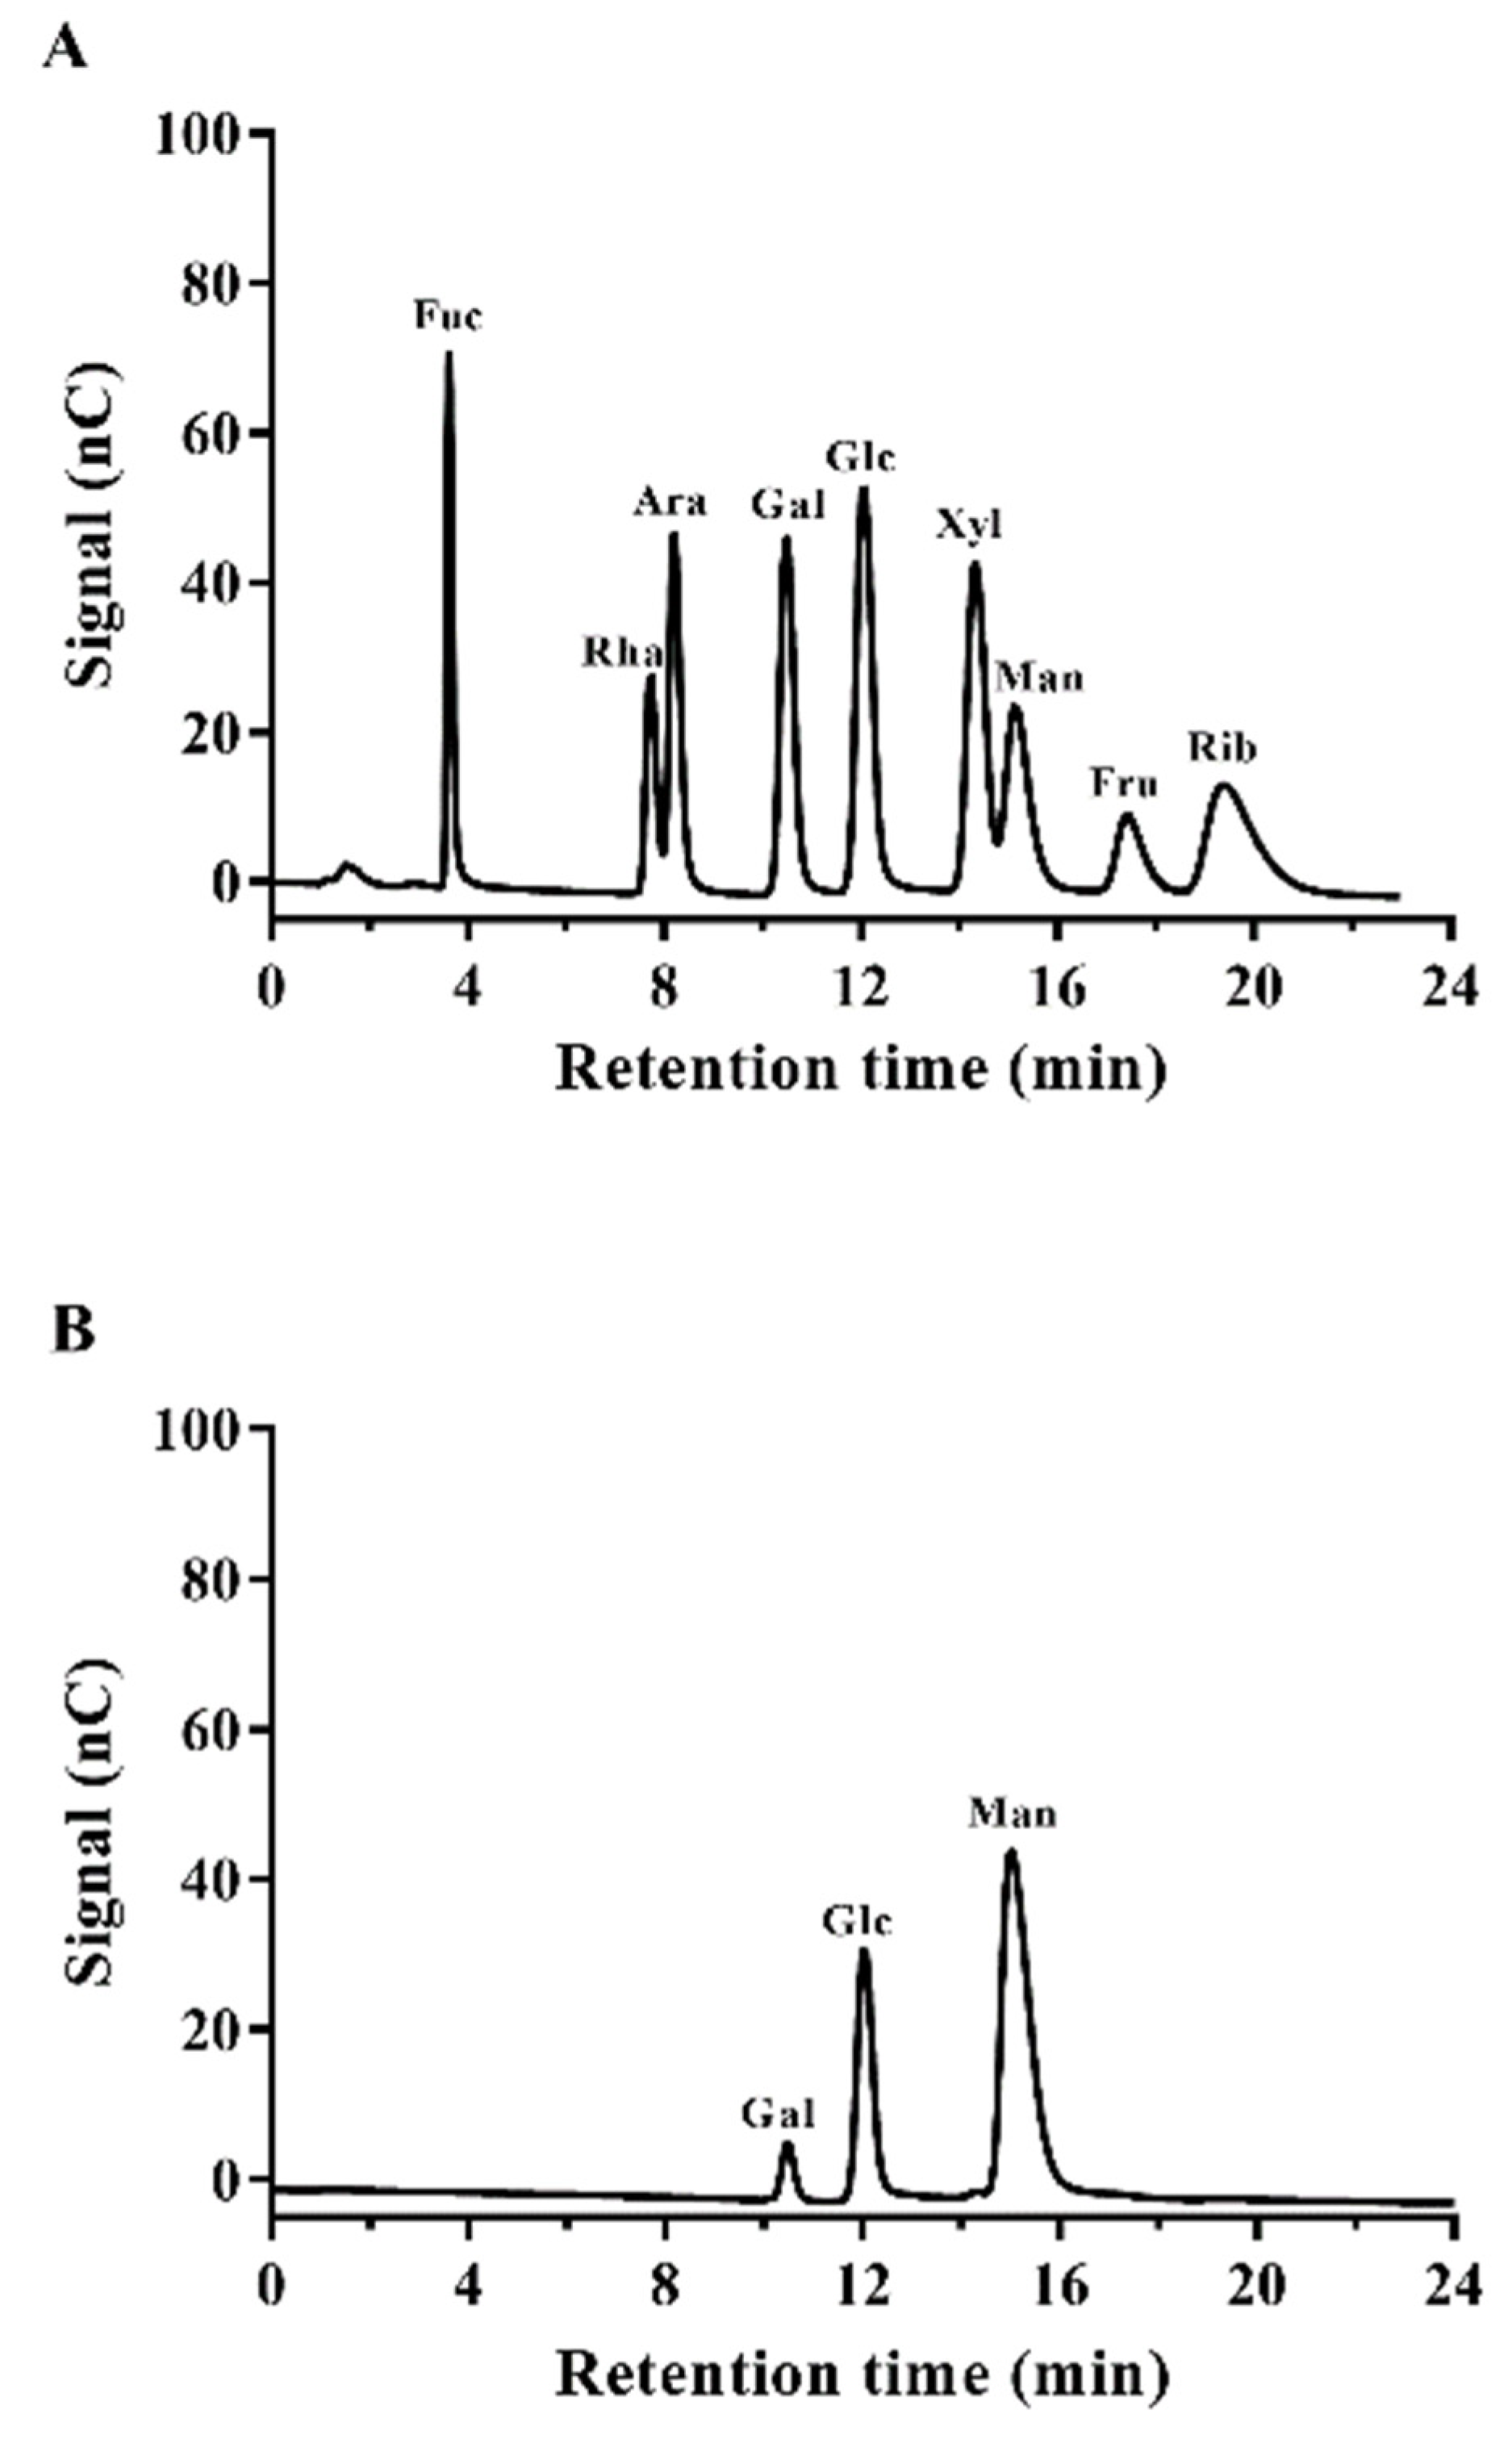
3.6.1. Monosaccharide Analysis
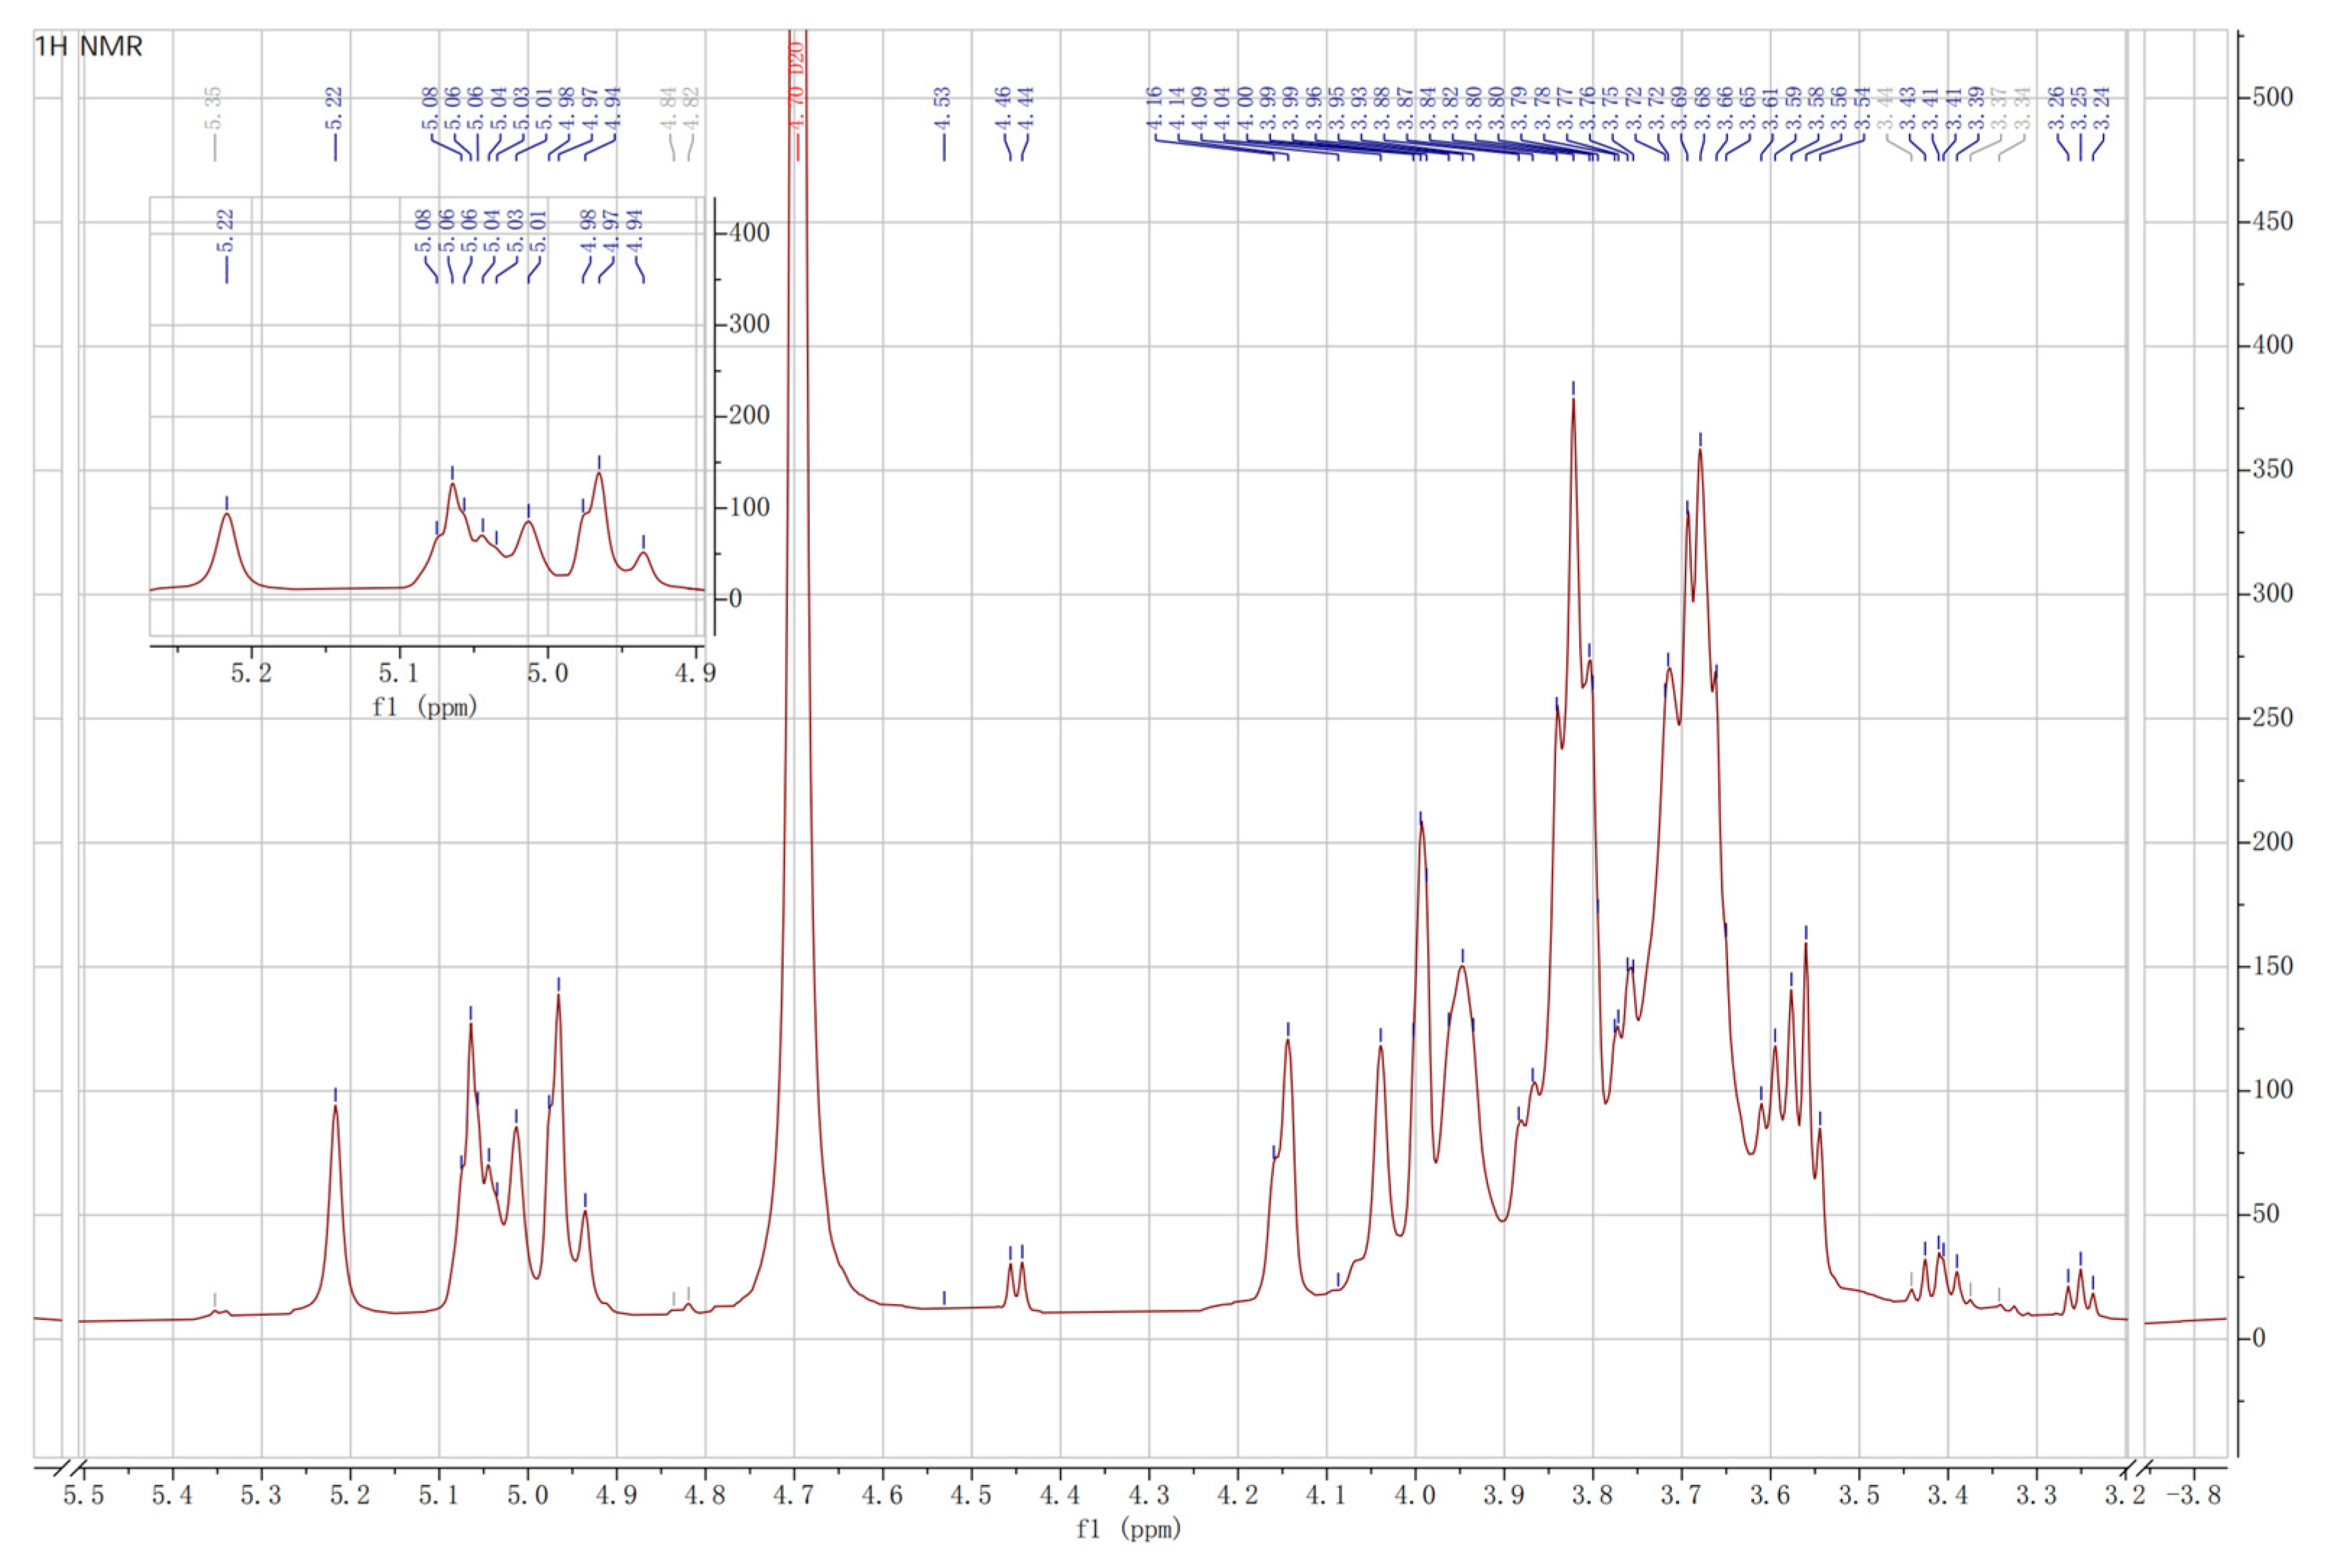
3.6.2. NMR Spectroscopy
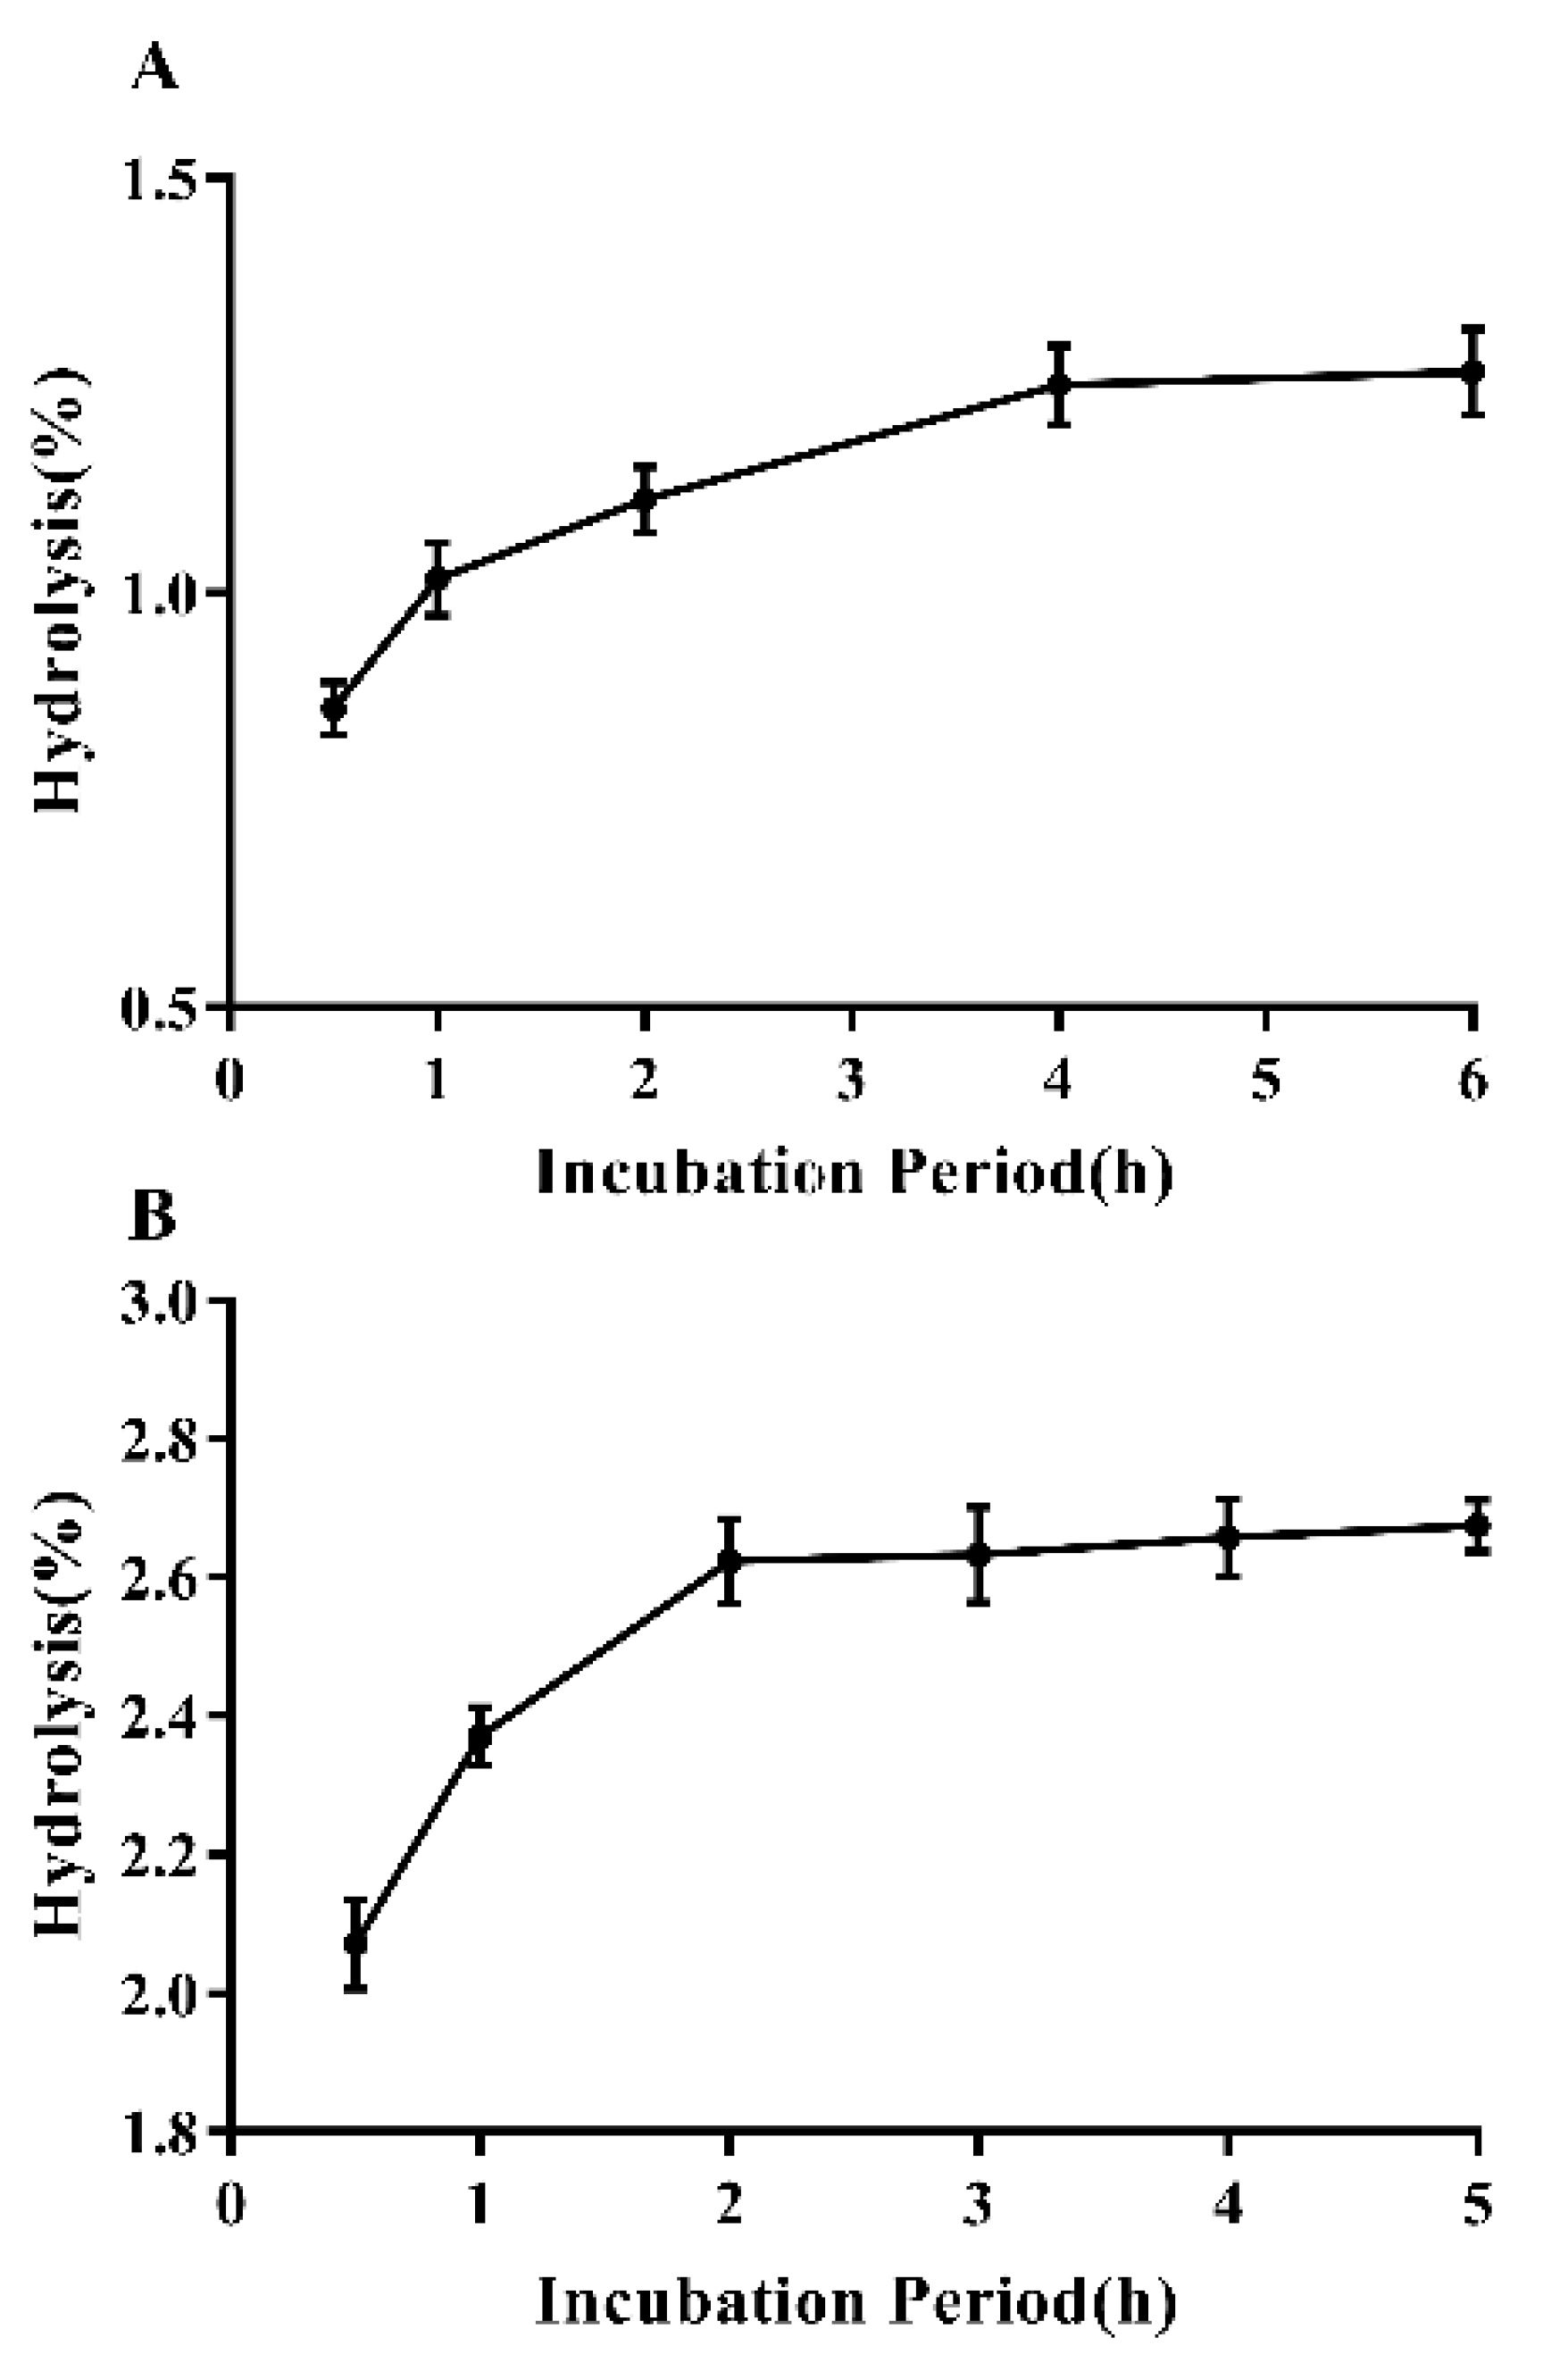
3.7. In Vitro Digestibility of EPS
3.8. Fecal Microbiota Regulatory Activity of EPS
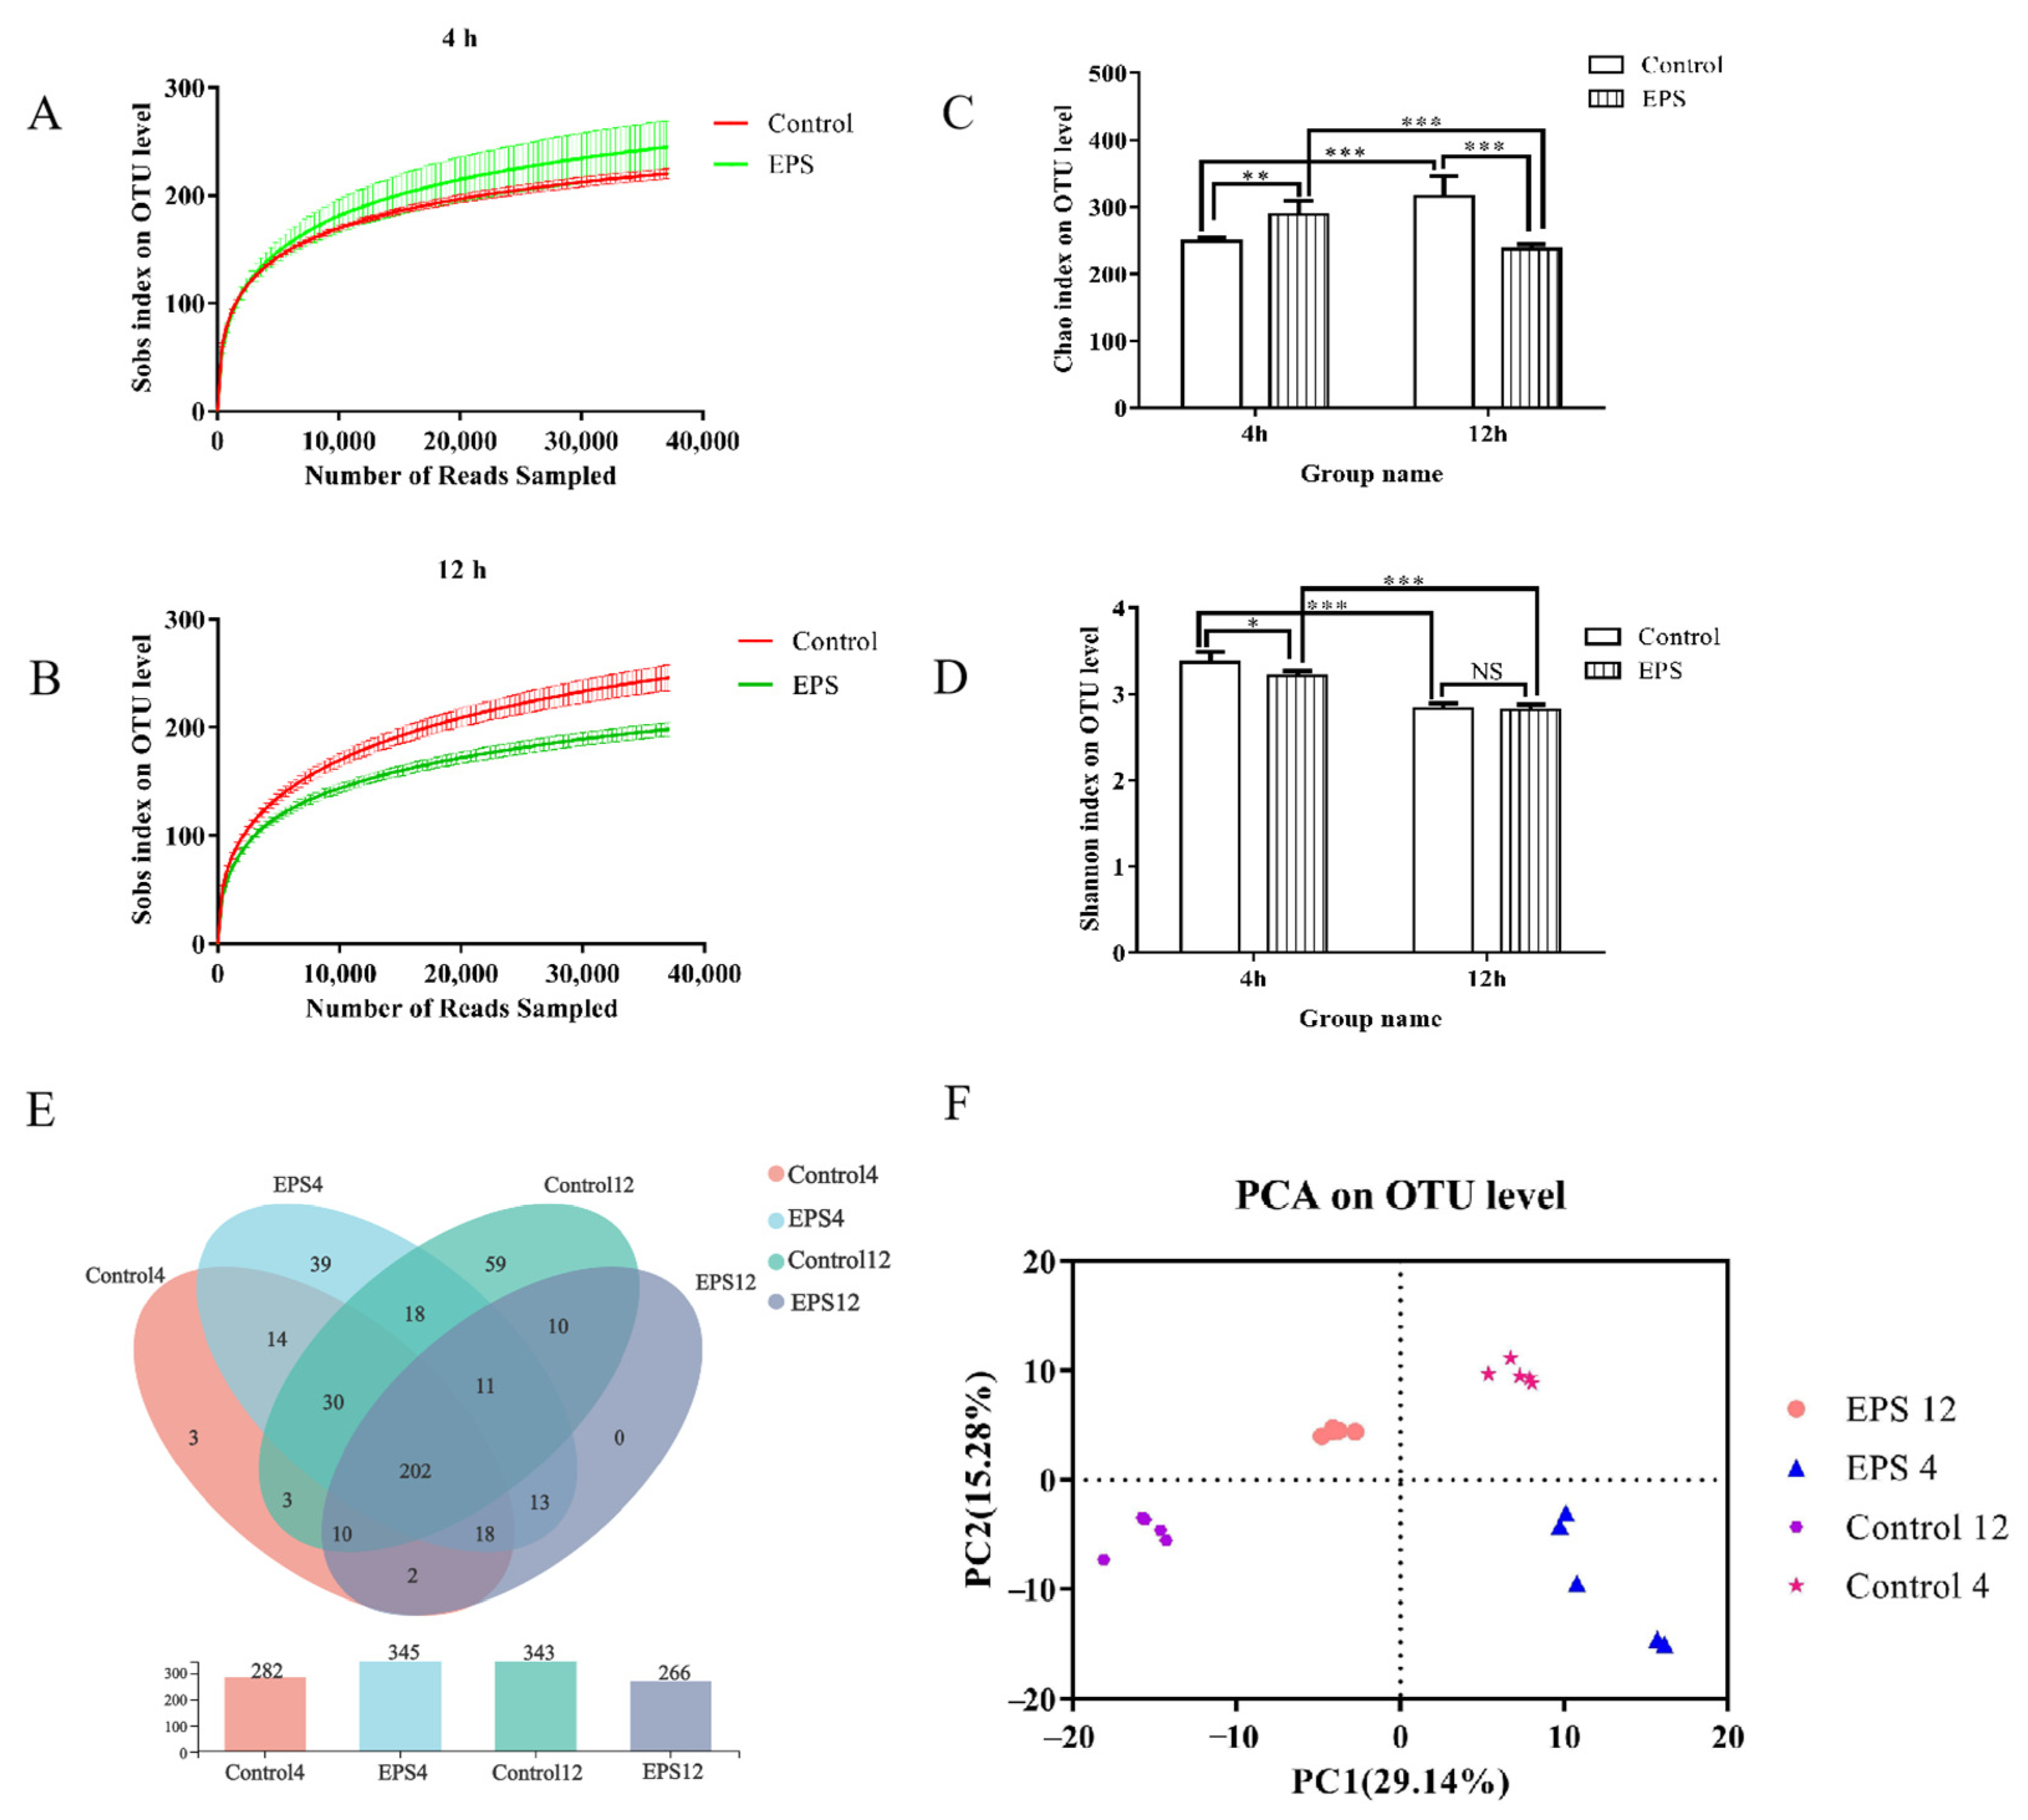
3.8.1. α-Diversity Analysis
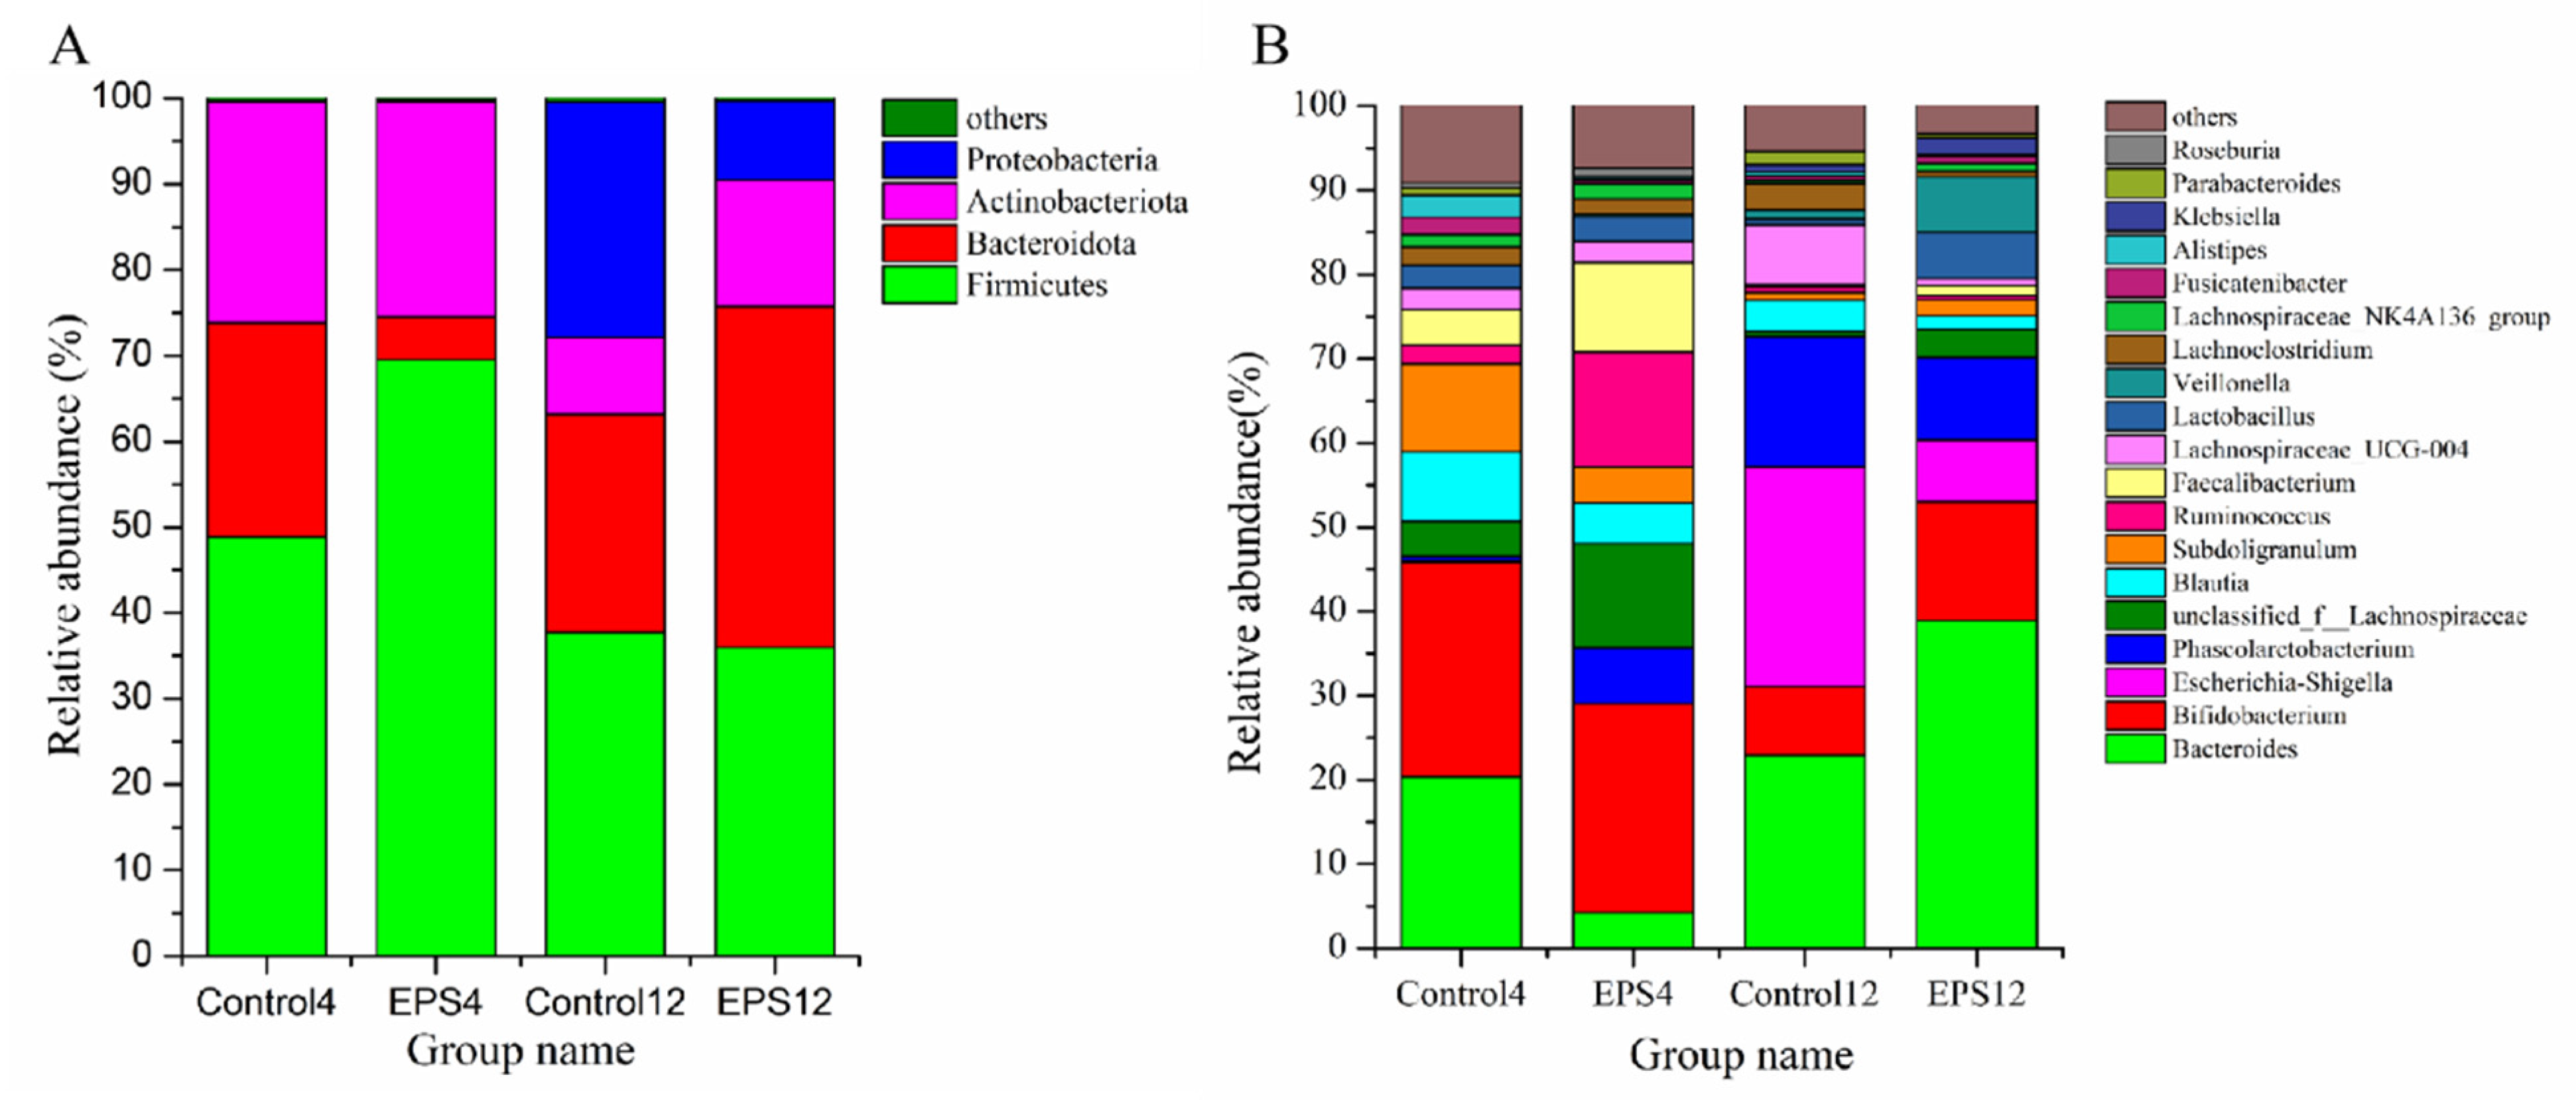
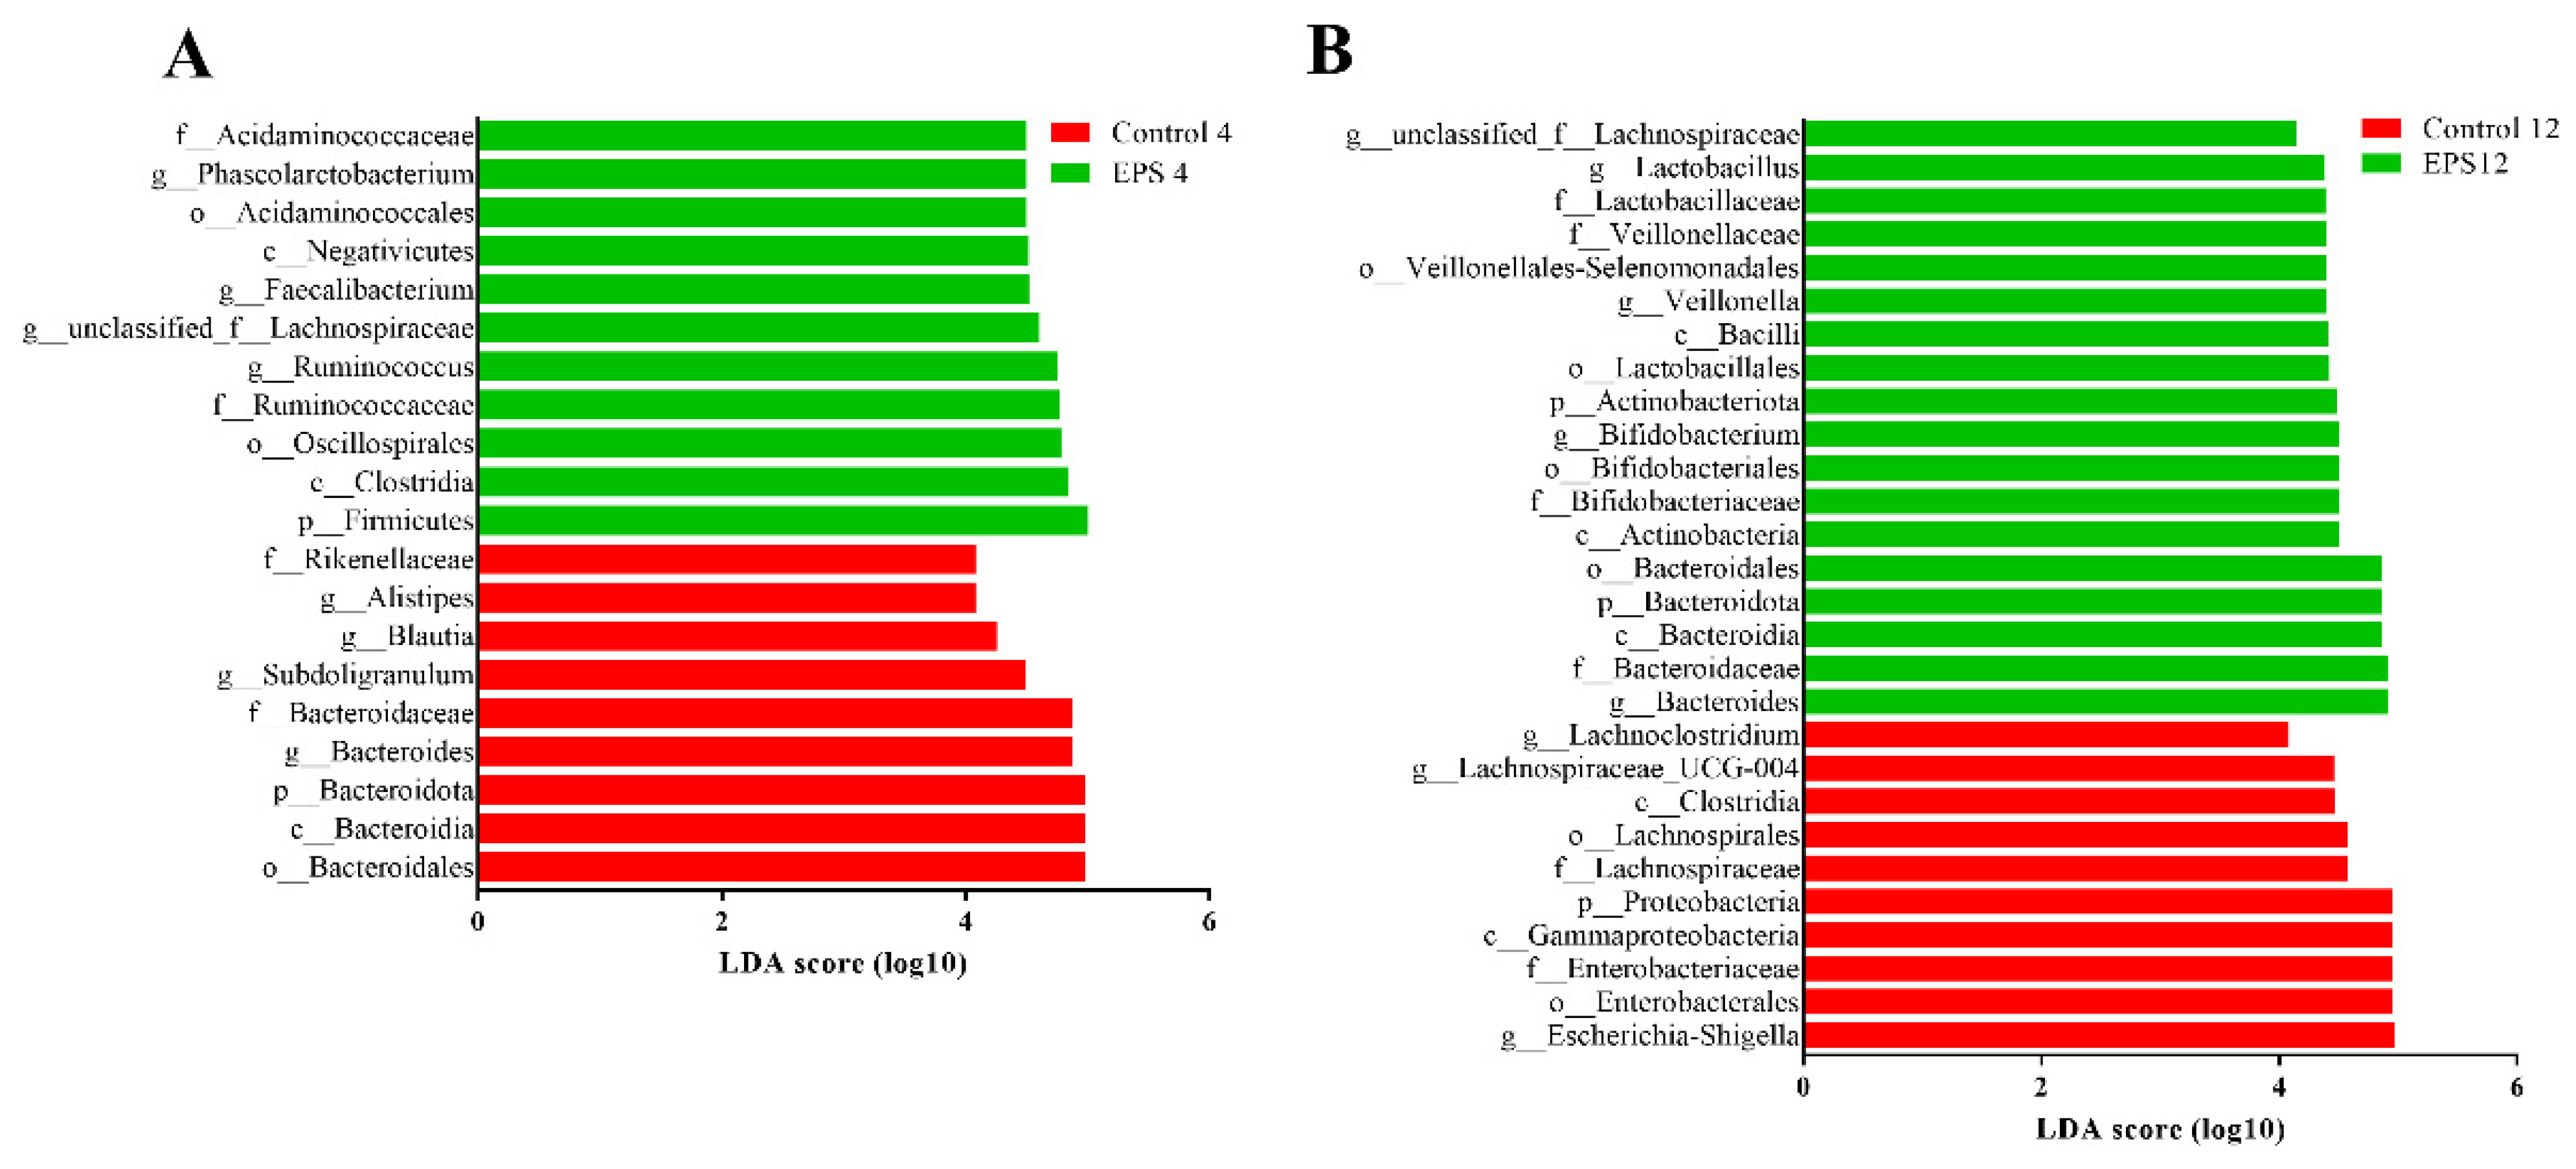
3.8.2. OTUs Analysis
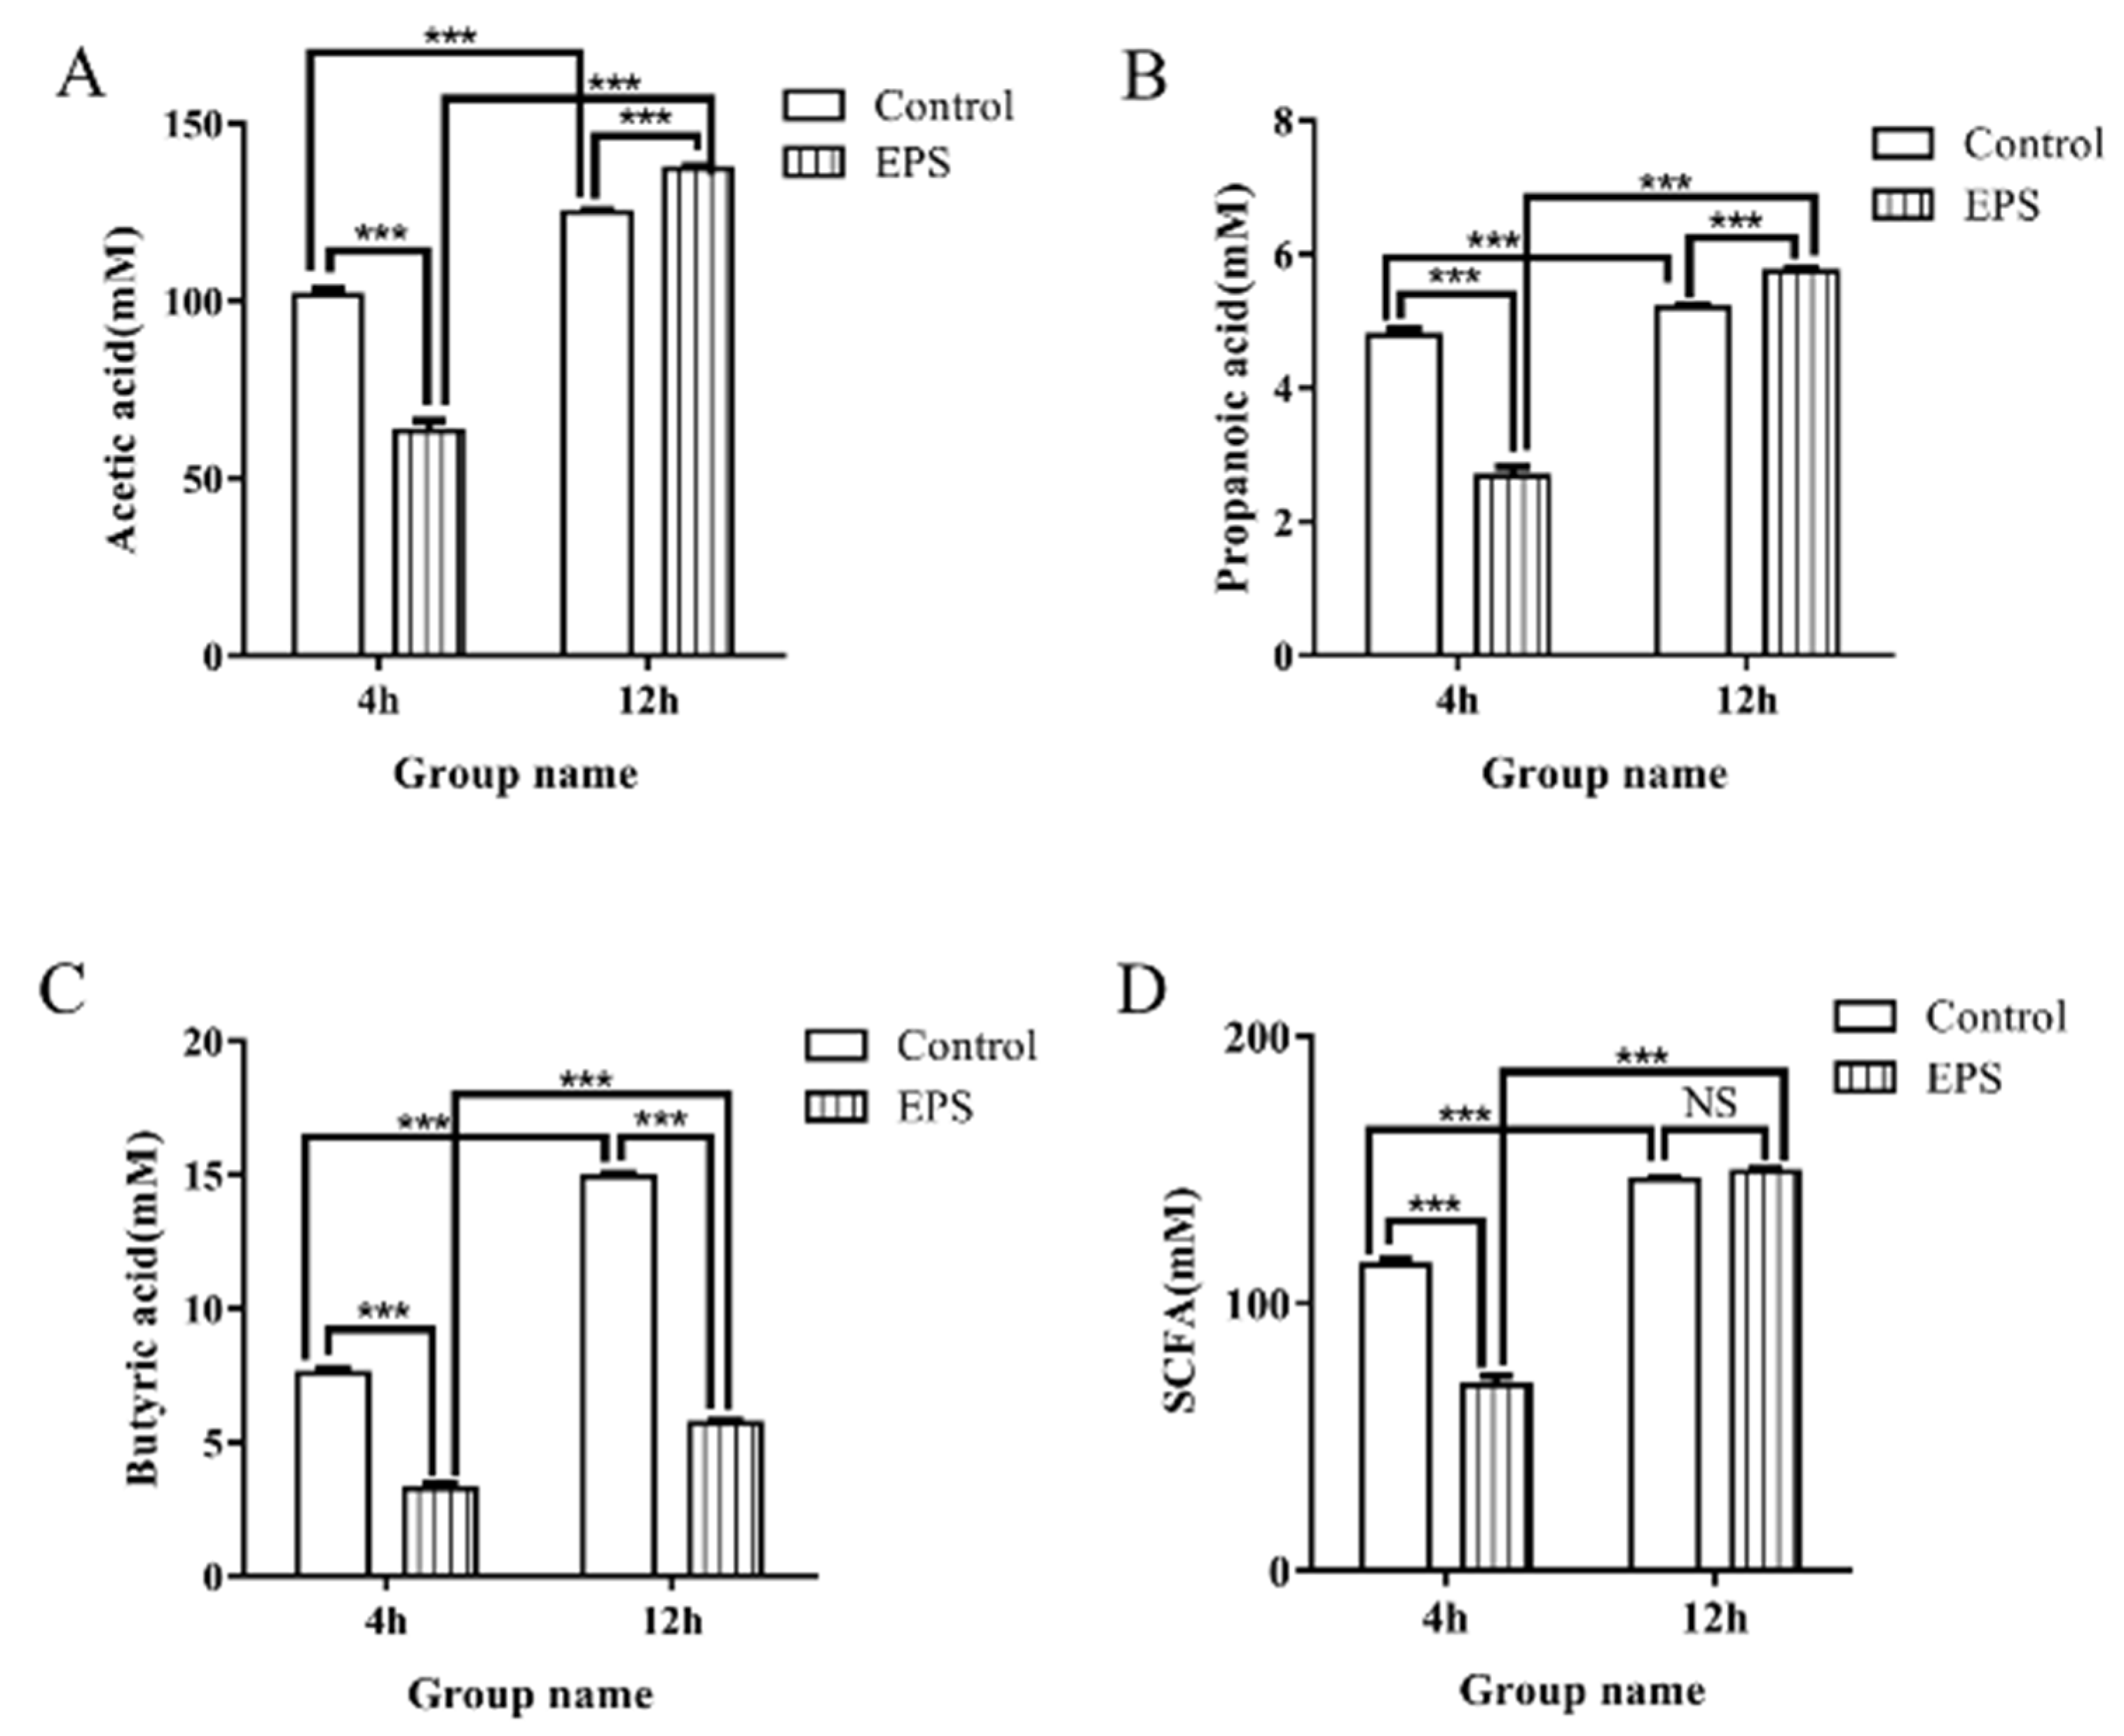
3.8.3. SCFAs Produced in the Fecal Cultures
4. Conclusions
Author Contributions
Funding
Institutional Review Board Statement
Informed Consent Statement
Data Availability Statement
Conflicts of Interest
References
- Lee, I.C.; Caggianiello, G.; van Swam, I.I.; Taverne, N.; Meijerink, M.; Bron, P.A.; Spano, G.; Kleerebezem, M. Strain-Specific Features of Extracellular Polysaccharides and Their Impact on Lactobacillus plantarum-Host Interactions. Appl. Environ. Microbiol. 2016, 82, 3959–3970. [Google Scholar] [CrossRef] [PubMed] [Green Version]
- Jiang, Y.Y.; Yang, Z.N. A functional and genetic overview of exopolysaccharides produced by Lactobacillus plantarum. J. Funct. Foods 2018, 47, 229–240. [Google Scholar] [CrossRef]
- Zhang, L.; Liu, C.; Li, D.; Zhao, Y.; Zhang, X.; Zeng, X.; Yang, Z.; Li, S. Antioxidant activity of an exopolysaccharide isolated from Lactobacillus plantarum C88. Int. J. Biol. Macromol. 2013, 54, 270–275. [Google Scholar] [CrossRef] [PubMed]
- Sun, M.; Liu, W.; Song, Y.; Tuo, Y.; Mu, G.; Ma, F. The Effects of Lactobacillus plantarum-12 Crude Exopolysaccharides on the Cell Proliferation and Apoptosis of Human Colon Cancer (HT-29) Cells. Probiotics Antimicrob. Proteins 2021, 13, 413–421. [Google Scholar] [CrossRef] [PubMed]
- Mizuno, H.; Tomotsune, K.; Islam, M.A.; Funabashi, R.; Albarracin, L.; Ikeda-Ohtsubo, W.; Aso, H.; Takahashi, H.; Kimura, K.; Villena, J.; et al. Exopolysaccharides From Streptococcus thermophilus ST538 Modulate the Antiviral Innate Immune Response in Porcine Intestinal Epitheliocytes. Front. Microbiol. 2020, 11, 894. [Google Scholar] [CrossRef] [PubMed]
- Hassan, A.N.; Ipsen, R.; Janzen, T.; Qvist, K.B. Microstructure and rheology of yogurt made with cultures differing only in their ability to produce exopolysaccharides. J. Dairy Sci. 2003, 86, 1632–1638. [Google Scholar] [CrossRef]
- Krembs, C.; Eicken, H.; Junge, K.; Deming, J.W. High concentrations of exopolymeric substances in Arctic winter sea ice: Implications for the polar ocean carbon cycle and cryoprotection of diatoms. Deep Sea Res. Pt. I 2002, 49, 2163–2181. [Google Scholar] [CrossRef]
- Shi, Y.; Xiong, Q.; Wang, X.; Li, X.; Yu, C.; Wu, J.; Yi, J.; Zhao, X.; Xu, Y.; Cui, H. Characterization of a novel purified polysaccharide from the flesh of Cipangopaludina chinensis. Carbohydr. Polym. 2016, 136, 875–883. [Google Scholar] [CrossRef]
- Zhou, Y.; Cui, Y.; Qu, X. Exopolysaccharides of lactic acid bacteria: Structure, bioactivity and associations: A review. Carbohydr. Polym. 2019, 207, 317–332. [Google Scholar] [CrossRef] [PubMed]
- Guillon, F.; Champ, M. Structural and physical properties of dietary fibres, and consequences of processing on human physiology. Food Res. Int. 2000, 33, 233–245. [Google Scholar] [CrossRef]
- Wang, Y.; Liu, G.; Liu, R.; Wei, M.; Zhang, J.; Sun, C. EPS364, a Novel Deep-Sea Bacterial Exopolysaccharide, Inhibits Liver Cancer Cell Growth and Adhesion. Mar. Drugs 2021, 19, 171. [Google Scholar] [CrossRef] [PubMed]
- Tang, W.; Zhou, J.; Xu, Q.; Dong, M.; Fan, X.; Rui, X.; Zhang, Q.; Chen, X.; Jiang, M.; Wu, J.; et al. In vitro digestion and fermentation of released exopolysaccharides (r-EPS) from Lactobacillus delbrueckii ssp. bulgaricus SRFM-1. Carbohydr. Polym. 2020, 230, 115593. [Google Scholar] [CrossRef] [PubMed]
- Looijesteijn, P.J.; Trapet, L.; de Vries, E.; Abee, T.; Hugenholtz, J. Physiological function of exopolysaccharides produced by Lactococcus lactis. Int. J. Food Microbiol. 2001, 64, 71–80. [Google Scholar] [CrossRef]
- Vinderola, G.; Perdigon, G.; Duarte, J.; Farnworth, E.; Matar, C. Effects of the oral administration of the exopolysaccharide produced by Lactobacillus kefiranofaciens on the gut mucosal immunity. Cytokine 2006, 36, 254–260. [Google Scholar] [CrossRef] [PubMed]
- Hu, J.-L.; Nie, S.-P.; Min, F.-F.; Xie, M.-Y. Artificial simulated saliva, gastric and intestinal digestion of polysaccharide from the seeds of Plantago asiatica L. Carbohydr. Polym. 2013, 92, 1143–1150. [Google Scholar] [CrossRef] [PubMed]
- Larsen, N.; Cahu, T.B.; Isay Saad, S.M.; Blennow, A.; Jespersen, L. The effect of pectins on survival of probiotic Lactobacillus spp. in gastrointestinal juices is related to their structure and physical properties. Food Microbiol. 2018, 74, 11–20. [Google Scholar] [CrossRef] [PubMed]
- Chen, C.; Zhang, B.; Fu, X.; You, L.-J.; Abbasi, A.M.; Liu, R.H. The digestibility of mulberry fruit polysaccharides and its impact on lipolysis under simulated saliva, gastric and intestinal conditions. Food Hydrocoll. 2016, 58, 171–178. [Google Scholar] [CrossRef]
- Mao, Y.H.; Song, A.X.; Li, L.Q.; Siu, K.C.; Yao, Z.P.; Wu, J.Y. Effects of exopolysaccharide fractions with different molecular weights and compositions on fecal microflora during in vitro fermentation. Int. J. Biol. Macromol. 2020, 144, 76–84. [Google Scholar] [CrossRef]
- Salazar, N.; Gueimonde, M.; Hernandez-Barranco, A.M.; Ruas-Madiedo, P.; de los Reyes-Gavilan, C.G. Exopolysaccharides produced by intestinal Bifidobacterium strains act as fermentable substrates for human intestinal bacteria. Appl. Environ. Microbiol. 2008, 74, 4737–4745. [Google Scholar] [CrossRef] [Green Version]
- Guo, H.; Xue, S.; Nasir, M.; Lv, J.; Gu, J. Role of Bentonite on the Mobility of Antibiotic Resistance Genes, and Microbial Community in Oxytetracycline and Cadmium Contaminated Soil. Front. Microbiol. 2018, 9, 2722. [Google Scholar] [CrossRef] [PubMed]
- Zheng, X.; Qiu, Y.; Zhong, W.; Baxter, S.; Su, M.; Li, Q.; Xie, G.; Ore, B.M.; Qiao, S.; Spencer, M.D.; et al. A targeted metabolomic protocol for short-chain fatty acids and branched-chain amino acids. Metabolomics 2013, 9, 818–827. [Google Scholar] [CrossRef] [PubMed] [Green Version]
- Li, C.C.; Li, W.; Chen, X.H.; Feng, M.Q.; Rui, X.; Jiang, M.; Dong, M.S. Microbiological, physicochemical and rheological properties of fermented soymilk produced with exopolysaccharide (EPS) producing lactic acid bacteria strains. LWT Food Sci Technol. 2014, 57, 477–485. [Google Scholar] [CrossRef]
- Kavita, K.; Mishra, A.; Jha, B. Extracellular polymeric substances from two biofilm forming Vibrio species: Characterization and applications. Carbohydr. Polym. 2013, 94, 882–888. [Google Scholar] [CrossRef] [PubMed]
- Ye, S.; Zhang, M.; Yang, H.; Wang, H.; Xiao, S.; Liu, Y.; Wang, J. Biosorption of Cu2+, Pb2+ and Cr6+ by a novel exopolysaccharide from Arthrobacter ps-5. Carbohydr. Polym. 2014, 101, 50–56. [Google Scholar]
- Matsuzaki, C.; Takagaki, C.; Tomabechi, Y.; Forsberg, L.S.; Heiss, C.; Azadi, P.; Matsumoto, K.; Katoh, T.; Hosomi, K.; Kunisawa, J.; et al. Structural characterization of the immunostimulatory exopolysaccharide produced by Leuconostoc mesenteroides strain NTM048. Carbohydr. Res. 2017, 448, 95–102. [Google Scholar] [CrossRef]
- Shingel, K.I. Determination of structural peculiarities of dexran, pullulan and γ-irradiated pullulan by Fourier-transform IR spectroscopy. Carbohydr. Res. 2002, 337, 1445–1451. [Google Scholar] [CrossRef]
- Wang, X.; Shao, C.; Liu, L.; Guo, X.; Xu, Y.; Lu, X. Optimization, partial characterization and antioxidant activity of an exopolysaccharide from Lactobacillus plantarum KX041. Int. J. Biol. Macromol. 2017, 103, 1173–1184. [Google Scholar] [CrossRef]
- Das, D.; Baruah, R.; Goyal, A. A food additive with prebiotic properties of an alpha-d-glucan from Lactobacillus plantarum DM5. Int. J. Biol. Macromol. 2014, 69, 20–26. [Google Scholar] [CrossRef]
- İspirli, H.; Sagdic, O.; Yılmaz, M.T.; Dertli, E. Physicochemical characterisation of an α-glucan from Lactobacillus reuteri E81 as a potential exopolysaccharide suitable for food applications. Process. Biochem. 2019, 79, 91–96. [Google Scholar] [CrossRef]
- Miao, M.; Ma, Y.; Huang, C.; Jiang, B.; Cui, S.W.; Zhang, T. Physicochemical properties of a water soluble extracellular homopolysaccharide from Lactobacillus reuteri SK24.003. Carbohydr. Polym. 2015, 131, 377–383. [Google Scholar] [CrossRef]
- Ale, E.C.; Perezlindo, M.J.; Pavon, Y.; Peralta, G.H.; Costa, S.; Sabbag, N.; Bergamini, C.; Reinheimer, J.A.; Binetti, A.G. Technological, rheological and sensory characterizations of a yogurt containing an exopolysaccharide extract from Lactobacillus fermentum Lf2, a new food additive. Food Res. Int. 2016, 90, 259–267. [Google Scholar] [CrossRef] [PubMed]
- Galle, S.; Schwab, C.; Arendt, E.K.; Gaenzle, M.G. Structural and rheological characterisation of heteropolysaccharides produced by lactic acid bacteria in wheat and sorghum sourdough. Food Microbiol. 2011, 28, 547–553. [Google Scholar] [CrossRef] [PubMed]
- Mathivanan, K.; Chandirika, J.U.; Vinothkanna, A.; Govindarajan, R.K.; Meng, D.L.; Yin, H.Q. Characterization and Biotechnological Functional Activities of Exopolysaccharides Produced by Lysinibacillus fusiformis KMNTT-10. J. Polym. Environ. 2021, 29, 1742–1751. [Google Scholar] [CrossRef]
- Ikeda, S.; Murayama, D.; Tsurumaki, A.; Sato, S.; Urashima, T.; Fukuda, K. Rheological characteristics and supramolecular structure of the exopolysaccharide produced by Lactobacillus fermentum MTCC 25067. Carbohydr. Polym. 2019, 218, 226–233. [Google Scholar] [CrossRef] [PubMed]
- Chen, L.; Wang, Z.; Zhang, B.; Ge, M.; Ng, H.; Niu, Y.; Liu, L. Production, structure and morphology of exopolysaccharides yielded by submerged fermentation of Antrodia cinnamomea. Carbohydr. Polym. 2019, 205, 271–278. [Google Scholar] [CrossRef] [PubMed]
- Jiang, B.; Tian, L.; Huang, X.; Liu, Z.; Jia, K.; Wei, H.; Tao, X. Characterization and antitumor activity of novel exopolysaccharide APS of Lactobacillus plantarum WLPL09 from human breast milk. Int. J. Biol. Macromol. 2020, 163, 985–995. [Google Scholar] [CrossRef]
- Wang, Z.; Liu, X.; Bao, Y.; Wang, X.; Zhai, J.; Zhan, X.; Zhang, H. Characterization and anti-inflammation of a polysaccharide produced by Chaetomium globosum CGMCC 6882 on LPS-induced RAW 264.7 cells. Carbohydr. Polym. 2021, 251, 117129. [Google Scholar] [CrossRef]
- Frank, D.N.; Robertson, C.E.; Hamm, C.M.; Kpadeh, Z.; Zhang, T.; Chen, H.; Zhu, W.; Sartor, R.B.; Boedeker, E.C.; Harpaz, N.; et al. Disease phenotype and genotype are associated with shifts in intestinal-associated microbiota in inflammatory bowel diseases. Inflamm. Bowel Dis. 2011, 17, 179–184. [Google Scholar] [CrossRef]
- Mukhopadhya, I.; Hansen, R.; El-Omar, E.M.; Hold, G.L. IBD—What role do Proteobacteria play? Nat. Rev. Gastroenterol. Hepatol. 2012, 9, 219–230. [Google Scholar] [CrossRef]
- Yan, S.; Yang, B.; Zhao, J.; Zhao, J.; Stanton, C.; Ross, R.P.; Zhang, H.; Chen, W. A ropy exopolysaccharide producing strain Bifidobacterium longum subsp. longum YS108R alleviates DSS-induced colitis by maintenance of the mucosal barrier and gut microbiota modulation. Food Funct. 2019, 10, 1595–1608. [Google Scholar] [CrossRef]
- Wu, F.; Guo, X.; Zhang, J.; Zhang, M.; Ou, Z.; Peng, Y. Phascolarctobacterium faecium abundant colonization in human gastrointestinal tract. Exp. Ther. Med. 2017, 14, 3122–3126. [Google Scholar] [CrossRef] [PubMed] [Green Version]
- Sokol, H.; Pigneur, B.; Watterlot, L.; Lakhdari, O.; Bermudez-Humaran, L.G.; Gratadoux, J.-J.; Blugeon, S.; Bridonneau, C.; Furet, J.-P.; Corthier, G.; et al. Faecalibacterium prausnitzii is an anti-inflammatory commensal bacterium identified by gut microbiota analysis of Crohn disease patients. Proc. Natl. Acad. Sci. USA 2008, 105, 16731–16736. [Google Scholar] [CrossRef] [PubMed] [Green Version]
- Reichardt, N.; Duncan, S.H.; Young, P.; Belenguer, A.; Leitch, C.M.; Scott, K.P.; Flint, H.J.; Louis, P. Erratum: Phylogenetic distribution of three pathways for propionate production within the human gut microbiota. ISME J. 2014, 8, 1323–1335. [Google Scholar] [CrossRef] [PubMed] [Green Version]
- Louis, P.; Flint, H.J. Formation of propionate and butyrate by the human colonic microbiota. Environ. Microbiol. 2017, 19, 29–41. [Google Scholar] [CrossRef] [PubMed] [Green Version]
- Guarner, F.; Khan, A.G.; Garisch, J.; Eliakim, R.; Szajewska, H.J.S.A.G.R. World Gastroenterology Organisation practice guideline: Probiotics and prebiotics. Arab J. Gastroenterol. 2009, 10, 33–42. [Google Scholar]
- Li, A.L.; Ni, W.W.; Li, Y.; Zhang, X.; Yang, J.J.; Ma, X.Y.; Jia, X.D.; Li, C.; Liu, L.B. Effect of 2′-fucosyllactose supplementation on intestinal flora in mice with intestinal inflammatory diseases. Int. Dairy J. 2020, 110, 104797. [Google Scholar] [CrossRef]
- Peng, M.; Biswas, D. Short chain and polyunsaturated fatty acids in host gut health and foodborne bacterial pathogen inhibition. Crit. Rev. Food Sci. 2017, 57, 3987–4002. [Google Scholar] [CrossRef] [PubMed]
- Holscher, H.D.; Bauer, L.L.; Gourineni, V.; Pelkman, C.L.; Fahey, G.C., Jr.; Swanson, K.S. Agave Inulin Supplementation Affects the Fecal Microbiota of Healthy Adults Participating in a Randomized, Double-Blind, Placebo-Controlled, Crossover Trial. J. Nutr. 2015, 145, 2025–2032. [Google Scholar] [CrossRef] [PubMed] [Green Version]
- Li, Z.; Yi, C.X.; Katiraei, S.; Kooijman, S.; Zhou, E.; Chung, C.K.; Gao, Y.; van den Heuvel, J.K.; Meijer, O.C.; Berbee, J.F.P.; et al. Butyrate reduces appetite and activates brown adipose tissue via the gut-brain neural circuit. Gut 2018, 67, 1269–1279. [Google Scholar] [CrossRef] [Green Version]
Publisher’s Note: MDPI stays neutral with regard to jurisdictional claims in published maps and institutional affiliations. |
© 2022 by the authors. Licensee MDPI, Basel, Switzerland. This article is an open access article distributed under the terms and conditions of the Creative Commons Attribution (CC BY) license (https://creativecommons.org/licenses/by/4.0/).
Share and Cite
Yao, M.; Zhang, M.; Lai, T.; Yang, Z. Characterization and In Vitro Fecal Microbiota Regulatory Activity of a Low-Molecular-Weight Exopolysaccharide Produced by Lactiplantibacillus plantarum NMGL2. Foods 2022, 11, 393. https://doi.org/10.3390/foods11030393
Yao M, Zhang M, Lai T, Yang Z. Characterization and In Vitro Fecal Microbiota Regulatory Activity of a Low-Molecular-Weight Exopolysaccharide Produced by Lactiplantibacillus plantarum NMGL2. Foods. 2022; 11(3):393. https://doi.org/10.3390/foods11030393
Chicago/Turabian StyleYao, Mengke, Min Zhang, Tiantian Lai, and Zhennai Yang. 2022. "Characterization and In Vitro Fecal Microbiota Regulatory Activity of a Low-Molecular-Weight Exopolysaccharide Produced by Lactiplantibacillus plantarum NMGL2" Foods 11, no. 3: 393. https://doi.org/10.3390/foods11030393
APA StyleYao, M., Zhang, M., Lai, T., & Yang, Z. (2022). Characterization and In Vitro Fecal Microbiota Regulatory Activity of a Low-Molecular-Weight Exopolysaccharide Produced by Lactiplantibacillus plantarum NMGL2. Foods, 11(3), 393. https://doi.org/10.3390/foods11030393