Article

Effect of Extracts Derived from Brown Algae (Sargassum horneri) on the Gel Property and Moisture Distribution of Hairtail Surimi Gel (Trichiurus haumela)

1
College of Food Science and Technology, Shanghai Ocean University, Shanghai 201306, China
2
Shanghai Engineering Research Center of Aquatic-Product Processing & Preservation, Shanghai 201306, China
*
Author to whom correspondence should be addressed.
Foods 2022, 11(3), 411; https://doi.org/10.3390/foods11030411
Submission received: 13 January 2022 / Revised: 27 January 2022 / Accepted: 28 January 2022 / Published: 30 January 2022
(This article belongs to the Section Food Physics and (Bio)Chemistry)

Abstract

:
The cross-linking degree between myosin affected the surimi gel properties in the hairtail. In this study, the effects of phlorotannin extracts (PE) derived from brown algae (Sargassum horneri) with different concentrations (0.05%, 0.3%, 1% w/w) on the hairtail surimi gel-forming properties were investigated in comparison with the commercial phloroglucinol (PG). The breaking forces of surimi gel with 1% PE and 0.05% PG were increased by 14.80% and 2.73%, respectively. The increase in deformation was 9.66% with 1% PE compared with the control added with water, but there was no increase in deformation of surimi gel with 0.05% PG. The improved surimi gel structure with PE as a bridge for the three-dimensional network forming of protein was observed in the microstructure. Moreover, PE could significantly shorten the water relaxation time (p < 0.05), reduce free water content (p < 0.05), and increase the hydrogen proton density of the hairtail surimi according to the results of NMR, dielectric properties, and MRI map, respectively. Our findings suggest that the extracts from the brown algae could be a potential economical gel structure enhancer to improve the myosin network.

1. Introduction

Surimi, a Japanese word for fish mince, has been accepted as a popular raw material for aquatic food. Gel forming was mainly due to the irreversible denaturation of protein resulting in the three-dimensional gel network, in which myosin was essential [1]. Surimi gel was successively produced by the steps of myosin dissolution and crosslink formation. Generally, due to limited resources and economic cost, the fish species with dark flesh or lean fish were increasingly used in producing surimi products, increasing the chance for undesirable fish species to become a popular dish. However, some fish species are unsuitable for the surimi product due to the lack of gelation ability. Species such as hairtail (Trichiurus haumela), with high fishing catches in China, was an easy-to-fish and low-cost species, but the low strength of the hairtail surimi gel had a negative impact on product development. As traditional processing of surimi cannot fully promote the myosin unfolding [2], the use of additives to enhance gel properties has been a hot topic in recent years. Some researchers found that gel property intensifiers such as yeast β-glucan [3], oleogels [4], and microbial transglutaminase [5] could prevent surimi gel weakening. Nonetheless, these additives may cause undesirable sensory properties of surimi. Therefore, the search for green and efficient natural food additives to improve the gelation properties of surimi is a current research direction.
Polyphenols, mainly hydroxylated cinnamic acids (e.g., caffeic acid, chlorogenic acid) and flavonols, are compounds found in plant foods that have potential health-promoting effects [6]. Generally, polyphenols are oxidized into quinone during the heating progress and a dimer of which would be formed in the meantime, resulting in a cross-link with an amino acid side chain by C-S or C-N bond formation [7], which affects the gel property during surimi production. Several attempts have been made to study the effects of plant polyphenols on surimi gel properties [8,9]. The effect of phenolic compounds in fast-growing algae on the gel properties of surimi gel has attracted considerable attention. The phenolic compound in brown algae is mainly phlorotannins, a polymer of phloroglucinol [10]. For example, phlorotannins were exclusively possessed in brown algae, with content more than 20% of the dry weight [11]. Jiang et al. illustrated that the phlorotannins from sporophyll extracts worked on myosin under UVA irradiation to increase the crosslinking [12]. Other studies reported that phenolic compounds of seaweed showed no negative affection for sensory properties while increasing the gel property [13,14].
However, these studies only preliminarily explored the effects of algal phenolic compounds on the basic properties of surimi gel, and there is a lack of studies on the gel properties and water retention. Therefore, the enhancement effect of phlorotannins on the surimi gel is worthy of further exploration. In this context, this research aimed to investigate the potential effects of phlorotannins extracted from brown algae (Sargassum horneri) on the gel properties and moisture distributions of treated hairtail surimi gel (Trichiurus haumela).

2. Materials and Methods

2.1. Materials

The brown algae (Sargassum horneri) were provided by the College of Fisheries and Life Science, Shanghai Ocean University. The hairtail surimi (Trichiurus haumela) was purchased from Shanghai Yiyang Yihua Aquatic Products Co., Ltd, Yiyang, China. Phloroglucinol (PG) was of spectral purity grade and the chemicals noted below were of analytical purity grade, purchased from Sinopharm Chemical Reagent Co., Ltd, Shanghai, China.

2.2. Preparation of Phlorotannins Extracts

Phlorotannins extracts (PE) was prepared according to the method described in Shitole [13]. Fresh brown seaweed (Sargassum horneri) was washed with tap water, followed by draining with gauze, and then dried by an electric thermostatic drying oven at 55 °C until the moisture content was at 2%. The dried seaweed was ground into powder and then sieved using a screen with a diameter of 0.125 mm. Brown seaweed extracts were obtained according to the ultrasound-assisted method of Wang et al. [15]. The powder (1 g) was mixed with 55% ethanol at the ratio of 42:1 (v/w) and then extracted by ultrasonic extraction for 58 min. The precipitate was collected to repeat the process two more times. The supernatant (100 mL) was fractionated with ethyl acetate (1:1, v/v) seven times, and the fractions were collected and desiccated with rotary evaporation (Numeric Control Ultrasonic Cleaning Machine, SB4200DT, NingBo XinZhi Biology Science Co., Ltd., Ningbo, China). The pellet was dissolved into ethanol with different concentrations for further use.

2.3. Phlorotannins Extracts Identification

PE was identified by liquid chromatography-time of flight-mass spectrometry (LC-TOF-MS) (1290LC-6224, Agilent Technologies, Inc., Beijing, China) according to the method in Ferreres [16] with some modifications.

2.3.1. Chromatographic Conditions

The column used was a YMC-Pack ODS-AQ C18 (75 × 4.6 mm, 3 μm). The column temperature was set at 20 °C. Mobile phase: 0.1% formic acid methanol was used as phase A and 0. 1% formic acid acetonitrile as phase B. The elution program was set to gradient elution: 0–5 min: 0% B, 15 min: 30% B, 17.5–20 min: 80% B, 22.5–26 min: 0% B. The flow rate was 0.3 mL/min, the injection volume was 5 μL, and the injection temperature was 4 °C. The DAD wavelength scanning range was 200–400 nm, and the UV detection wavelength was 280 nm.

2.3.2. Mass Spectrometry Conditions

The mass spectrometry was performed at a flow rate of 8.0 L/min, a drying gas temperature of 350 °C, an atomization gas pressure of 40 psig, a lysis voltage of 175 V, and a capillary voltage of 4000 V. The mass spectra were scanned in the range of m/z 100~1800.
Mass calibration: The reference solution was introduced into the ion source simultaneously with the sample through the reference Nebulizer for real-time reference. The ions 322.048132, 622.028960, and 922.009798 were selected in positive ion mode.

2.4. Preparation of Surimi Gel

The purchased surimi was cut into small pieces (5 cm × 5 cm) after thawing in a 4 °C refrigerator until the core temperature reached 0–2 °C. It was then chopped under 10 °C for 15 min. The final moisture content of surimi was adjusted to 78.30% by adding cold distilled water. Then PE and PG (5.00 mL) at various concentrations (0.05%, 0.3%, and 1%) dissolved into 5% ethanol were added, and the distilled water was used as the blank control. Next, the homogeneous surimi sol was obtained after chopping for 3 min under 4 °C. To prepare the surimi gel, the sol with PE and PG were stuffed into a 20 mm diameter casing and both sides were sealed tightly. It was then heated at 35 °C for 3 h and subsequently incubated at 90 °C for 30 min in a water bath. All heated surimi gel was rapidly cooled in ice water and stored at 4 °C for analysis. PG was used as a positive control.

2.5. Texture Analysis of Surimi Gel

The gel strength of surimi gel was carried out using a texture analyzer (TA.XT Plus, Stable Micro System, Surrey, UK) as described by Julavittayanukul [17] with slight modifications. The surimi gel was cut into a cylinder (20 × 30 mm) after equilibrating at room temperature before analysis. The aspherical plunger (P/5S) was pressed into the surimi gel surface perpendicularly with a constant force (10 g) and a stable rate (1 mm/s) at a certain distance from the surface (20 mm). The quality of the gels was assessed by measuring their breaking force (g) and deformation (cm). Gel strength was calculated according to the equation:
Gel strength = breaking force (g) × deformation (cm)

2.6. Scanning Electron Microscopy (SEM) of Surimi Gel

The microstructure of prepared surimi gel was measured by SEM according to the method in Oujifard [18] with minor modifications. Briefly, the samples (3 mm × 3 mm × 2 mm) were fixed with glutaraldehyde at 2.5% (v/v) and incubated for 24 h at room temperature, followed by filtration. The precipitates were rinsed with 0.2 M phosphate buffer (pH 7.2) three times. The samples were gradient eluted with ethanol at different concentrations of 50%, 60%, 70%, 80%, and 90% for 20 min, and then washed with 100% ethanol for 30 min (three times). The dehydrated samples were mounted on a conduct electric stub in the sample treatment stage after vacuum freeze drying, then sputter-coated with gold. The microstructure of prepared surimi gel was available for observing and recording under scanning electron microscopy.

2.7. Dielectric Properties Determination of Surimi Gel

The dielectric constant and dielectric loss factor of each surimi gel sample were determined using the coaxial probe coupled with a PNA-L Network Analyzer (N5230C, Agilent Technologies Inc., Santa Clara, CA, USA), according to the method in Zhang et al. [19], with minor modifications. To maintain stability and minimize the error, the measurement system was kept in a stable environment for 2 h before calibration and measurement, followed by adjustment under three different types of loads: open-air, short circuit, and 25 °C deionized water. In the present study, a frequency range of 300–4500 MHz was used to determine the dielectric properties of control and treated samples under 20 °C. Each replicate was determined three times to obtain the mean value.

2.8. Nuclear Magnetic Resonance (NMR) Analysis of Surimi Gel

The water state of the treated surimi gel samples could be observed by determining spin-spin water relaxation time (T2) with carr-purcell-meiboom-gill (CPMG) pulse sequence using low-field NMR relaxation measurement (MesoMR 23-060H.I, Niumag Electric Corporation, Shanghai, China). Surimi gel was prepared in a cylinder with a diameter of 20 mm and a height of 30 mm at room temperature, and the gel with PG was prepared in a square container with a length of 20 mm and a height of 30 mm. The spin-spin relaxation time (T2) was measured via the CPMG pulse sequence. Parameter settings: SFI = 2 MHz, P1 = 17 μs, SW = 100.00 kHz, RFD = 0.08 ms, NS = 16, P2 = 33 μs, TW = 2500 ms, TE = 0.60 ms, and NECH = 3000.

2.9. Magnetic Resonance Imaging (MRI) Analysis of Surimi Gel

Proton density-weighted images were acquired on a MesoMR23-060H-I NMR coopered with an imaging system (Niumag Electric Corporation, Shanghai, China). The test samples were placed in the center of the radio frequency coil at the center of the permanent magnetic field, and the hydrogen proton density image of the surimi gel was obtained by multiple spin echo (MSE) imaging sequences. According to the previous measurement of T2 relaxation time with the CPMG sequence, the repetition time was 500 ms, the spin-echo time was 20 ms, and the center frequency was 21 MHz.

2.10. Statistical Analysis

SPSS 22 and Origin 2017 were used to analyze experimental data. All experiments were performed three times with the hairtail surimi gel of the same batch. All obtained data were reported in the form of mean ± SD and differences were considered significant at p < 0.05. One-way analysis of variance (ANOVA) was used and mean comparison was carried out using Tukey’s multiple range test. The optimization of PE extraction was based on the Box–Behnken (BBD) method.

3. Results and Discussion

3.1. PE Identification

The brown algae extract was identified using LC-TOF-MS, and the composition is shown in Table 1.
From Table 1, the average molecular weights of Nos. 78 and 96 are 250.2258 and 374.3036, respectively, with theoretical values of 250.2042 and 374.2984 and molecular formulae of C12H10O6 and C18H14O9, respectively, which are likely to be dimers and trimers of phloroglucinol (PG).
The molecular ion peak of compound No. 96 in positive ion mode with a retention time of 14.8 min was m/z 375 [M+H]+ with an average molecular weight of 374.3036; the theoretical value was 374.2984 and the molecular formula was C18H14O9. The molecular ion was cleaved by electrospray ionization to fragment peaks with m/z 357 and 232, where the removal of water resulted in the characteristic fragment m/z 357 [M+H-H2O]+, and the removal of phloroglucinol and hydroxyl oxygen resulted in the ionic fragment m/z 232 [M+H-O-C6H6O3]+. The results indicated that this compound was a trimer of phloroglucinol linked by C-O-C oxidized phenols.
The extraction rate and purity of brown algae extract are shown in Table 2.
The extraction rate of PE was 25.16% with the optimized ultrasound-assisted extraction method, which showed a significant increase over microwave extraction (19.96%) and Soxhlet extraction (13.13%) [15]. The phlorotannin were only 6.46% of the dry matter in this study, which was lower than that of green algae. However, the high purity of PE (73.85%) indicated that the major components of PE was phlorotannin, which mainly contributed to the enhanced protein cross-linking in surimi gel.

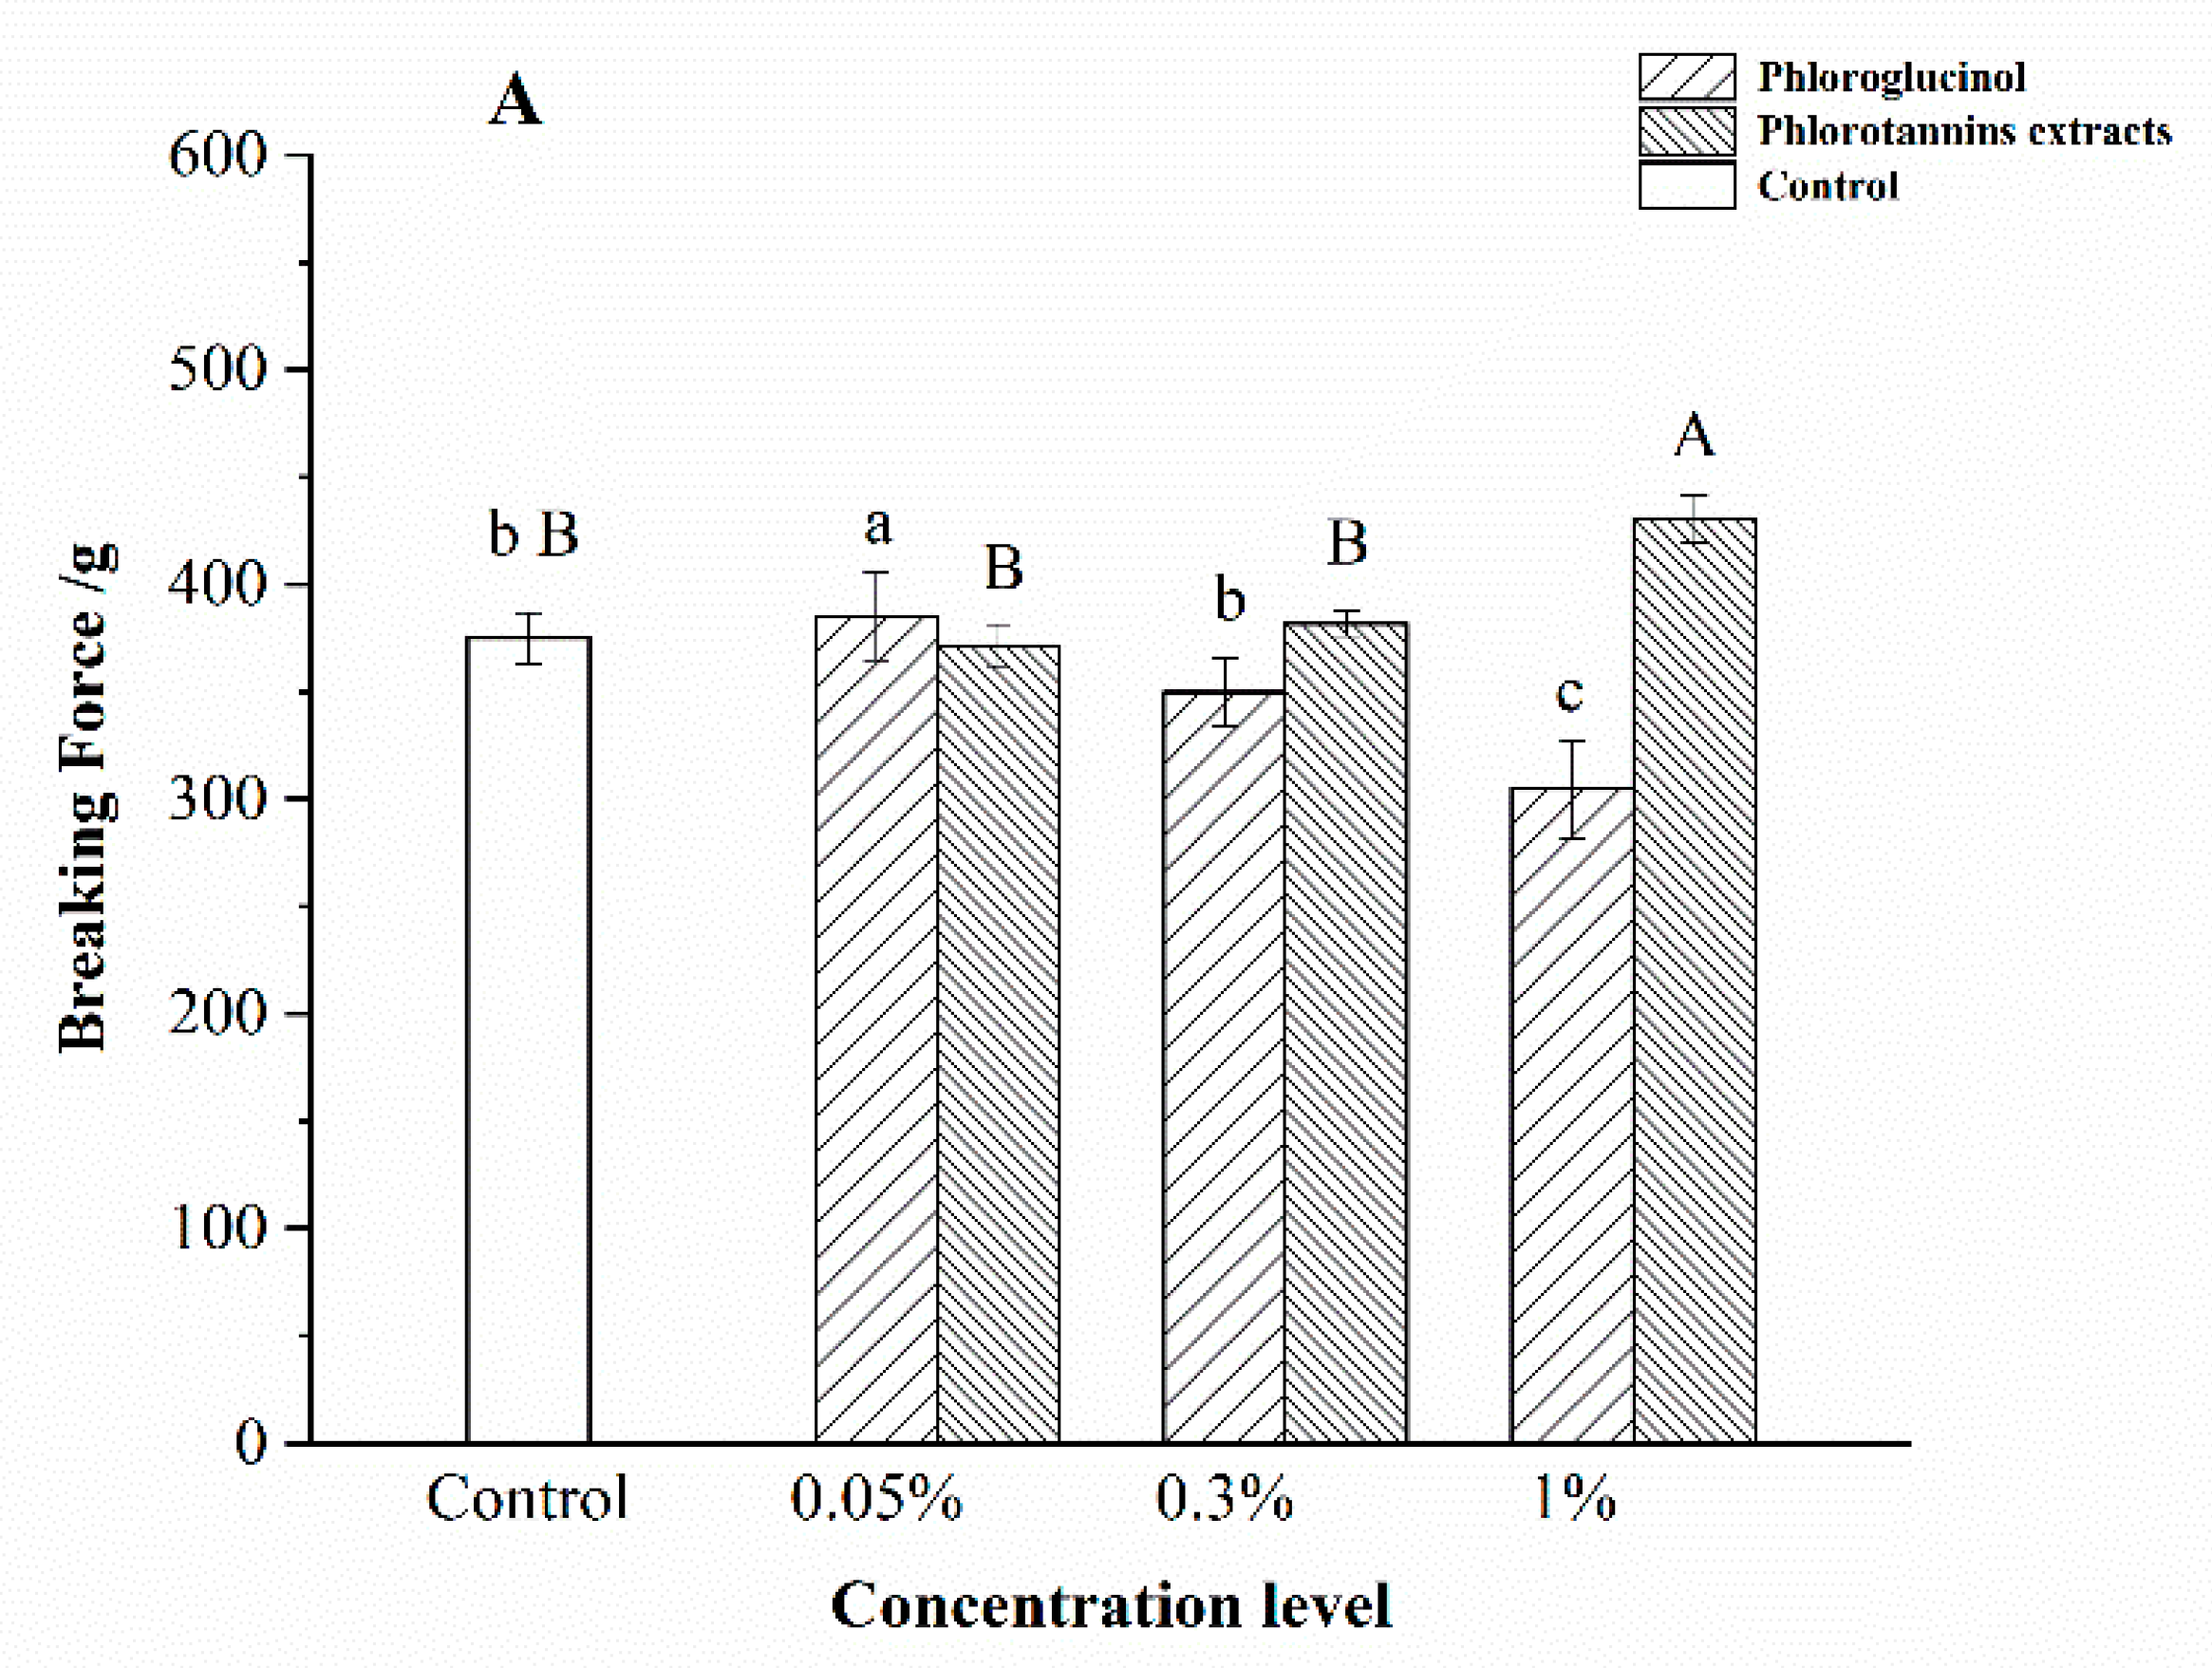
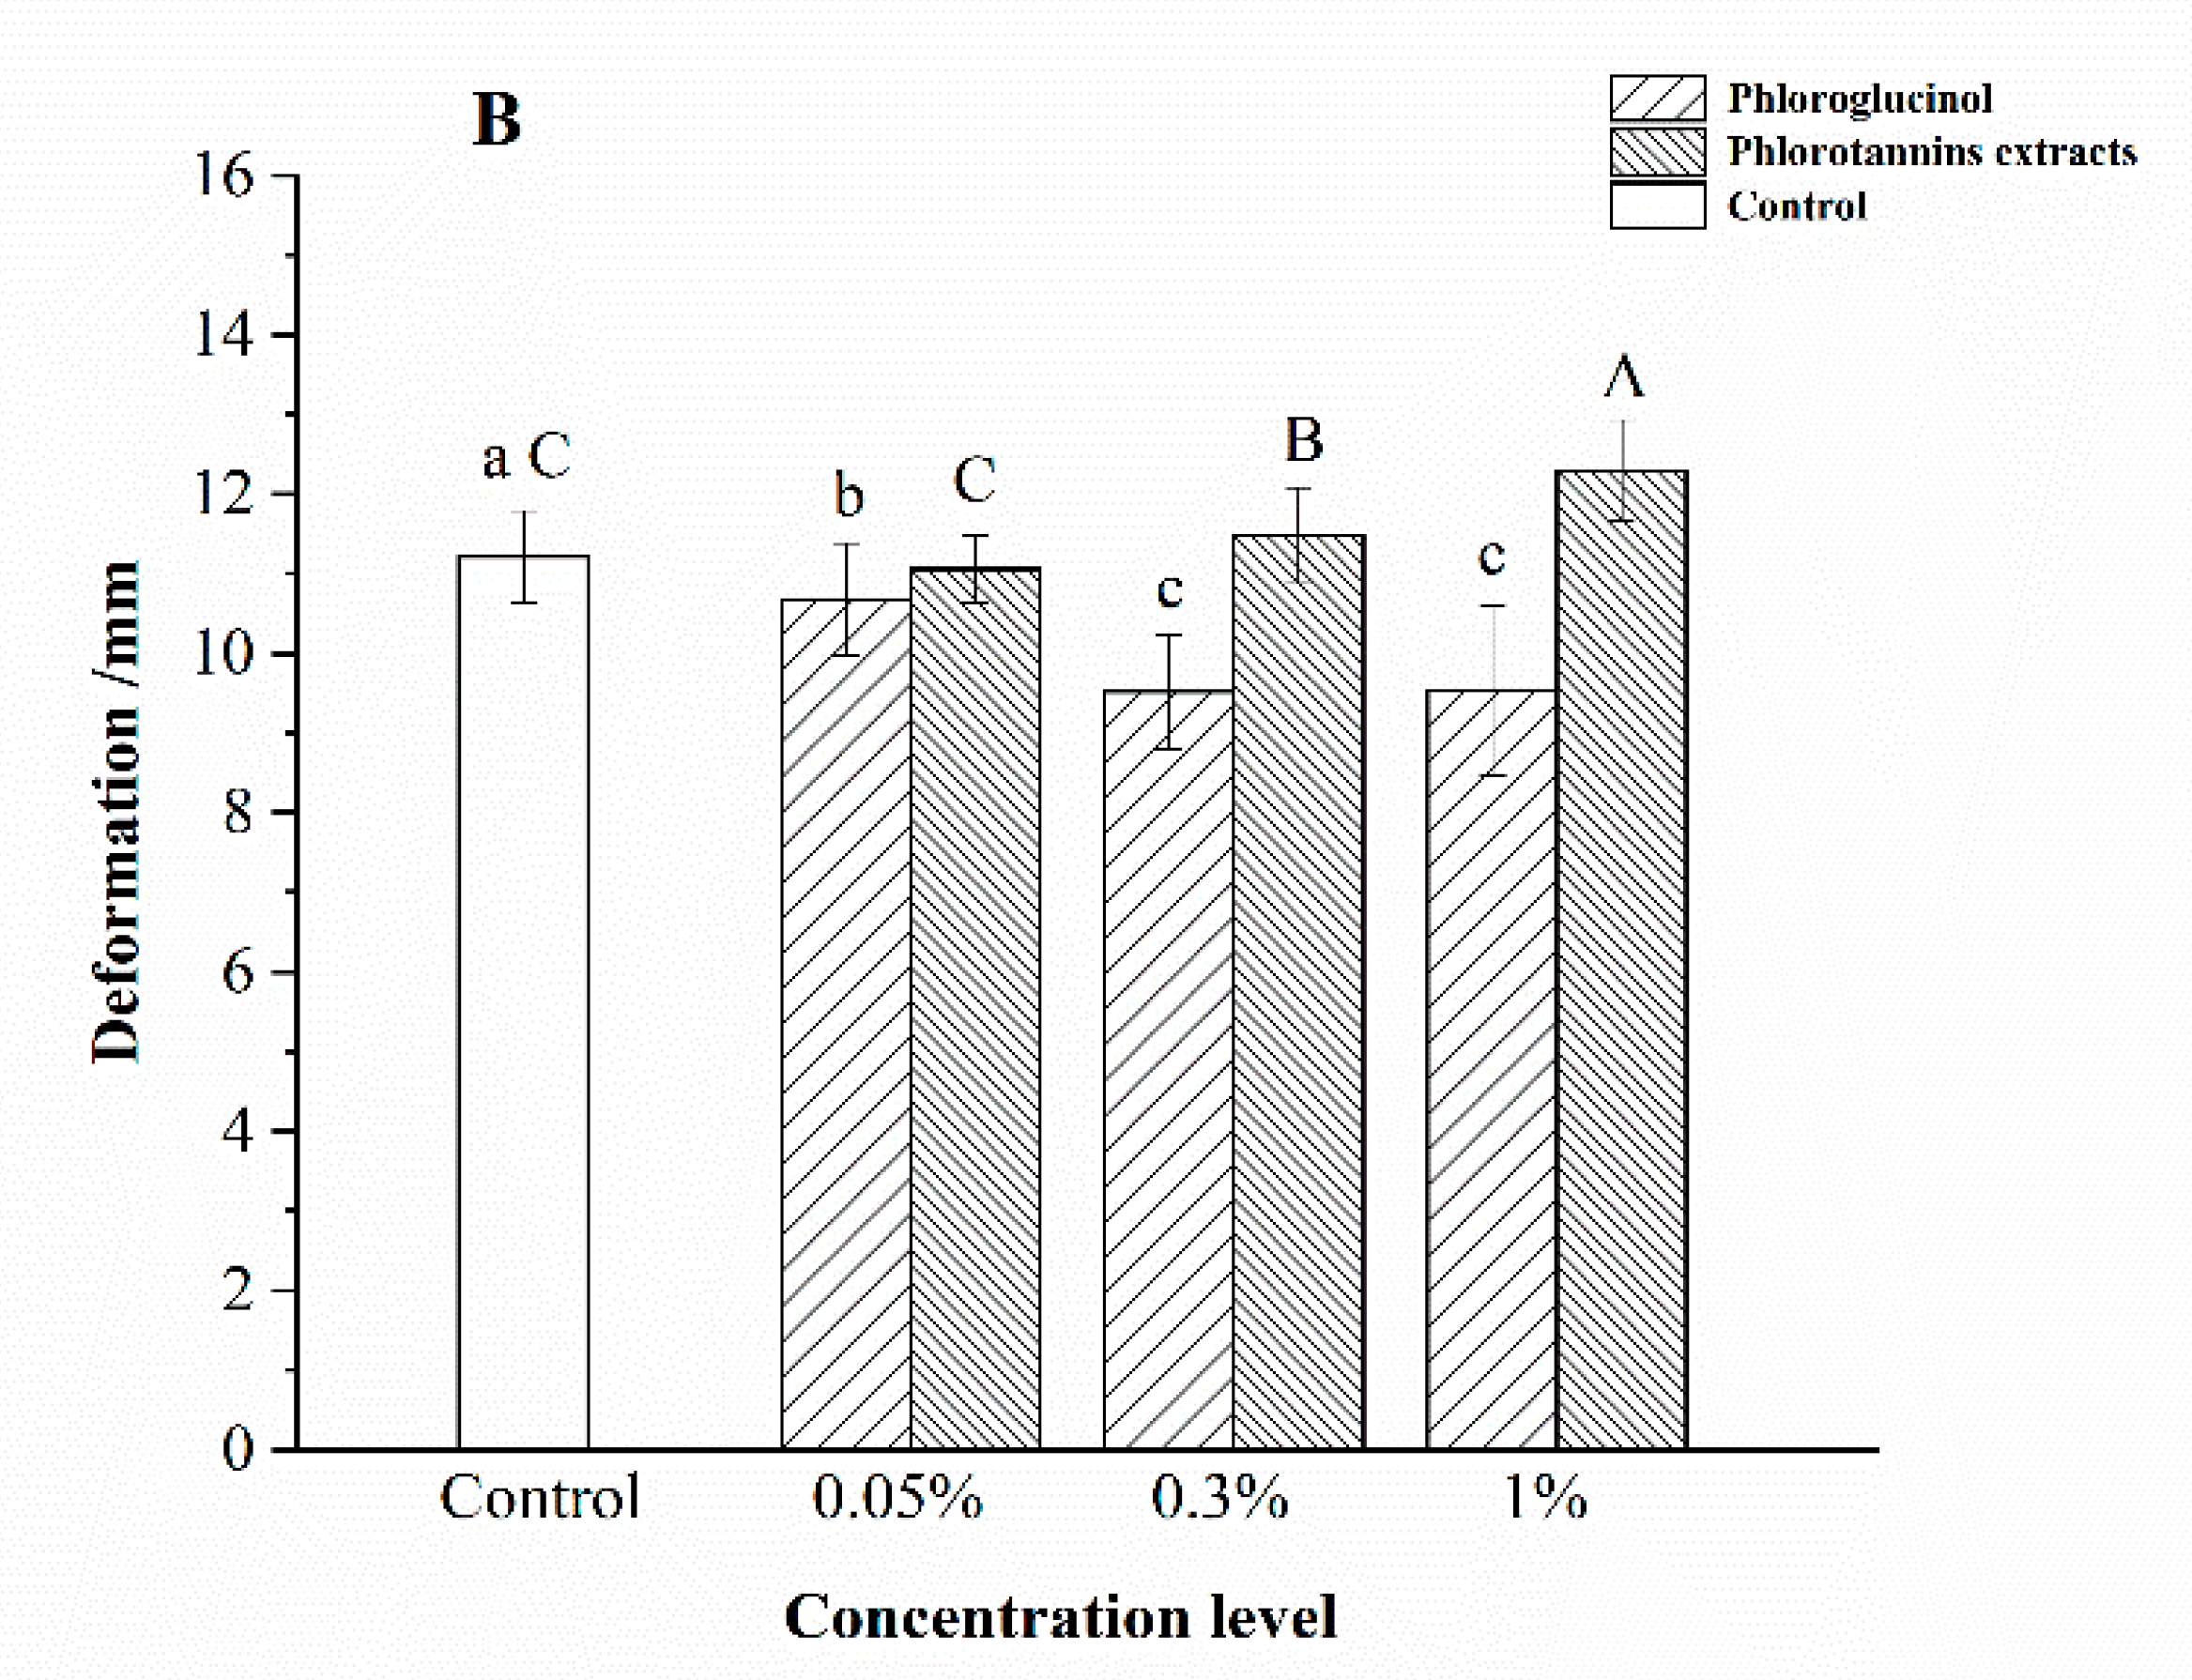
3.2. Gel Property of Surimi Gel

PE and PG were dissolved in 5% ethanol and the effects of the added solvent on surimi gel were investigated. Our results found that the gel strength of surimi gel with 5% ethanol (3766.60 ± 261.60 g·cm) had no significant difference compared with the control sample (3623.80 ± 86.10 g·cm) (p > 0.05), suggesting that the 5% ethanol had little effect on surimi gel strength.
The effects of different concentrations of PG and PE on the gel properties of hairtail surimi gel are shown in Figure 1.
The breaking force of surimi gel treated by PE showed a concentration dependence (Figure 1A). Compared with the control, the breaking force of surimi gel treated with 1% PE was improved significantly (p < 0.05). The highest breaking force of PG-treated samples was observed in the 0.05% PG-treated one, significantly higher than that of the control (p < 0.05). However, 1% PG decreased the breaking force significantly (p < 0.05), with an 18.73% decrease (Figure 1B). In addition, the deformation of surimi gel increased with the increase of PE concentration. Compared with the control group, the deformation of samples with 1% PE significantly increased (p < 0.05), whereas the deformation of samples with 1% PG decreased by 12.94%. Theoretically, the gel was formed due to the phenolic compounds forming a bridge between the myosin cross-linking [12]. In contrast, the phenolic compounds were oxidized into quinones under high temperature [20], followed by inducing the protein unfolding to provide more hydrophobic binding sites for the quinones [21]. Moreover, quinone was an electrophile intermediate that underwent a secondary addition reaction once attacked by a nucleophilic molecule [20], leading to the formation of cross-linked protein polymers. Therefore, 1% PE and 0.05% PG could form a rigid molecular structure with the unfolded myosin, which enhanced the surimi gel property.
Notably, the increase in the dosage of PE and PG showed opposite effects on the gel properties, which suggested that PG and PE might interact with the myosin of surimi gel in different ways. There are two distinguished complexation mechanisms for additives and myosin: high-dosage dependence monodentate and low-dosage dependence multidentate [22,23]. According to the results in Figure 1, it is suggested that PE was monodentate. Phenolic compounds with a monodentate complexation mechanism showed significant enhancement of the cross-linking between proteins and phenolic compounds with high concentrations [22,23]. In contrast, the multidentate mechanism required multiple binding sites in phenolic compounds. In the present study, higher deformation and breaking forces of surimi gel were observed at a lower level of PG (0.05%), indicating that PG was a multidentate mechanism on myosin. At the same time, the self-aggregation of phenolic compounds with increasing concentration was formed [20], and the hydroxyl group of bonding amino acid residues was decreased, which negatively affected the surimi gel properties. Balange et al. reported that the increased dosage of oxidized phenolics decreased the gel strength of mackerel surimi gel, supporting the results of the present study [24].

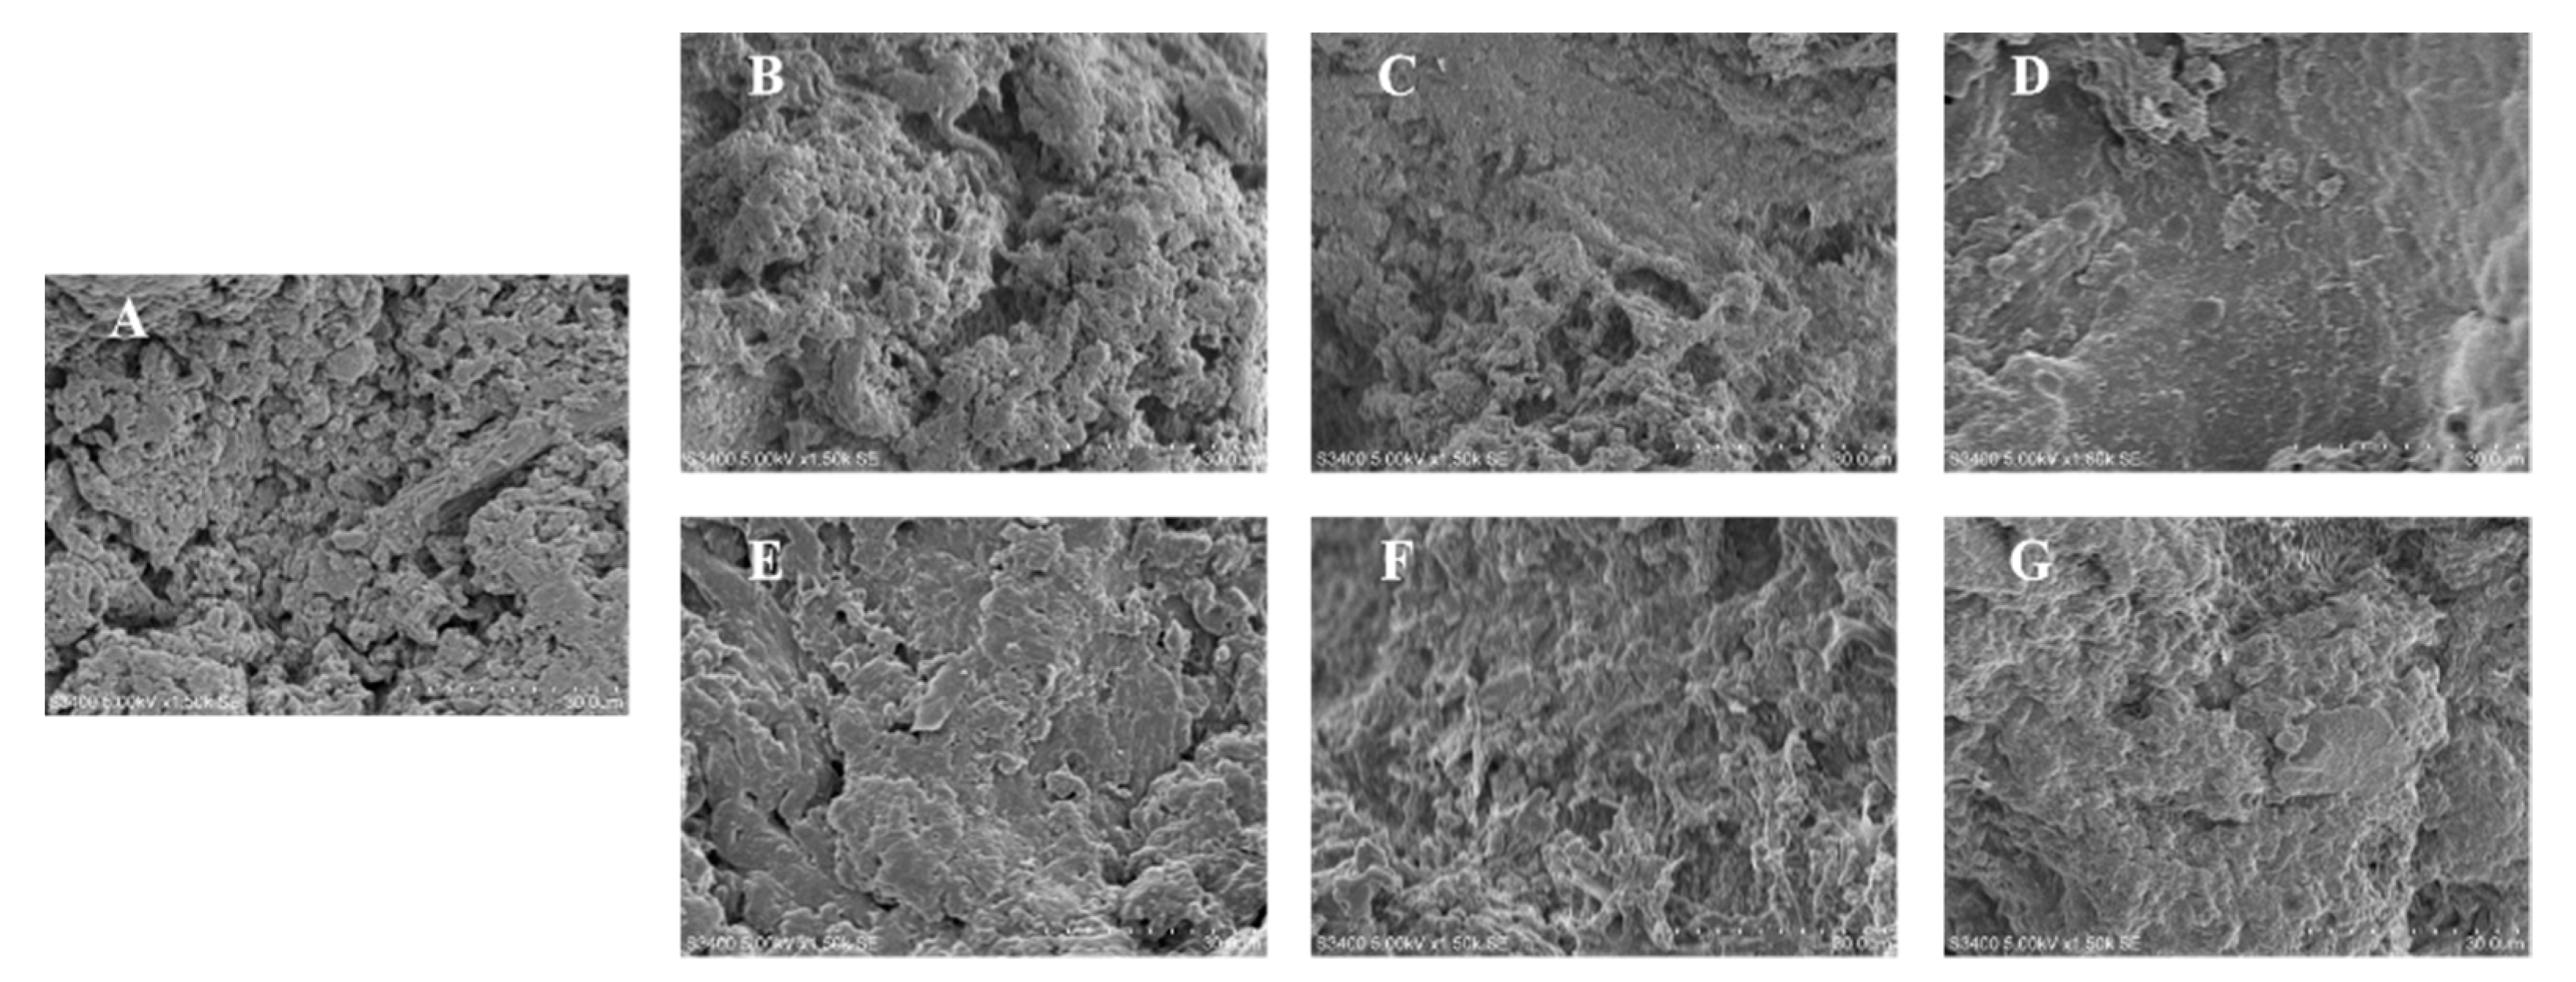
3.3. The Microstructure of Surimi Gels with Phlorotannins Extraction and Phloroglucinol

The microstructure is important in the surimi gel network, which can be observed by SEM [25]. The SEM can reflect the relationship and the combination degree of protein-protein and protein-water [26]. The microstructures of hairtail surimi gel of different concentrations of phlorotannins extracts and phloroglucinol are illustrated in Figure 2.
Surimi gel samples with PE (Figure 2E–G) had different results from samples with PG. Surimi gel surface became coarser with increasing concentrations of PE. As shown in Figure 2G, the cross-linking of the protein fiber was the most compact with 1% PE, compared with the control sample. The results are similar to the report of Balange [27] that the tannins could develop the surimi gel with increasing dosage. Figure 2B shows that the cross-linking formed between myosin and 0.05% PG. Maqsood [28] suggested that the forming of cross-linking between PG and surimi gel was attributed to the covalent binding. However, Figure 2C illustrates that the bigger surface cavities appeared with the 0.3% PG, and the protein fiber almost disappeared in the 1% PG treated sample (Figure 2D). It was inferred that the PG aggregation was the major factor to inhibit the protein linkage and the protein-phenolic covalent-binding forming [29]. The results of Figure 2 also reveal that PE and PG had different connected approaches to the surimi gel structure. PE could induce the surimi gel surface compactness with the increasing dosage, and its effect was better than the PG treated sample in optimal concentration. The developed structure was attributed to a great number of binding sites provided by PE under the monodentate reaction mechanism, which was consistent with the results of gel properties of hairtail surimi gel shown in Figure 1.

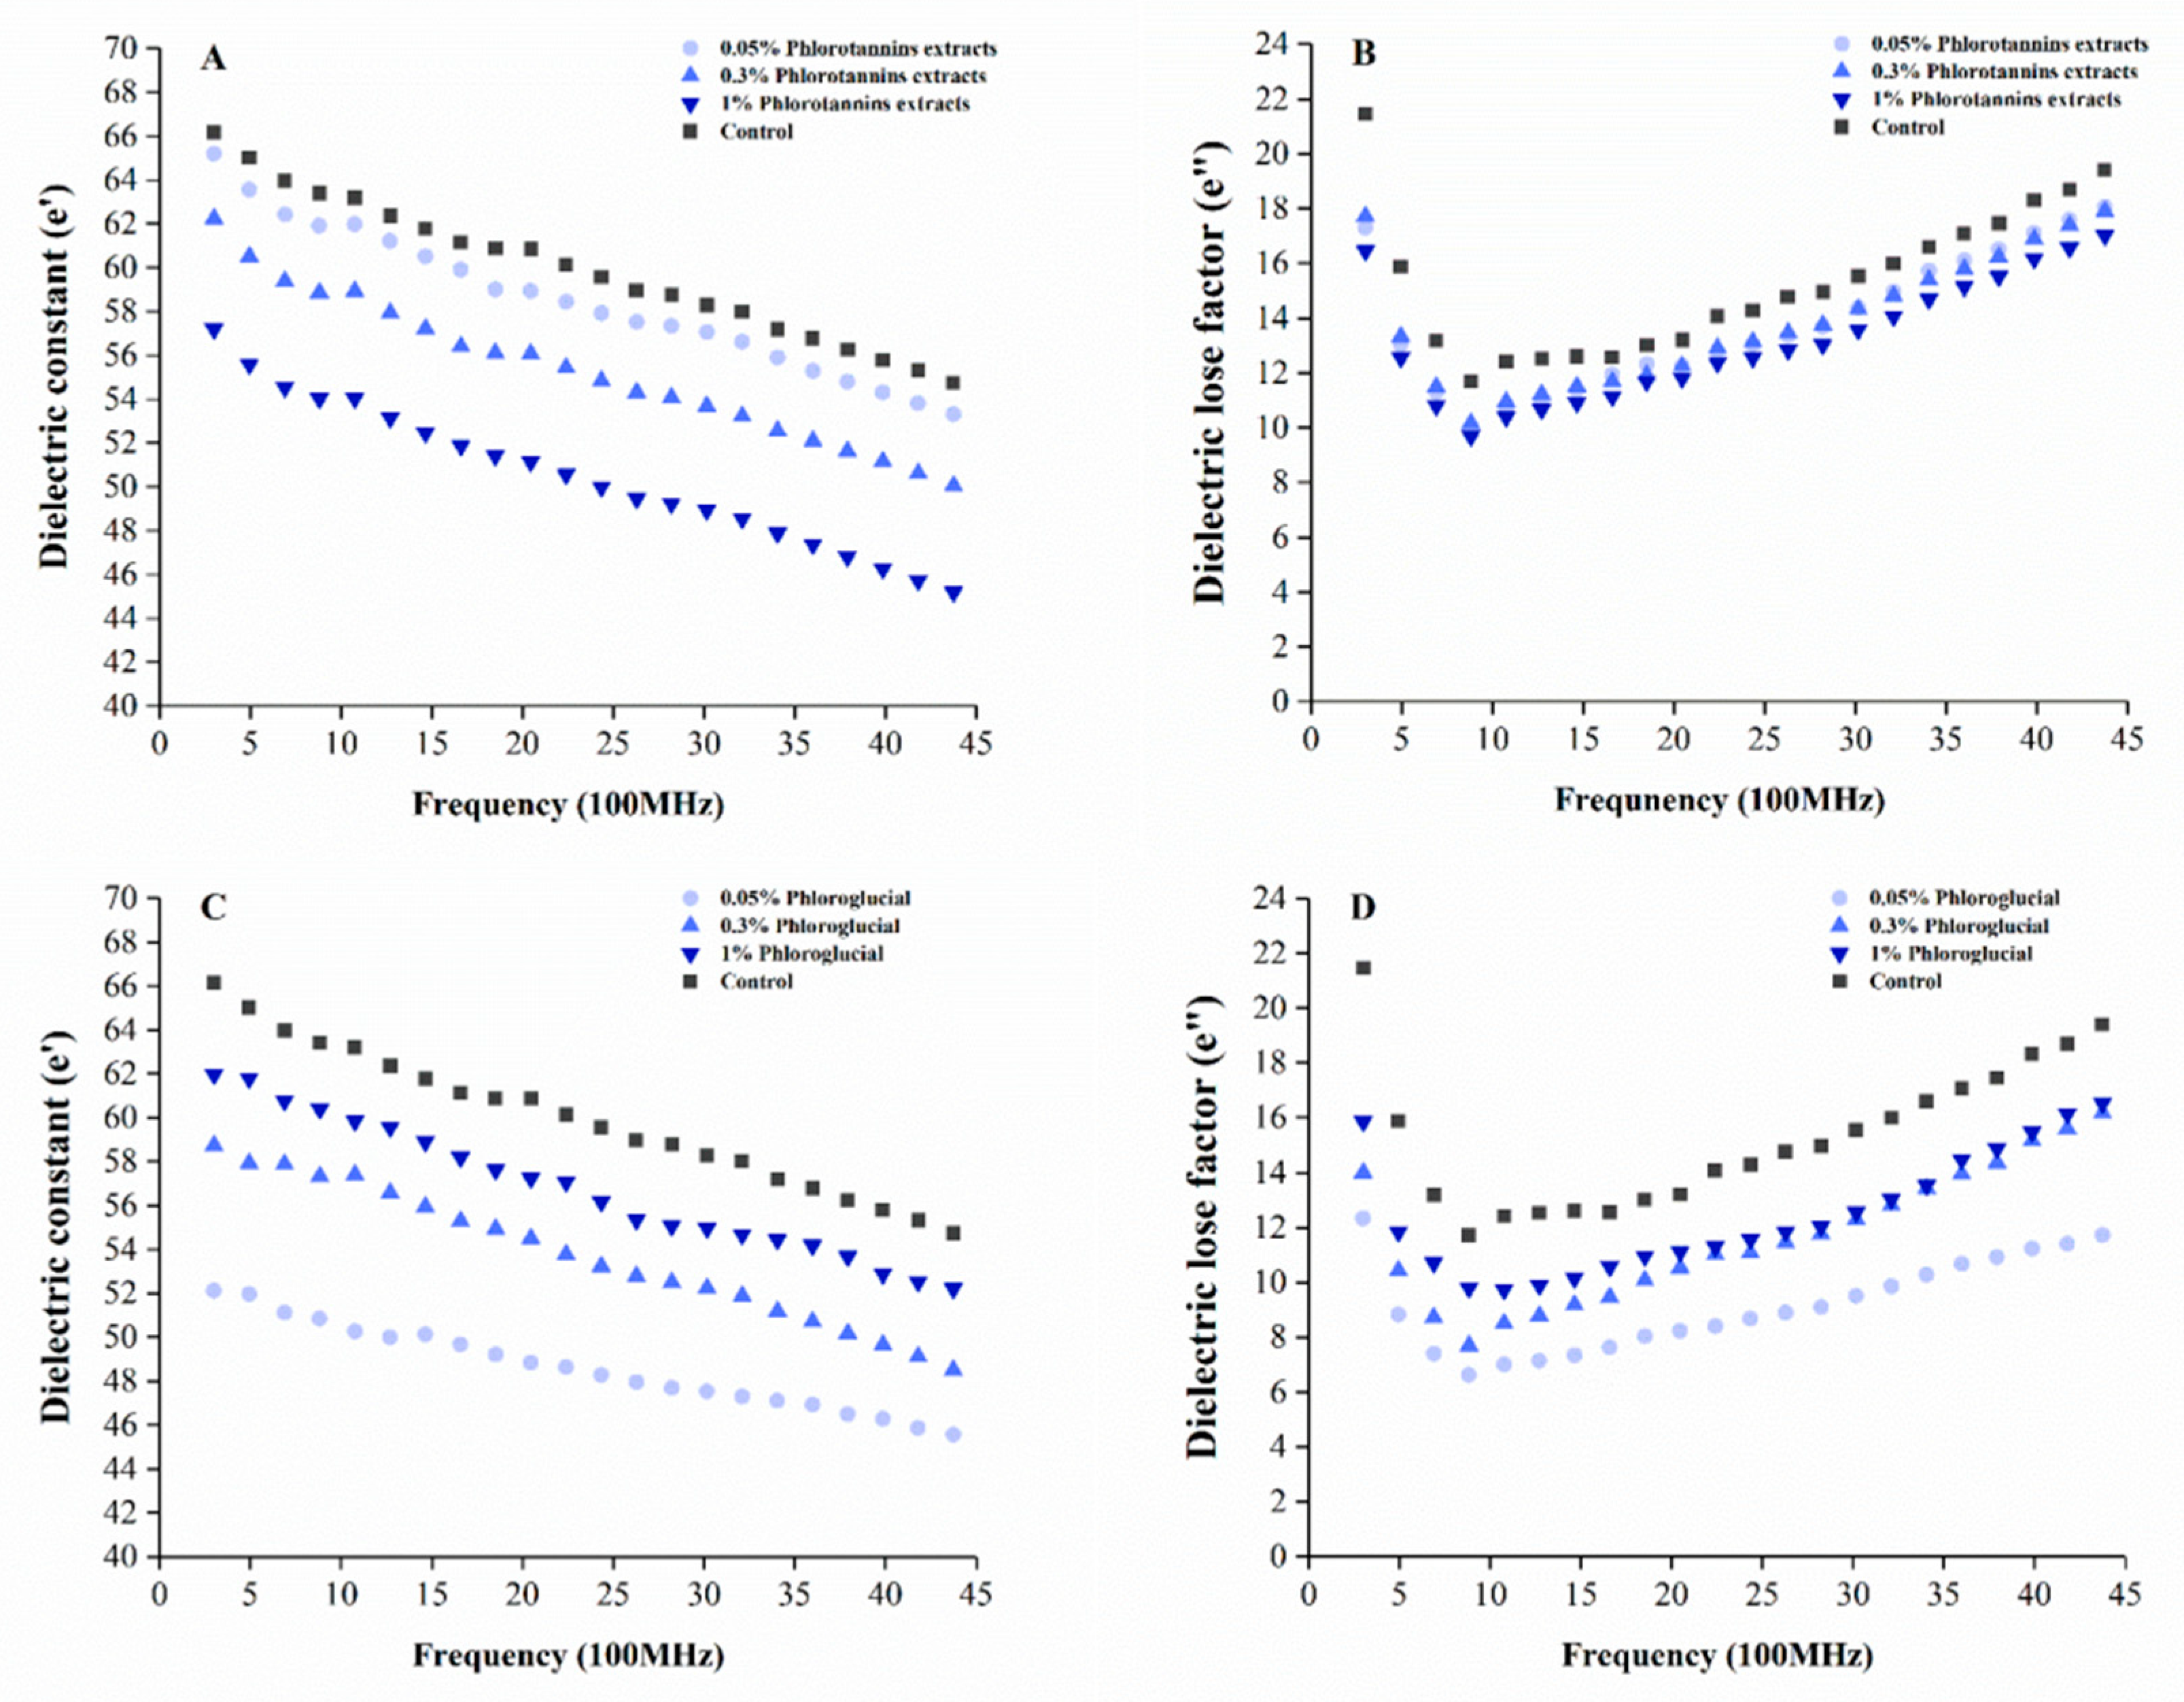
3.4. Dielectric Properties of Surimi Gel

The dielectric property of food is defined as the interaction between the medium and electromagnetic field and is expressed in terms of complex relative dielectric permittivity (ε*) [30]. The value of ε* was used to represent the medium dielectric property for the real part and imaginary part called dielectric constant (ε′) and dielectric loss factor (ε″), respectively [31], which existed in the time-change high-frequency sinusoidal field or microwave field. In addition, the ε″ was characterized by different relaxation phenomena [32], which were relative to the dipolar property of the water molecule. The dielectric property of water was treated as the main cause of dielectric loss and dielectric absorption. Mabrook [33] reported that the conductance of full-fat milk increased with the increase in water. The ε″ was described by Equation (1) (Debye relation), reflecting different relaxation phenomena with different effects in food with high moisture content.
Ε″ = εd″ + σ/ε0ω
From Equation (1), ε″ represented the loss factor, εd″ represented the relaxation phenomenon caused by dipolar polarization, and σ/ε0ω represented the relaxation phenomenon caused by ionic conductivity. Normally, the moisture content of surimi gel was over 70%. Thus, the dielectric behavior could be reflected by the Debye relation for the properties of free water in surimi gel.
The effects on ε′ and ε″ of hairtail surimi gel with PE and PG at different levels are shown in Figure 3.
Compared with the control, both ε′ and ε″ were decreased by PE and PG. The ε′ decreased with both the PE and the frequency increasing (Figure 3A), whereas Figure 3C shows that a lower concentration of PG promoted ε′ decreasing of surimi gel. As shown in Figure 3B, ε″ markedly decreased with increasing frequency and then ε″ reached a minimum at 900 MHz, followed by a slower increase in 1000–4500 MHz, which was the microwave frequency domain. The lowest ε″ was observed in surimi gel with 1% PE among the three concentrations. From Figure 3D, the minimum ε″ value of surimi gel with PG also appeared at 900 MHz. The changing tendency of ε″ with different concentrations was similar. The ε″ value of 0.05% PG treated surimi gel was the lowest among all the samples.
The ε′ depends on the frequency of microwave radiation and decreases with the increase in frequency. Water is a polar molecule, and it will be oriented or polarized in an external electric field [34,35]. The denser gel structure of surimi gel formed more hydrogen bonds, thus limiting the mobility of water molecules. Therefore, the results of ε′ shown in Figure 3A,C indicated that a high concentration level of PE (1%) promoted the increase in bound water in the surimi gel, resulting in the diminishing of the dielectric constant. However, the degree of restriction to the water of PG showed a negative dose-dependent manner.
When it came to then ε″, the results are shown in Figure 3B, and Figure 3D indicated that the main influenced factor of dielectric loss in lower frequency differed from that in the frequency higher than 1000 MHz. The common effect of εd″ and σ/ε0ω was identified as the main reason for the increase of ε″ in a lower frequency, which promoted the ε″ decreasing rapidly, as shown in Figure 3B,D. In contrast, at a frequency above 1000 MHz, the εd″ contributed the most to the ε″ increase among the four types of polarization [36]. Once the frequency was higher than the inflection point (900 MHz in this study), the ε″ change was well described by the Debye equation. That is, with the increase in frequency shown in Figure 3B and Figure 4B, the polarized dipole was stopped from rotating up with the change of electric field [37] and then resulted in the gradual increase in the ε″ value. The εd″ in surimi gel detected in the high-frequency domain was mainly due to the change of free water. Therefore, the restriction of free water was promoted by the additives in surimi gel. Clarion [38] illustrated that higher water activity in food was derived from the higher dielectric property. A higher ε″ indicated a higher free water content in surimi gel, reflecting the higher water activity of surimi gel treated by the lower concentration level of PE (0.05%) and higher PG (0.3% and 1%). The difference in ε″ value emphasized the different protein-binding abilities between PE and PG. Stronger covalent interaction between 1% PE/0.05% PG and protein in surimi gel was deducted due to the stronger restriction of water, which provided support to the change of breaking force and deformation shown in Figure 1 and the surface change in Figure 2. However, the effects of electric properties on moisture state were unclear, and further analysis is necessary.

3.5. The Water Relaxation Time of Surimi Gel

For surimi gel property research, an intuitive and fast testing instrument was needed. Low field nuclear magnetic resonance (LF-NMR) is non-destructive, allows for rapid detection, has a low sample requirement, and can be used to determine multiple properties in food such as moisture, protein, and texture [39]. It was well-known that the water-binding state plays a vital role in gel-forming, and NMR has been applied to non-destructively explore the moisture mobility and diffusion of different water types in high water content samples [40,41]. Several studies showed that water-holding capacity and water-binding ability were mainly due to the change in myofibrillar protein during the heating progress [42,43]. When proteins are surrounded by water molecules in a specific binding location, transversal relaxation time (T2) of NMR can be considerably influenced if these water molecules exchange rapidly enough in solution. The exchange can be regarded as a diffusion process. The length of relaxation time is related to the existence of hydrogen protons and the physical and chemical environment [44]. Therefore, water 1H T2 was used to reflect the protein mobility and the interaction between protein and water. Empirically, three independent peaks were fitted exponentially by NMR spin-spin relaxation signal. In the present study, two separate signal peaks were observed in all samples by CPMG sequence: bond water (T22) and free water (T23). The transverse relaxation time of different treated surimi gels are shown in Figure 4.
As Figure 4B shows, the T22 relaxation time of the 1% PE sample shifted sharply left to a shorter response time. The samples treated by 0.3% and 0.05% PE showed no significant difference in response time compared with the control (p > 0.05). Moreover, it was observed that the T23 peak of 0.05%, 0.3%, and 1% PE was also shifted to the left. Compared with the control, similarly significant shifts in T22 and T23 were observed in PG-treated samples (Figure 4A), which were consistent with the analysis of ε′ shown in Figure 3A,C. The results indicated that the water movability was reduced in the surimi gel network by adding PE (1%) and PG (0.05%). The peak position of relaxation time shift to the left was attributed to the greater hydrogen proton binding force or the smaller degree of water freedom [45]. The water in the outer layer could be quickly reoriented with a high degree of freedom, compared to the inner layer of water with a stable and tight binding state. Hence, the internal three-dimensional network structure of surimi gel tended to be more stable with PE and PG added.
It is worth noting that the T23 relaxation time shift of surimi gel with added PG and PE was different. The NMR T23 relaxation times of surimi gel with added PE (0.05%, 0.3%, and 1%) were 2.56 s, 2.71 s, and 2.92 s, respectively, and those of PG (0.05%, 0.3%, 1%) treated surimi gel were 0.90 s, 1.49 s, and 1.20 s, respectively. The 1% PE and 0.05% PG induced T23 relaxation time of surimi gel shifted more to the left than other concentrations, indicating that the corresponding free water was reduced. The proportion of free water is inversely proportional to the strength of the gel structure [46]. Therefore, the gel property of the surimi gel sample was enhanced by the addition of 1% PE and 0.05% PG, which supported and supplemented the change of ε′ and ε″ of surimi gel with added PE and PG, shown in Figure 3. Regarding the difference between PE and PG, the main factor was the different ways that two kinds of phenolic compounds interacted with myosin, resulting in various degrees of tightness in the network of the treated surimi gel, which supported the results shown in Figure 1.

3.6. Water Distribution of Surimi Gel

In muscle tissues, the state of moisture was characterized by MRI [47]. MRI is regarded as a non-destructive and precise method, widely used in the food storage and processing fields in recent years. Figure 5 shows the changes in water distribution of the hairtail surimi gel structure treated by different concentrations of PE and PG.
After weighted imaging, all aqueous phases in the samples were characterized by MRI techniques [48]. Hydrogen proton density indicated the distribution of water. The pseudo-color map obtained after the weighting process clearly shows the hydrogen proton density difference according to the color change, which highlights the different water phases in the gel. The color bar serves as a reference for color changes in pseudo-color: a higher hydrogen proton density represents a redder pseudo-color.
As Figure 5 shows, the surimi gel sample treated by 0.05% PE showed little difference compared with the control sample. However, the sample treated by 0.05% PG increased hydrogen proton density remarkably, which indicated that the three-dimension network of surimi gel was greatly enhanced with a lower concentration of PG. The bottom of the surimi gel treated by 1% PG could be observed with more hydrogen protons. Nevertheless, it was found from the pseudo-color figure that the density of hydrogen protons on the sample surface was much higher than that on the bottom. It could be suggested that the poor water-holding capacity of gel samples treated with 1% PG resulted in different moisture distributions at the top and bottom layers [49]. It was observed from the proton density picture that samples treated with a high dosage of PG were darker at the top than at the bottom. However, the sample treated with PE exhibited good structure uniformity indicating the tight combination of PE and surimi gel protein. These results proved that 1% PE and 0.05% PG contributed more to strengthening the gel property.

4. Conclusions

Two different types of polyphenolic compounds showed dramatically different effects on hairtail surimi gel. Because of the different interaction mechanisms with myosin of surimi gel, 1% PE and 0.05% PG exhibited a comparatively strengthening influence on surimi gel, with PE showing a better performance. Therefore, 1% of PE could be treated as an optimized option to enhance the hairtail surimi gel. PE could be treated as a potential economic resource for surimi gel production. However, there was also some inadequacies, necessitating supplementary research in the present study. Myosin was a crucial factor for gel-forming, so the sulfate-polyacrylamide gel electrophoresis could be used to further investigate myosin change in surimi gel with added phlorotannins. According to the results of low-field NMR, optimal concentrations of PG and PE would significantly increase the gel quality of surimi gel. Nevertheless, a more sufficient method to reflect the relationship of examined samples and the property needs to be established.

Author Contributions

Funding acquisition, B.B.; investigation, Q.C.; supervision, B.B.; writing—original draft, Q.H. and Y.W.; writing—review and editing, Q.H. and B.B., Q.H. and Y.W. were treated as co-first authors. All authors have read and agreed to the published version of the manuscript.

Funding

This research was funded by Science and Technology Commission of Shanghai municipality, grant number 1749074222500, and National Natural Science Foundation of China, grant number 81502955 and 81750110548.

Institutional Review Board Statement

Not applicable.

Informed Consent Statement

Not applicable.

Data Availability Statement

Not applicable.

Acknowledgments

The authors give a sincere thanks to the College of Fisheries and Life Science, Shanghai Ocean University for material support. A special thanks to Qi LIN for the moral support.

Conflicts of Interest

The authors declare no conflict of interest. The funders had no role in the design of the study; in the collection, analyses, or interpretation of data; in the writing of the manuscript, or in the decision to publish the results.

References

  1. Takeda, H.; Seki, N. Enzyme-catalyzed Cross-linking and Degradation of Myosin Heavy Chain in Walleye Pollack Surimi Paste during Setting. Fish. Sci. 1996, 62, 462–467. [Google Scholar] [CrossRef] [Green Version]
  2. Núñez-Flores, R.; Cando, D.; Borderías, A.J.; Moreno, H.M. Importance of salt and temperature in myosin polymerization during surimi gelation. Food Chem. 2018, 239, 1226–1234. [Google Scholar] [CrossRef] [PubMed]
  3. Hz, A.; Xiong, Y.; Bakry, A.M.; Xiong, S.; Yin, T.; Zhang, B.; Huang, J.; Liu, Z.; Huang, Q. Effect of yeast β-glucan on gel properties, spatial structure and sensory characteristics of silver carp surimi. Food Hydrocoll. 2019, 88, 256–264. [Google Scholar]
  4. Zhang, R.; Zhang, T.; Hu, M.; Xue, Y.; Xue, C. Effects of oleogels prepared with fish oil and beeswax on the gelation behaviors of protein recovered from Alaska Pollock. LWT 2020, 137, 110423. [Google Scholar] [CrossRef]
  5. Hu, Y.; Shao, Y.; Wu, C.; Yuan, C.; Ishimura, G.; Liu, W.; Chen, S. γ-PGA and MTGase improve the formation of ε-(γ-glutamyl) lysine cross-links within hairtail (Trichiurus haumela) surimi protein. Food Chem. 2018, 242, 330–337. [Google Scholar] [CrossRef]
  6. Spanos, G.A.; Wrolstad, R.E. Phenolics of apple, pear, and white grape juices and their changes with processing and storage. A review. J. Agric. Food Chem. 1992, 40, 1478–1487. [Google Scholar] [CrossRef]
  7. Strauss, G.; Gibson, S.M. Plant phenolics as cross-linkers of gelatin gels and gelatin-based coacervates for use as food in-gredients. Food Hydrocoll. 2004, 18, 81–89. [Google Scholar] [CrossRef]
  8. Balange, A.K.; Benjakul, S. Effect of oxidised phenolic compounds on the gel property of mackerel (Rastrelliger kanagurta) surimi. LWT-Food Sci. Technol. 2009, 42, 1059–1064. [Google Scholar] [CrossRef]
  9. Buamard, N.; Benjakul, S. Effect of ethanolic coconut husk extract and pre-emulsification on properties and stability of surimi gel fortified with seabass oil during refrigerated storage. LWT 2019, 108, 160–167. [Google Scholar] [CrossRef]
  10. Cho, S.; Shimizu, M. Natural Sleep Aids and Polyphenols as Treatments for Insomnia. In Bioactive Nutraceuticals and Dietary Supplements in Neurological and Brain Disease; Elsevier: Amsterdam, The Netherlands, 2015; pp. 141–151. [Google Scholar]
  11. Senapati, S.R.; Singh, C.B.; Hassan, M.A.; Vignaesh, D.; MartinXavier, K.A.; Balange, A.K. Effect of differentsolvents on total phenolics and antioxidant activity of extracts from Sargassum tenerrium (J. Agardh, 1848). J. Environ. Bio.-Sci. 2016, 30, 415–419. [Google Scholar]
  12. Jiang, D.; Shen, P.; Pu, Y.; Jin, M.; Yu, C.; Qi, H. Enhancement of gel properties of Scomberomorus niphonius myofibrillar protein using phlorotannin extracts under UVA irradiation. J. Food Sci. 2020, 85, 2050–2059. [Google Scholar] [CrossRef] [PubMed]
  13. Shitole, S.S.; Balange, A.K.; Gangan, S.S. Use of Seaweed (Sargassum tenerrimum) extract as gel enhancer for lesser sardine (Sardinella brachiosoma) surimi. Int. Aquat. Res. 2014, 6, 55. [Google Scholar] [CrossRef]
  14. Shitole, S.; Balange, A. Enhancement of gel strength of surimi from Japanese threadfin bream (Nemipterus japonicus Bloch, 1791) using seaweed extract. Fish. Technol. 2014, 51, 102–105. [Google Scholar]
  15. Wang, Y.; Tian, X.; Li, J.; Tu, L.; Tan, S.; Wu, W.; Bao, B. Extraction Optimization Using Response Surface Methodology and Structure Identification of Phlorotannins from Sargassum horneri. Sci. Technol. Food Ind. 2018, 39, 143–149. [Google Scholar]
  16. Ferreres, F.; Lopes, G.; Gil-Izquierdo, A.; Andrade, P.B.; Sousa, C.; Mouga, T.; Valentão, P. Phlorotannin Extracts from Fucales Characterized by HPLC-DAD-ESI-MSn: Approaches to Hyaluronidase Inhibitory Capacity and Antioxidant Properties. Mar. Drugs 2012, 10, 2766–2781. [Google Scholar] [CrossRef] [Green Version]
  17. Julavittayanukul, O.; Benjakul, S.; Visessanguan, W. Effect of phosphate compounds on gel-forming ability of surimi from bigeye snapper (Priacanthus tayenus). Food Hydrocoll. 2006, 20, 1153–1163. [Google Scholar] [CrossRef]
  18. Oujifard, A.; Benjakul, S.; Ahmad, M.; Seyfabadi, J. Effect of bambara groundnut protein isolate on autolysis and gel properties of surimi from threadfin bream (Nemipterus bleekeri). LWT 2012, 47, 261–266. [Google Scholar] [CrossRef]
  19. Zhang, M.; Xu, J.; Zhu, Y.; Zhang, R.; Cheng, Y.; Jin, Y. Effects of sucrose and glucose on the dielectric properties of minced Antarctic krill. Sci. Technol. Food Ind. 2017, 24, 58–64. [Google Scholar]
  20. Kroll, J.; Rawel, H.M.; Rohn, S. Reactions of Plant Phenolics with Food Proteins and Enzymes under Special Consideration of Covalent Bonds. Food Sci. Technol. Res. 2003, 9, 205–218. [Google Scholar] [CrossRef] [Green Version]
  21. Park, J.W. Surimi and Surimi Seafood; CRC Press LLC: Baton Rouge, LA, USA, 2013. [Google Scholar]
  22. Czubinski, J.; Dwiecki, K. A review of methods used for investigation of protein-phenolic compound interactions. Int. J. Food Sci. Technol. 2016, 52, 573–585. [Google Scholar] [CrossRef]
  23. Haslam, E. Plant Polyphenols: Vegetable Tannins Revisited; CUP Archive: Cambridge, UK, 1989; p. 230. [Google Scholar]
  24. Balange, A.K.; Benjakul, S. Effect of oxidised tannic acid on the gel properties of mackerel (Rastrelliger kanagurta) mince and surimi prepared by different washing processes. Food Hydrocoll. 2009, 23, 1693–1701. [Google Scholar] [CrossRef]
  25. Ngo, V.P.; Morioka, K.; Itoh, Y. Microstructure of white croaker surimi protein gels set at low temperature under the in-hibition of the polymerization and degradation of protein. J. Biol. Sci. 2010, 10, 499–506. [Google Scholar]
  26. Shen, P.; Gao, Z.; Xu, M.; Rao, J.; Chen, B. Physicochemical and structural properties of proteins extracted from dehulled industrial hempseeds: Role of defatting process and precipitation pH. Food Hydrocoll. 2020, 108, 106065. [Google Scholar] [CrossRef]
  27. Balange, A.K.; Benjakul, S. Use of kiam wood extract as gel enhancer for mackerel (Rastrelliger kanagurta) surimi. Int. J. Food Sci. Technol. 2009, 44, 1661–1669. [Google Scholar] [CrossRef]
  28. Maqsood, S.; Benjakul, S.; Shahidi, F. Emerging Role of Phenolic Compounds as Natural Food Additives in Fish and Fish Products. Crit. Rev. Food Sci. Nutr. 2013, 53, 162–179. [Google Scholar] [CrossRef]
  29. Frazier, R.A.; Papadopoulou, A.; Mueller-Harvey, I.; Kissoon, D.; Green, R.J. Probing Protein−Tannin Interactions by Isothermal Titration Microcalorimetry. J. Agric. Food Chem. 2003, 51, 5189–5195. [Google Scholar] [CrossRef]
  30. Nunes, A.; Bohigas, X.; Tejada, J. Dielectric study of milk for frequencies between 1 and 20GHz. J. Food Eng. 2006, 76, 250–255. [Google Scholar] [CrossRef]
  31. Zhu, X.H.; Guo, W.C. A Review of Affecting Factors and Their Mechanisms of the Radio Frequency-Microwave Dielectric Properties of Foods. Food Sci. 2010, 31, 410–414. [Google Scholar]
  32. Schwan, H.P. Biological effects of non-ionizing radiations: Cellular properties and interactions. Ann. Biomed. Eng. 1988, 16, 245–263. [Google Scholar] [CrossRef] [PubMed]
  33. Mabrook, M.; Petty, M. A novel technique for the detection of added water to full fat milk using single frequency admittance measurements. Sens. Actuators B Chem. 2003, 96, 215–218. [Google Scholar] [CrossRef]
  34. Lizhi, H.; Toyoda, K.; Ihara, I. Dielectric properties of edible oils and fatty acids as a function of frequency, temperature, moisture and composition. J. Food Eng. 2008, 88, 151–158. [Google Scholar] [CrossRef]
  35. Cao, H.; Fan, D.; Jiao, X.; Huang, J.; Zhao, J.; Yan, B.; Zhou, W.; Zhang, W.; Zhang, H. Heating surimi products using microwave combined with steam methods: Study on energy saving and quality. Innov. Food Sci. Emerg. Technol. 2018, 47, 231–240. [Google Scholar] [CrossRef]
  36. Ryynänen, S. The electromagnetic properties of food materials: A review of the basic principles. J. Food Eng. 1995, 26, 409–429. [Google Scholar] [CrossRef]
  37. Damez, J.-L.; Clerjon, S. Quantifying and predicting meat and meat products quality attributes using electromagnetic waves: An overview. Meat Sci. 2013, 95, 879–896. [Google Scholar] [CrossRef]
  38. Clerjon, S.; Daudin, J.-D.; Damez, J.-L. Water activity and dielectric properties of gels in the frequency range 200 MHz–6 GHz. Food Chem. 2003, 82, 87–97. [Google Scholar] [CrossRef]
  39. Tananuwong, K.; Reid, D. DSC and NMR relaxation studies of starch–water interactions during gelatinization. Carbohydr. Polym. 2004, 58, 345–358. [Google Scholar] [CrossRef]
  40. Han, M.; Wang, P.; Xu, X.; Zhou, G. Low-field NMR study of heat-induced gelation of pork myofibrillar proteins and its relationship with microstructural characteristics. Food Res. Int. 2014, 62, 1175–1182. [Google Scholar] [CrossRef]
  41. Guo, J.; Zhou, Y.; Yang, K.; Yin, X.; Ma, J.; Li, Z.; Sun, W.; Han, M. Effect of low-frequency magnetic field on the gel properties of pork myofibrillar proteins. Food Chem. 2019, 274, 775–781. [Google Scholar] [CrossRef]
  42. Ducel, V.; Pouliquen, D.; Richard, J.; Boury, F. 1H NMR relaxation studies of protein–polysaccharide mixtures. Int. J. Biol. Macromol. 2008, 43, 359–366. [Google Scholar] [CrossRef]
  43. Mu, Y.; Sun, J.; Obadi, M.; Chen, Z.; Xu, B. Effects of saccharides on the rheological and gelling properties and water mobility of egg white protein. Food Hydrocoll. 2020, 108, 106038. [Google Scholar] [CrossRef]
  44. Hills, B.; Takacs, S.; Belton, P. The effects of proteins on the proton N.M.R. transverse relaxation times of water. Mol. Phys. 1989, 67, 903–918. [Google Scholar] [CrossRef]
  45. Kuntz, I., Jr.; Kauzmann, W. Hydration of proteins and polypeptides. In Advances in Protein Chemistry; Elsevier: Amsterdam, The Netherlands, 1974; pp. 239–345. [Google Scholar]
  46. Chinachoti, P.; White, V.A.; Lo, L.; Stengle, T.R. Application of high-resolution carbon-13, oxygen-17, and sodium-23 nuclear magnetic resonance to study the influences of water, sucrose, and sodium chloride on starch gelatinization. Cereal Chem. 1991, 68, 238–244. [Google Scholar]
  47. Dolata, W.; Piotrowska, E.; Wajdzik, J.; Tritt-Goc, J. The use of the MRI technique in the evaluation of water distribution in tumbled porcine muscle. Meat Sci. 2004, 67, 25–31. [Google Scholar] [CrossRef] [PubMed]
  48. Gianferri, R.; D’Aiuto, V.; Curini, R.; Delfini, M.; Brosio, E. Proton NMR transverse relaxation measurements to study water dynamic states and age-related changes in Mozzarella di Bufala Campana cheese. Food Chem. 2007, 105, 720–726. [Google Scholar] [CrossRef]
  49. Kudre, T.; Benjakul, S.; Kishimura, H. Effects of protein isolates from black bean and mungbean on proteolysis and gel properties of surimi from sardine (Sardinella albella). LWT-Food Sci. Technol. 2013, 50, 511–518. [Google Scholar] [CrossRef]
Figure 1. Effect of phlorotannins extracts (PE) and phloroglucinol (PG) on the breaking force (A) and deformation (B) of surimi gel. Bars represent the standard deviation (n = 3). Uppercase letters indicated the significant difference (p < 0.05) between different concentrations of PE. Lowercase letters indicated the significant difference (p < 0.05) between different concentrations of PG.
Foods 11 00411 g001aFoods 11 00411 g001b
Figure 2. Scanning electron microscopy results of hairtail surimi gel with different concentrations of phlorotannins extracts (PE) and phloroglucinol (PG). (A) control sample; (B) surimi gel with 0.05% PG; (C) surimi gel with 0.3% PG; (D) surimi gel with 1% PG; (E) surimi gel with 0.05% PE; (F) surimi gel with 0.3% PE; (G) surimi gel with 1% PE.
Foods 11 00411 g002
Figure 3. The effect on dielectric constant and dielectric loss factor of phlorotannins extracts (A,B) and phloroglucinol (C,D) to hairtail surimi gel.
Foods 11 00411 g003
Figure 4. The water relaxation time of hairtail surimi gel with different concentrations of phloroglucinol (PG) (A) and phlorotannins extracts (PE) (B).
Foods 11 00411 g004
Figure 5. Water distribution of hairtail surimi gel with different concentrations of phlorotannins extracts (PE) and phloroglucinol (PG).
Foods 11 00411 g005
Table 1. The composition of brown algae extracted by LC-TOF-MS.
NumberRetention Time/minm/zAverage Molecular WeightChemical Formula
12.620182.96170182.64745
22.628124.99404124.38192
32.647101.00841100.37207
42.657110.00857109.35370
52.690112.96627112.07419
62.720198.93934198.38203C4H6OS4
72.721116.98560116.00102
82.729128.94901128.02619C4OS2
92.734328.89734328.38389C10H4N2OS5
102.737458.85542458.34203C13H2N2O7S5
112.742474.83270474.04785
122.744214.91687213.99547C9HCl3
132.746344.87480344.02586
142.746140.91655139.98820
153.179256.04484233.19057C9H7N5O3
163.183421.11386420.30871C13H20N6O8S
173.187302.04970301.19281C11H11NO9
183.190329.18305328.33031C14H24N4O5
193.195405.13736404.63680C22H28OS3
203.199345.1552344.48908C17H28O3S2
213.2172.09316171.15199C11H24N6O4S
223.22337.16384336.30625C8H5N5O
233.226188.05795187.14249C14H28N2O4S
243.234321.18461320.64899C6H13N3OS2
253.271208.05698207.04968C8H6ClN5O
263.277224.0342223.56814C14H21ClN6O4
273.281373.13822372.7625C8H7N5O5S
283.352286.02447285.20045C17H26N2O3
293.361307.20102306.34703C11H24N6O4S
303.361270.04693269.46882C9H19NS4
313.368208.05658207.21412C5H9N3O6
323.369158.09690157.15869C11H11N
333.433224.03409223.49965C8H6ClN5O
343.437373.13812372.74777C13H25ClN2O8
353.445172.09212171.15013C4H9N7O
363.448337.16171336.31311C13H24N2O8
373.451188.05770187.1416C8H5N5O
383.503321.18443321.28052C16H30Cl2N2
393.528235.07545234.48632C9H10N6S
403.529251.05280250.17086C8H6N6O4
413.821166.10571165.19649C6H15NO4
423.870194.13675193.27074C8H19NO4
433.932307.20089306.32947C17H26N2O3
444.099150.17505149.23387
454.143337.16147336.30020C14H20N6O4
464.291307.20132306.34264C17H26N2O3
474.914176.12795175.23936C8H17NO3
484.914194.13837193.23043C8H19NO4
495.809303.18921302.29168C10H22N8O3
508.410123.05531122.12213C6H6N2O
519.828260.14681237.31662C10H23NO5
5210.798194.13863193.24705C8H19NO4
5310.816324.24887323.39376C14H33N3O5
5410.816411.31749410.31017C18H42N4O6
5510.825455.34358454.61986C20H46N4O7
5610.825352.24382351.41140C15H33N3O6
5710.827238.16453237.30869C10H23NO5
5810.827176.12787175.25413C8H17NO3
5910.832368.27506367.46745C16H37N3O6
6010.841499.37012498.6614C22H50N4O8
6111.108102.1278101.18727C6H15N
6211.180304.17291281.31975C12H27NO6
6311.181113.03499112.14134C4H4N2O2
6411.324116.07051115.11642C5H9NO2
6511.339200.0885199.18191C5H9N7O2
6611.422314.09103313.32248C11H15N5O4S
6711.518136.06170135.12716C5H5N5
6811.632323.16347322.45909C13H26N2O5S
6911.680127.05003109.07874C5H3NO2
7012.116116.07110115.12176C5H9NO2
7112.117233.14945232.27569C10H20N2O4
7212.488228.06569227.26876C6H9N7OS
7312.496174.05757173.21876C7H11NO2S
7412.506172.09389171.15761C4H9N7O
7512.992217.10404194.21772C8H18O5
7613.006162.11199161.22416C7H15NO3
7713.008277.17483276.31391C12H24N2O5
7813.135251.05470250.22581C12H10O6
7913.178321.20715320.41285C20H24N4
8013.735321.20217320.36389C14H28N2O6
8113.898133.08577132.16099C6H12O3
8213.900239.14873238.28483C10H22O6
8313.940136.06160135.12835C5H5N5
8413.942298.09683297.30583C11H15N5O3S
8514.077109.02839108.07940C6H4O2
8614.357197.11603196.24830C11H16O3
8714.358141.05368140.13538C7H8O3
8814.358179.10562178.20740C11H14O2
8914.359237.10761214.23068C7H14N6O2
9014.359133.10010132.28006C10H12
9114.369172.09028171.25490C7H13N3S
9214.507130.15875129.27435C8H19N
9314.634283.17414282.32968C12H26O7
9414.637133.08560132.21589C6H12O3
9514.762161.10666160.20811C10H12N2
9614.802375.07051374.30363C18H14O9
9715.243327.20070326.37497C11H30N6OS2
9815.256205.13307204.23334C12H16N2O
9915.609205.13317204.24578C12H16N2O
10015.779388.25120370.41506C12H30N6O7
10116.179236.16439235.31530C14H21NO2
10216.250432.27712414.47561C14H34N6O8
10316.306330.16396329.38774C18H23N3OS
10416.321360.23156359.39133C25H29NO
10516.337209.14770208.28387C8H20N2O4
10616.343133.09741132.20609C5H12N2O2
10716.593212.11430211.24952C8H13N5O2
10816.666476.30475458.52634C16H38N6O9
10916.757219.14800218.34457C13H18N2O
11016.922207.09448206.25775C11H14N2S
11117.042520.33041502.58621C18H42N6O10
11217.070248.14593247.25591C7H17N7O3
11317.301350.23023349.45141C16H27N7O2
11417.384564.35756546.65633C21H42N10O7
11517.699608.38428607.72716C23H49N11O8
11617.733542.25877541.55646C23H31N11O5
11717.799123.11549122.21653C9H14
11817.801207.13640206.28160C9H14N6
11917.828447.09129446.36504C21H18O11
12017.894270.12425269.74843C14H20ClNO2
12118.366321.09245320.28310C11H16N2O9
12218.378219.10016218.36085C9H18
12318.381524.24689506.59667C30H34O5S
12418.596588.40820565.78566C29H59NO9
12518.784388.28160387.57821C20H33N7O
12618.830135.11497134.24089C10H14
12718.831197.11686196.23207C11H16O3
12818.831133.10030132.20364C10H12
12918.835179.10436178.22762C7H10N6
13018.872384.28912383.56288C25H37NO2
13118.919365.11881364.31631C13H20N2O10
13218.971406.21052405.94931C18H32ClN3O5
13319.134218.20622217.33160C8H23N7
13419.146701.49011700.91185C32H68N4O12
13519.150679.50780678.95367C31H66N8O8
13619.235186.21576185.37423
13719.295508.32521507.66241C25H37N11O
13819.366538.37259537.69005C27H43N11O
13919.380197.11712196.22811C11H16O3
14019.544559.37285558.74173C29H42N12
14119.560242.28420241.44480C16H35N
14219.670274.27228273.44389C12H31N7
14319.703318.30000317.50362C18H39NO3
14419.73362.32583361.56617C20H43NO4
14519.879256.25624255.43859
14619.886237.14136236.34064C13H20N2S
14720.188302.30455301.49885C18H39NO2
14820.229346.33073345.57569C20H43NO3
14920.364337.19662336.42614C14H28N2O7
15020.938386.32592385.57069C22H43NO4
15120.947330.33617329.55028C20H43NO2
15221.010374.36291373.62298C22H47NO3
15321.085301.13816300.28852C13H20N2
15421.088149.02325148.11612C8H4O3
15521.340388.34156387.57253C22H45NO4
15621.389234.96051234.05388C9H2N2O2S2
15721.463415.21075414.49322C24H30O6
15821.466586.29929585.66389C28H39N7O7
15922.618358.36684357.62209C22H47NO
Table 2. The extraction rate and purity of materials.
MaterialTotal Phenol Content/%Phlorotannins Content/%Purity/%
Brown algae dry powder7.806.46
Phlorotannins extracts34.0725.1673.85
Publisher’s Note: MDPI stays neutral with regard to jurisdictional claims in published maps and institutional affiliations.

