The sensory properties of the standard wheat bread were preferred to GF bread; this was irrespective of the health or taste interests of consumers, and when consumers were informed or not about the GF/wheat containing “nature” of the bread. This indicates a greater taste orientation. Knowledge that bread samples were GF reduced only the acceptability of the aroma of GF bread.
4.2. Hedonic Rating of Bread as Influenced by HTA
Information about the nature of the bread (GF or wheat) affected the hedonic ratings of participants with a high health and high taste attitude (HTHH) differently compared to the other groups. Their likings of the aroma of the GF samples was negatively affected by information. GFB, in particular, was frequently described as having an “off-smell” by this group. This means that despite their high health attitudes, their high taste attitude reduced tolerance of the unfamiliar aroma of the GFB bread. GFB was described as having a yeasty aroma and nutty flavour by a trained sensory panel (results not presented). The HTHH group also liked the flavour of GFA more than the other groups. The flavour of the GFA bread was described to have a toasted and “sweet coffee” flavour by a trained sensory panel (results not presented). Bernstein and Rose [
23], in a study on the preference of commercial whole wheat breads, found that a large number of consumers (from Lincoln, USA) liked breads that were sweet.
Participants with high taste and low health attitudes (HTLHs) rated the flavour of the wheat bread higher compared to the other groups. The words “normal” and “soft” were the most frequent reasons for liking. Familiarity seemed to be important for this group. Consumers tended to dislike products they were not familiar with [
30]. This group was also negatively influenced by information when it came to the liking of the aroma of GFB. GFB was the least liked sample in terms of aroma and flavour by all groups in both informed and uninformed conditions. This HTLH group might have preferred the more familiar wheat bread, considering that taste was important to them. They may also have associated GF bread with having less desirable sensory properties, and they were probably unwilling to compromise taste when the presumed “healthy” GF alternatives were presented [
24].
Although most of the comments for GFB from all groups were negative, some participants from the low taste, high health (LTHH) group described GFB as “nice”, “regular”, and “impressive.” Moreover, participants frequently described GFB as being “healthy”. This may imply that these participants are indeed more concerned with health aspects. However, this group still showed a higher liking for the sensory properties of wheat bread compared to both GF samples. This may be because drivers of liking are mostly defined by the sensory properties of a product, followed by the health aspects [
26]. This group may however be more willing to compromise the familiar and more desirable sensory properties of wheat bread for GF bread compared to other groups.
Frequent comments on GFB by the low taste, low health (LTLH) group were “appealing”, “easy to chew”, and “normal.” These comments were rather positive compared to other groups. This may indicate that some participants from this group did not care about the taste of the GF bread as their low taste orientation suggests.
4.3. Perceived Characteristics of Bread Samples
The participants were of the view that GF bread was more of a specialty bread, meant for people with allergies, for weight loss purposes, and for enhancing one’s health. This coincides with Dunn, House [
12], who found that students at the University of Florida (USA) had unfounded perceptions about the health benefits and the potential positive impact a GF diet had on one’s health. Instead, several studies have described the GF diet to be low in protein, rich in carbohydrates, high in fiber, and of a high glycemic index, in relation to the recommended dietary allowance for adults [
31,
32,
33]. As such, most commercial gluten-free products are nutritionally inferior to their gluten containing alternatives.
Participants were also under the impression that GF bread is natural, organic, and less processed compared to wheat bread. It shows that the participants seemed to believe that gluten is an unnatural or a manmade ingredient added to bread [
34]. These associations are not valid, but demonstrate popular misconceptions often driven by misinformed celebrities and the media in general [
35]. The participants justifiably viewed wheat bread as being more palatable and accessible to them. In fact, GF bread was found to be 700 to 900% more expensive than wheat bread, explaining the lower familiarity and market share. Furthermore, it is quite challenging to replicate the desirable sensory properties (e.g., soft texture with bland flavour) of gluten-containing wheat bread using GF cereals, despite the various alternative cereal flours used. Participants also showed ignorance about the origins of the crops used to produce GF and wheat bread. Of the few participants who selected the “made with flour from sustainable crops” option, most of them associated this statement with wheat bread. In the current context of South Africa, wheat production is not sustainable, as most of it needs to be imported. The harsh climate of many parts of South Africa, coupled with the relatively poor agricultural infrastructure and high dependence on rain for crop growing, is unconducive to high yield wheat cultivation [
36,
37]. Therefore, the wheat supply is heavily supplemented by the global market [
38]. The results show a clear need for more consumer education about gluten, its purpose in bread, potential human health effects, disadvantages and advantages of gluten-free products, and sustainable and indigenous sources of ingredients, as highlighted by Vázquez-Araújo, Chambers IV [
26].
4.4. The Health and Taste Attitude Scale Performance in This Study
The mean scores of the taste factors ranged from 4.98 to 5.22, which were higher than the ranges for the health scale factors (4.13 to 4.52) and higher than the taste factors’ mean score ranges from studies in Taiwan (4.06 to 4.42) [
4], Finland (3.4 to 4.6), the UK (4.1 to 5.0), and the Netherlands (4.0 to 5.1) [
5]. However, the mean scores for health were lower than those of the studies in these countries. This may be an indication that, for this group of consumers, taste aspects are more dominant than health aspects when it comes to food. Taste was reported to be one of the most important factors consumers consider when it comes to the food they consume [
1,
39,
40]. Light product interest scored the lowest of all factors. A similar observation was made by [
5] when studying consumers in the Netherlands. The light product interest mean was 3.9 ± 1.1 in the Netherlands and here 4.1 ± 1.2. Light product interest reflects the extent to which the respondent values eating “light” foods (reduced-fat foods) for maintaining good health and physical appearance [
1]. Most of the participants in this study did not necessarily view consuming light products (as evaluated by this particular scale for measuring light product interest) as particularly important for their health.
Exploratory factor analysis revealed that the light product interest factor was stable as all of its items loaded well on component 2. A similar pattern was found by [
4] in a study of the health attitudes of 1224 Italian consumers. However, unlike in the studies by [
3,
4], the general health interest factor of this study had items with high loadings in two separate components. General health interest therefore formed two constructs, one had all of the negative (R) items (items 5, 6, 7, 8 along with item 3), which implied little or no care for one’s health, except item 3, which also showed the lowest communality in the entire questionnaire. The other construct contained items 1, 2, and 4, which alluded to one being meticulous about the healthfulness of a diet. Item 5 of the general health interest factor (“I eat what I like, and I do not worry about healthiness of food”) had the highest factor loading and this may mean that this item best represented the general health interest of the participants in this research. For natural product interest, items 4 and 6 which refer to processed foods and foods containing additives, had high loadings on component 3—thereby forming a separate construct specific to an interest in whether food was processed or contained additives or not. Similar results were noted by [
5] in their study of the health attitudes of Finnish (
n = 467), British (
n = 361), and Dutch (
n = 477) consumers.
For taste factors, craving for sweet foods was stable in that all items loaded strongly on component 1. The same stability was also noted by [
3] in Serbia and [
5] in Finland. However, in the research done by [
41] and [
4], craving for sweet foods formed two separate constructs, one based on items related to personal craving and the other relating to other people’s cravings. Similar to a study with consumers in Great Britain [
5], items 1, 2, 3, and 4 of the ‘using food as a reward’ factor in this study loaded well on component 2 but items 5 and 6 were better fitted on component 3. These two items are related to emotional eating (when emotional states and situations affect food intake) [
42]. The pleasure factor however, yielded three constructs—this may also be the reason for its relatively low reliability. Item 1 of pleasure loaded well on component 3 with the two emotional eating items from the using food as a reward factor. This item addresses one’s standpoint on whether food should be a source of pleasure or not, which may have also been interpreted as a form of emotional eating by the participants. Items 3 and 6 of the pleasure factor loaded well on component 4. These items refer to eating delicious foods specifically on weekends. Items 2, 4, and 5 loaded well on component 5, these items deal with the sensory appeal or sensory benefits perceived from food. Item 5 had the lowest coefficient alpha. This is an indication that item 5 may have represented something other than pleasure. Responses to item 5 (“I finish my meal even when I do not like the taste of food”) may have been affected by other inherent values, such as food waste consciousness or acknowledging the economic benefit of consuming all food served; and not necessarily the motivation to obtain pleasure from food. Item 5 also loaded poorly with lowest communality for consumers in Great Britain [
5].
The HTA factors had acceptable coefficient alpha values, although rather weak for the pleasure factor (0.51). The coefficient alpha determines the internal consistency of the items of the scale and the closer the value is to one, the more reliable the scale is [
43]. George and Mallery [
44] suggested that a scale with coefficient alpha value <0.50 is unacceptable. Similar to [
2], it was found that after deleting item 5 of the pleasure factor, the coefficient alpha increased from a borderline satisfactory 0.51 to a more acceptable 0.54. The light product interest, natural product interest, craving for sweet foods and using food as a reward factors had higher coefficient alphas than those measured in studies with consumers in the UK and the Netherlands by [
5]. This means that these four factors were more reliable in measuring their respective constructs compared to the study done by [
5].
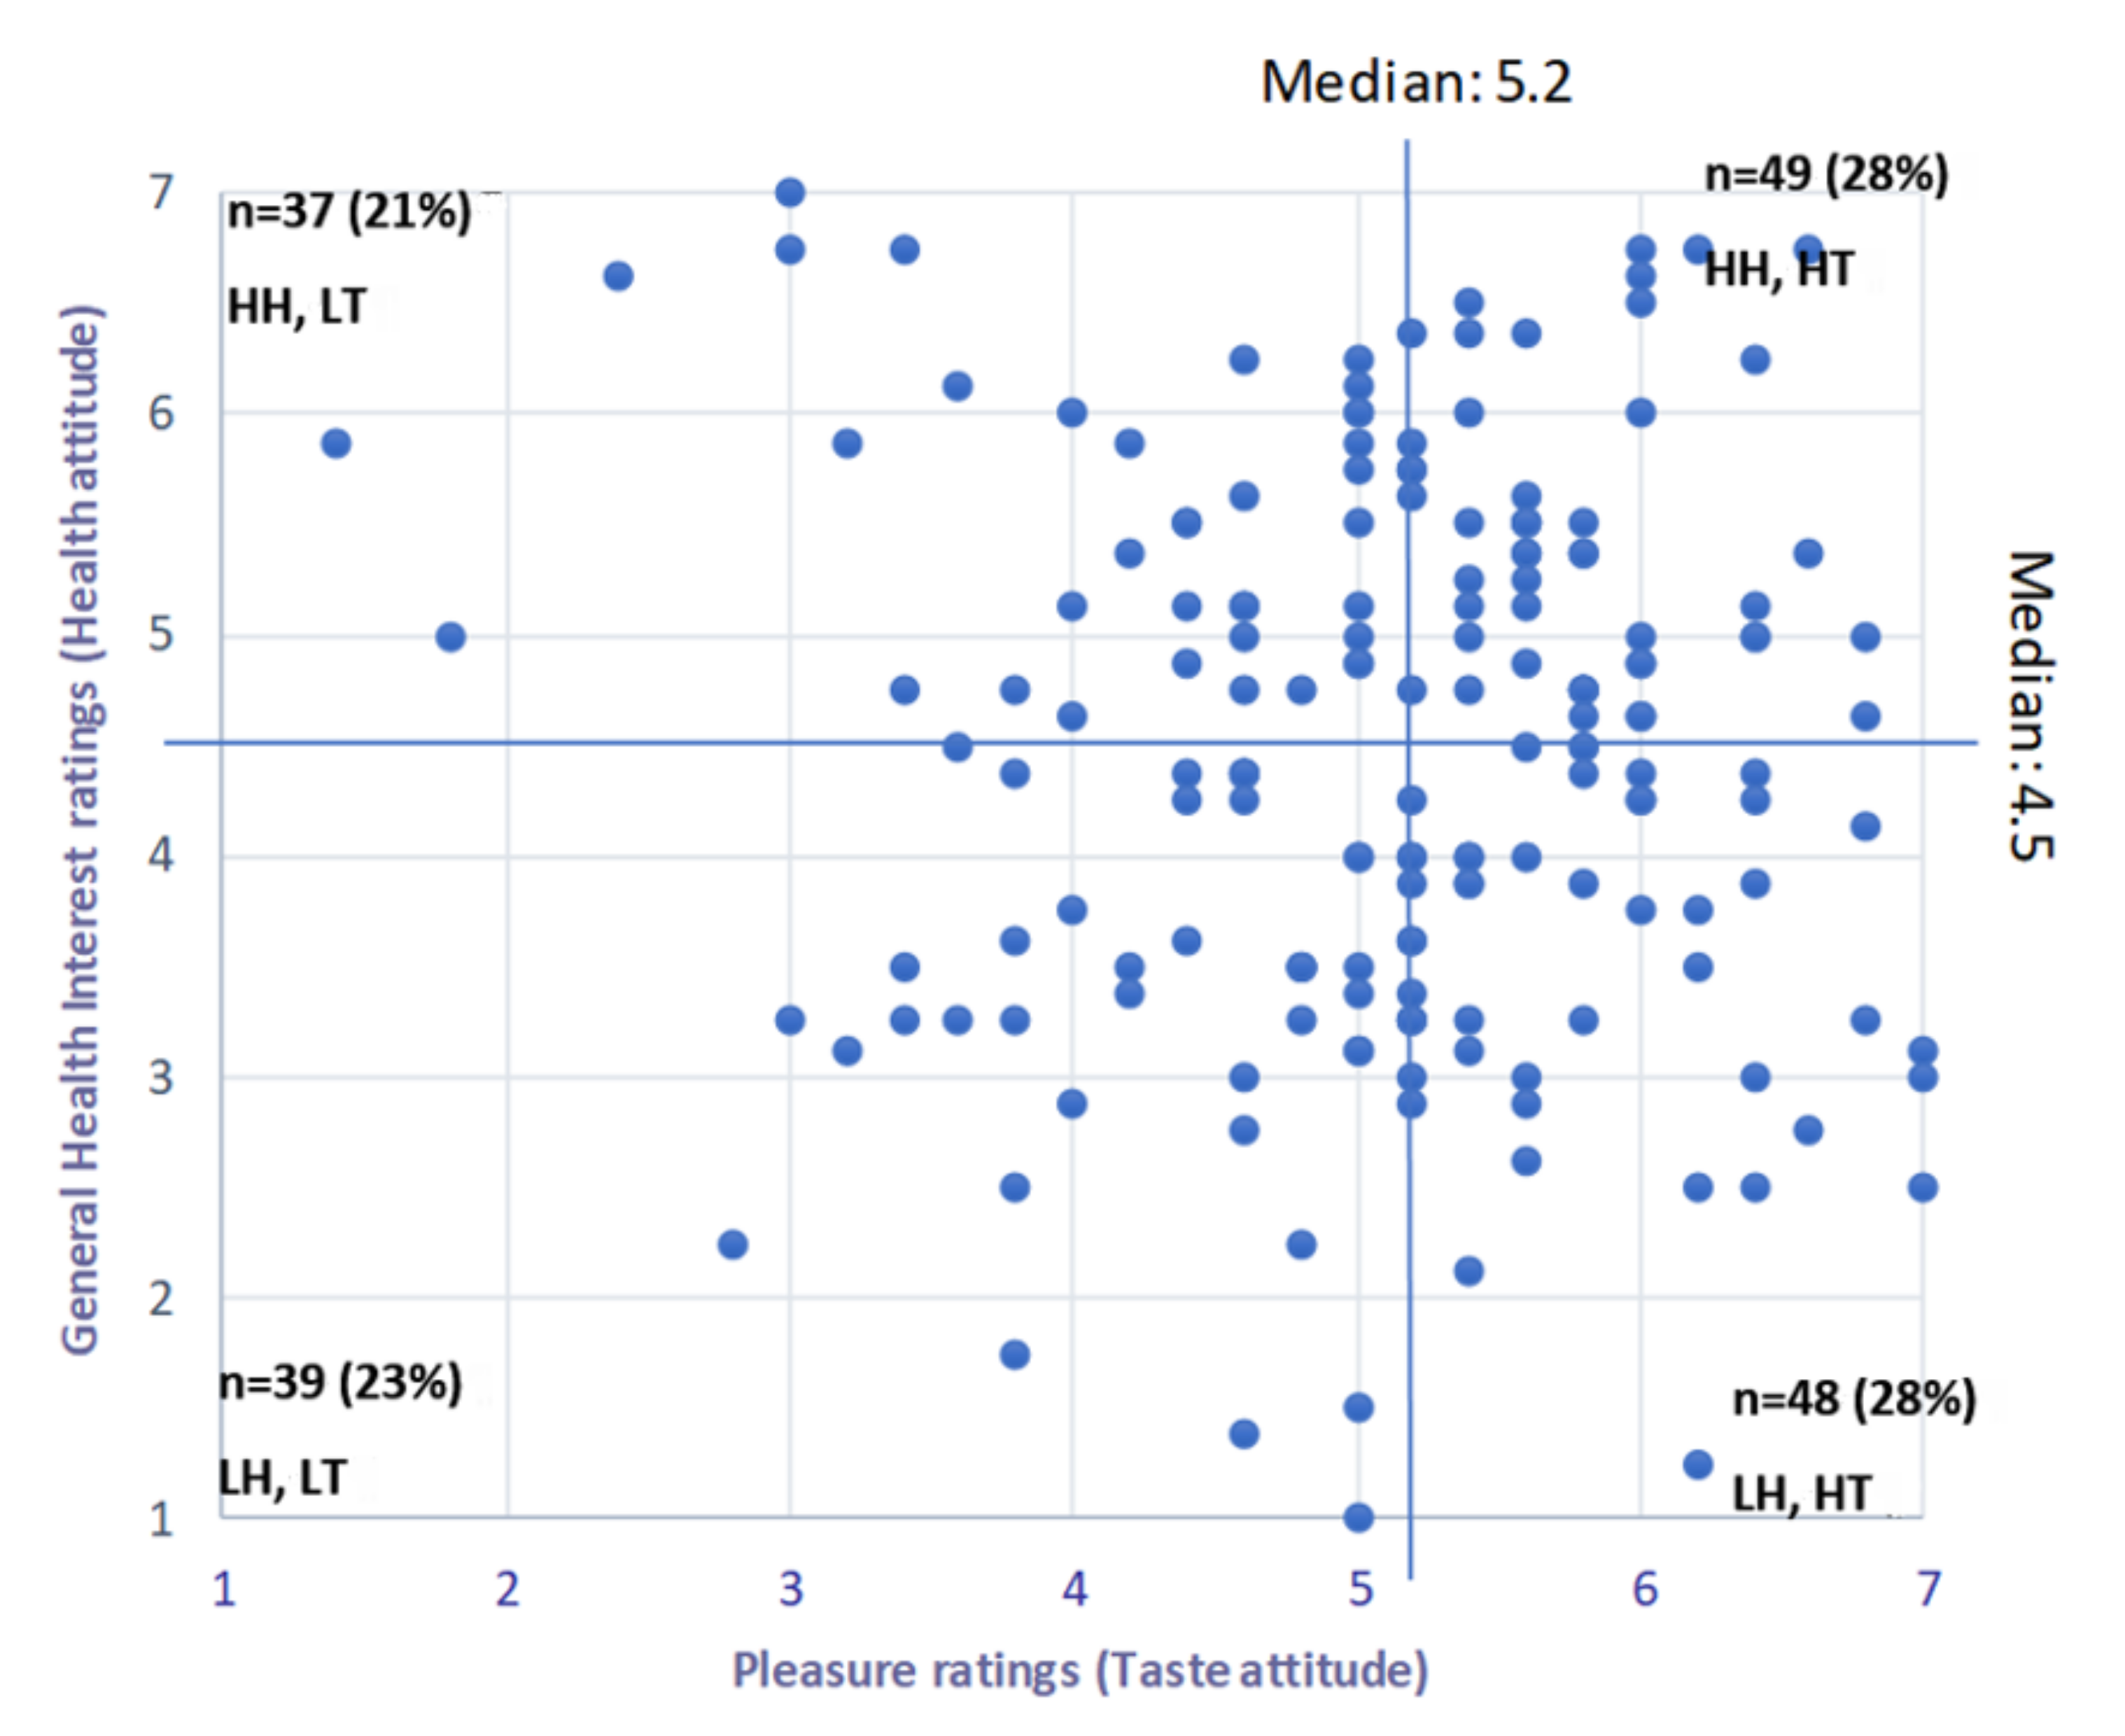
The general health interest factor was used for classifying the participants (
n = 173) into having either a high or a low health attitude and the pleasure factor was used for classifying participants according to taste attitudes. This was done based on face validity by the researchers. The factors that were left out would presumably not contribute to consumers attitudes towards GF bread. For example, natural product interest has an item referring to organically grown vegetables and light product interest has two items which deal with cholesterol, both are not related to health aspects of GF bread. Sabbe, Verbeke [
24] did the same when studying health-related attitudes and beliefs of Belgian consumers connected to the acceptance of fruit juices with added acai. Cox, Melo [
45] used only three of the six factors (general health interest, pleasure, and using food as a reward) to determine the effect of taste, information, and attitudes on the acceptance of Brassica vegetables amongst Australian consumers.
4.5. Limitations of the Study
Firstly, the participants here were a “convenience sample” of educated millennials in urban SA who were interested in participating in food studies. The classification of consumers into the four HTA groups was based on a single tool, i.e., the HTA scales. This is limiting because there may be other health and taste factors that consumers consider (in the South African context), which may not have been part of the HTA scales. Unfortunately, the pleasure factor was here, and based on studies with other populations in different countries [
4,
5,
39], the weakest of all HTA factors, thereby further weakening the taste category. Moreover, the unequal number of negatively worded (2) and positively worded (3) items on the pleasure scale after the deletion of item 5 (negatively worded) may have compromised response balance [
46]. Furthermore, an instrument that is more specific to GF products is needed and may have been more appropriate than the HTA scale, which is more general.
The bread samples evaluated did not represent the full slice or loaf that would be purchased in store. They also represented only two of the many recipes and technological methods used in other parts of the world to produce GF brown bread. The participants only evaluated a disk-shaped portion of the crumb of the bread and not the full slice, which includes the crust. The area/size differences of the slices would have been a driver of liking or disliking in terms of appearance. The crusts were also excluded, a factor that will always be considered by consumers, in terms of appearance, aroma, flavour, and texture.
The use of a five-point scale can be a limitation as it has relatively little room for participants to express the full range of their hedonic perception [
47]. However, a user-friendly test is important as it simplifies the consumer’s task of evaluating, rating, and providing comments on the product [
48].


