
Comparison of the Effects of High Pressure Processing, Pasteurization and High Temperature Short Time on the Physicochemical Attributes, Nutritional Quality, Aroma Profile and Sensory Characteristics of Passion Fruit Purée


Abstract
:1. Introduction
2. Materials and Methods
2.1. Materials
2.1.1. Passion Fruit Purée (PFP) Preparation and Processing
2.1.2. High-Pressure Processing (HPP) Treatment
2.1.3. Thermal Pasteurization Treatment
2.2. Microbial Analysis
2.3. Enzyme Activity Analysis
2.4. Total Soluble Solids (TSS), Total Sugar (TS) and Sugar Profile Analysis
2.5. pH, Titratable Acid (TA) and Organic Acid Analysis
2.6. Color Analysis
2.7. Aroma Compounds Analysis
2.8. Total Phenolics Content (TPC), Total Flavonoids Content (TFC) and Antioxidant Capacity Analysis
2.8.1. TPC Analysis
2.8.2. TFC Analysis
2.8.3. Phenolics Analysis
2.8.4. Antioxidant Capacity Analysis
DPPH Assay
ABTS•+ Assay
2.9. Vitamin C Analysis
2.10. Carotenoids Analysis
2.11. Sensory Evaluation Analysis
2.12. Statistical Analysis
3. Results and Discussion
3.1. Microbial and Enzyme
3.2. Sugars and Organic Acids
3.3. Color
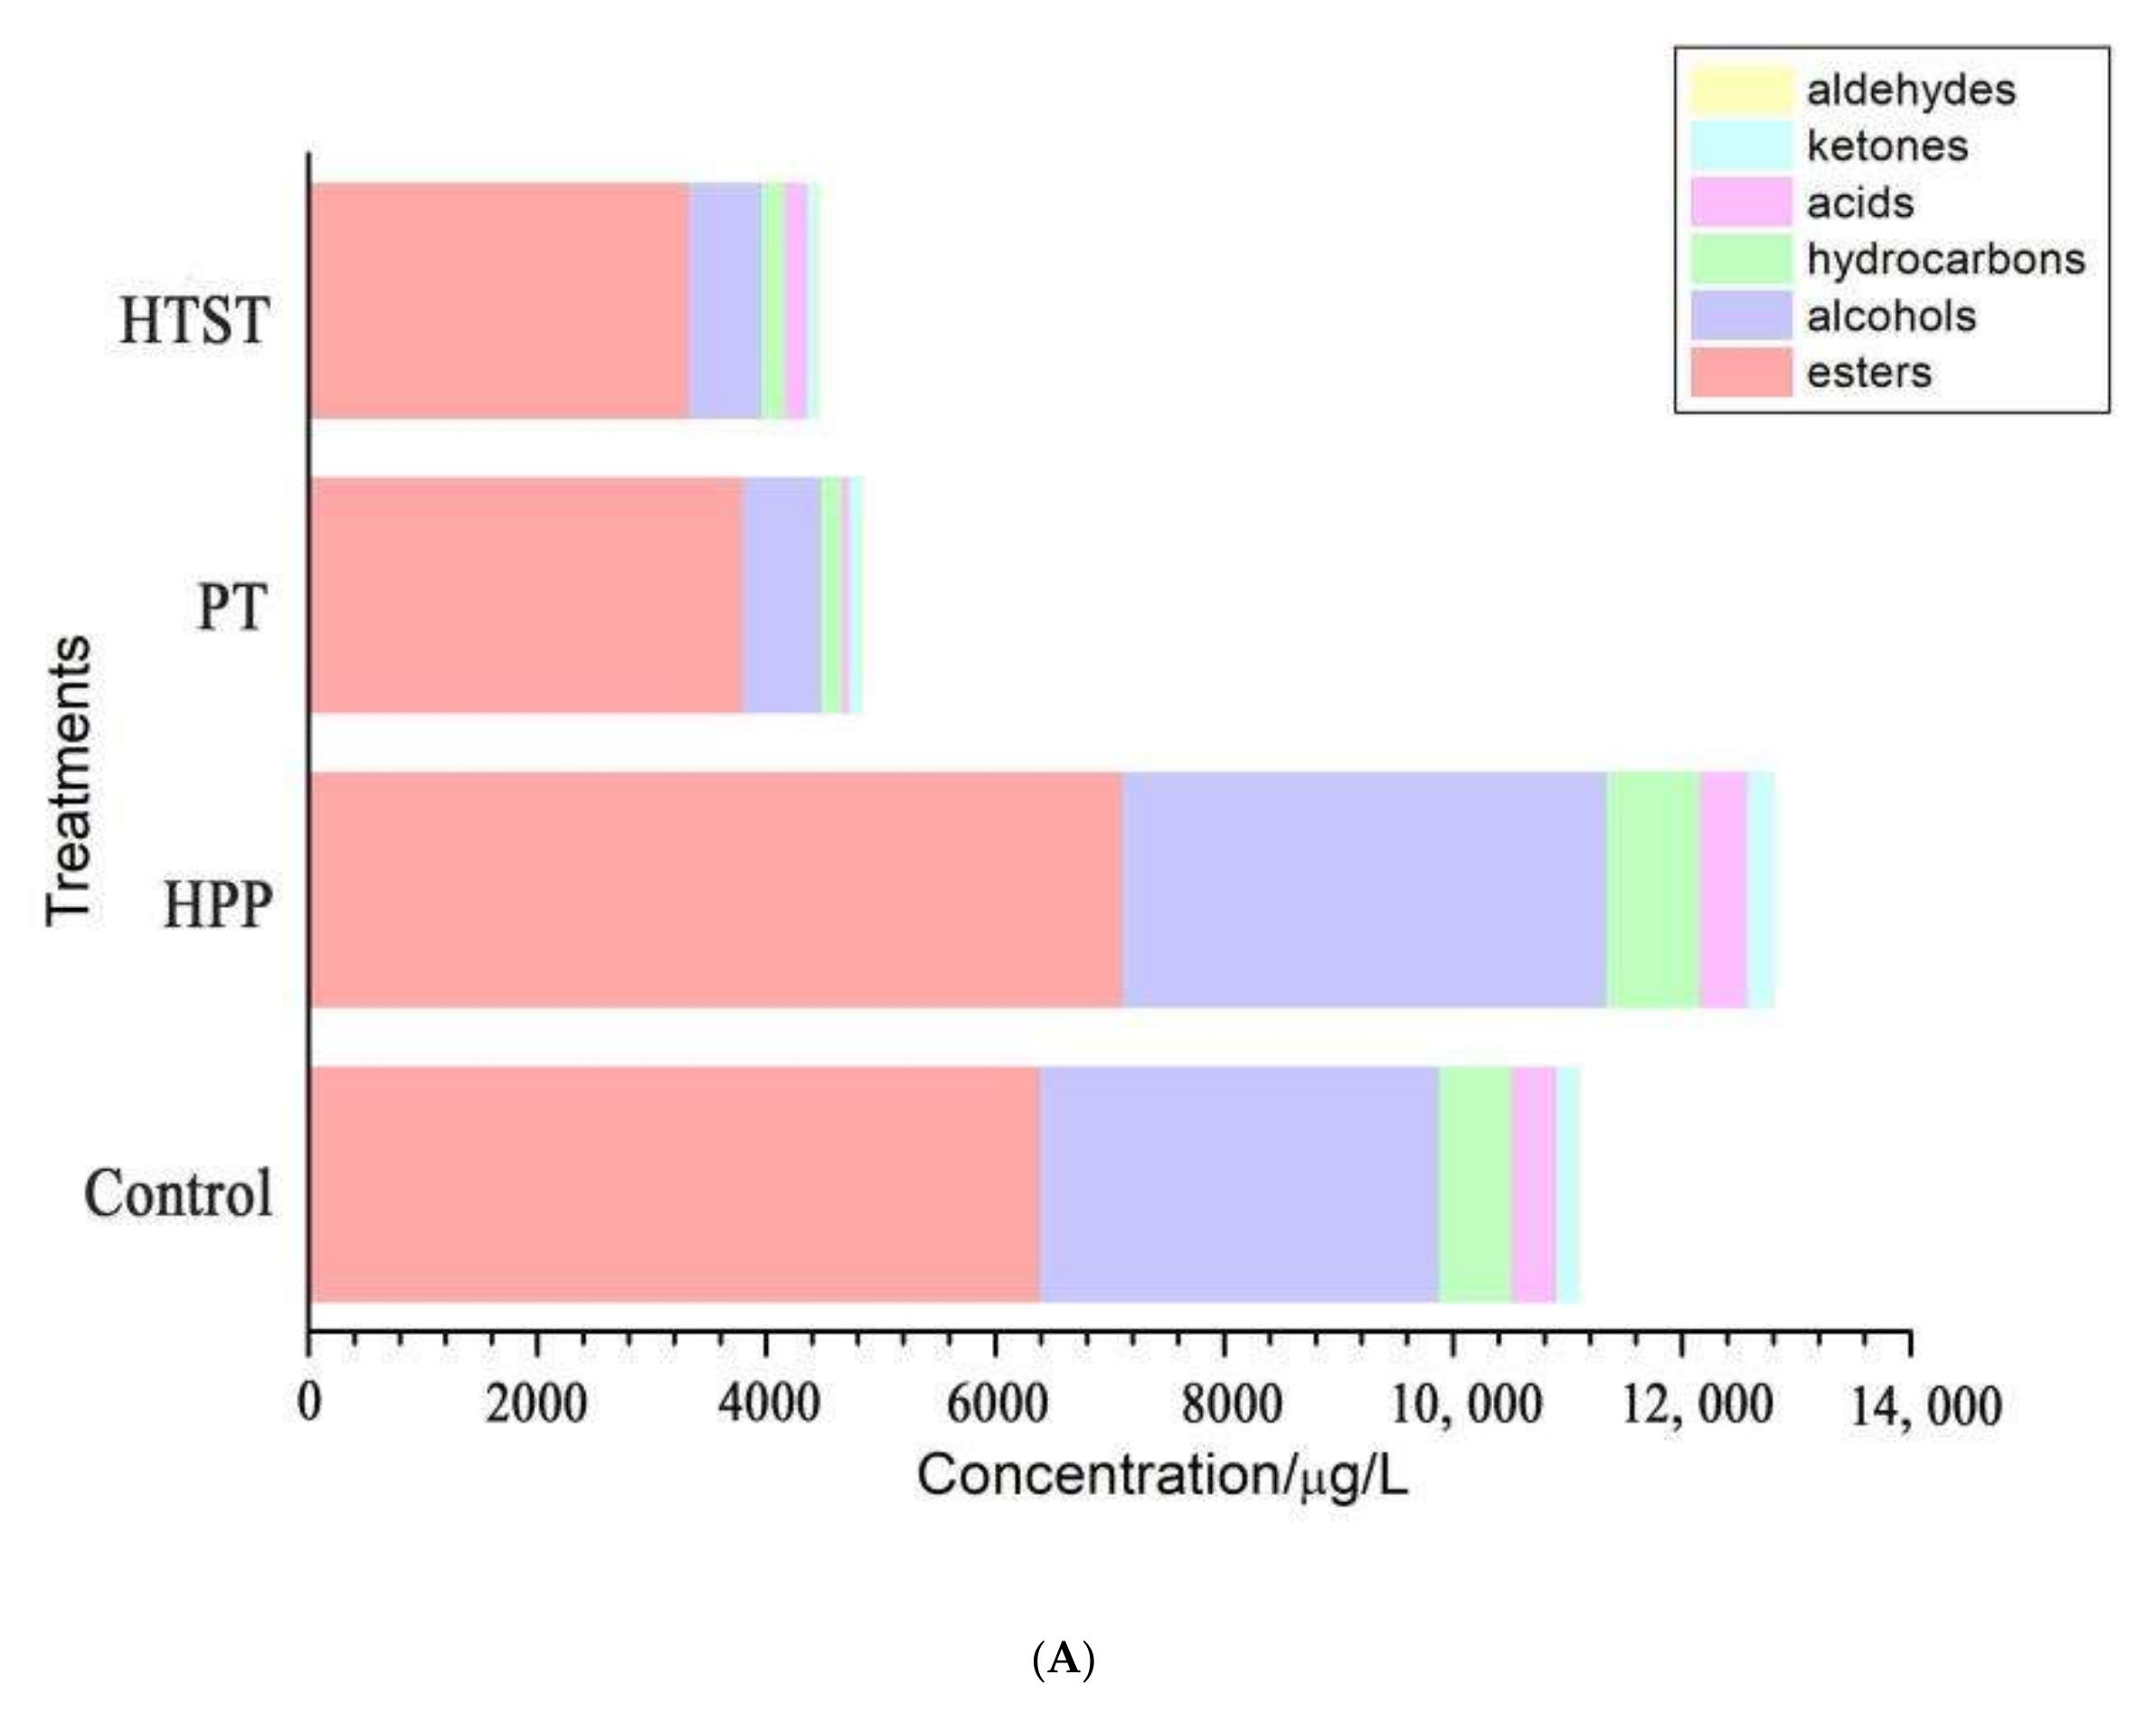
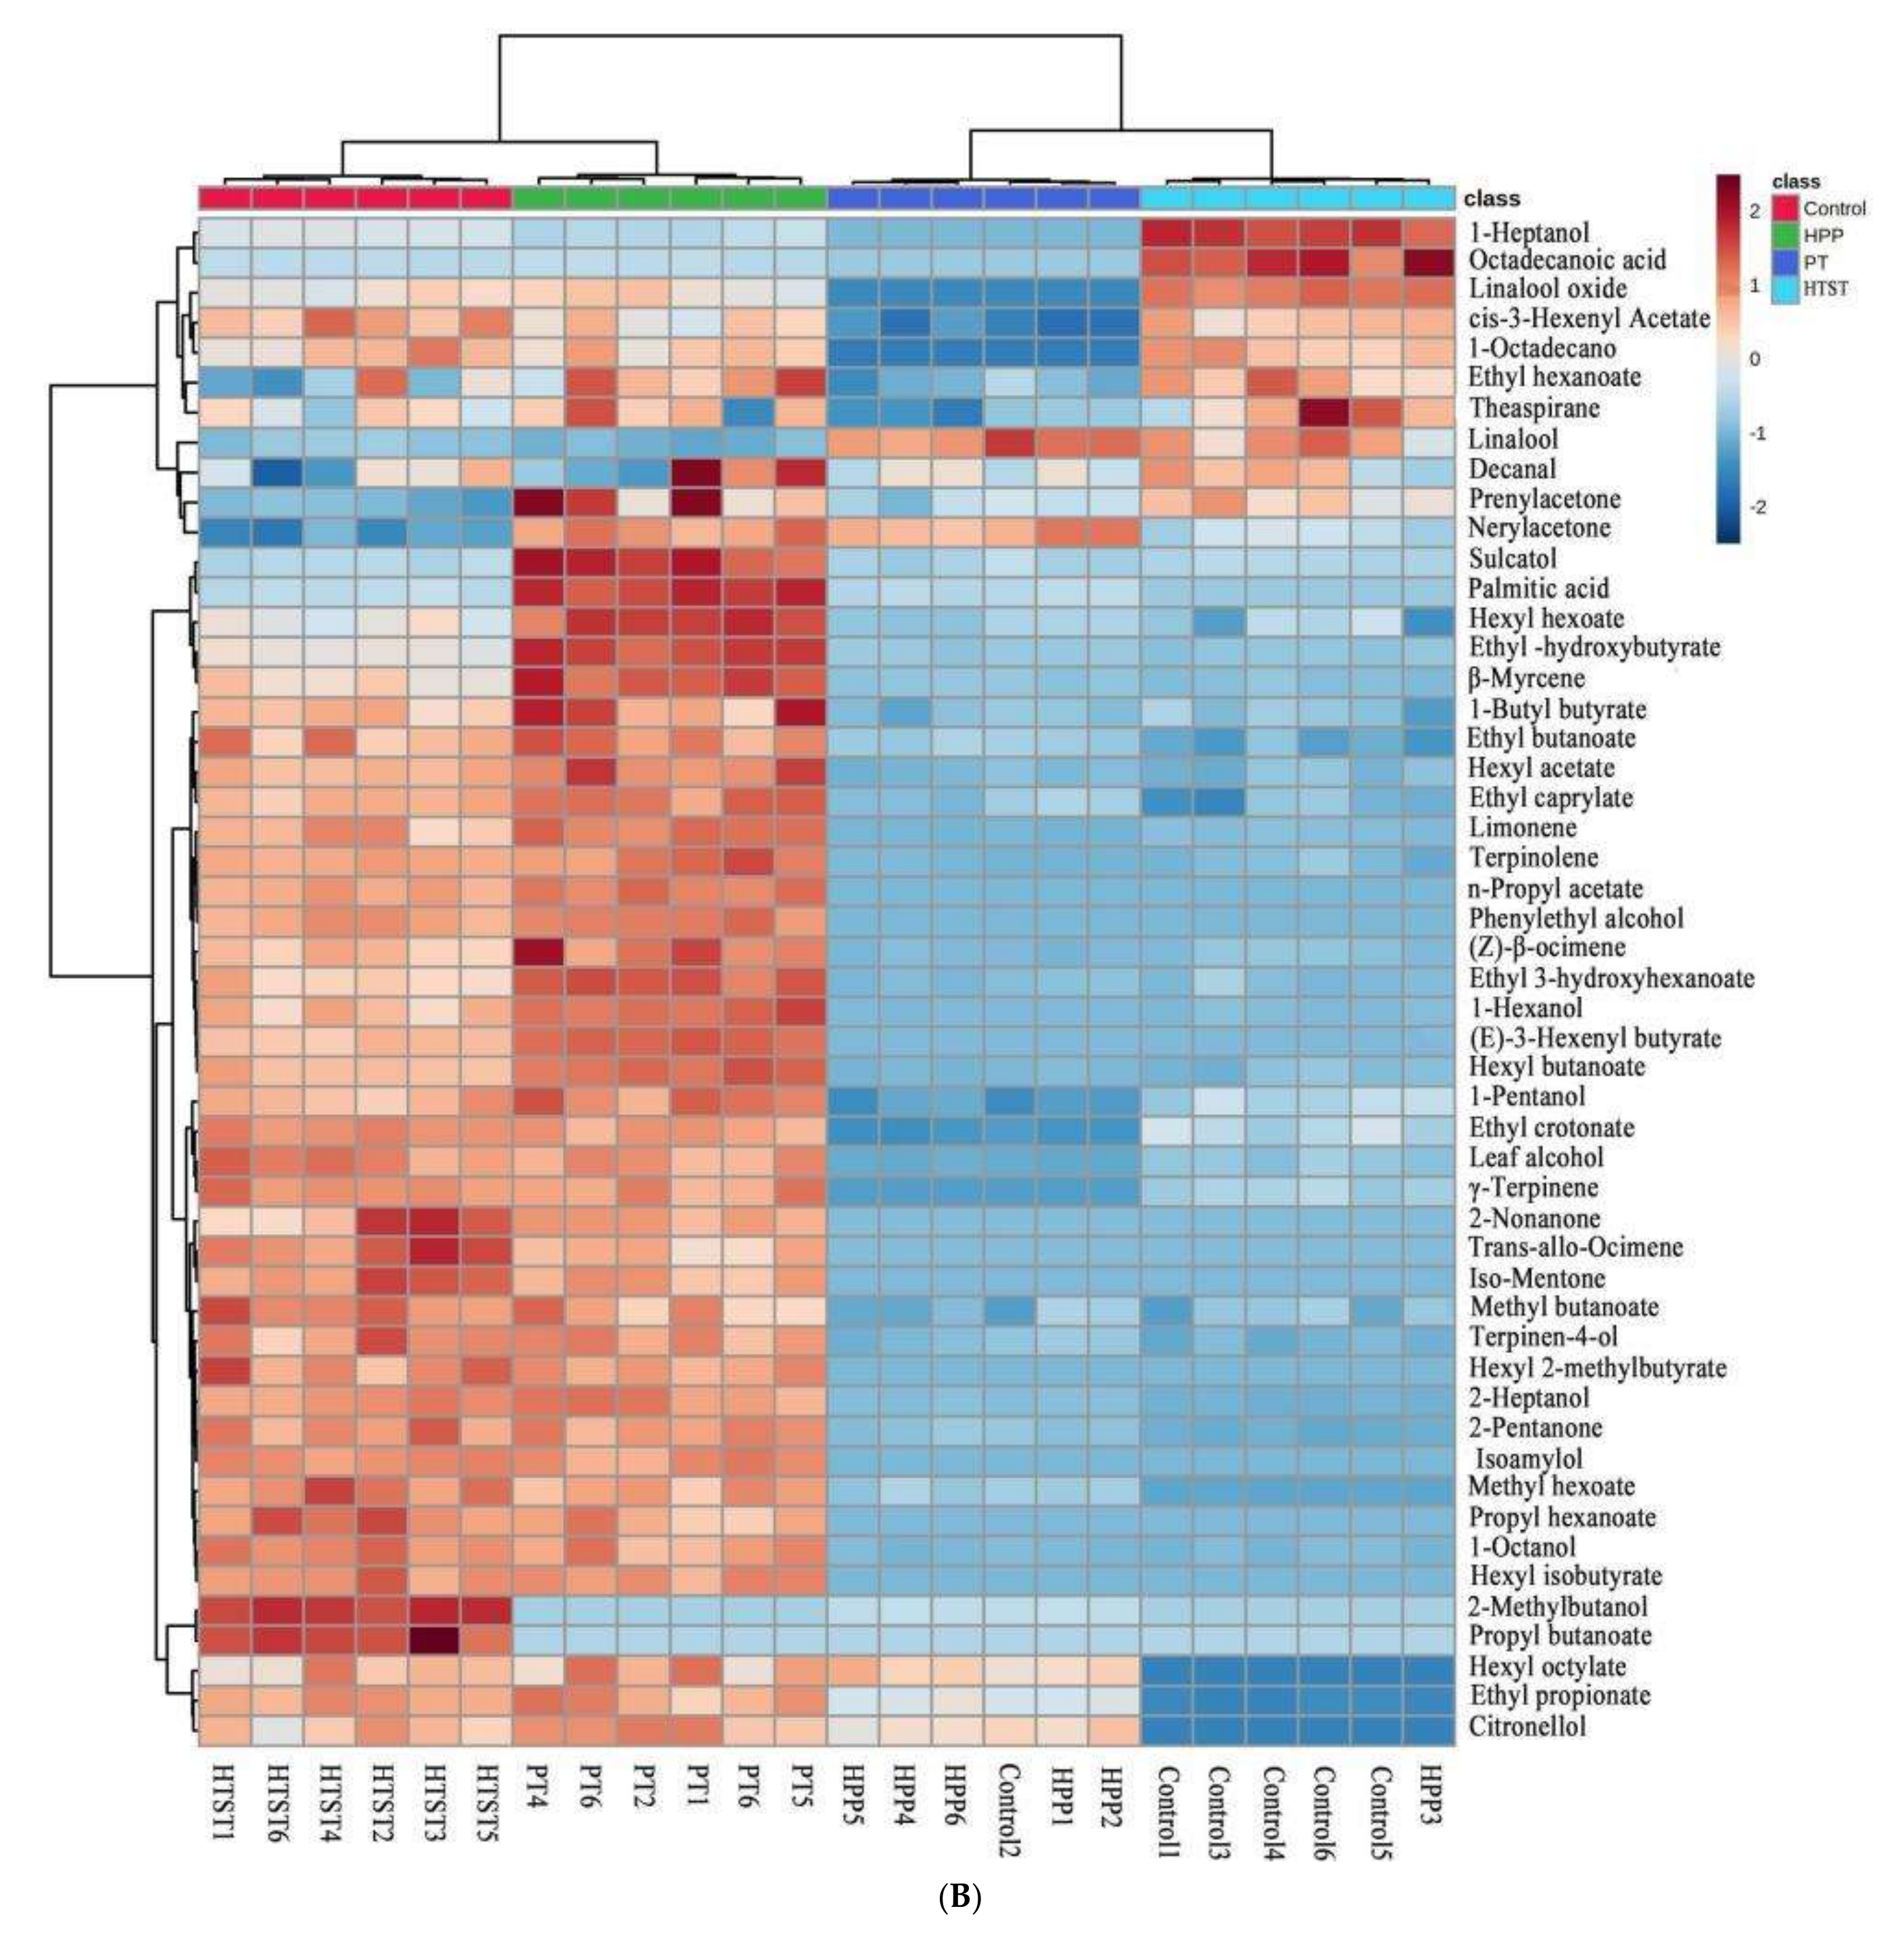
3.4. Aroma Profile
3.5. Antioxidants and Antioxidant Capacity
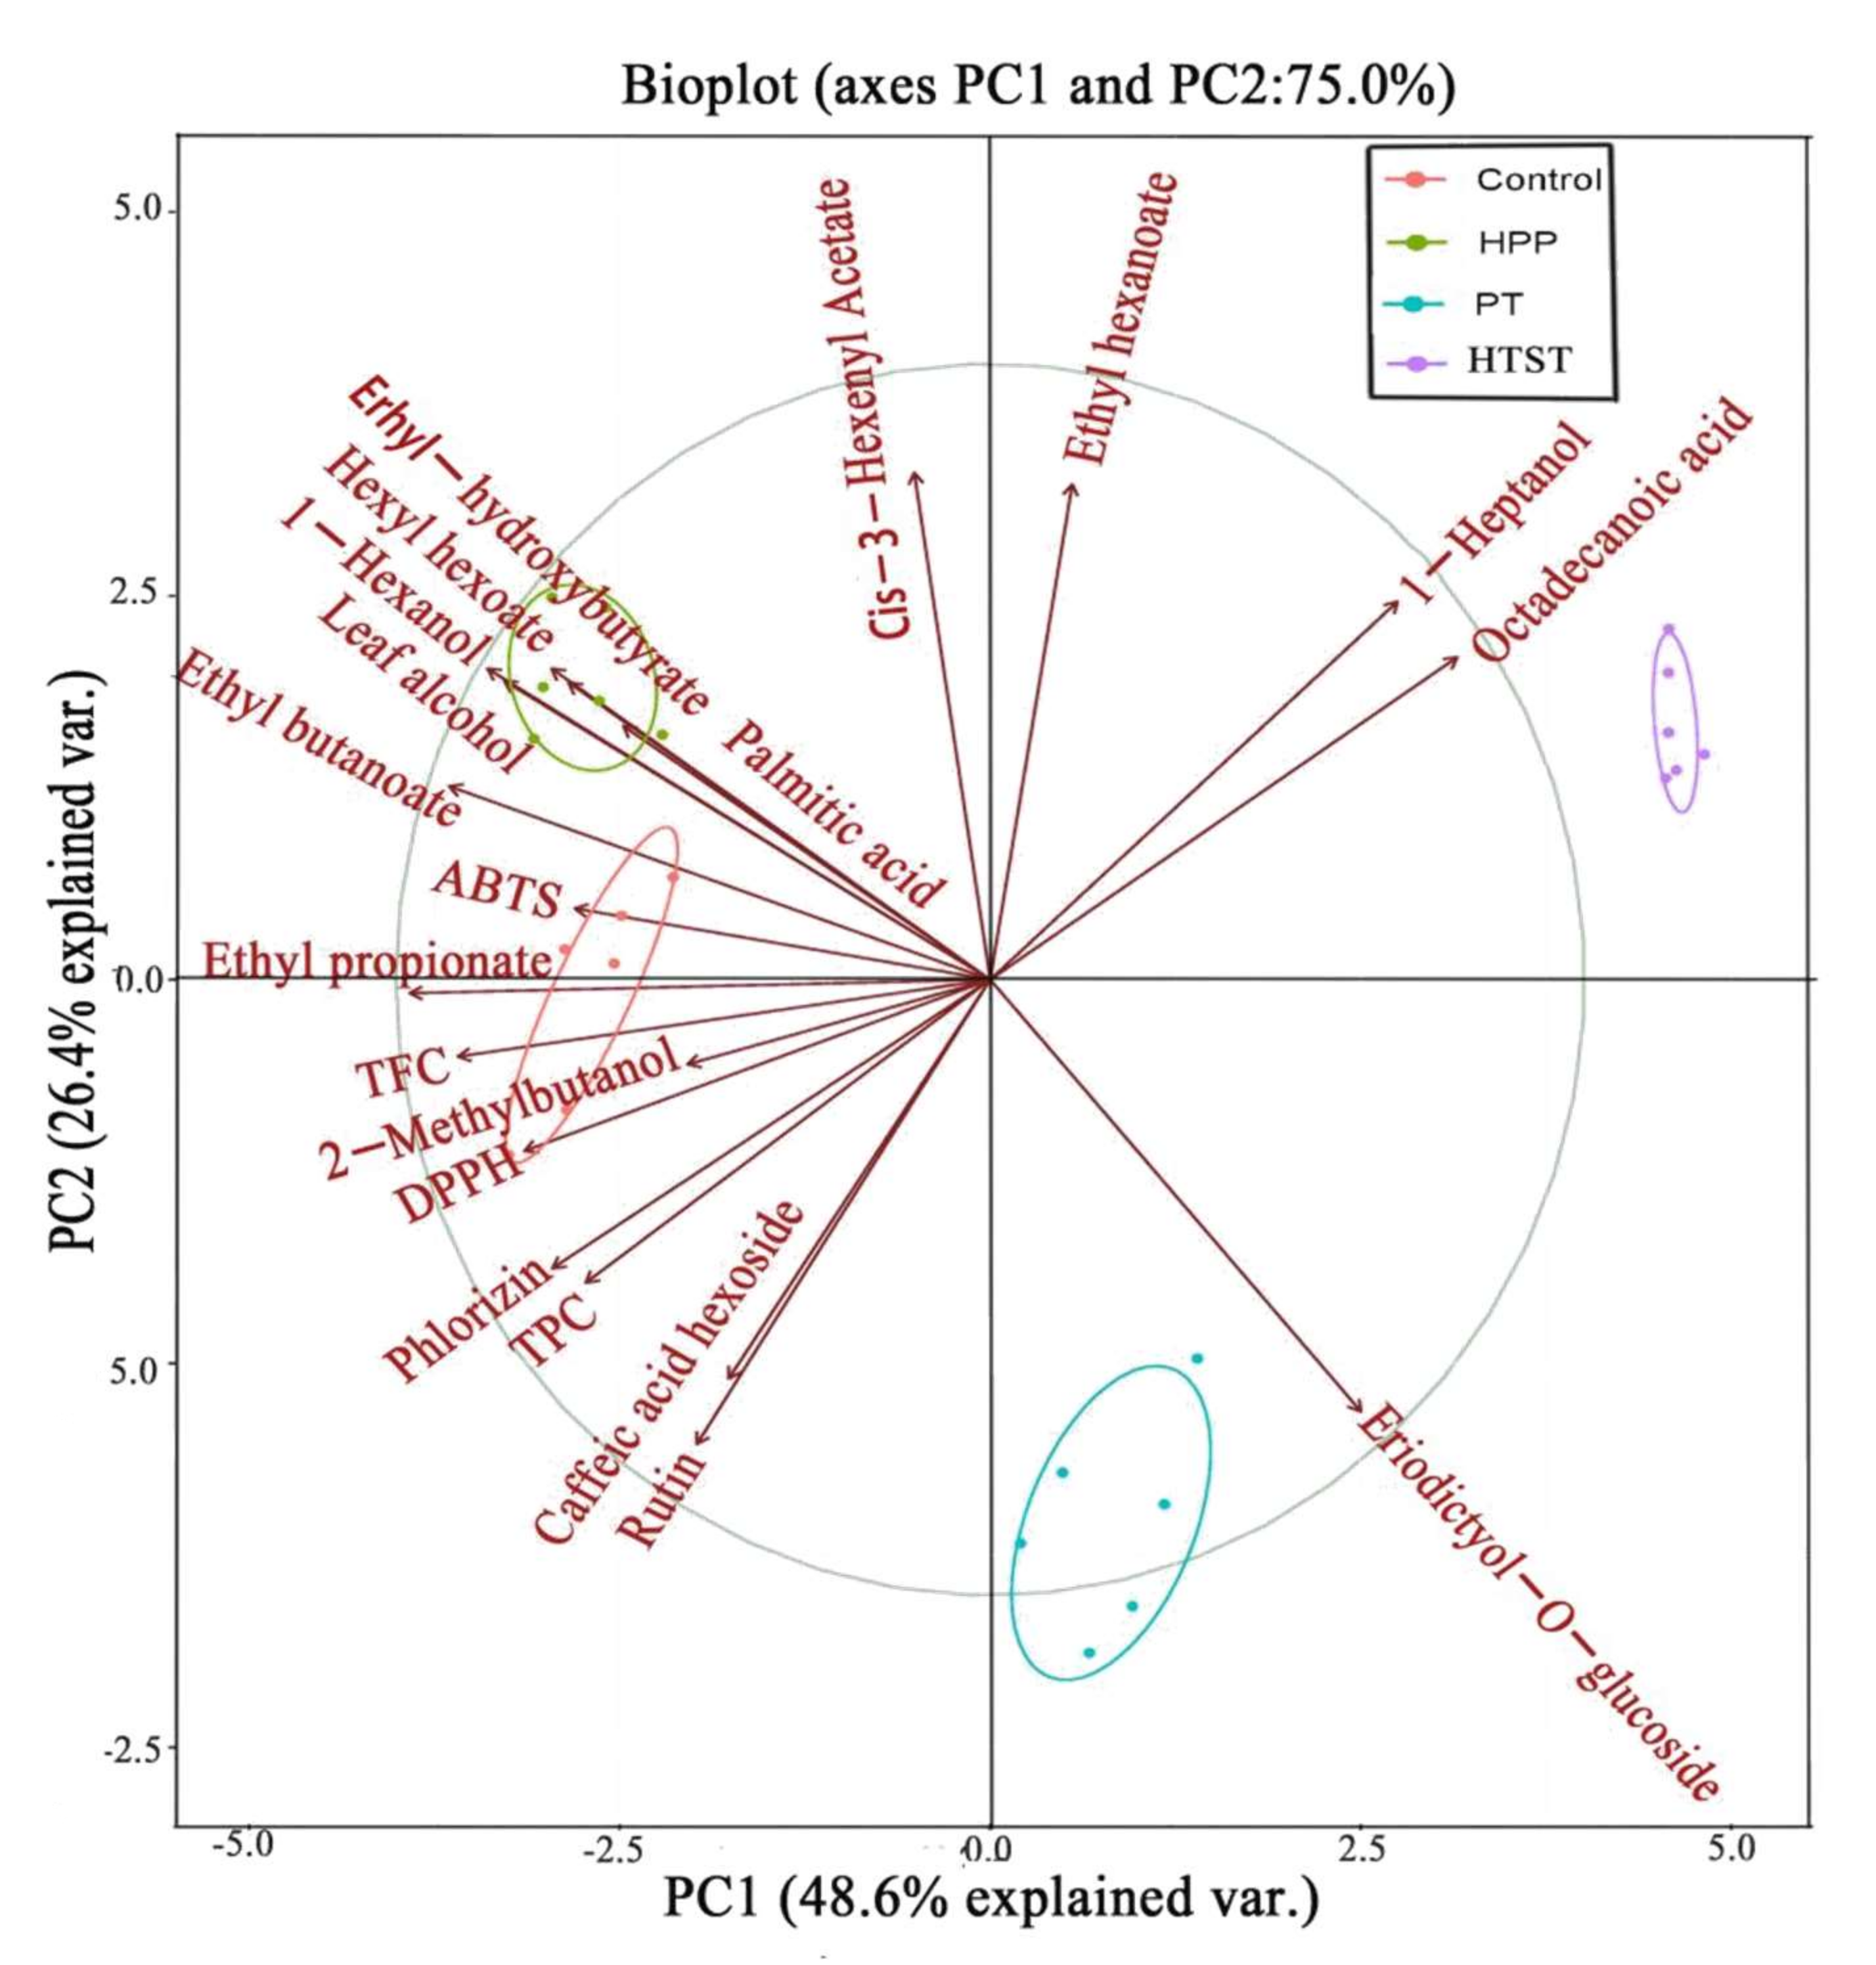
3.6. Principal Component Analysis (PCA)
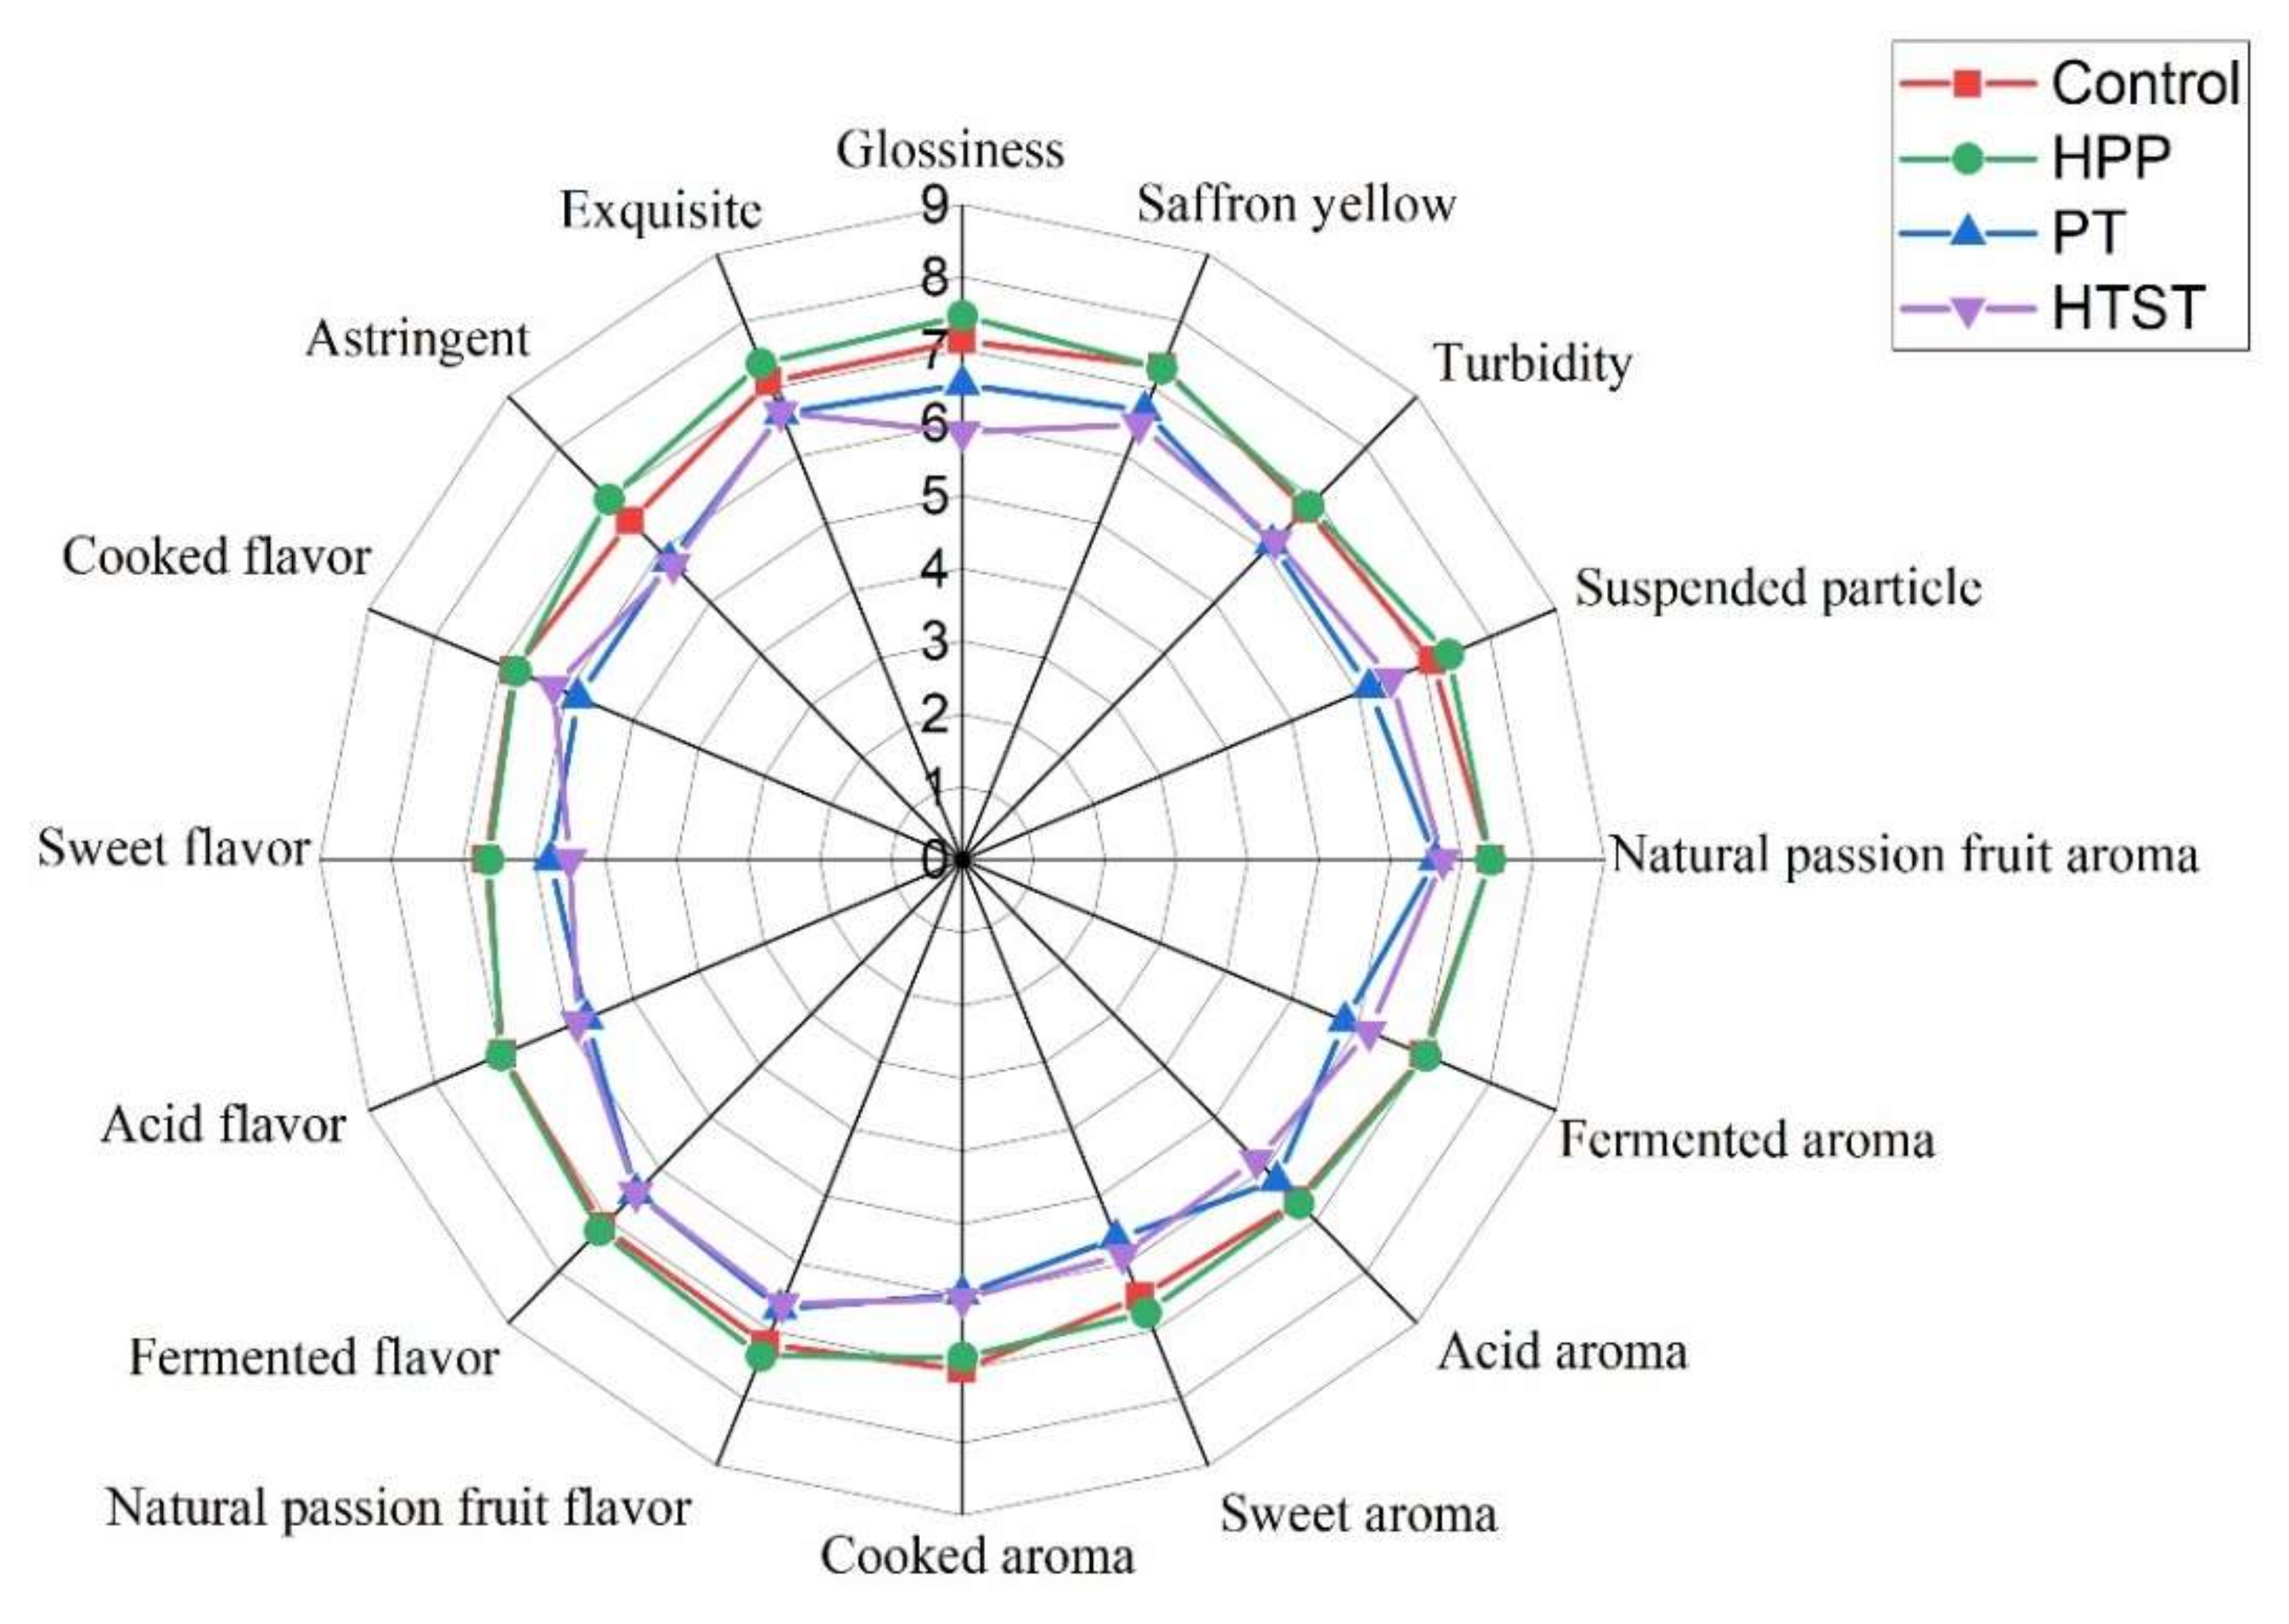
3.7. Sensory Evaluation
4. Conclusions
Supplementary Materials
Author Contributions
Funding
Data Availability Statement
Acknowledgments
Conflicts of Interest
References
- Hu, M.; Du, J.; Du, L.; Luo, Q.; Xiong, J. Anti-fatigue activity of purified anthocyanins prepared from purple passion fruit (P. edulis Sim) epicarp in mice. J. Funct. Foods 2020, 65, 103725. [Google Scholar] [CrossRef]
- Sanchez, B.A.O.; Celestino, S.M.C.; Gloria, M.B.d.A.; Celestino, I.C.; Lozada, M.I.O.; Júnior, S.D.A.; de Alencar, E.R.; de Oliveira, L.d.L. Pasteurization of passion fruit Passiflora setacea pulp to optimize bioactive compounds retention. Food Chem. X 2020, 6, 100084. [Google Scholar] [CrossRef] [PubMed]
- dos Reis, L.C.R.; Facco, E.M.P.; Salvador, M.; Flores, S.H.; Rios, A.d.O. Antioxidant potential and physicochemical characterization of yellow, purple and orange passion fruit. J. Food Sci. Technol. 2018, 55, 2679–2691. [Google Scholar] [CrossRef] [PubMed]
- Rotta, E.M.; Rodrigues, C.A.; Jardim, I.C.S.F.; Maldaner, L.; Visentainer, J.V. Determination of phenolic compounds and antioxidant activity in passion fruit pulp (Passiflora spp.) using a modified QuEChERS method and UHPLC-MS/MS. LWT 2019, 100, 397–403. [Google Scholar] [CrossRef]
- Xie, X.; Chen, C.; Fu, X. Study on the bioaccessibility of phenolic compounds and bioactivities of passion fruit juices from different regions in vitro digestion. J. Food Process. Preserv. 2021, 45, e15056. [Google Scholar] [CrossRef]
- Janzantti, N.S.; Macoris, M.S.; Garruti, D.S.; Monteiro, M. Influence of the cultivation system in the aroma of the volatile compounds and total antioxidant activity of passion fruit. LWT-Food Sci. Technol. 2012, 46, 511–518. [Google Scholar] [CrossRef]
- Porto-Figueira, P.; Freitas, A.; Cruz, C.J.; Figueira, J.; Câmara, J.S. Profiling of passion fruit volatiles: An effective tool to discriminate between species and varieties. Food Res. Int. 2015, 77, 408–418. [Google Scholar] [CrossRef]
- An, K.; Liu, H.; Fu, M.; Qian, M.C.; Yu, Y.; Wu, J.; Xiao, G.; Xu, Y. Identification of the cooked off-flavor in heat-sterilized lychee (Litchi chinensis Sonn.) juice by means of molecular sensory science. Food Chem. 2019, 301, 125282. [Google Scholar] [CrossRef]
- Laboissière, L.H.E.S.; Deliza, R.; Barros-Marcellini, A.M.; Rosenthal, A.; Camargo, L.M.A.Q.; Junqueira, R.G. Effects of high hydrostatic pressure (HHP) on sensory characteristics of yellow passion fruit juice. Innov. Food Sci. Emerg. Technol. 2007, 8, 469–477. [Google Scholar] [CrossRef]
- Sandi, D.; Chaves, J.B.P.; de Sousa, A.C.G.; Parreiras, J.F.M.; da Silva, M.T.C.; Constant, L.P.B. Hunter color dimensions, sugar content and volatile compounds in pasteurized yellow passion fruit juice (Passiflora edulis var. flavicarpa) during storage. Braz. Arch. Biol. Technol. 2004, 47, 233–245. [Google Scholar] [CrossRef]
- Prasertsri, P.; Booranasuksakul, U.; Naravoratham, K.; Trongtosak, P. Acute Effects of Passion Fruit Juice Supplementation on Cardiac Autonomic Function and Blood Glucose in Healthy Subjects. Prev. Nutr. Food Sci. 2019, 24, 245–253. [Google Scholar] [CrossRef]
- Xu, X.; Deng, J.; Luo, D.; Bao, Y.; Liao, X.; Gao, H.; Wu, J. Comparative study of high hydrostatic pressure and high temperature short time processing on quality of clear and cloudy Se-enriched kiwifruit juices. Innov. Food Sci. Emerg. Technol. 2018, 49, 1–12. [Google Scholar] [CrossRef]
- Hu, Y.-H.; Wang, C.-Y.; Chen, B.-Y. Effects of high-pressure processing and thermal pasteurization on quality and microbiological safety of jabuticaba (Myrciaria cauliflora) juice during cold storage. J. Food Sci. Technol. 2020, 57, 3334–3344. [Google Scholar] [CrossRef] [PubMed]
- Pan, X.; Wu, J.; Zhang, W.; Liu, J.; Yang, X.; Liao, X.; Hu, X.; Lao, F. Effects of sugar matrices on the release of key aroma compounds in fresh and high hydrostatic pressure processed Tainong mango juices. Food Chem. 2021, 338, 128117. [Google Scholar] [CrossRef]
- Rodríguez-Roque, M.J.; de Ancos, B.; Sánchez-Moreno, C.; Cano, M.P.; Elez-Martínez, P.; Martín-Belloso, O. Impact of food matrix and processing on the in vitro bioaccessibility of vitamin C, phenolic compounds, and hydrophilic antioxidant activity from fruit juice-based beverages. J. Funct. Foods 2015, 14, 33–43. [Google Scholar] [CrossRef] [Green Version]
- Cheng, C.X.; Jia, M.; Gui, Y.; Ma, Y. Comparison of the effects of novel processing technologies and conventional thermal pasteurisation on the nutritional quality and aroma of Mandarin (Citrus unshiu) juice. Innov. Food Sci. Emerg. Technol. 2020, 64, 102425. [Google Scholar] [CrossRef]
- Wibowo, S.; Essel, E.A.; De Man, S.; Bernaert, N.; Van Droogenbroeck, B.; Grauwet, T.; Van Loey, A.; Hendrickx, M. Comparing the impact of high pressure, pulsed electric field and thermal pasteurization on quality attributes of cloudy apple juice using targeted and untargeted analyses. Innov. Food Sci. Emerg. Technol. 2019, 54, 64–77. [Google Scholar] [CrossRef]
- You, Y.; Li, N.; Han, X.; Guo, J.; Zhao, Y.; Liu, G.; Huang, W.; Zhan, J. Influence of different sterilization treatments on the color and anthocyanin contents of mulberry juice during refrigerated storage. Innov. Food Sci. Emerg. Technol. 2018, 48, 1–10. [Google Scholar] [CrossRef]
- Yi, J.; Kebede, B.T.; Dang, D.N.H.; Buve, C.; Grauwet, T.; Van Loey, A.; Hu, X.; Hendrickx, M. Quality change during high pressure processing and thermal processing of cloudy apple juice. LWT 2017, 75, 85–92. [Google Scholar] [CrossRef]
- Porretta, S.; Sandei, L.; Crucitt, P.M.; Poli, G.; Attolini, M.G. Comparison of the main analytical methods used in quality control of tomato paste. Int. J. Food Sci. Technol. 1992, 27, 145–152. [Google Scholar] [CrossRef]
- Pham, H.T.T.; Kityo, P.; Buvé, C.; Hendrickx, M.E.; Van Loey, A.M. Influence of pH and Composition on Nonenzymatic Browning of Shelf-Stable Orange Juice during Storage. J. Agric. Food Chem. 2020, 68, 5402–5411. [Google Scholar] [CrossRef] [PubMed]
- Liu, F.; Li, R.; Wang, Y.; Bi, X.; Liao, X. Effects of high hydrostatic pressure and high-temperature short-time on mango nectars: Changes in microorganisms, acid invertase, 5-hydroxymethylfurfural, sugars, viscosity, and cloud. Innov. Food Sci. Emerg. Technol. 2014, 22, 22–30. [Google Scholar] [CrossRef]
- Cao, X.; Cai, C.; Wang, Y.; Zheng, X. Effects of Ultrasound Processing on Physicochemical Parameters, Antioxidants, and Color Quality of Bayberry Juice. J. Food Qual. 2019, 2019, 7917419. [Google Scholar] [CrossRef] [Green Version]
- Kieling, D.D.; Barbosa-Cnovas, G.V.; Prudencio, S.H. Effects of high pressure processing on the physicochemical and microbiological parameters, bioactive compounds, and antioxidant activity of a lemongrass-lime mixed beverage. J. Food Sci. Technol. 2019, 56, 409–419. [Google Scholar] [CrossRef] [PubMed]
- Wang, J.; Vanga, S.K.; Raghavan, V. High-intensity ultrasound processing of kiwifruit juice: Effects on the ascorbic acid, total phenolics, flavonoids and antioxidant capacity. LWT 2019, 107, 299–307. [Google Scholar] [CrossRef]
- Giuffrida, D.; Cacciola, F.; Mapelli-Brahm, P.; Stinco, C.M.; Dugo, P.; Oteri, M.; Mondello, L.; Meléndez-Martínez, A.J. Free carotenoids and carotenoids esters composition in Spanish orange and mandarin juices from diverse varieties. Food Chem. 2019, 300, 125139. [Google Scholar] [CrossRef] [PubMed]
- Jayachandran, L.E.; Chakraborty, S.; Rao, P.S. Inactivation Kinetics of the Most Baro-Resistant Enzyme in High Pressure Processed Litchi-Based Mixed Fruit Beverage. Food Bioprocess Technol. 2016, 9, 1135–1147. [Google Scholar] [CrossRef]
- Wu, W.; Xiao, G.; Yu, Y.; Xu, Y.; Wu, J.; Peng, J.; Li, L. Effects of high pressure and thermal processing on quality properties and volatile compounds of pineapple fruit juice. Food Control 2021, 130, 108293. [Google Scholar] [CrossRef]
- Vervoort, L.; Van der Plancken, I.; Grauwet, T.; Timmermans, R.A.H.; Mastwijk, H.C.; Matser, A.M.; Hendrickx, M.E.; Van Loey, A. Comparing equivalent thermal, high pressure and pulsed electric field processes for mild pasteurization of orange juice. Part II: Impact on specific chemical and biochemical quality parameters. Innov. Food Sci. Emerg. Technol. 2011, 12, 466–477. [Google Scholar] [CrossRef]
- Takayanagi, T.; Yokotsuka, K. Relationship between sucrose accumulation and sucrose-metabolizing enzymes in developing grapes. Am. J. Enol. Vitic. 1997, 48, 403–407. [Google Scholar]
- Oey, I.; Lille, M.; Van Loey, A.; Hendrickx, M. Effect of high-pressure processing on colour, texture and flavour of fruit- and vegetable-based food products: A review. Trends Food Sci. Technol. 2008, 19, 320–328. [Google Scholar] [CrossRef]
- Li, C.; Xin, M.; Li, L.; He, X.; Yi, P.; Tang, Y.; Li, J.; Zheng, F.; Liu, G.; Sheng, J.; et al. Characterization of the aromatic profile of purple passion fruit (Passiflora edulis Sims) during ripening by HS-SPME-GC/MS and RNA sequencing. Food Chem. 2021, 355, 129685. [Google Scholar] [CrossRef] [PubMed]
- Janzantti, N.S.; Monteiro, M. Changes in the aroma of organic passion fruit (Passiflora edulis Sims F. flavicarpa Deg.) during ripeness. LWT-Food Sci. Technol. 2014, 59, 612–620. [Google Scholar] [CrossRef] [Green Version]
- Wang, L.; Deng, W.; Wang, P.; Huang, W.; Wu, J.; Zheng, T.; Chen, J. Degradations of aroma characteristics and changes of aroma related compounds, PPO activity, and antioxidant capacity in sugarcane juice during thermal process. J. Food Sci. 2020, 85, 1140–1150. [Google Scholar] [CrossRef] [PubMed]
- González-Cebrino, F.; García-Parra, J.; Ramírez, R. Aroma profile of a red plum purée processed by high hydrostatic pressure and analysed by SPME–GC/MS. Innov. Food Sci. Emerg. Technol. 2016, 33, 108–114. [Google Scholar] [CrossRef] [Green Version]
- Kebede, B.T.; Grauwet, T.; Palmers, S.; Vervoort, L.; Carle, R.; Hendrickx, M.; Van Loey, A. Effect of high pressure high temperature processing on the volatile fraction of differently coloured carrots. Food Chem. 2014, 153, 340–352. [Google Scholar] [CrossRef] [PubMed]
- Chen, L.; Wang, W.; Zhang, J.; Cui, H.; Ni, D.; Jiang, H. Dual effects of ascorbic acid on the stability of EGCG by the oxidation product dehydroascorbic acid promoting the oxidation and inhibiting the hydrolysis pathway. Food Chem. 2021, 337, 127639. [Google Scholar] [CrossRef]
- Li, M.; Chen, X.; Deng, J.; Ouyang, D.; Wang, D.; Liang, Y.; Chen, Y.; Sun, Y. Effect of thermal processing on free and bound phenolic compounds and antioxidant activities of hawthorn. Food Chem. 2020, 332, 127429. [Google Scholar] [CrossRef]
- Zhang, W.; Liang, L.; Pan, X.; Lao, F.; Liao, X.; Wu, J. Alterations of phenolic compounds in red raspberry juice induced by high-hydrostatic-pressure and high-temperature short-time processing. Innov. Food Sci. Emerg. Technol. 2021, 67, 102569. [Google Scholar] [CrossRef]
- Jiao, Y.; Reuss, L.; Wang, Y. β-Cryptoxanthin: Chemistry, Occurrence, and Potential Health Benefits. Curr. Pharmacol. Rep. 2019, 5, 20–34. [Google Scholar] [CrossRef]
- Yan, B.; Martinez-Monteagudo, S.I.; Cooperstone, J.L.; Riedl, K.M.; Schwartz, S.J.; Balasubramaniam, V.M. Impact of Thermal and Pressure-Based Technologies on Carotenoid Retention and Quality Attributes in Tomato Juice. Food Bioprocess Technol. 2017, 10, 808–818. [Google Scholar] [CrossRef]
- Huang, W.; Bi, X.; Zhang, X.; Liao, X.; Hu, X.; Wu, J. Comparative study of enzymes, phenolics, carotenoids and color of apricot nectars treated by high hydrostatic pressure and high temperature short time. Innov. Food Sci. Emerg. Technol. 2013, 18, 74–82. [Google Scholar] [CrossRef]

| Treatments | TAB (log CFU/mL) | Y&M (log CFU/mL) | PPO (%) | POD (%) |
|---|---|---|---|---|
| Control | 3.89 ± 0.30 | 2.16 ± 0.11 | 100.00 ± 28.78 a | 100.00 ± 4.24 a |
| HPP | nd | nd | 30.77 ± 10.88 b | 85.42 ± 1.72 ab |
| PT | nd | nd | 0.00 ± 0.00 b | 55.56 ± 0.92 c |
| HTST | nd | nd | 0.00 ± 0.00 b | 53.86 ± 1.04 c |
| Treatments | TSS (°Brix) | TS (g/100 g) | Reducing Sugars | Non-Reducing Sugar | pH | TA (g/100 g) | Organic Acids | ||||||
|---|---|---|---|---|---|---|---|---|---|---|---|---|---|
| Fructose (g/L) | Glucose (g/L) | Sucrose (g/L) | Oxalic Acid (mg/mL) | Malic Acid (mg/mL) | Lactic Acid (mg/mL) | Acetic Acid (mg/mL) | Citric acid (mg/mL) | Quinic Acid (mg/mL) | |||||
| Control | 12.46 ± 0.04 a | 11.89 ± 0.30 a | 112.36 ± 2.93 a | 121.16 ± 2.69 a | 315.56 ± 5.79 a | 3.02 ± 0.03 a | 5.80 ± 0.12 a | 0.56 ± 0.03 a | 2.53 ± 0.09 ab | 2.31 ± 0.21 a | 0.30 ± 0.02 a | 25.90 ± 1.82 a | 0.07 ± 0.01 a |
| HPP | 12.60 ± 0.08 a | 12.26 ± 0.61 a | 109.08 ± 6.37 ab | 120.94 ± 4.55 a | 315.67 ± 9.18 a | 3.04 ± 0.01 a | 5.73 ± 0.31 a | 0.59 ± 0.01 a | 2.37 ± 0.09 b | 1.00 ± 0.04 b | 0.31 ± 0.04 a | 24.85 ± 0.79 a | 0.06 ± 0.01 a |
| PT | 12.60 ± 0.21 a | 12.09 ± 0.47 a | 105.8 ± 11.32 ab | 116.54 ± 5.02 a | 324.95 ± 5.47 a | 3.04 ± 0.05 a | 5.31 ± 0.47 a | 0.26 ± 0.01 b | 2.36 ± 0.16 b | 1.25 ± 0.09 b | 0.31 ± 0.01 a | 25.40 ± 0.79 a | 0.07 ± 0.01 a |
| HTST | 12.56 ± 0.04 a | 11.85 ± 0.38 a | 86.59 ± 5.61 b | 101.09 ± 5.06 b | 358.44 ± 8.88 b | 3.04 ± 0.08 a | 6.01 ± 0.38 a | 0.29 ± 0.02 b | 2.84 ± 0.17 a | 1.49 ± 0.21 b | 0.49 ± 0.15 a | 29.78 ± 2.43 a | 0.08 ± 0.01 a |
| Treatments | Color Characteristics | |||
|---|---|---|---|---|
| L* | a* | b* | ΔE | |
| Control | 59.21 ± 1.25 b | 11.94 ± 0.32 a | 62.70 ± 0.45 ab | 0.00 ± 0.15 c |
| HPP | 60.78 ± 0.80 ab | 11.64 ± 0.40 a | 61.68 ± 0.91 b | 2.26 ± 0.06 b |
| PT | 61.92 ± 0.19 ab | 10.77 ± 0.65 a | 64.30 ± 0.30 a | 3.01 ± 0.39 a |
| HTST | 62.37 ± 0.36 a | 11.08 ± 0.67 a | 63.11 ± 0.13 ab | 3.06 ± 0.08 a |
| Treatments | Control | HPP | PT | HTST |
|---|---|---|---|---|
| TPC(mg GAE/L) | 1047.07 ± 18.67 a | 960.55 ± 16.20 bc | 1000.15 ± 45.63 ab | 907.76 ± 20.43 c |
| TFC (mg RE/L) | 172.98 ± 14.12 a | 189.78 ± 10.64 a | 168.11 ± 3.89 a | 132.40 ± 7.79 b |
| Vitamin C (mg/mL) | 251.68 ± 1.03 a | 238.94 ± 8.84 ab | 230.51 ± 9.02 ab | 223.80 ± 4.53 b |
| AA (mg/mL) | 122.26 ± 2.86 a | 113.54 ± 2.68 a | 70.65 ± 6.91 b | 59.36 ± 8.17 b |
| DHAA (mg/mL) | 129.42 ± 2.98 b | 125.40 ± 6.59 b | 159.86 ± 15.87 a | 164.44 ± 3.73 a |
| β-carotene (µg/mL) | 24.68 ± 1.57 a | 25.15 ± 3.57 a | 22.39 ± 1.73 ab | 16.30 ± 2.48 b |
| Zeaxanthin (µg/mL) | 25.55 ± 3.16 b | 40.05 ± 4.07 a | 28.87 ± 2.52 b | 25.88 ± 2.14 b |
| β-cryptoxanthin (µg/mL) | 45.36 ± 2.88 a | 27.55 ± 1.31 b | 10.78 ± 1.13 c | 9.19 ± 0.68 c |
| Lycopene (µg/mL) | 2.48 ± 0.21 a | 2.58 ± 0.08 a | 2.13 ± 0.21 a | 2.50 ± 0.12 a |
| Total carotene (µg/mL) | 98.07 ± 1.86 a | 95.33 ± 1.02 a | 64.17 ± 1.98 b | 53.88 ± 1.48 c |
| DPPH (µmol/L) | 4510.00 ± 149.00 a | 3533.33 ± 62.36 b | 3400.00 ± 177.95 b | 2900.00 ± 163.30 c |
| ABTS•+ (µmol/L) | 3275.15 ± 186.80 a | 2796.36 ± 262.64 b | 2523.64 ± 126.84 b | 2309.70 ± 66.94 c |
Publisher’s Note: MDPI stays neutral with regard to jurisdictional claims in published maps and institutional affiliations. |
© 2022 by the authors. Licensee MDPI, Basel, Switzerland. This article is an open access article distributed under the terms and conditions of the Creative Commons Attribution (CC BY) license (https://creativecommons.org/licenses/by/4.0/).
Share and Cite
Niu, H.; Yuan, L.; Zhou, H.; Yun, Y.; Li, J.; Tian, J.; Zhong, K.; Zhou, L. Comparison of the Effects of High Pressure Processing, Pasteurization and High Temperature Short Time on the Physicochemical Attributes, Nutritional Quality, Aroma Profile and Sensory Characteristics of Passion Fruit Purée. Foods 2022, 11, 632. https://doi.org/10.3390/foods11050632
Niu H, Yuan L, Zhou H, Yun Y, Li J, Tian J, Zhong K, Zhou L. Comparison of the Effects of High Pressure Processing, Pasteurization and High Temperature Short Time on the Physicochemical Attributes, Nutritional Quality, Aroma Profile and Sensory Characteristics of Passion Fruit Purée. Foods. 2022; 11(5):632. https://doi.org/10.3390/foods11050632
Chicago/Turabian StyleNiu, Huihui, Lei Yuan, Hengle Zhou, Yurou Yun, Jian Li, Jun Tian, Kui Zhong, and Linyan Zhou. 2022. "Comparison of the Effects of High Pressure Processing, Pasteurization and High Temperature Short Time on the Physicochemical Attributes, Nutritional Quality, Aroma Profile and Sensory Characteristics of Passion Fruit Purée" Foods 11, no. 5: 632. https://doi.org/10.3390/foods11050632
APA StyleNiu, H., Yuan, L., Zhou, H., Yun, Y., Li, J., Tian, J., Zhong, K., & Zhou, L. (2022). Comparison of the Effects of High Pressure Processing, Pasteurization and High Temperature Short Time on the Physicochemical Attributes, Nutritional Quality, Aroma Profile and Sensory Characteristics of Passion Fruit Purée. Foods, 11(5), 632. https://doi.org/10.3390/foods11050632