
Linking Temporal Dominance of Sensations for Primary-Sensory and Multi-Sensory Attributes Using Canonical Correlation Analysis


Abstract
:1. Introduction
2. Method for Modeling
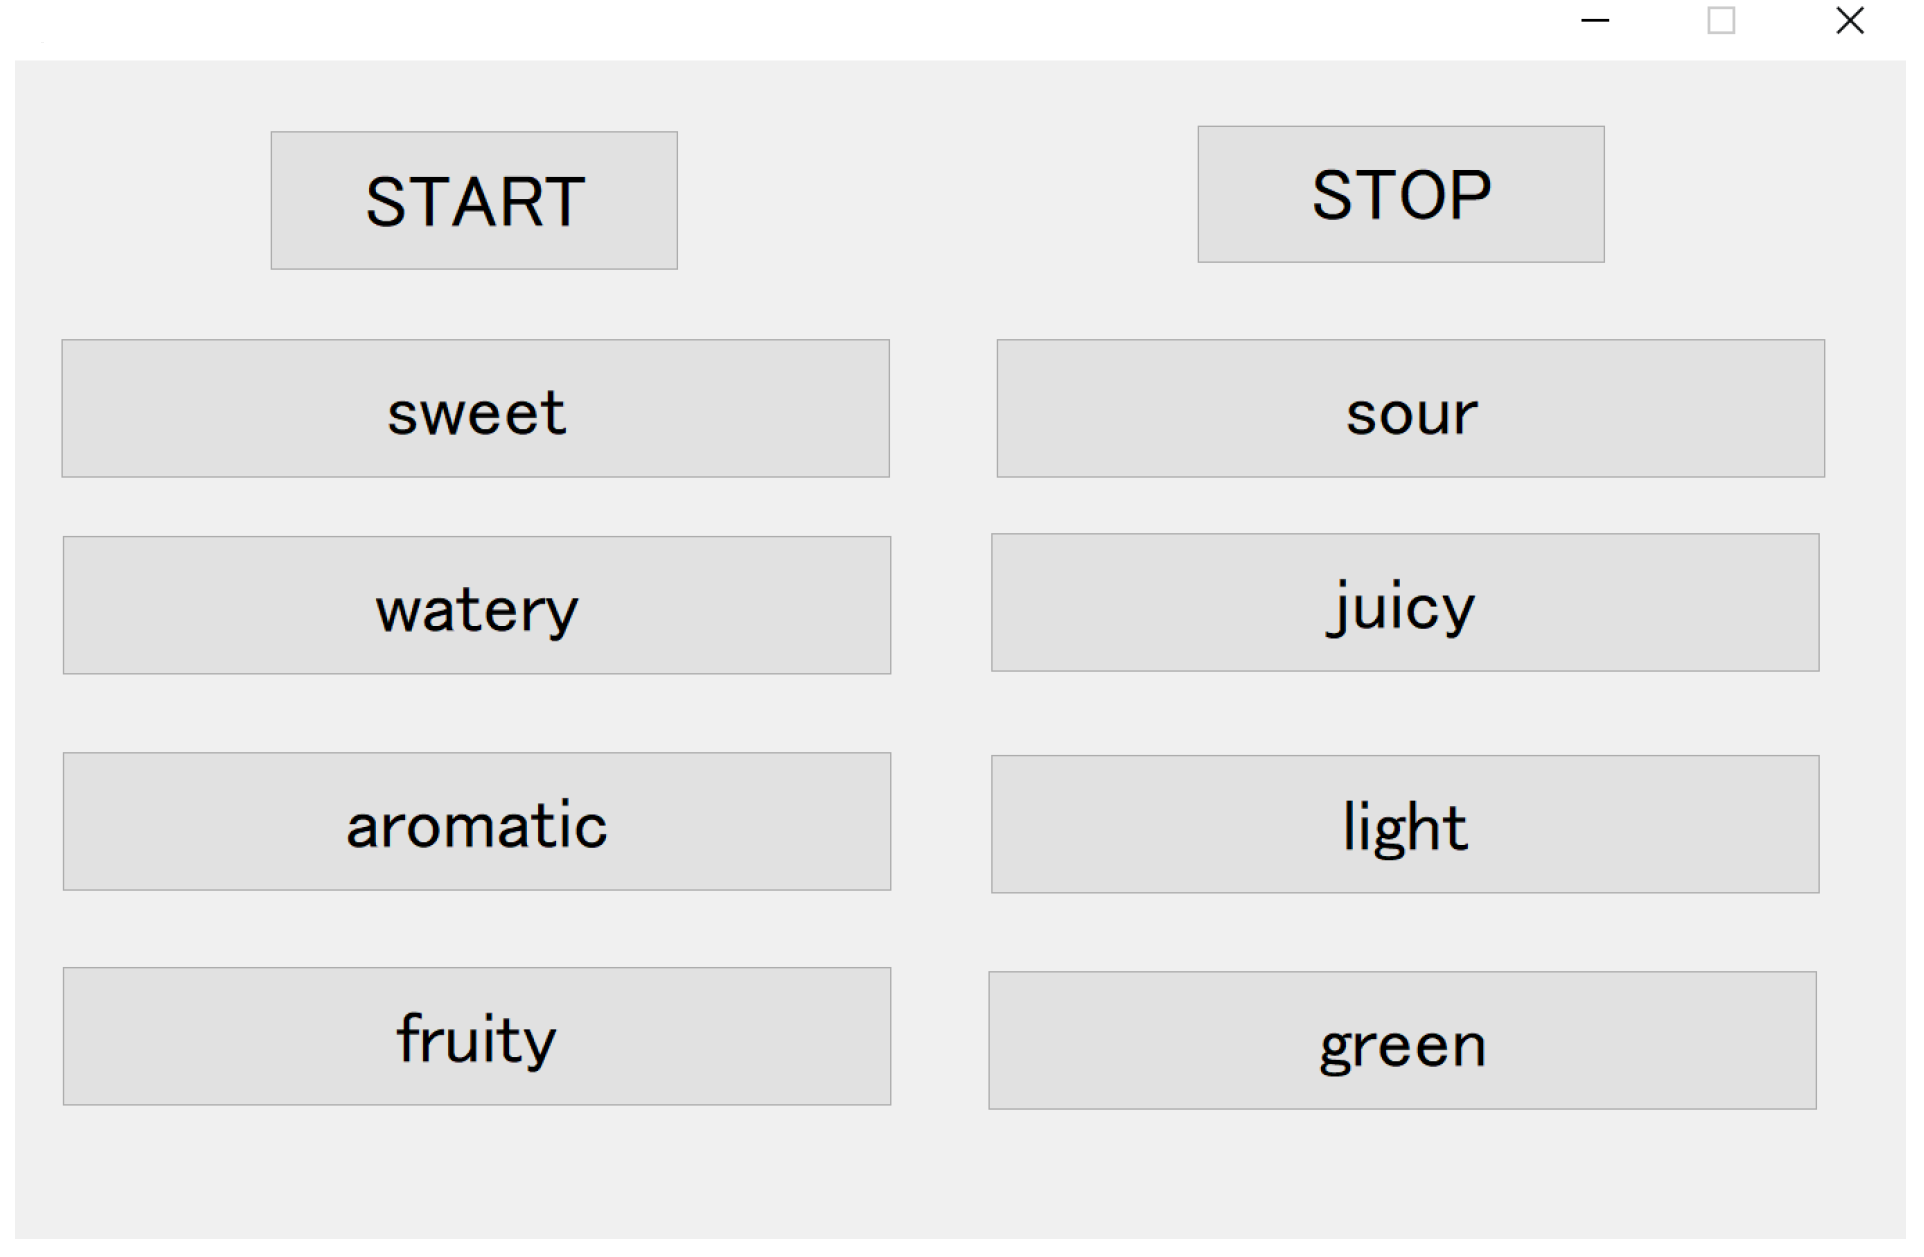
2.1. TDS (Temporal Dominance of Sensations) Method
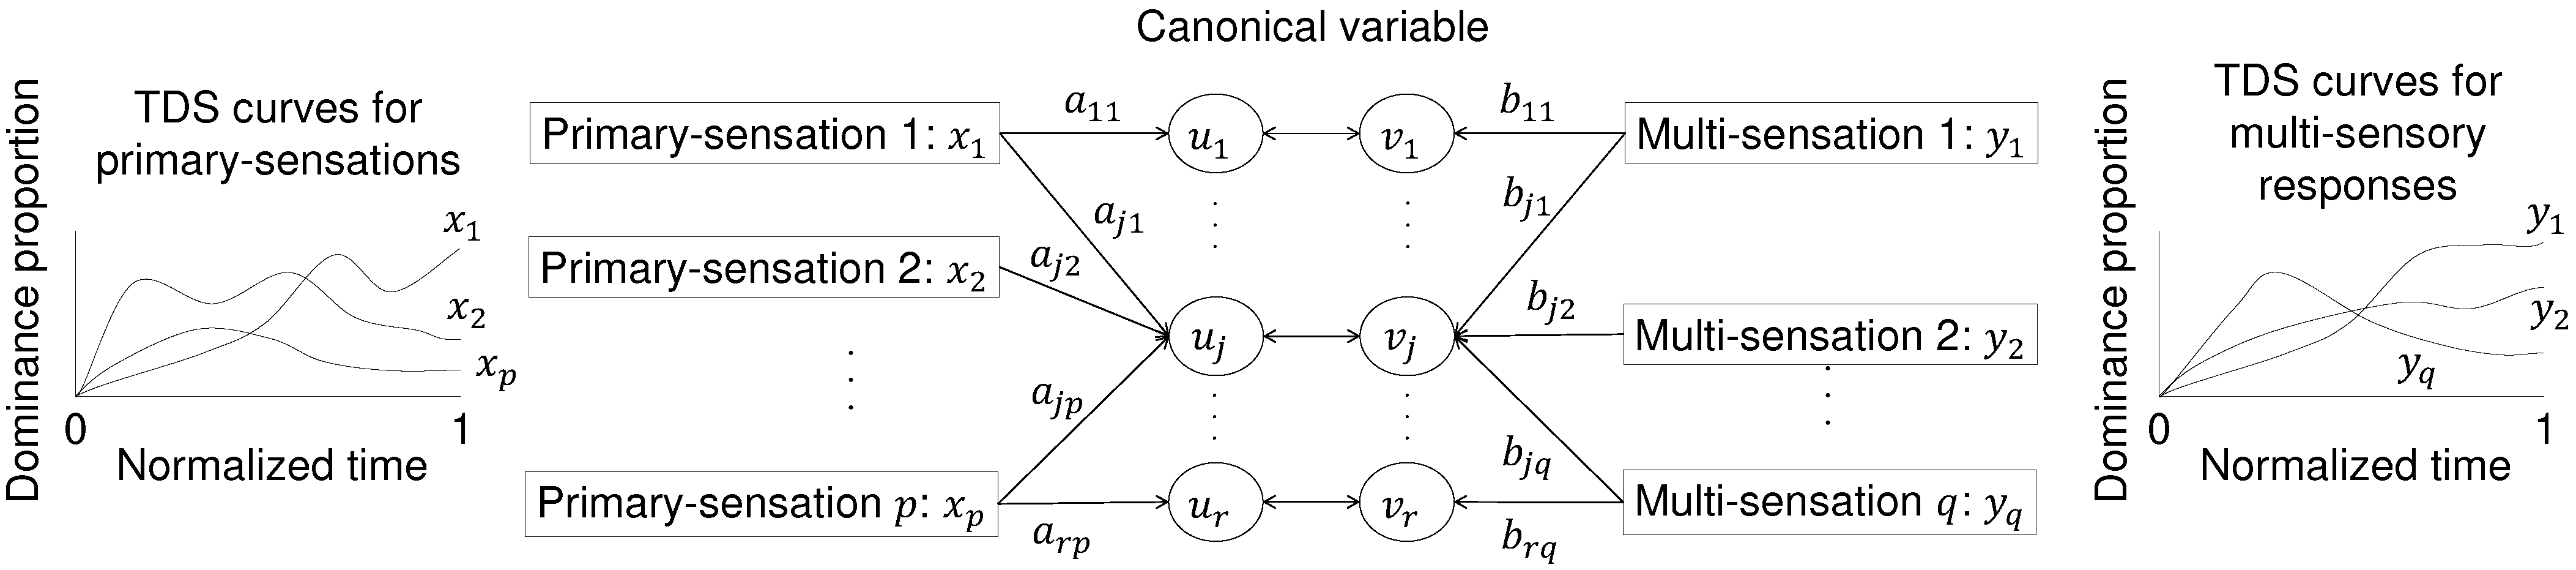
2.2. Canonical Correlation Analysis (CCA)
3. Attribute Selection and Categorization
3.1. Task
3.2. Panels
3.3. Food Specimens: Strawberries
3.4. Results
4. Experiment: TDS Tasks for Primary- and Multi-Sensory Attributes
4.1. Words Used in the Tasks
4.2. Tasks
4.3. Panels
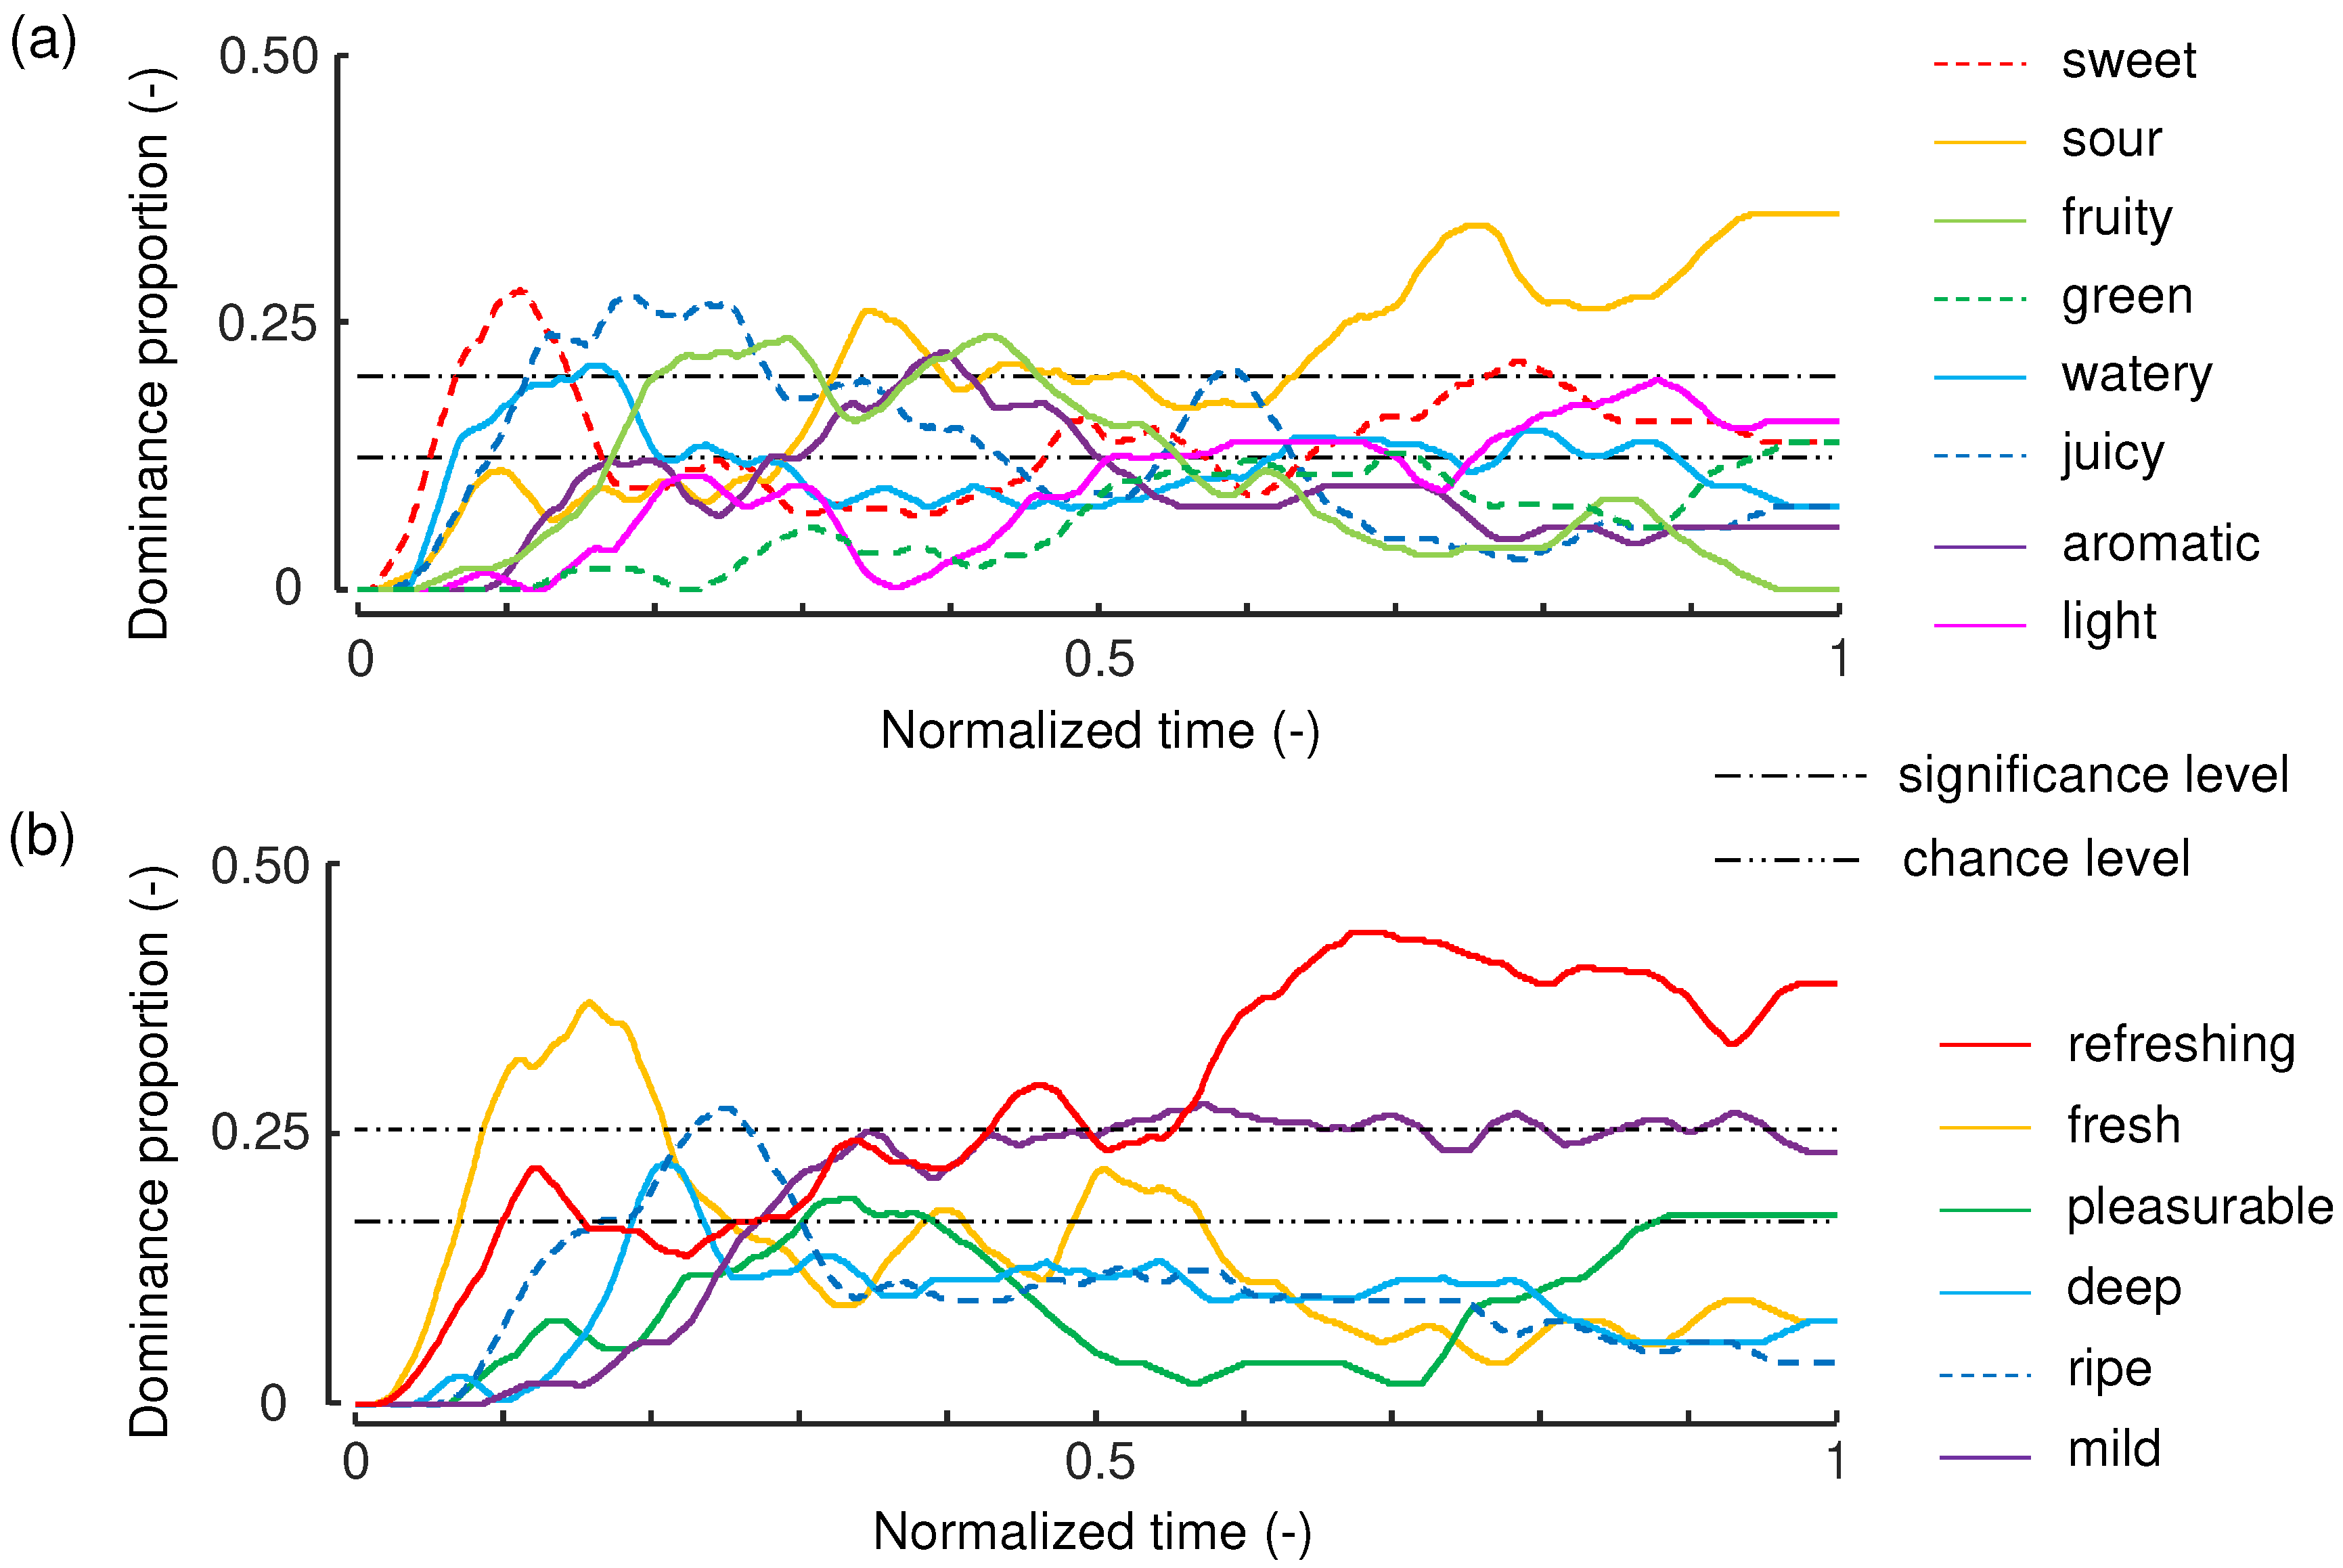
4.4. Results
5. Model Linking Primary- and Multi-Sensory Attributes
5.1. Data Analysis
5.2. Bootstrap Resampling
5.3. Number of Canonical Variables
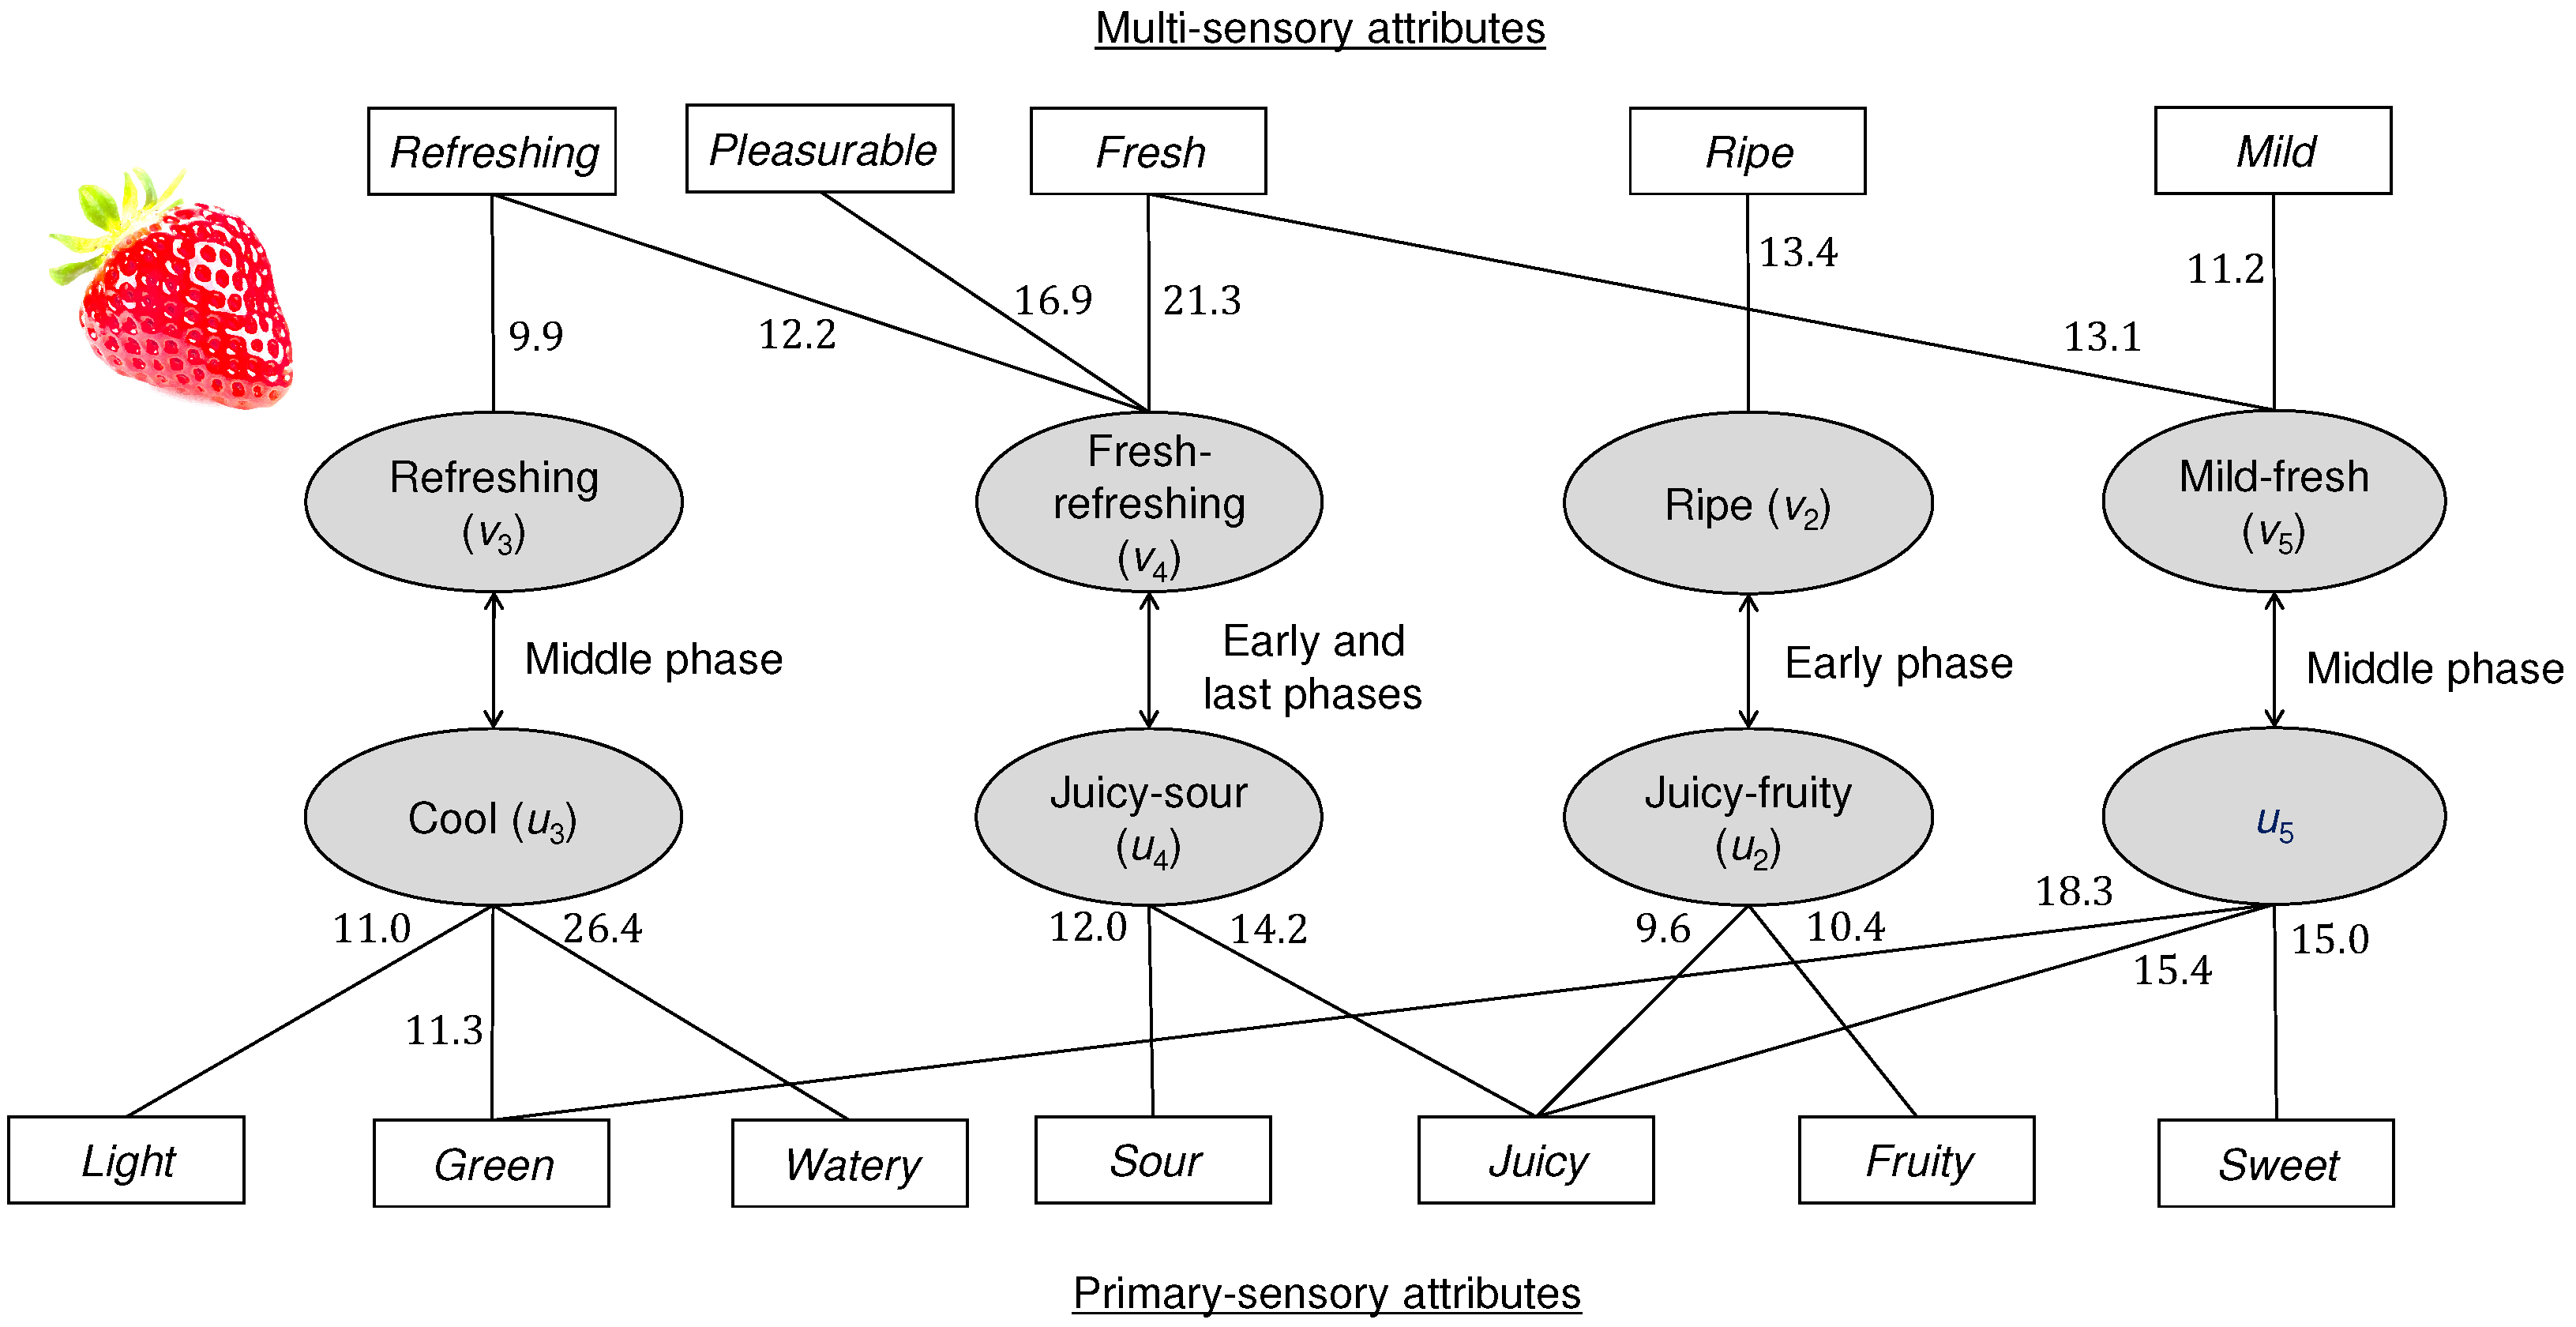
5.4. Canonical Correlation Models and Interpretation of Canonical Variables
5.4.1. Models Computed from Trend TDS Curves
5.4.2. Models Computed from Differential TDS Curves
6. Discussion
7. Conclusions
Author Contributions
Funding
Institutional Review Board Statement
Informed Consent Statement
Data Availability Statement
Conflicts of Interest
Abbreviations
| TDS | Temporal dominance of sensations |
| CCA | Canonical correlation analysis |
References
- Pineau, N.; Schlich, P.; Cordelle, S.; Mathonnière, C.; Issanchou, S.; Imbert, A.; Rogeaux, M.; Etiévant, P.; Köster, E. Temporal dominance of sensations: Construction of the TDS curves and comparison with time–intensity. Food Qual. Prefer. 2009, 20, 450–455. [Google Scholar] [CrossRef]
- International Organization for Standardization. ISO 13299: Sensory Analysis—Methodology—General Guidance for Establishing a Sensory Profile; ISO: Geneva, Switzerland, 2016. [Google Scholar]
- Jager, G.; Schlich, P.; Tijssen, I.; Yao, J.; Visalli, M.; de Graaf, C.; Stieger, M. Temporal dominance of emotions: Measuring dynamics of food-related emotions during consumption. Food Qual. Prefer. 2014, 37, 87–99. [Google Scholar] [CrossRef]
- Di Monaco, R.; Su, C.; Masi, P.; Cavella, S. Temporal Dominance of Sensations: A review. Trends Food Sci. Technol. 2014, 38, 104–112. [Google Scholar] [CrossRef]
- Schlich, P. Temporal Dominance of Sensations (TDS): A new deal for temporal sensory analysis. Curr. Opin. Food Sci. 2017, 15, 38–42. [Google Scholar] [CrossRef]
- Lee, W., III; Pangborn, M. Time-intensity: The temporal aspects of sensory perception. Food Technol. 1986, 40, 71–78. [Google Scholar]
- Duizer, L.; Gullett, E.; Findlay, C. Time-intensity methodology for beef tenderness perception. J. Food Sci. 1993, 58, 943–947. [Google Scholar] [CrossRef]
- Alves, L.R.; Battochio, J.R.; Cardoso, J.M.P.; De Melo, L.L.M.M.; Da Silva, V.S.; Siqueira, A.C.P.; Bolini, H.M.A. Time–Intensity profile and internal preference mapping of strawberry jam. J. Sens. Stud. 2008, 23, 125–135. [Google Scholar] [CrossRef]
- Köster, E.P.; Mojet, J. From mood to food and from food to mood: A psychological perspective on the measurement of food-related emotions in consumer research. Food Res. Int. 2015, 76, 180–191. [Google Scholar] [CrossRef]
- Waehrens, S.S.; Grønbeck, M.S.; Olsen, K.; Byrne, D.V. Impact of consumer associations, emotions, and appropriateness for use on food acceptability: A CATA and liking evaluation of vegetable and berry beverages. J. Sens. Stud. 2018, 33, e12328. [Google Scholar] [CrossRef]
- Shimaoka, N.; Okamoto, S.; Tachi, K.; Akiyama, Y.; Yamada, Y. Layered Modeling of Sensory and Affective Responses: Modification by Considering Unique Factors of Affective Responses. In Proceedings of the International Conference on Kansei Engineering & Emotion Research, Tokyo, Japan, 7–9 September 2020; pp. 168–173. [Google Scholar]
- Gupta, M.; Torrico, D.D.; Hepworth, G.; Gras, S.L.; Ong, L.; Cottrell, J.J.; Dunshea, F.R. Differences in hedonic responses, facial expressions and self-reported emotions of consumers using commercial yogurts: A cross-cultural study. Foods 2021, 10, 1237. [Google Scholar] [CrossRef]
- Bartkiene, E.; Mockus, E.; Mozuriene, E.; Klementaviciute, J.; Monstaviciute, E.; Starkute, V.; Zavistanaviciute, P.; Zokaityte, E.; Cernauskas, D.; Klupsaite, D. The evaluation of dark chocolate-elicited emotions and their relation with physico chemical attributes of chocolate. Foods 2021, 10, 642. [Google Scholar] [CrossRef]
- Jeesan, S.A.; Seo, H.S. Color-induced aroma illusion: Color cues can modulate consumer perception, acceptance, and emotional responses toward cooked rice. Foods 2020, 9, 1845. [Google Scholar] [CrossRef]
- Ouyang, Y.; Behnke, C.; Almanza, B.; Ghiselli, R. The influence of food aromas on restaurant consumer emotions, perceptions, and purchases. J. Hosp. Mark. Manag. 2018, 27, 405–423. [Google Scholar] [CrossRef]
- Spinelli, S.; Masi, C.; Zoboli, G.; Prescott, J.; Monteleone, E. Emotional responses to branded and unbranded foods. Food Qual. Prefer. 2015, 42, 1–11. [Google Scholar] [CrossRef]
- Okada, T.; Okamoto, S.; Yamada, Y. Affective dynamics: Causality modeling of temporally evolving perceptual and affective responses. IEEE Trans. Affect. Comput. 2019. [Google Scholar] [CrossRef]
- Tachi, K.; Okamoto, S.; Akiyama, Y.; Yamada, Y. State-space modeling of temporal dominance responses to stimuli: A case study using strawberry. In International Conference on Kansei Engineering & Emotion Research; Springer: Singapore, 2020; pp. 139–148. [Google Scholar]
- Tachi, K.; Okamoto, S. Dynamic state-space modeling with factorial memories in temporal dominance of sensations, emotions and temporal liking. IEEE Trans. Affect. Comput. 2022. [Google Scholar] [CrossRef]
- Silva, A.P.; Voss, H.P.; van Zyl, H.; Hogg, T.; de Graaf, C.; Pintado, M.; Jager, G. Temporal dominance of sensations, emotions, and temporal liking measured in a bar for two similar wines using a multi-sip approach. J. Sens. Stud. 2018, 33, e12459. [Google Scholar] [CrossRef]
- Galmarini, M.; Silva Paz, R.; Enciso Choquehuanca, D.; Zamora, M.C.; Meszd, B. Impact of music on the dynamic perception of coffee and evoked emotions evaluated by temporal dominance of sensations (TDS) and emotions (TDE). Food Res. Int. 2021, 150, 110795. [Google Scholar] [CrossRef]
- Lecuelle, G.; Visalli, M.; Cardot, H.; Schlich, P. Modeling temporal dominance of sensations with semi-Markov chains. Food Qual. Prefer. 2018, 67, 59–66. [Google Scholar] [CrossRef]
- Cardot, H.; Lecuelle, G.; Schlich, P.; Visalli, M. Estimating finite mixtures of semi-Markov chains: An application to the segmentation of temporal sensory data. J. R. Stat. Soc. Ser. C Appl. Stat. 2019, 68, 1281–1303. [Google Scholar] [CrossRef]
- Castura, J. Investigating temporal sensory data via a graph theoretic approach. Food Qual. Prefer. 2020, 79, 103787. [Google Scholar] [CrossRef]
- Chen, G.; Glen, D.R.; Saad, Z.S.; Paul Hamilton, J.; Thomason, M.E.; Gotlib, I.H.; Cox, R.W. Vector autoregression, structural equation modeling, and their synthesis in neuroimaging data analysis. Comput. Biol. Med. 2011, 41, 1142–1155. [Google Scholar] [CrossRef] [Green Version]
- Visalli, M.; Mahieu, B.; Thomas, A.; Schlich, P. Concurrent vs. retrospective temporal data collection: Attack-evolution-finish as a simplification of temporal dominance of sensations? Food Qual. Prefer. 2020, 85, 103956. [Google Scholar] [CrossRef]
- Oliver, P.; Cicerale, S.; Pang, E.; Keast, R. Developing a strawberry lexicon to describe cultivars at two maturation stages. J. Sens. Stud. 2018, 33, e12312. [Google Scholar] [CrossRef]
- King, S.C.; Meiselman, H.L. Development of a method to measure consumer emotions associated with foods. Food Qual. Prefer. 2010, 21, 168–177. [Google Scholar] [CrossRef]
- Guest, S.; Dessirier, J.M.; Mehrabyan, A.; McGlone, F.; Essick, G.; Gescheider, G.; Fontana, A.; Xiong, R.; Ackerley, R.; Blot, K. The development and validation of sensory and emotional scales of touch perception. Atten. Percept. Psychophys. 2011, 73, 531–550. [Google Scholar] [CrossRef] [Green Version]
- Oliver, P.; Cicerale, S.; Pang, E.; Keast, R. Check-all-that-applies as an alternative for descriptive analysis to establish flavors driving liking in strawberries. J. Sens. Stud. 2018, 33, e12316. [Google Scholar] [CrossRef]
- Peneau, S.; Brockhoff, P.; Escher, F.; Nuessli, J. A comprehensive approach to evaluate the freshness of strawberries and carrots. Postharvest Biol. Technol. 2007, 45, 20–29. [Google Scholar] [CrossRef]
- Okamoto, S.; Ehara, Y.; Okada, T.; Yamada, Y. Affective dynamics: Principal motion analysis of temporal dominance of sensations and emotions data. IEEE Trans. Affect. Comput. 2020. [Google Scholar] [CrossRef]
- Okamoto, S. Structural modeling of temporal dominance responses using covariances of contemporary changes in subjective qualities. Int. J. Affect. Eng. 2021, 20, 127–130. [Google Scholar] [CrossRef]
- Okamoto, S. Bootstrap resampling of temporal dominance of sensations curves to compute uncertainties. Foods 2021, 10, 2472. [Google Scholar] [CrossRef]
- Nguyen, Q.C.; Næsa, T.; Varela, P. When the choice of the temporal method does make a difference: TCATA, TDS and TDS by modality for characterizing semi-solid foods. Food Qual. Prefer. 2018, 66, 95–106. [Google Scholar] [CrossRef] [Green Version]
- Lenfant, F.; Loret, C.; Pineau, N.; Hartmann, C.; Martin, N. Perception of oral food breakdown. The concept of sensory trajectory. Appetite 2009, 52, 659–667. [Google Scholar] [CrossRef]
- Merlo, T.C.; Soletti, I.; Saldana, E.; Menegali, B.S.; Martins, M.M.; Teixeira, A.C.B.; dos Santos Harada-Padermo, S.; Dargelio, M.D.; Contreras-Castillo, C.J. Measuring dynamics of emotions evoked by the packaging colour of hamburgers using Temporal Dominance of Emotions (TDE). Food Res. Int. 2019, 124, 147–155. [Google Scholar] [CrossRef]
- Nguyen, H.; Wismer, W.V. Temporal sensory profiles of regular and sodium-reduced foods elicited by temporal dominance of sensations (TDS) and temporal check-all-that-apply (TCATA). Foods 2022, 11, 457. [Google Scholar] [CrossRef]
- Tarancón, P.; Tárrega, A.; Aleza, P.; Besada, C. Consumer description by check-all-that-apply questions (CATA) of the sensory profiles of commercial and new mandarins. Identification of preference patterns and drivers of liking. Foods 2020, 9, 468. [Google Scholar] [CrossRef] [Green Version]
- Santos Gonçalves, G.A.; Resende, N.S.; Gonçalves, C.S.; de Alcântara, E.M.; Nunes Carvalho, E.E.; de Resende, J.V.; Ângelo Cirillo, M.; de Barros Vilas Boas, E.V. Temporal dominance of sensations for characterization of strawberry pulp subjected to pasteurization and different freezing methods. LWT 2017, 77, 413–421. [Google Scholar] [CrossRef]


| Primary-Sensory | Multi-Sensory | Evaluative |
|---|---|---|
| sweet | refreshing | delicious |
| sour | pleasurable | satisfied |
| hard | unripe | good |
| soft | fresh | luxury |
| watery | loving | |
| crispy | ||
| juicy | ||
| moist | ||
| green | ||
| fruity | ||
| berry | ||
| weak | ||
| strong | ||
| smooth | ||
| Primary-Sensory | Multi-Sensory | Evaluative |
| aromatic (3) | aromatic (4) | |
| rich/deep (4) | rich/deep (4) | |
| wonderful (3) | wonderful (5) | |
| elegant (3) | elegant (4) | |
| light (4) | light (3) | light (2) |
| ripe (3) | ripe (3) | ripe (4) |
| mild (2) | mild (3) | mild (2) |
| Primary-Sensory Attributes | Description |
|---|---|
| Sweet | Basic taste. No definition was provided. |
| Sour | Basic taste. No definition was provided. |
| Fruity | Smell of sweet fruits. |
| Green | Smell, taste, and mouth feel of grass or unripe fruits. |
| Watery | Water content with no strong taste. |
| Juicy | Amount of juice and flesh. |
| Aromatic | Complex but pleasant smell. |
| Light | Sweet taste that does not last long in the mouth. |
| Multi-sensory attributes | |
| Refreshing | Pleasantly cool. |
| Fresh | Recently harvested. |
| Pleasurable | Feeling of pleasure. |
| Rich/deep | Combination of multiple strong tastes or aromas. |
| Ripe | Fully grown and ready to be eaten. |
| Mild | Taste spreads gently without strong stimuli. |
| Trend Model | |||||
|---|---|---|---|---|---|
| Canonical | Contribution to | Contribution to | Pillai-Bartlett | F-Value | p-Value |
| Variable | Primary-Sensations | Multi-Sensations | Trace | ||
| 1st | 0.14 | 0.20 | 2.06 | 17.7 | 0.000 |
| 2nd | 0.33 | 0.31 | 1.12 | 10.7 | |
| 3rd | 0.10 | 0.16 | 0.42 | 5.20 | |
| 4th | 0.07 | 0.08 | 0.21 | 3.93 | |
| 5th | 0.09 | 0.12 | 0.08 | 2.69 | 0.006 |
| 6th | 0.09 | 0.13 | 0.01 | 1.17 | 0.319 |
| Differential Model | |||||
| Canonical | Contribution to | Contribution to | Pillai-Bartlett | F-Value | p-Value |
| Variable | Primary-Sensations | Multi-Sensations | Trace | ||
| 1st | 0.05 | 0.10 | 1.38 | 10.1 | 0.000 |
| 2nd | 0.17 | 0.16 | 0.48 | 4.03 | |
| 3rd | 0.14 | 0.15 | 0.18 | 2.08 | 0.002 |
| 4th | 0.14 | 0.17 | 0.09 | 1.71 | 0.044 |
| 5th | 0.13 | 0.21 | 0.02 | 0.85 | 0.556 |
| 6th | 0.13 | 0.20 | 0.01 | 0.47 | 0.703 |
| Canonical Variables | |||||
|---|---|---|---|---|---|
| Primary-sensory | 1st | 2nd | 3rd | 4th | 5th |
| sweet | 17.4 | 5.5 | 5.0 | 0.1 | 15.0 |
| sour | 17.1 | 2.6 | 3.8 | 12.0 | 3.5 |
| fruity | 17.6 | 10.4 | 4.8 | 3.0 | |
| green | 17.5 | 1.0 | 11.3 | 2.9 | 18.3 |
| watery | 15.7 | 5.8 | 26.4 | 9.8 | 2.9 |
| juicy | 16.4 | 9.6 | 5.9 | 14.2 | 15.4 |
| aromatic | 17.0 | 4.0 | 8.6 | 6.8 | 6.3 |
| light | 17.8 | 4.7 | 11.0 | 5.1 | 3.3 |
| Correlation | 0.97 | 0.83 | 0.47 | 0.36 | 0.25 |
| Multi-sensory | 1st | 2nd | 3rd | 4th | 5th |
| refreshing | 11.8 | 0.8 | 9.9 | 12.2 | 4.7 |
| fresh | 11.5 | 7.2 | 4.5 | 21.3 | 13.1 |
| pleasurable | 11.8 | 6.2 | 1.4 | 16.9 | |
| rich/deep | 12.0 | 5.2 | 4.1 | 9.5 | |
| ripe | 11.4 | 13.4 | 6.9 | 4.9 | |
| mild | 12.0 | 3.2 | 4.4 | 5.4 | 11.2 |
| Canonical Variables | ||||
|---|---|---|---|---|
| Primary-Sensory | 1st | 2nd | 3rd | 4th |
| sweet | 18.9 | 1.5 | ||
| sour | 16.1 | 3.2 | 9.7 | 1.9 |
| fruity | 18.5 | 12.0 | 8.0 | |
| green | 17.0 | |||
| watery | 16.9 | |||
| juicy | 18.1 | 5.9 | ||
| aromatic | 18.1 | 1.1 | 13.4 | 2.2 |
| light | 16.6 | 17.6 | 6.6 | |
| Correlation | 0.95 | 0.55 | 0.29 | 0.26 |
| Multi-sensory | 1st | 2nd | 3rd | 4th |
| refreshing | 14.0 | 10.0 | ||
| fresh | 15.0 | 7.2 | ||
| pleasurable | 13.2 | 2.2 | 4.1 | 26.6 |
| rich/deep | 11.2 | 21.0 | 12.9 | |
| ripe | 14.1 | 7.1 | ||
| mild | 13.2 | 8.4 | 4.5 | |
Publisher’s Note: MDPI stays neutral with regard to jurisdictional claims in published maps and institutional affiliations. |
© 2022 by the authors. Licensee MDPI, Basel, Switzerland. This article is an open access article distributed under the terms and conditions of the Creative Commons Attribution (CC BY) license (https://creativecommons.org/licenses/by/4.0/).
Share and Cite
Shimaoka, N.; Okamoto, S.; Akiyama, Y.; Yamada, Y. Linking Temporal Dominance of Sensations for Primary-Sensory and Multi-Sensory Attributes Using Canonical Correlation Analysis. Foods 2022, 11, 781. https://doi.org/10.3390/foods11060781
Shimaoka N, Okamoto S, Akiyama Y, Yamada Y. Linking Temporal Dominance of Sensations for Primary-Sensory and Multi-Sensory Attributes Using Canonical Correlation Analysis. Foods. 2022; 11(6):781. https://doi.org/10.3390/foods11060781
Chicago/Turabian StyleShimaoka, Nanako, Shogo Okamoto, Yasuhiro Akiyama, and Yoji Yamada. 2022. "Linking Temporal Dominance of Sensations for Primary-Sensory and Multi-Sensory Attributes Using Canonical Correlation Analysis" Foods 11, no. 6: 781. https://doi.org/10.3390/foods11060781
APA StyleShimaoka, N., Okamoto, S., Akiyama, Y., & Yamada, Y. (2022). Linking Temporal Dominance of Sensations for Primary-Sensory and Multi-Sensory Attributes Using Canonical Correlation Analysis. Foods, 11(6), 781. https://doi.org/10.3390/foods11060781