Article

Quantitative Microbial Risk Assessment of Listeria monocytogenes and Enterohemorrhagic Escherichia coli in Yogurt

Department of Food and Nutrition, College of Human Ecology, Kyung Hee University, 26 Kyungheedae-ro, Dongdaemun-gu, Seoul 02447, Korea
*
Author to whom correspondence should be addressed.
Foods 2022, 11(7), 971; https://doi.org/10.3390/foods11070971
Submission received: 7 February 2022 / Revised: 25 March 2022 / Accepted: 25 March 2022 / Published: 27 March 2022
(This article belongs to the Special Issue Foodborne Pathogens and Food Safety)

Abstract

:
Listeria monocytogenes can survive in yogurt stored at a refrigeration temperature. Enterohemorrhagic Escherichia coli (EHEC) has a strong acid resistance that can survive in the yogurt with a low pH. We estimated the risk of L. monocytogenes and EHEC due to yogurt consumption with @Risk. Predictive survival models for L. monocytogenes and EHEC in drinking and regular yogurt were developed at 4, 10, 17, 25, and 36 °C, and the survival of both pathogens in yogurt was predicted during distribution and storage at home. The average initial contamination level in drinking and regular yogurt was calculated to be −3.941 log CFU/g and −3.608 log CFU/g, respectively, and the contamination level of both LM and EHEC decreased in yogurt from the market to home. Mean values of the possibility of illness caused by EHEC were higher (drinking: 1.44 × 10⁻⁸; regular: 5.09 × 10⁻⁹) than L. monocytogenes (drinking: 1.91 × 10⁻¹⁵; regular: 2.87 × 10⁻¹⁶) in the susceptible population. Both pathogens had a positive correlation with the initial contamination level and consumption. These results show that the foodborne illness risk from L. monocytogenes and EHEC due to yogurt consumption is very low. However, controlling the initial contamination level of EHEC during yogurt manufacture should be emphasized.

1. Introduction

Yogurt is a dairy product fermented by Streptococcus thermophilus and Lactobacillus bulgaricus [1]. Yogurt provides probiotics known to be beneficial bacteria that can promote health. Worldwide, the consumption of probiotics and yogurt is increasing every year [2,3,4].
Pathogenic Escherichia coli (E. coli) are a group of facultative anaerobes that can cause diseases in healthy individuals with a combination of certain virulence factors, including adhesins, invasins, toxins, and capsules. Pathogenic E. coli are classified into six pathotypes based on clinical, epidemiological, and virulence traits: enteropathogenic E. coli (EPEC), enteroaggregative E. coli (EAEC), diffusely adherent E. coli (DAEC), enterotoxigenic E. coli (ETEC), enteroinvasive E. coli (EIEC) and enterohemorrhagic E. coli (EHEC) [5]. EPEC (60.5%) is the primary cause of pathogenic E. coli outbreaks in Korea, followed by ETEC (31.2%), EHEC (6.8%), and EIEC (1.5%) [6]. Among them, EHEC can cause diarrhea with a mechanism of attaching-effacing (A/E) lesions with only a low infectious dose (1–100 CFU) [7]. EHEC has strong acid resistance that can make it viable in food with a low pH [8]. Morgan et al. [9] reported 16 cases of E. coli O157:H7 Phage Type 49 due to the consumption of a locally produced yogurt occurring in the northwest of England in 1991. In a study by Cutrim et al. [10], E. coli O157:H7 was shown to survive for 10 days in both traditional inoculated yogurt and pre-hydrolyzed inoculated yogurt, whereas its survival increased to 22 days in lactose-free yogurt. The populations of E. coli O157:H7 decreased by only about 1.4 log CFU/g after 28 days in Greek-style yogurt [11].
Listeria monocytogenes (LM) are facultatively anaerobic opportunistic pathogens that can grow between 0 and 45 °C; optimal growth occurs at 30~37 °C [12]. It can grow at pH 4–9.6 [13]. Listeriosis is caused by LM, which can cross the intestinal barrier and spread to lymph and blood to reach target organs such as the liver and spleen. Moreover, LM can be fatal to immunocompromised individuals, newborns, older adults, and pregnant women since LM can penetrate the blood–brain barrier or the fetoplacental barrier [14,15]. The approximate infective dose of LM is estimated to be 10 to 100 million CFU in healthy hosts and only 0.1 to 10 million CFU in individuals at high risk of infection [16]. In the US, a significant number of LM outbreaks are caused by raw milk, unpasteurized milk, cheeses, and ice cream [17]. Improper management of pasteurization temperature or technical imperfections can lead to the contamination of dairy products [18].
Risk assessment can estimate the probability of occurrence and severity of adverse effects in humans exposed to foodborne hazards [19]. Quantitative microbial risk assessment (QMRA) provides numerical estimates of risk exposure to identify which factors affect the exposure [20]. QMRA consists of hazard identification, hazard characterization, exposure assessment, and risk characterization [19]. Hazard identification is the step that identifies the presence of microorganisms or microbial toxins in a particular food based on the scientific literature. In the hazard characterization step, it is possible to perform qualitative and quantitative assessments of the adverse effects of consuming food contaminated by microorganisms [21]. Exposure assessment is the process that characterizes the level of hazard exposed to the population [22]. The final step of QMRA is risk characterization that provides the possibility of illness/person/day of pathogens when consuming contaminated food [21]. A risk assessment study of Staphylococcus aureus in milk and homemade yogurt was reported in Ethiopia [23]. Results showed the importance of traditional food preparation methods, such as fermentation, in risk mitigation; yogurt, traditional milk fermentation, reduced the risk by 93.7%. QMRA of LM and enterohemorrhagic E. coli in yogurt has not been reported yet. Therefore, the objective of this study was to conduct a microbial risk assessment for L. monocytogenes and enterohemorrhagic E. coli to compare their risks in drinking and regular yogurt.

2. Materials and Methods

2.1. Prevalence and Initial Contamination Level in an Offline Market

To derive prevalence (PR) data of LM and EHEC in yogurt by season and location, results of yogurt monitoring (195 drinking yogurts and 90 regular yogurts) were used [24]. LM and EHEC were identified with methods as described in the Korean Food Code [25]. The distribution of PR was fitted using Beta distribution (α, β), with α meaning “number of positive samples+1” and β meaning “number of total samples-number of positive samples +1” [26]. Initial contamination levels of LM and EHEC were estimated using the equation [Log (-ln(1-PR)/weight)] of Sanaa et al. [27].

2.2. Physicochemical and Microbiological Analyses of Yogurt

Ten products of two types of yogurt (drinking and regular) were purchased from an offline market. The pH, water activity (Aw), total aerobic bacteria, coliform, and E. coli were measured. Briefly, 10 g of sample was aseptically placed in a stomacher bag with 90 mL of distilled water and homogenized with a stomacher (Interscience, Paris, France). The pH was measured with a pH meter (OrionTM Star A211, ThermoFisher Scientific Co., Waltham, MA, USA). The Aw of each sample (15 g) was measured in triplicate using a water activity meter (Rotronic HP23-AW-A, Rotronic AG, Bassersdorf, Switzerland). To measure total aerobic bacteria (AC), coliform, and E. coli (EC), 25 g of sample was homogenized with 225 mL of 0.1% sterile peptone water (BD, Sparks, MD, USA) and serially diluted 10-fold with 0.1% peptone water. After inoculating 1 mL aliquot of each dilution onto two or more sheets of 3M Petrifilm E. coli/Coliform Count Plate (3M corporation, St. Paul, MN, USA), AC and EC plates were incubated at 36 ± 1 °C for 48 h and 24 h, respectively.

2.3. Strain Preparation

An LM strain isolated from the gloves of a slaughterhouse worker [28] was stored in tryptic soy broth (TSB, MB cell, Seoul, Korea) containing 0.6% yeast extract with 20% glycerol (Duksan, South Korea) at −80 °C. After thawing at ambient temperature, 10 μL of LM inoculum was added into 10 mL of TSB containing 0.6% yeast extract and then cultured at 36 ± 1 °C for 24 h in a 140 rpm rotary shaker (VS-8480, Vision Scientific, Daejeon, Korea).
E. coli (EHEC) strains (NCCP 13720, 13721) including E. coli O157:H7 (NCTC 12079) were obtained from the Ministry of Food and Drug Safety (MFDS) in Korea. After thawing frozen strains that were stored at −80 °C, they were cultured in the same way as described above. All strains were centrifuged at 4000 rpm for 10 min (VS-550, Vision Scientific, Daejeon, Korea) and the supernatant was removed. Pellets were harvested by centrifugation (4000 rpm for 10 min), washed with 10 mL of 0.1% peptone water, and resuspended with 0.1% peptone water to a final concentration of approximately 9.0 log CFU/mL.

2.4. Sample Preparation and Inoculation

For model development, the popularity of yogurt samples and results of physicochemical (high pH value) and microbiological analyses of yogurt were considered. Drinking and regular yogurt were purchased from an offline market (Seoul, Korea) and aseptically divided into 30 mL and 10 g, respectively, into 50 mL conical tubes (SPL Life Science Co., Daejeon, Seoul). LM and the cocktail of E. coli strains were independently inoculated into drinking (4~5 log CFU/g) and regular yogurts (5~6 log CFU/g). Each sample was then stored at 4, 10, 17, 25, and 36 °C until no colonies were detected for up to 21 days. At a specific time, each yogurt sample was homogenized with sterilized 0.1% peptone water for 120 s using a stomacher. Then 1 mL of the aliquot of the homogenate was serially diluted ten-fold with 0.1% peptone water and spread onto PALCAM agar (Oxoid, Basingstoke, Hampshire, UK) for LM and EMB agar (Oxoid, Basingstoke, Hampshire, UK) for EHEC, which were incubated at 36 ± 1 °C for 24 h to analyze the change in pathogen populations.

2.5. Development of Primary and Secondary Model

The Weibull model [29] (Equation (1)) and GinaFit V1.7 program [30] were used to develop the primary survival model of yogurt as a function of temperature. Delta value (time for the first decimal reduction) and p-value (shape of graph) were then calculated.
Weibull   equation :   Log ( N ) = Log ( N 0 ) ( t d e l t a ) p
N0: log initial number of cells
t: time
delta: time for the first decimal reduction
p: shape (p > 1: concave downward curve, p < 1: concave upward curve, p = 1: log-linear)
From results obtained through the primary predictive model, the secondary model was developed by applying the third-order polynomial model (Equation (2)) to delta values of both LM and EHEC as a function of temperature.
Third - order   polynomial   model :   Y = b 0 + b 1 × T + b 2 × T 2 + b 3 × T 3
Y: delta (d)
b0, b1, b2, b3: constant
T: temperature

2.6. Validation

To verify the applicability of the predictive model of LM, the delta value was obtained with temperatures not used for model development in this study, which was 7 °C for drinking yogurt and 13 °C for regular yogurt (interpolation). The predictive model of EHEC was verified with enteropathogenic (EPEC) strain (extrapolation), which was detected in a dairy farm [24]. The root mean square error (RMSE; Equation (3)) [31] was used as a measure of applicability:
R M S E = 1 n ×   ( o b s e r v e d   v a l u e p r e d i c t e d   v a l u e ) 2
n: the total number of experimental values (values obtained from independent variables) or predicted values (values obtained from the developed survival model).

2.7. Development of Scenario from Market to Home

The exposure assessment scenario for the risk assessment of yogurt was divided into three stages: “market storage”, “transportation to home”, and “home storage”.
The storage temperature of yogurt in the market was investigated for an offline market, which was used as an input variable into an Excel (Microsoft@ Excel 2019, Microsoft Corp., USA) spreadsheet. PERT distribution was confirmed as the most suitable probability distribution model using @RISK 7.5 (Palisade Corp., Ithaca, NY, USA). The minimum, mode, and maximum values of storage temperature were 2.1, 7, and 9.7 °C, respectively. Storage time was also input based on the shelf-life of yogurt. The PERT distribution was confirmed as the most suitable model using @RISK 7.5 (Palisade Corp., Ithaca, NY. USA). The minimum, mode, and maximum values of storage time were 0, 240, and 312 h for drinking yogurt and 0, 240, and 480 h for regular yogurt, respectively.
At the stage of transporting from market to home, the pert distribution was applied to transportation time and temperature according to Jung [32]. Values of minimum (0.325 h, 10 °C), mode (0.984 h, 18 °C), and maximum (1.643 h, 25 °C) time and temperature were applied.
According to data from the MFDS [33], 69.2% of respondents answered that the most frequent storage period for milk was 2–3 days at the refrigeration temperature and the maximum storage period was 30 days or more. As a result, RiskPert (0, 60, 720 h) distribution was input in the scenario and a RiskLogLogistic (−10.407, 13.616, 8.611) distribution was used as the storage temperature [34].

2.8. Estimation of Consumption Data of Yogurt

The appropriate probability distribution model for consumption amount and intake rate of yogurt was confirmed using data from “Estimation of amount and frequency of consumption of 50 domestic livestock and processed livestock products” from the MFDS [35].

2.9. Hazard Characterization

For hazard characterization, the exponential model was used for the dose–response model of LM [36] (Equation (4)) and the Beta-Poisson model [37] was used for the dose–response model of EHEC (Equation (5)):
p = 1 exp ( r   ×   N )
P: the probability of foodborne illness for the intake of LM
r: the probability that one cell can cause disease (susceptible population: 1.06 × 10⁻¹², general population: 2.37 × 10⁻¹⁴)
N: the number of cells exposed to the consumption of LM
P = 1 ( 1 + N β ) α
P: the probability of foodborne illness for the intake of EHEC
N: the consumption dose of EHEC
α: constant (0.49)
β: constant (1.81 × 10⁵)

2.10. Risk Characterization

To estimate the probability of foodborne illness per person per day for the intake of drinking and regular yogurt contaminated by LM or EHEC, formulas and inputs of exposure scenarios were written in an Excel spreadsheet. The risk was then calculated through a Monte Carlo simulation of @RISK. Median Latin hypercube sampling was used for sampling type, and a random method was used for generator seed. Finally, the correlation coefficient was calculated based on sensitivity analysis results to analyze factors affecting the probability of occurrence of foodborne illness.

2.11. Statistical Analysis

All experiments were repeated at least three times. All statistical analyses were performed using SAS version 9.4 (SAS Institute Inc., Cary, NC, USA). To describe significant variations of delta values between LM and EHEC at the same temperature, a t-test was used. Differences were considered significant at p < 0.05.

3. Results and Discussion

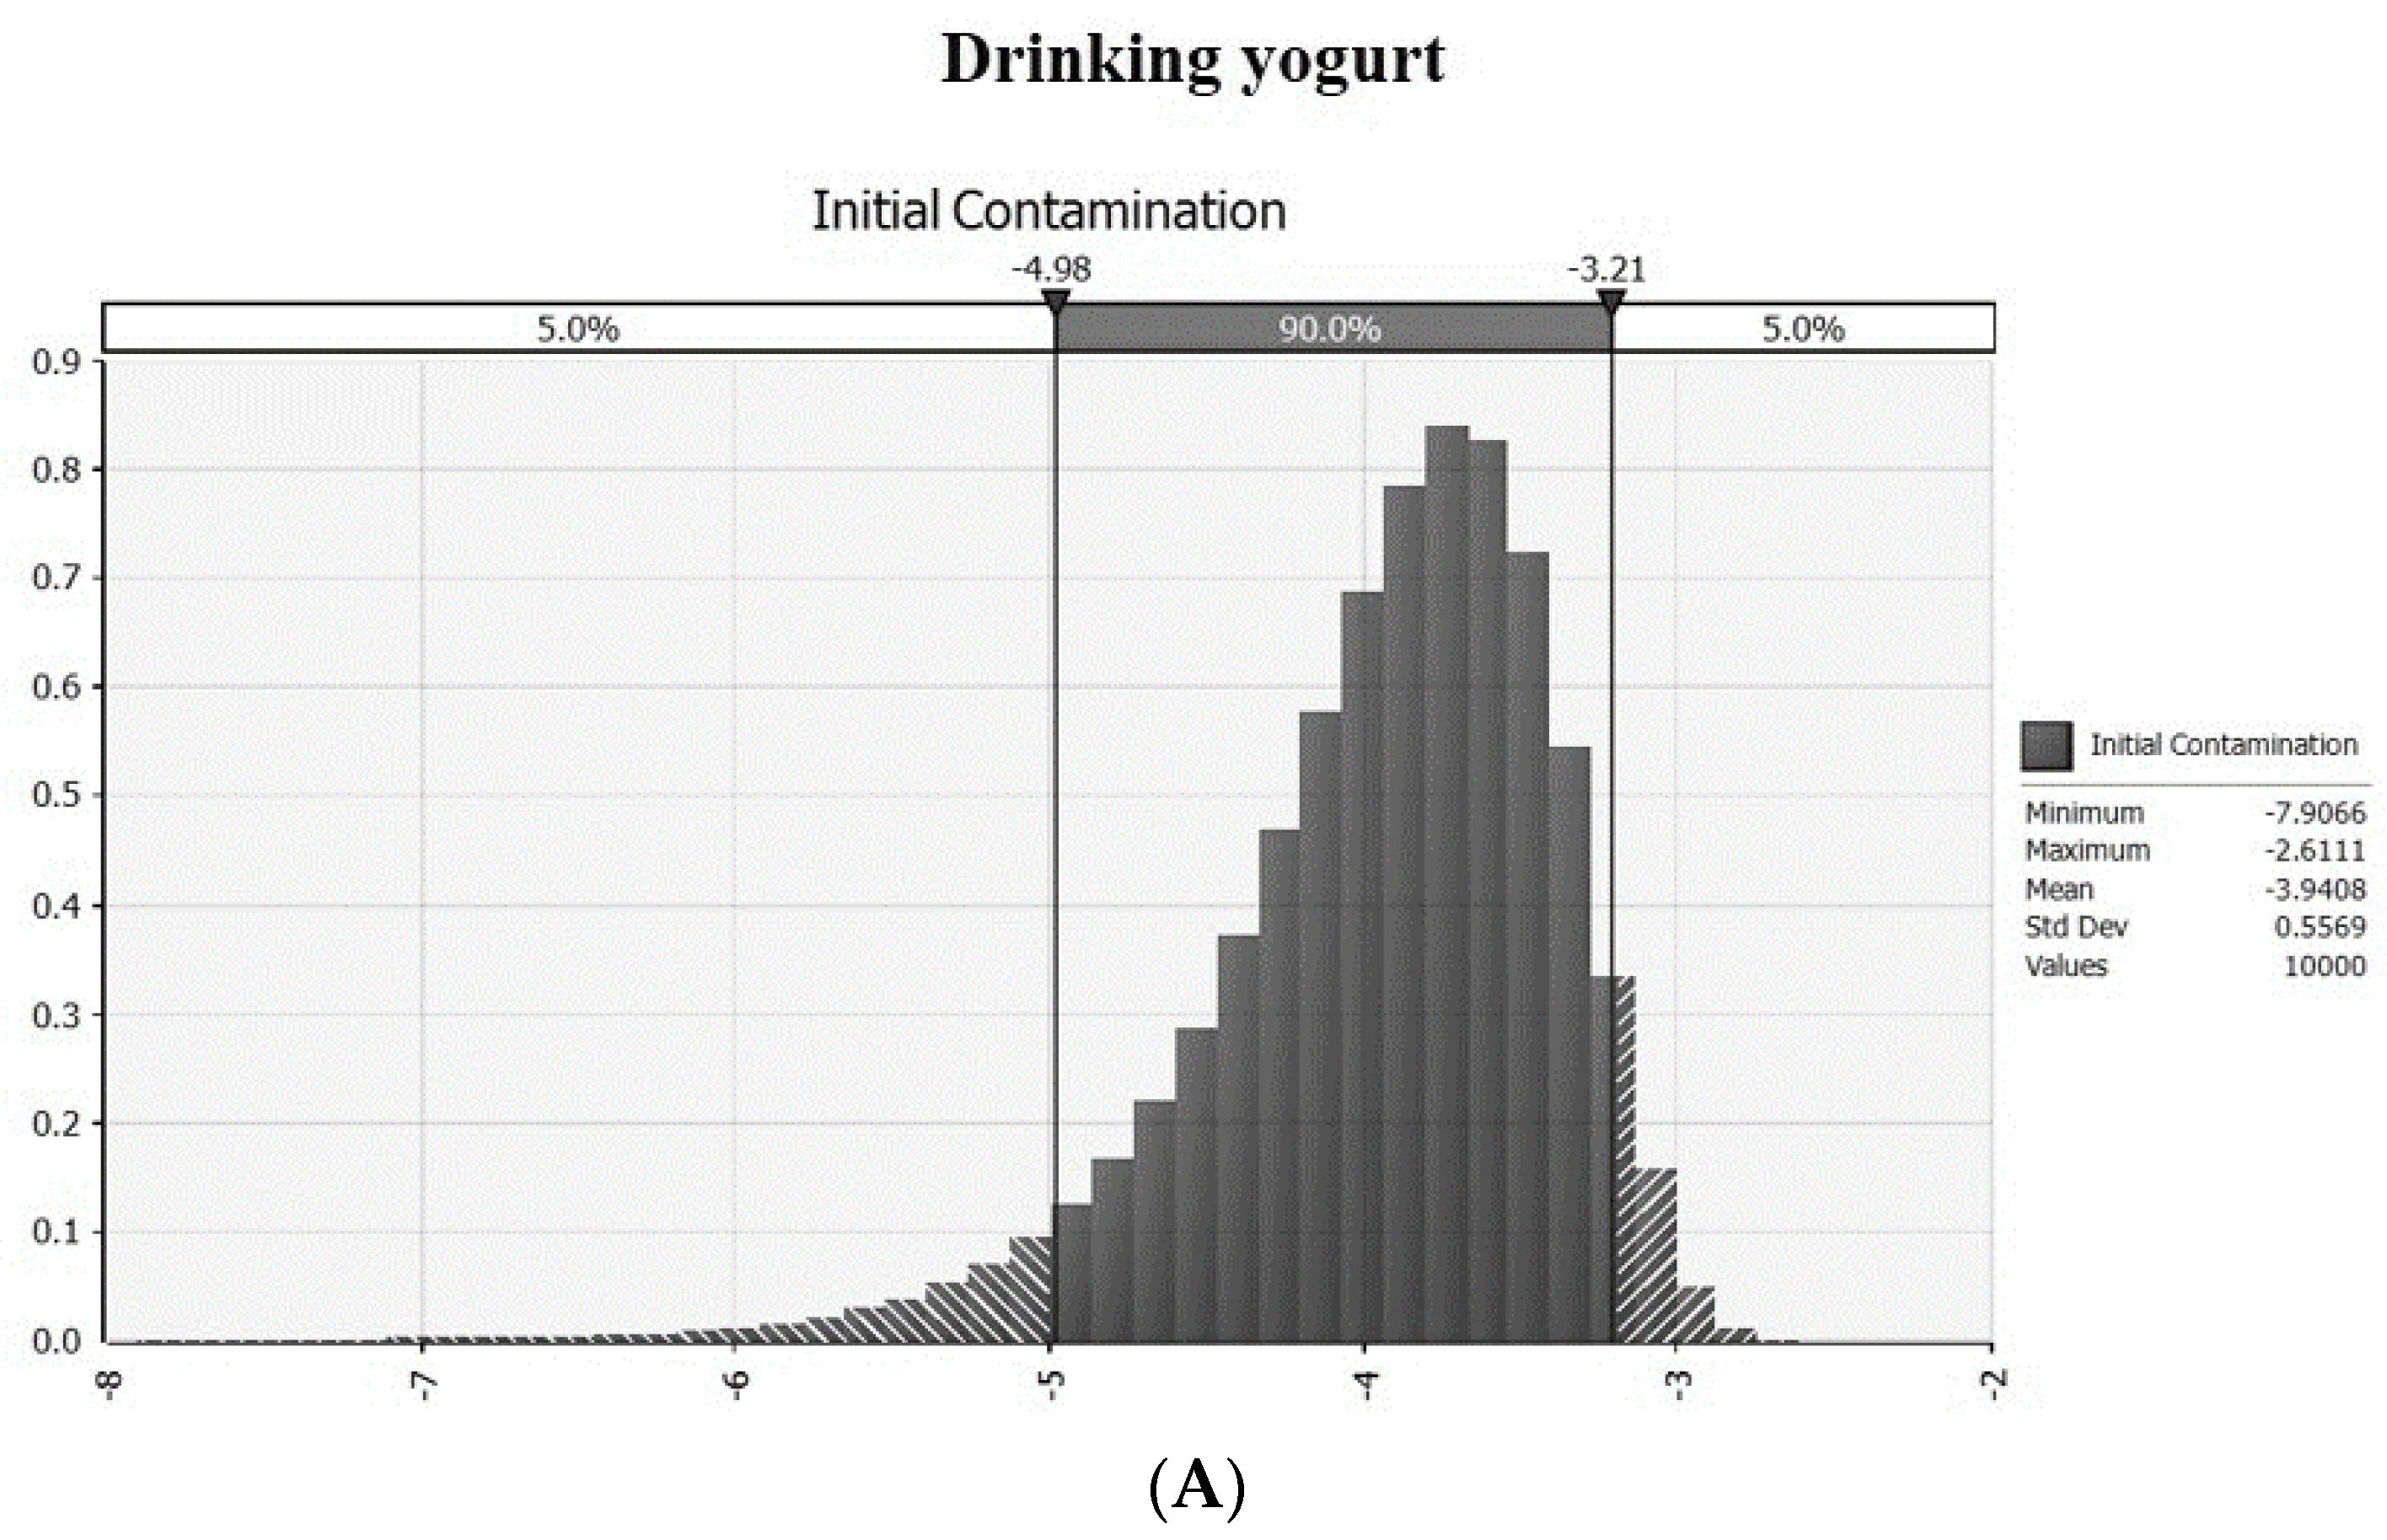
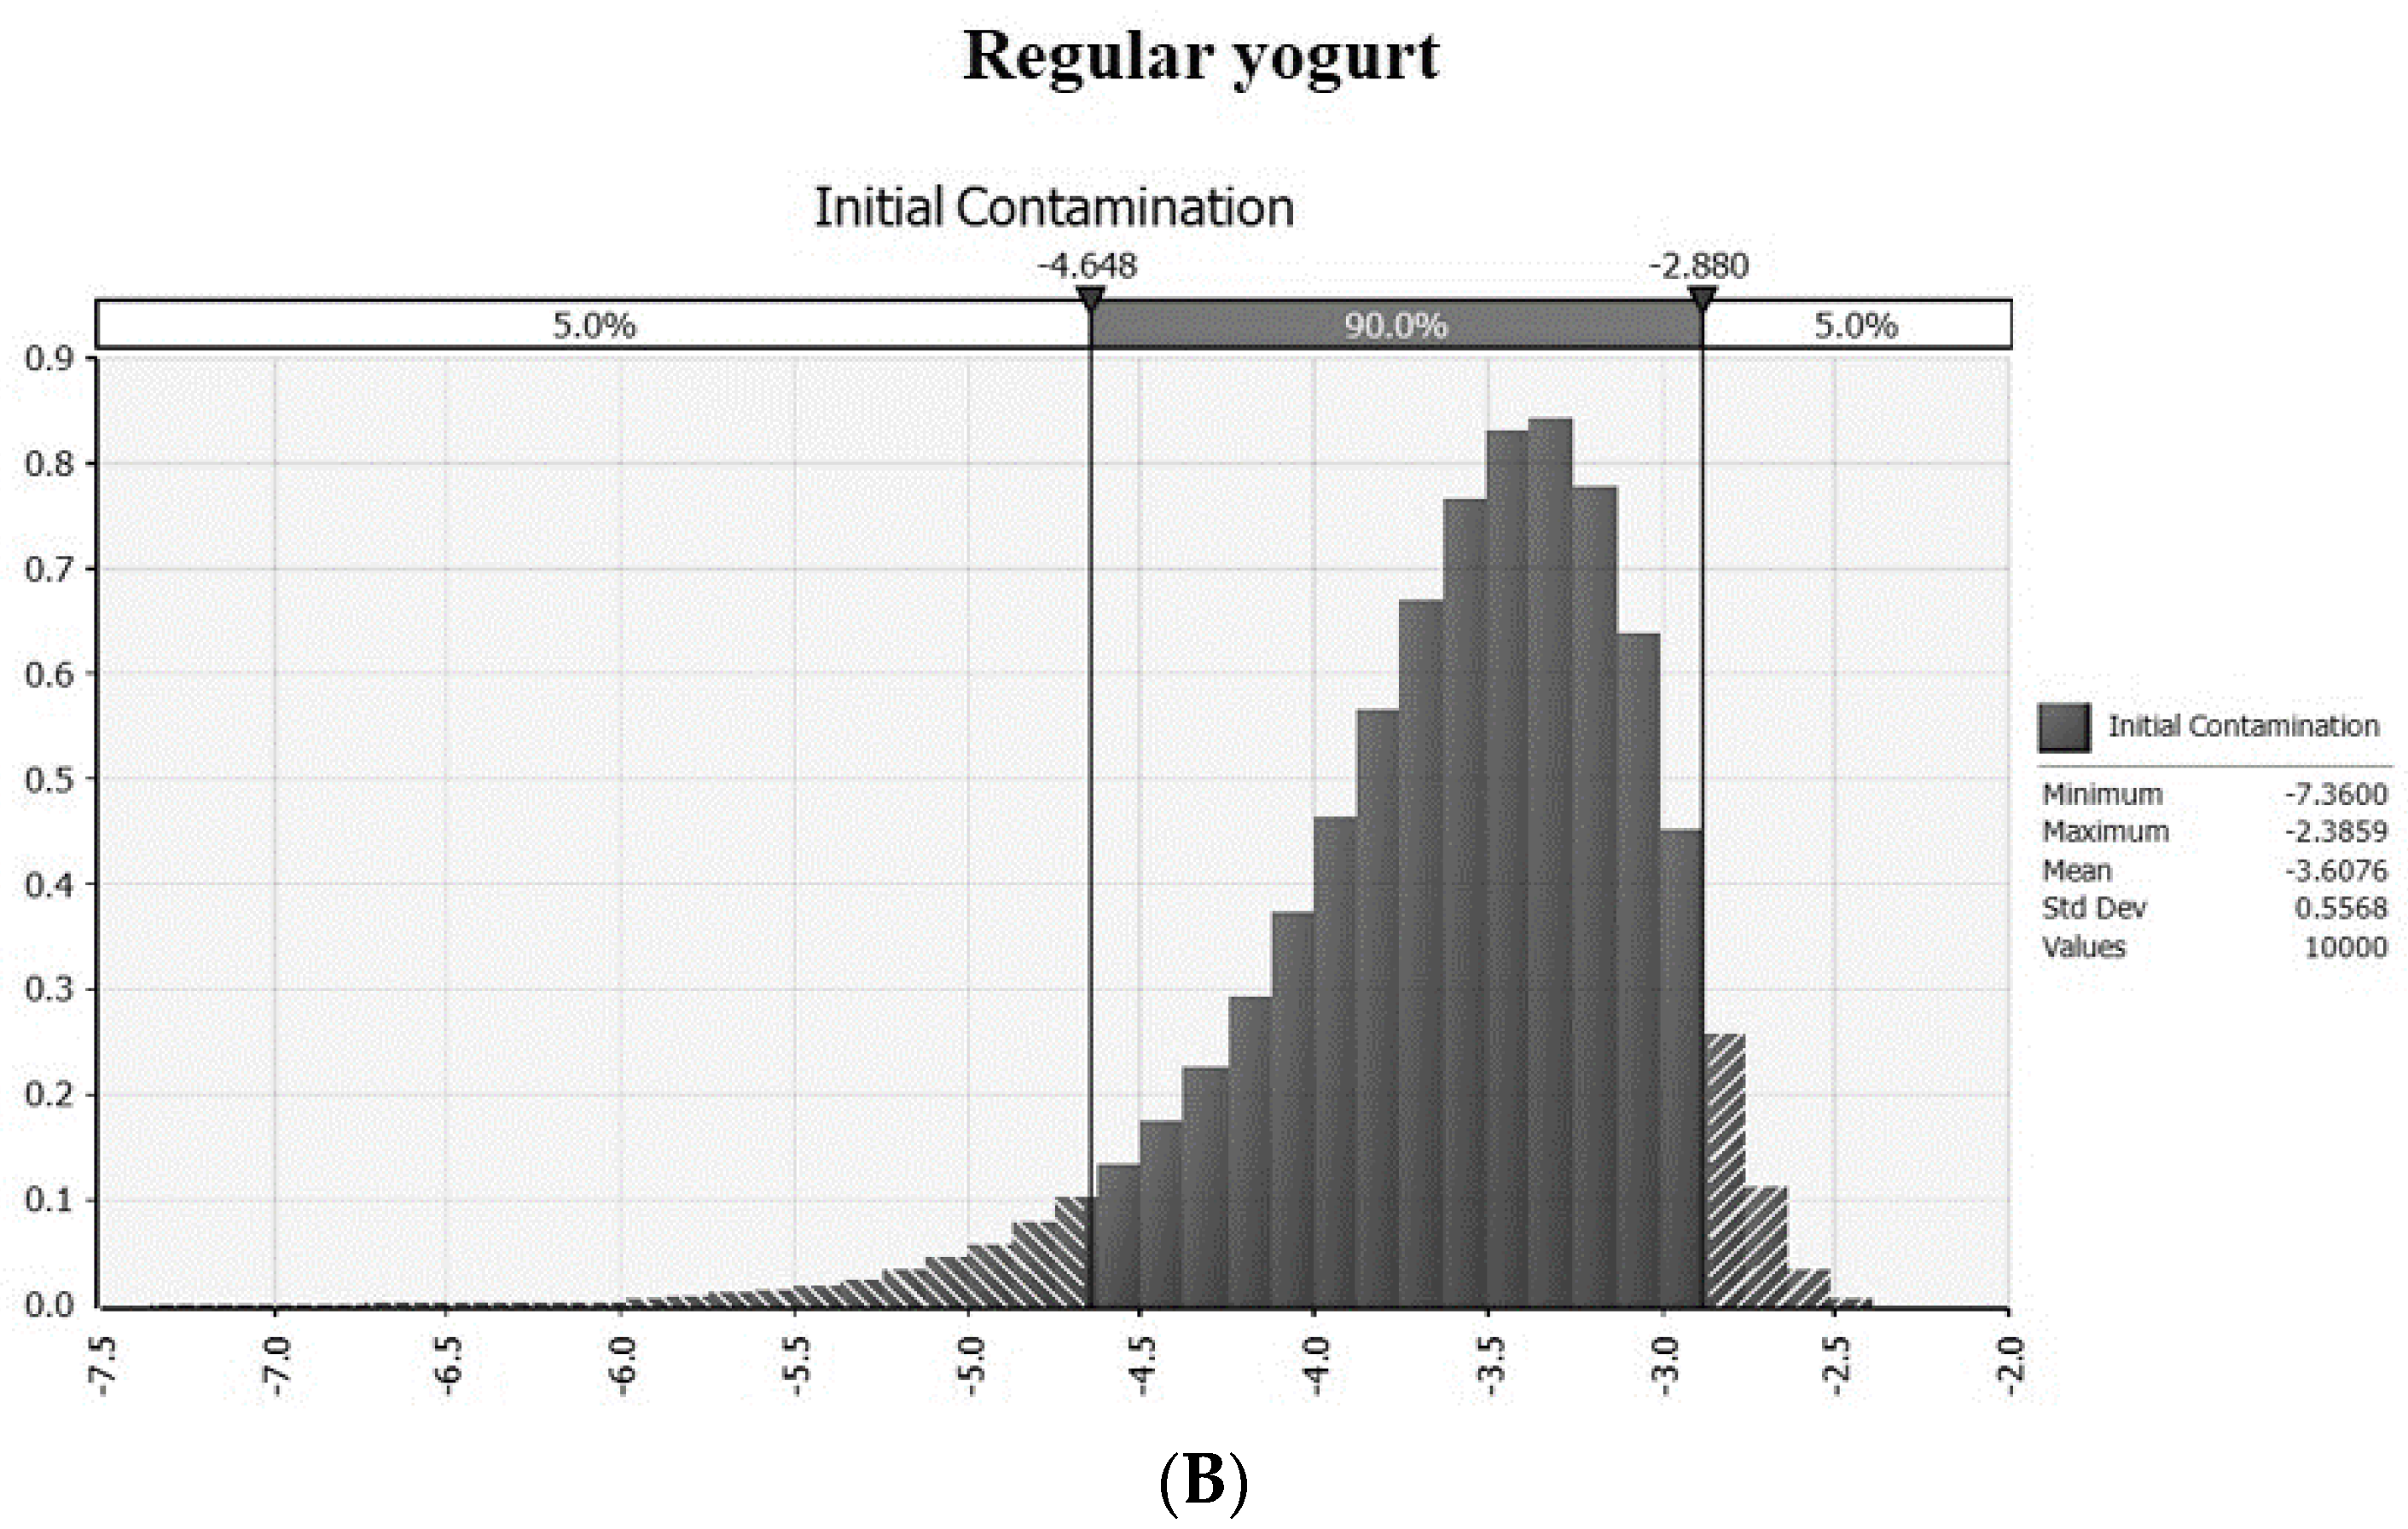
3.1. Prevalence and Intial Contamination Level in an On- an Offline Market

As a first step in the exposure assessment, initial contamination levels for LM and EHEC were analyzed for drinking yogurt (n = 195) and regular yogurt (n = 90) purchased from on and offline markets in Korea. LM and EHEC were not detected in any samples [24]. The average contamination level was calculated using the equation [Log (−ln(1−PR)/weight)] by Sanaa et al. [27]. The average initial contamination level of both LM and EHEC was −3.941 log CFU/g in the drinking yogurt and −3.608 log CFU/g in the regular yogurt (Figure 1).

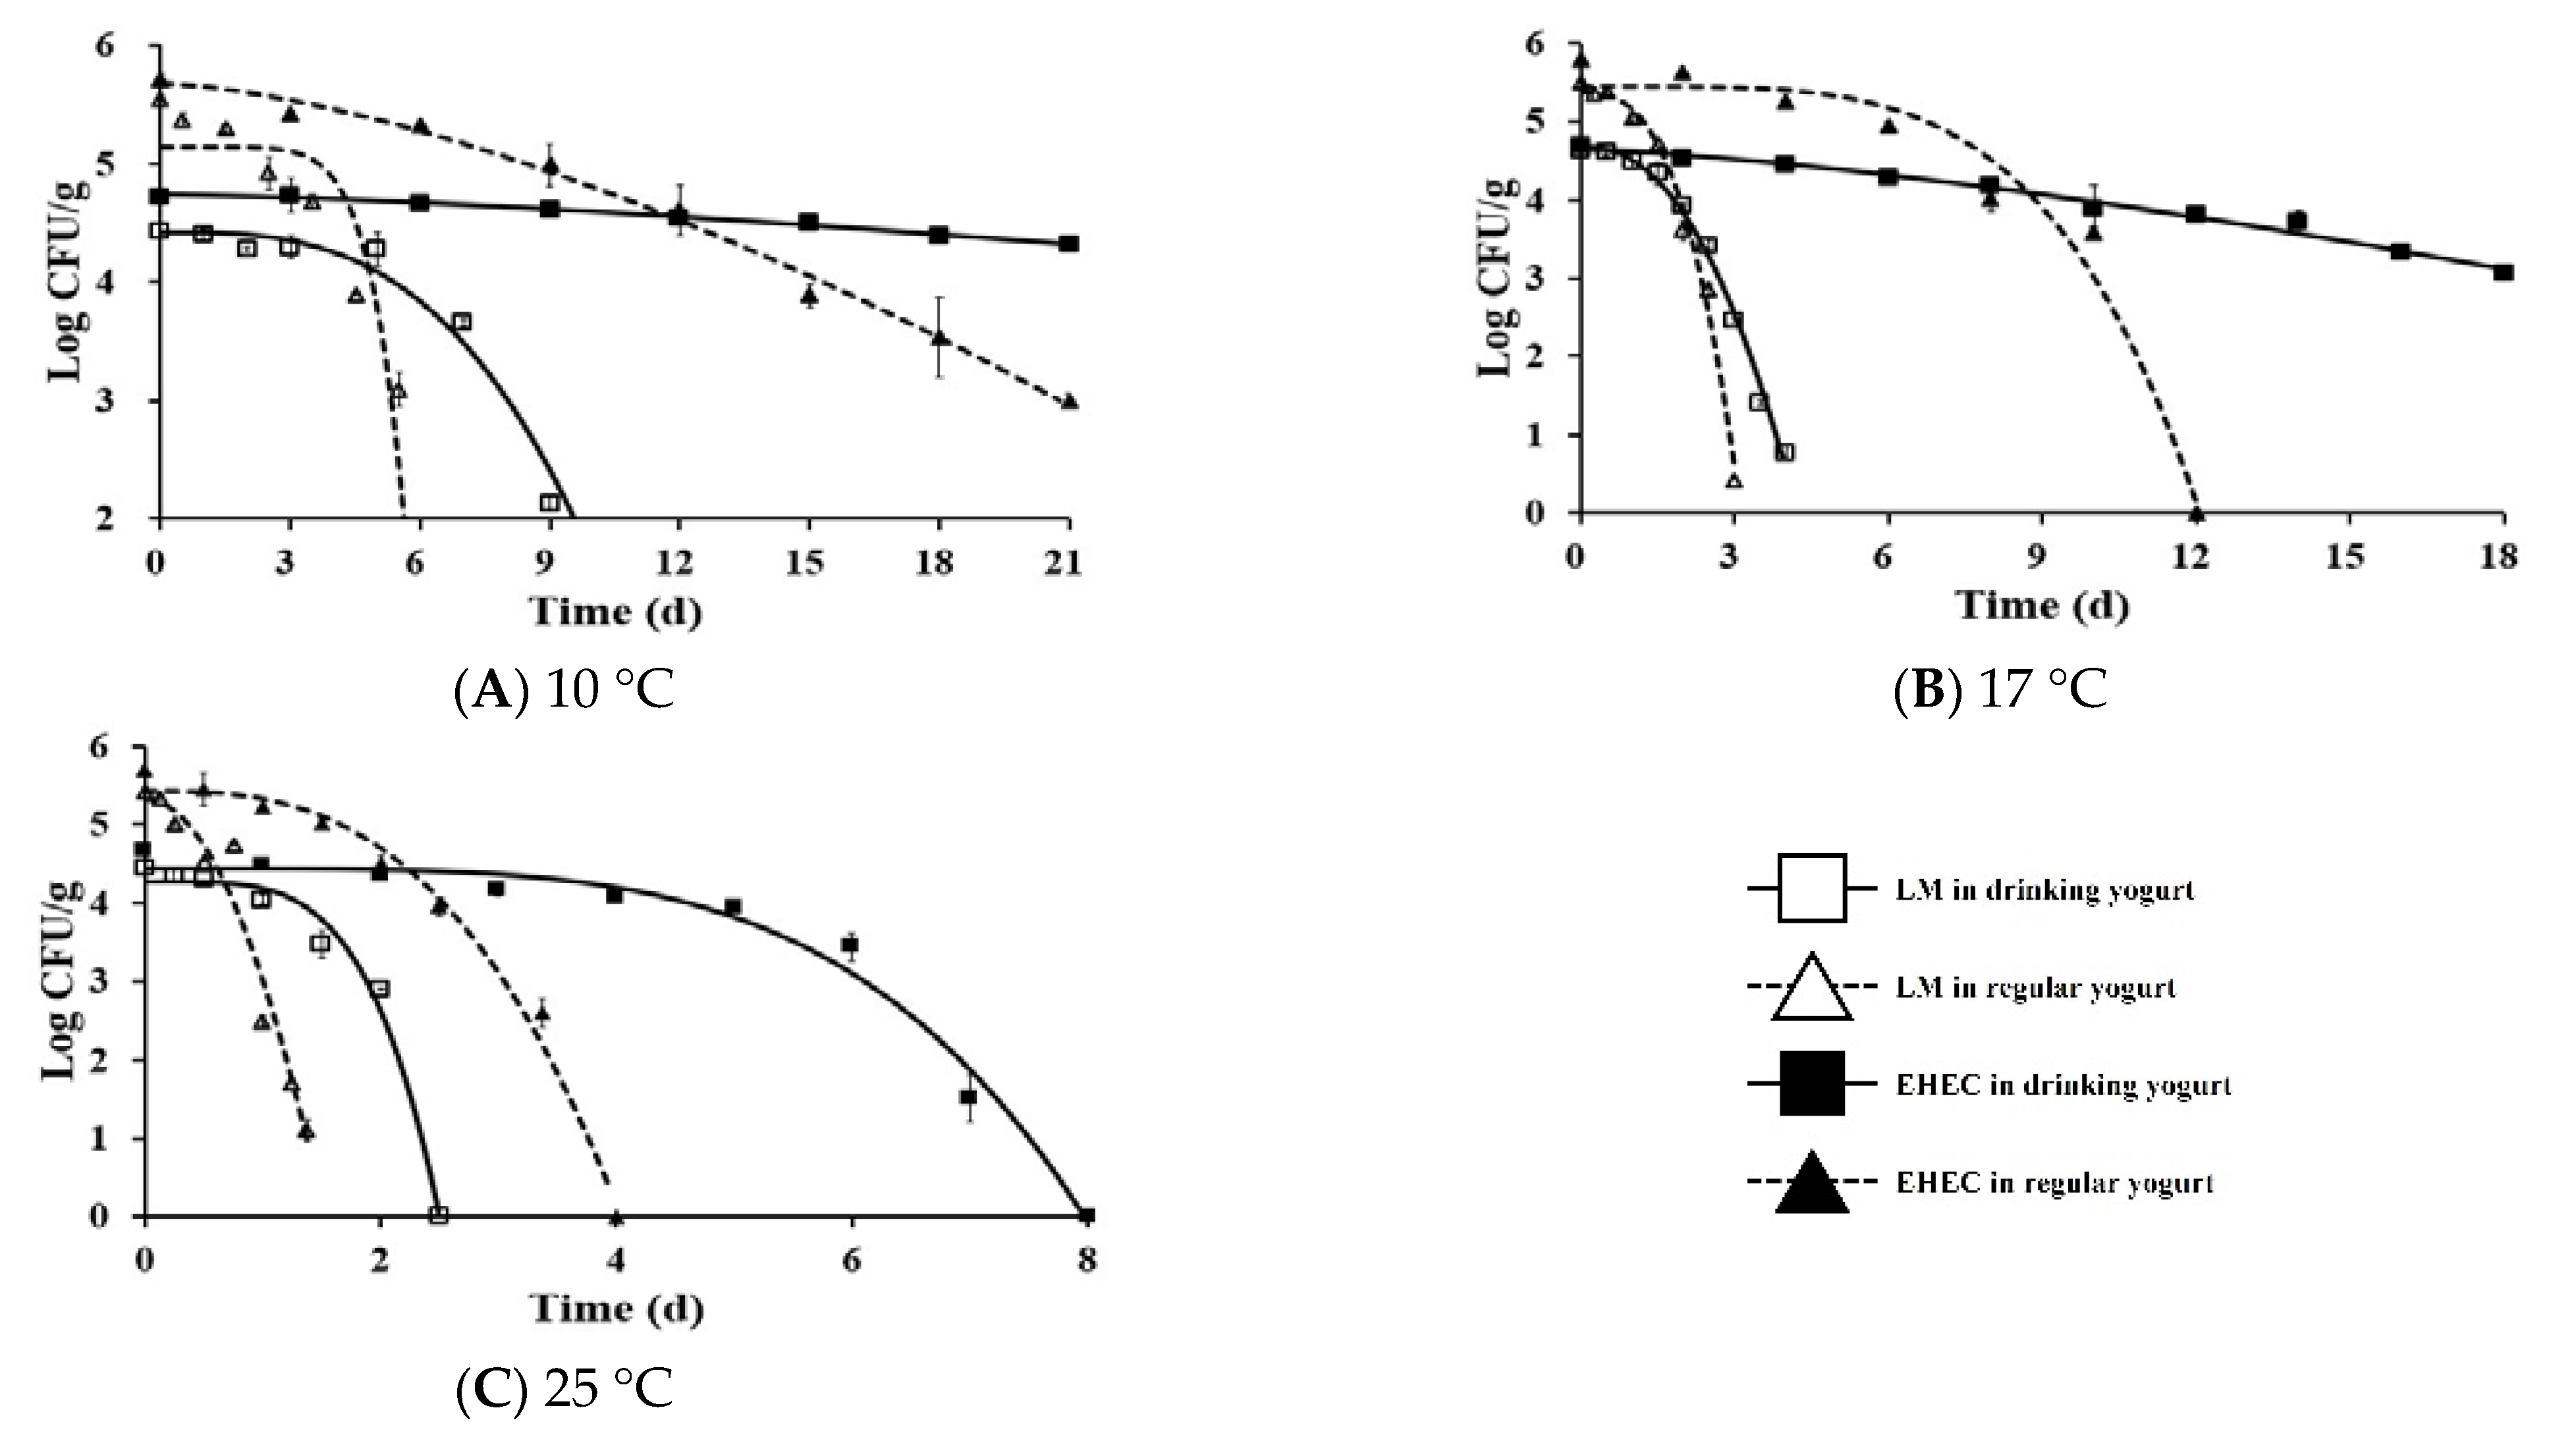
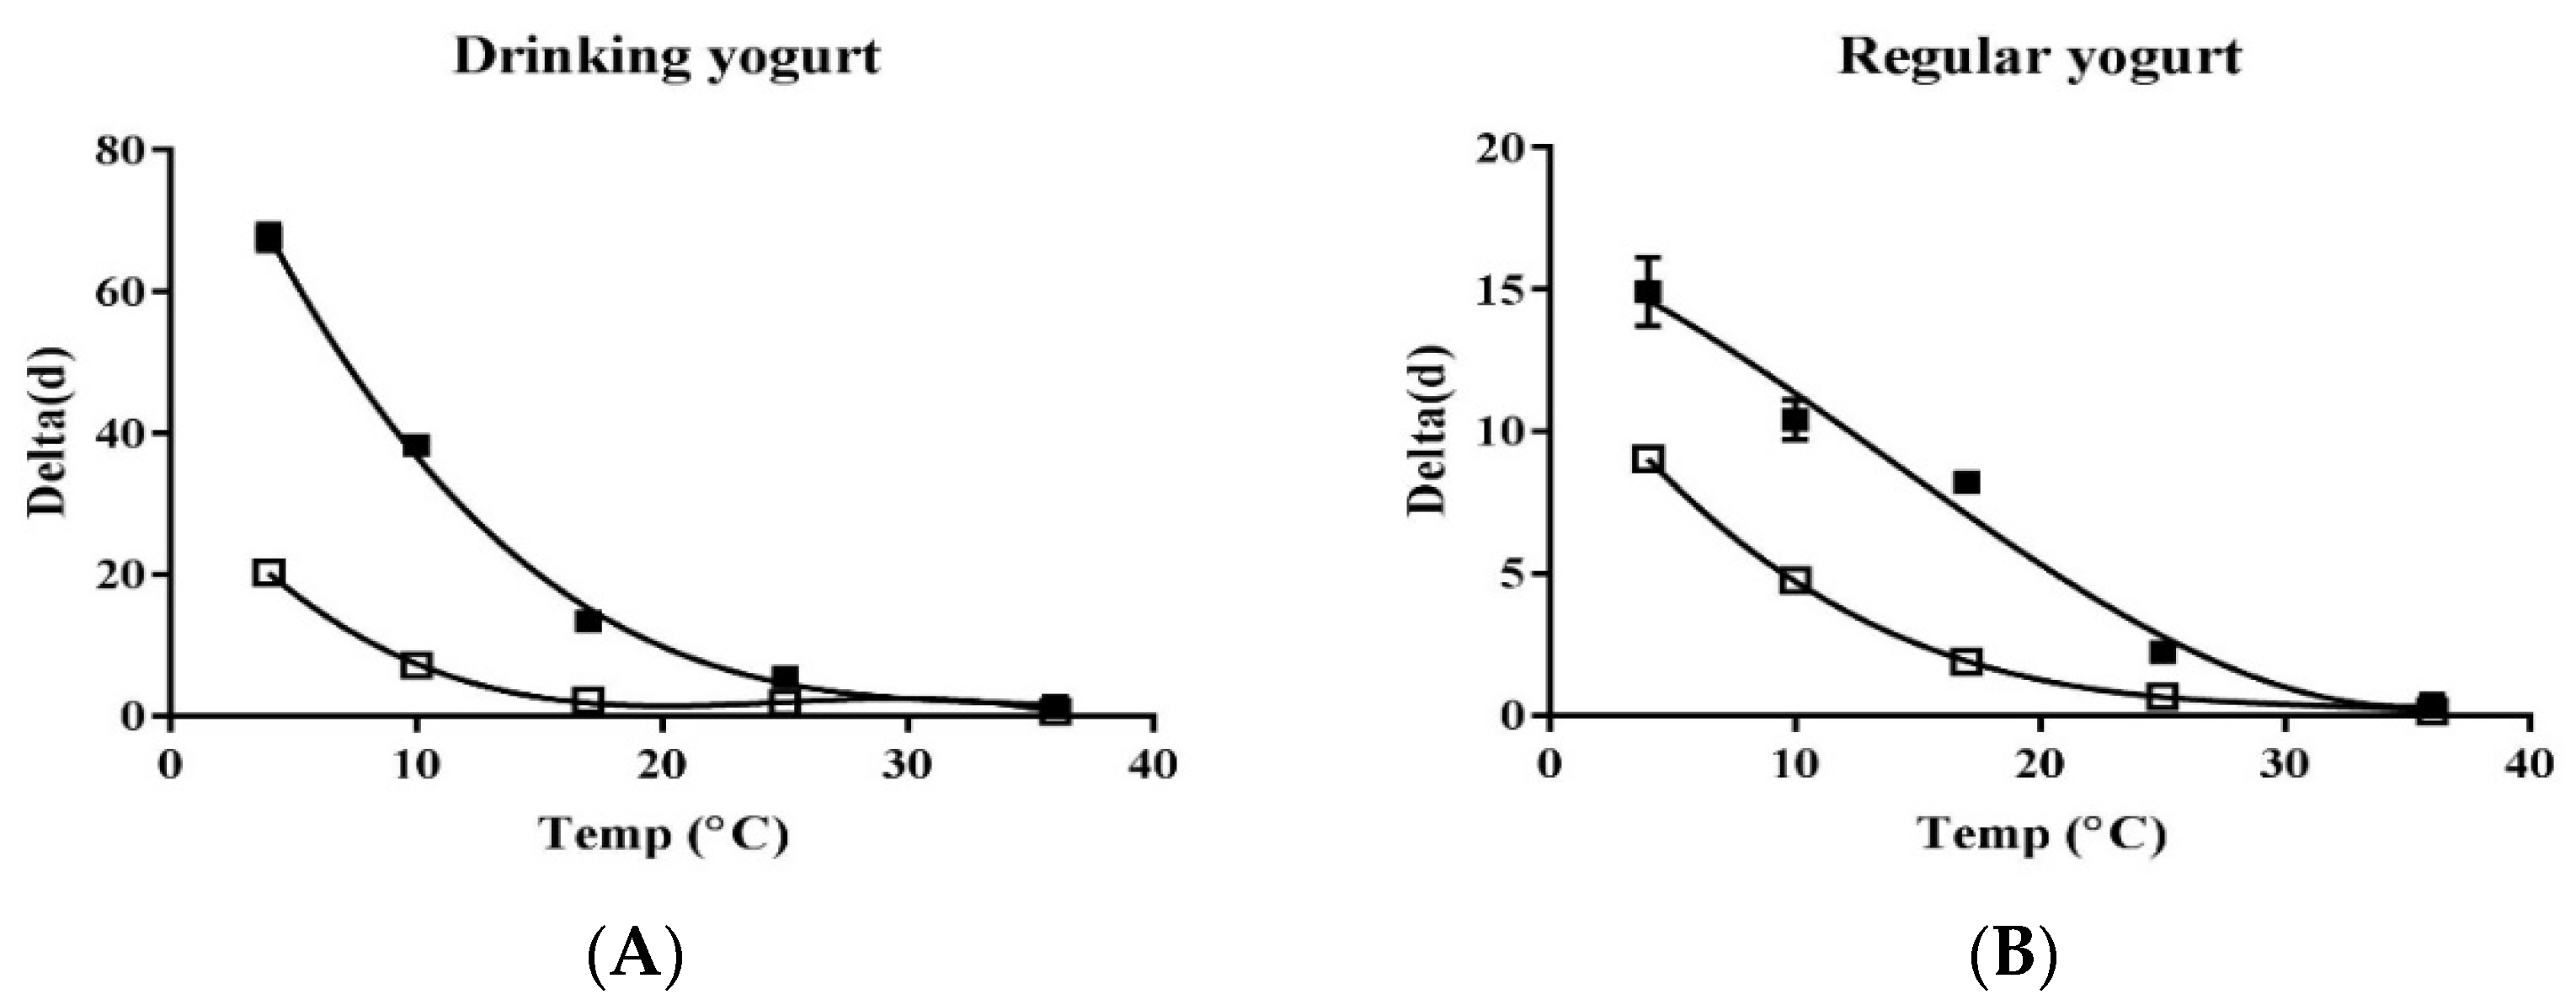
3.2. Development of Primary and Secondary Predictive Model

The primary models of LM and EHEC in yogurt are shown in Figure 2. Secondary predictive models of delta values for LM and EHEC and equations are shown in Figure 3. Delta values of LM at 4, 10, 17, 25, and 36 °C were 20.31, 7.16, 2.15, 1.81, and 0.62 days in drinking yogurt and 9.04, 4.76, 1.89, 0.66, and 0.14 days in regular yogurt, respectively. Delta values of EHEC at 4, 10, 17, 25, and 36 °C were 67.61, 38.31, 13.42, 5.51, and 1.42 days in drinking yogurt and 14.93, 10.41, 8.21, 2.23, and 0.42 days in regular yogurt, respectively (Table 1). The delta value corresponds to the time for the first decimal reduction of the surviving populations of LM and EHEC. Overall, the higher the temperature, the lower the delta value, indicating that survival of LM and EHEC is better in yogurt stored at refrigeration temperature. Lactic acid bacteria (LAB) activity in yogurt increases as the temperature increases. Thus, the viability of LM and EHEC can be decreased. LAB can produce large amounts of organic acids and lower the pH value [38]. Some LAB can also produce bacteriocins and bacteriocin-like compounds to inhibit pathogens [39]. The temperature can affect the growth of LAB, and LAB isolated from Calabrian cheeses can inhibit the growth of LM in soft cheese [40]. LAB has the highest specific growth rate at 42–44 °C, the optimum growth temperature for LAB [41]. LAB starters can reduce the survival ability of EHEC in kimchi [42]. Bachrouri et al. [43] have reported that the viability of E. coli O157:H7 decreased as the temperature increased and E. coli O157:H7 is more resistant to death than nonpathogenic E. coli at 4 and 8 °C. The survival ability of LM is drastically decreased at 15 °C, but not significantly changed at 3~12 °C [44].
This work also noticed that LM and EHEC died faster in regular yogurt than in drinking yogurt due to the lower pH of regular yogurt (4.14 ± 0.02) than drinking yogurt (4.60 ± 0.02). This result is consistent with the study of Millet et al. [45], showing that low pH can decrease the growth of LM in raw-milk cheese. Guraya et al. [46] have also suggested that the viability of EHEC is drastically decreased in yogurt with pH below 4.1. Additionally, drinking yogurt has higher water activity (0.961 ± 0.001) than regular yogurt (0.943 ± 0.002) in this work. The Aw is the availability of the water in the product for microbes, and the higher the Aw, the better microorganism can survive. At 10 °C, the highest survival ability of EHEC was observed in drinking yogurt, followed by EHEC in regular yogurt, LM in drinking yogurt, and LM in regular yogurt (Figure 2). Overall, EHEC survived better than LM at especially low temperatures, regardless of the kind of yogurt in this work (Figure 3).

3.3. Validation

RMSE value is one of the parameters that can estimate the accuracy of the predictive model, and it was used to calculate the suitability of the model. The predictive model can be considered perfect if RMSE values are close to zero [47]. According to the study of model development using the Weibull model in heat-stressed E. coli O157:H7 and L. monocytogenes in kefir, RMSE values ranged from 0.13 to 0.52 in E. coli O157:H7 and 0.06 to 0.82 in L. monocytogenes [48]. The RMSE value calculated from the estimated data of LM was 0.185 in drinking yogurt and 0.115 in regular yogurt for interpolation. The RMSE value of EPEC was 1.079 in drinking yogurt and 1.001 in regular yogurt for extrapolation. As a result, the developed models in this study were judged to be appropriate to predict the survival of LM, EHEC, and EPEC in drinking and regular yogurt.

3.4. Change in Contamination Level of Listeria Monocytogenes and EHEC from Market to Home

The average contamination level of LM decreased −4.396 log CFU/g in drinking yogurt and −7.965 log CFU/g in regular yogurt at the market. The average contamination level of drinking yogurt during transportation from market to home was slightly decreased to −4.396 log CFU/g, and there was no change in regular yogurt. It was further decreased −5.00 log CFU/g for drinking yogurt and −10.25 log CFU/g for regular yogurt during storage at home before consumption.
The initial contamination level of EHEC was the same as that of LM. The contamination level of EHEC was −3.957 log CFU/g in drinking yogurt and −4.244 log CFU/g in regular yogurt at the market, which was maintained when yogurt was transported from market to home. The contamination level decreased −3.969 log CFU/g in drinking yogurt and −4.71 log CFU/g in regular yogurt before consumption at home. The contamination level of both LM and EHEC decreased in yogurt from the market to home because both pathogens cannot grow in yogurt, regardless of the type of yogurt. In this work, a more rapid decrease of contamination level of LM was observed than EHEC in regular yogurt.
Hu et al. [49] observed that organic acid produced from Lactobacillus plantarum isolated from traditional dairy products (kumis, milk thistle, yogurt) exhibits antimicrobial activity against pathogenic bacteria. They found that different proportions of organic acid (primarily lactic and acetic acid) show different antimicrobial activity against pathogenic bacteria. The difference in the proportion of organic acid between drinking and regular yogurt may affect the behavior of pathogens in yogurt.

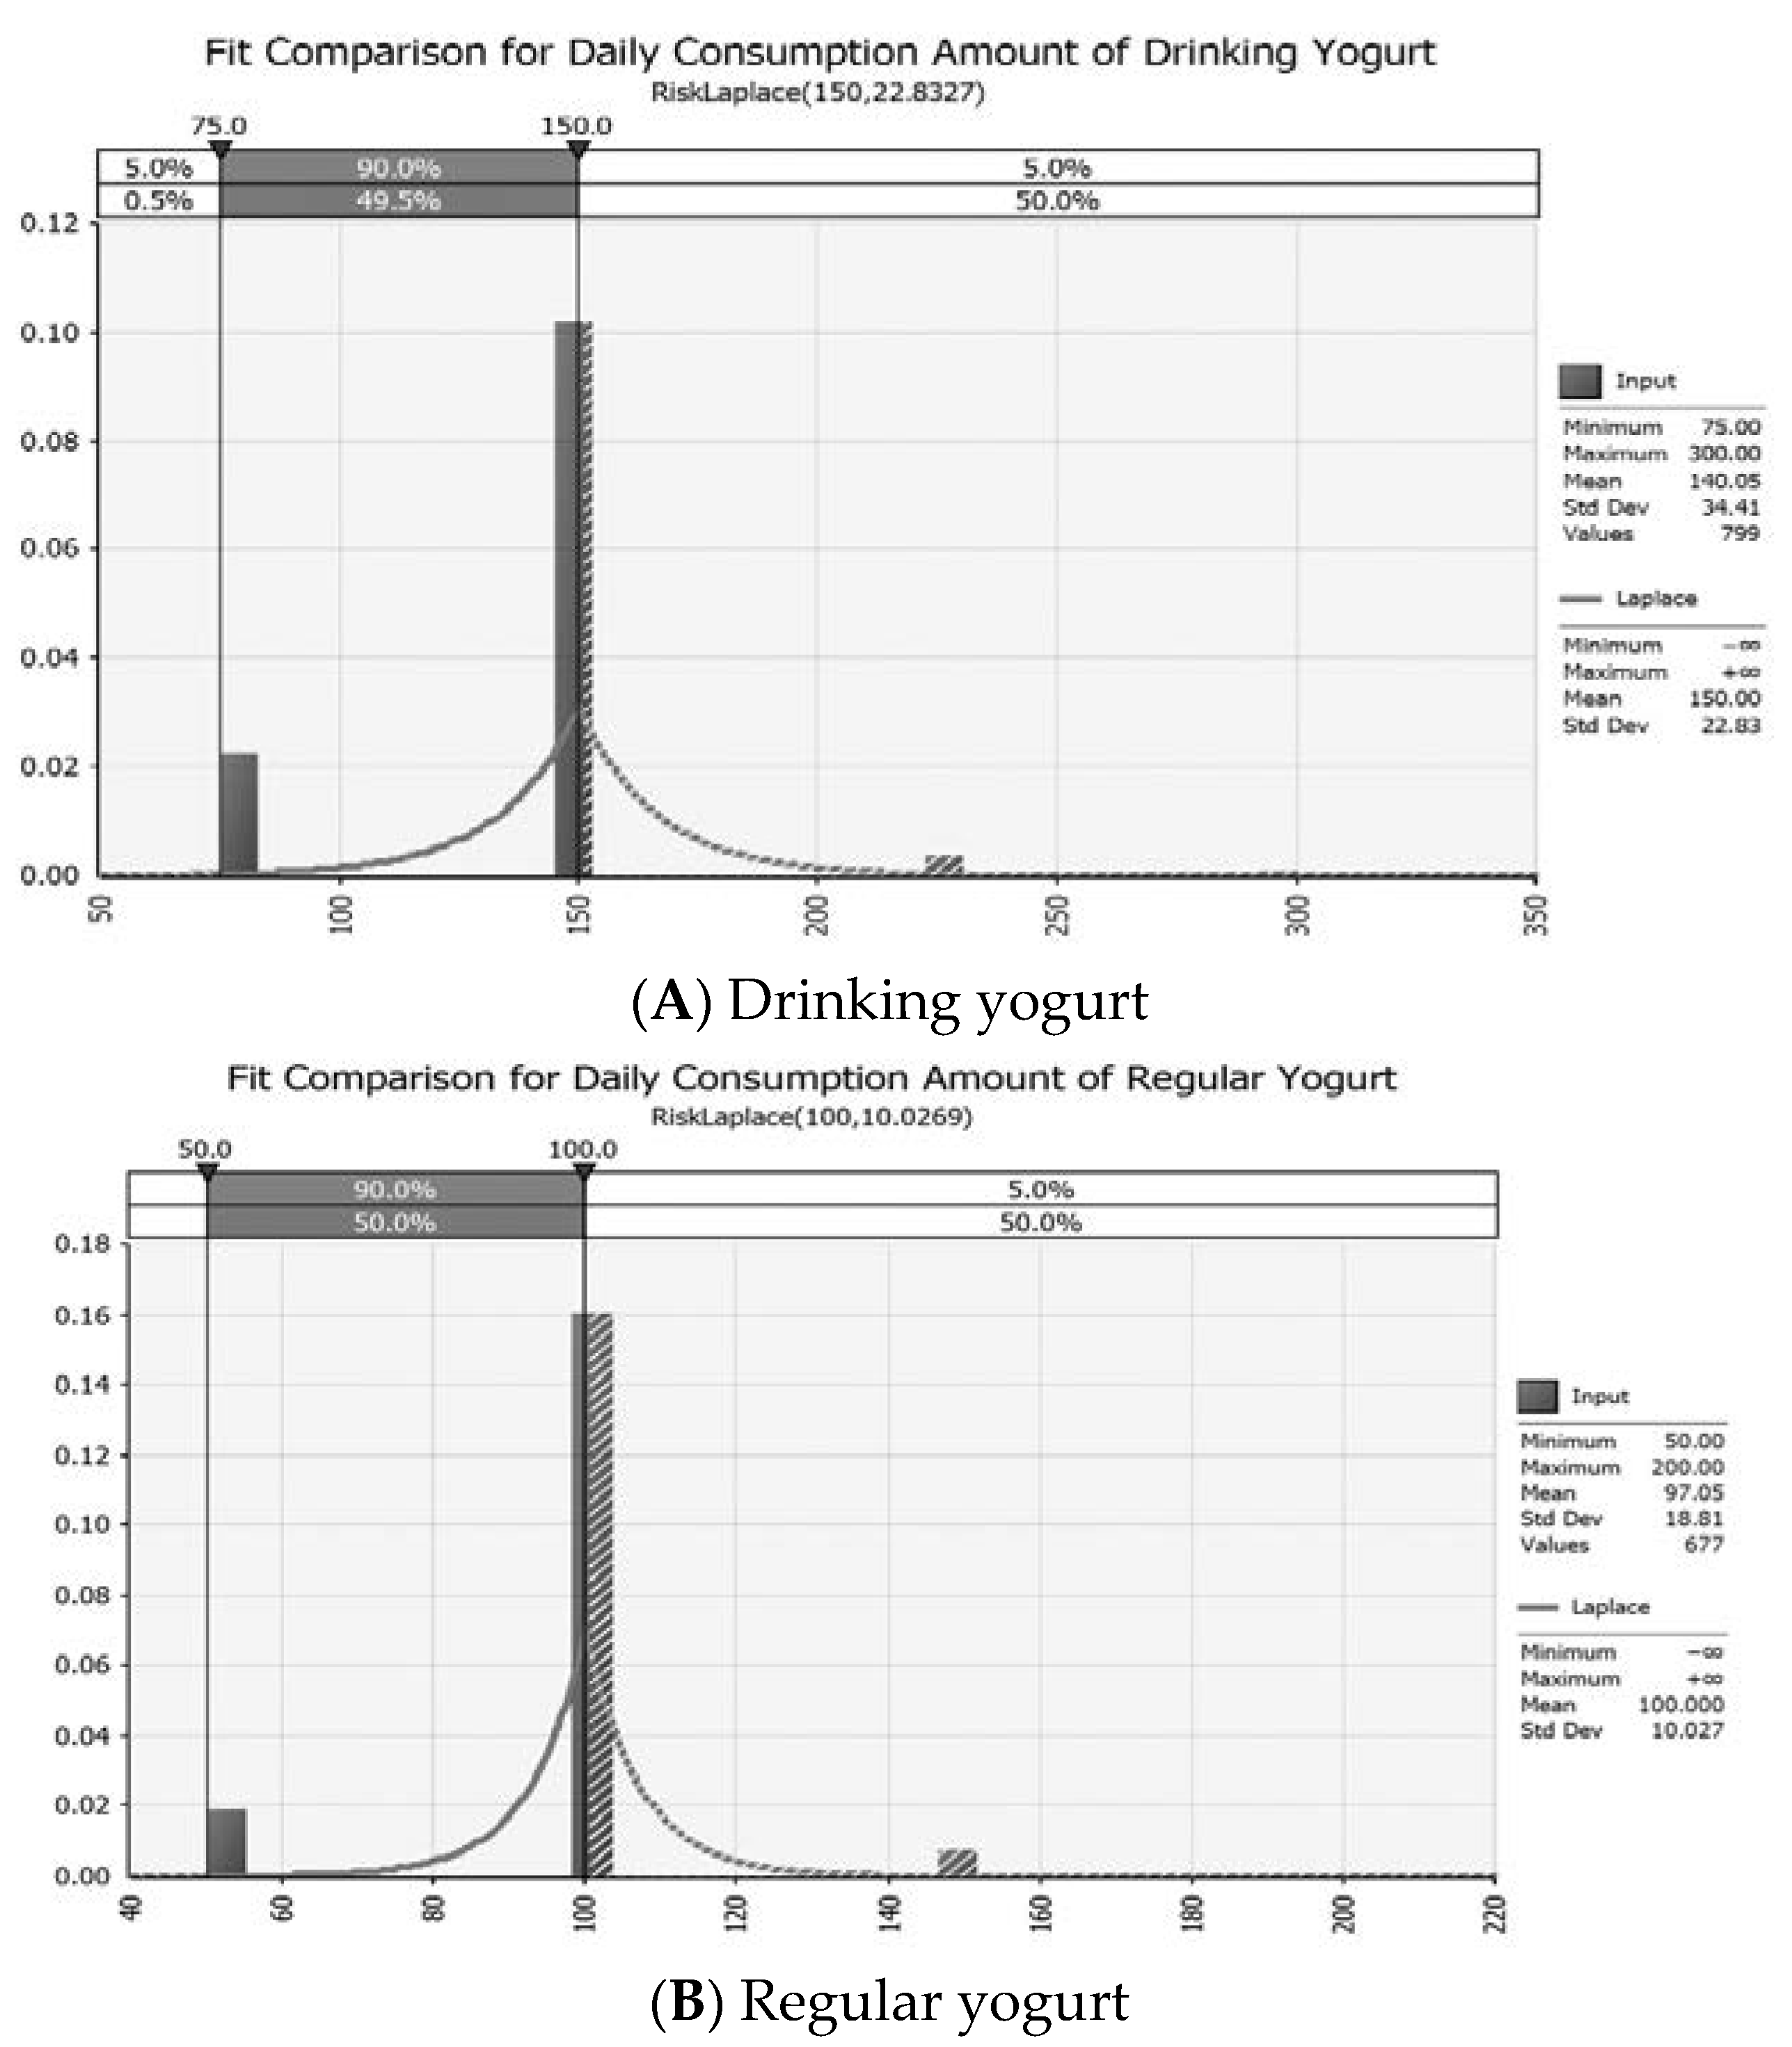
3.5. Consumption Data of Yogurt

The consumption amount and intake rate of yogurt are shown in Figure 4. As a result of fitting the distribution with @Risk, the RiskLaplace model was found to be the most suitable. Daily average consumption amounts of drinking yogurt and regular yogurt were 140 g and 97.046 g, respectively. Intake rates for drinking yogurt and regular yogurt were calculated to be 0.184 and 0.146, respectively. It could be concluded that the consumption of drinking yogurt was higher than that of regular yogurt.

3.6. Hazard Characterization and Risk Characterization

Final risks of LM and EHEC in yogurt were analyzed by separating susceptible population and general population using contamination level, consumption data, and dose–response model derived according to the scenario of the market to home (Table 2 and Table 3). As a result, no risk was estimated for the general group due to LM. However, the probability risk of foodborne illness due to LM was 1.91 × 10⁻¹⁵ in drinking yogurt and 2.87 × 10⁻¹⁶ in regular yogurt for susceptible populations per day. It is concluded that the risk of listeriosis is very low with yogurt consumption. The risk assessment result on LM in milk [36] demonstrates that the risk of milk consumption is also low (5.0 × 10⁻⁹ cases per serving).
By contrast, this was calculated to be 1.44 × 10⁻⁸ in drinking yogurt and 5.09 × 10⁻⁹ in regular yogurt with EHEC (Table 4). The risk of foodborne illness from both pathogens was higher from drinking yogurt due to its higher survival ability than regular yogurt. Additionally, the highest risk was found for EHEC in drinking yogurt due to the highest survival ability of EHEC in drinking yogurt (Figure 2), in which the highest delta value was noticed. As a result, the risk of EHEC is higher than LM in yogurt. Yogurt has an inhibition effect on pathogenic microorganisms due to organic acids such as lactic acid and acetic acid, which were produced by LAB [50], low pH below 4.1 [46], and bacteriocin or bacteriocin-like substances produced by LAB [51]. Yang et al. [51] isolated and identified bacteriocinogenic LAB from various cheeses and yogurts. They found that 20% of isolates (28 isolates) out of 138 LAB isolates had antimicrobial effects on all microorganisms tested, except for E. coli. In the present study, we found that EHEC shows better survival ability than LM in both types of yogurts. A similar trend was reported by Gulmez and Guven [52], who compared the inhibitory effects of LM, E. coli O157:H7, and Yersinia enterocolitica in yogurt and kefir samples during 24 h fermentation time and 10 days of storage. They found that E. coli O157:H7 showed the highest resistance during the yogurt’s fermentation and storage time. The most recent study showed [53] that most of the bacteriocins produced by LAB isolates are active against Gram-positive bacteria, such as LM and Staphylococcus aureus, whereas Gram-negative bacteria, E. coli, and Salmonella Typhimurium, displayed considerable resistance.

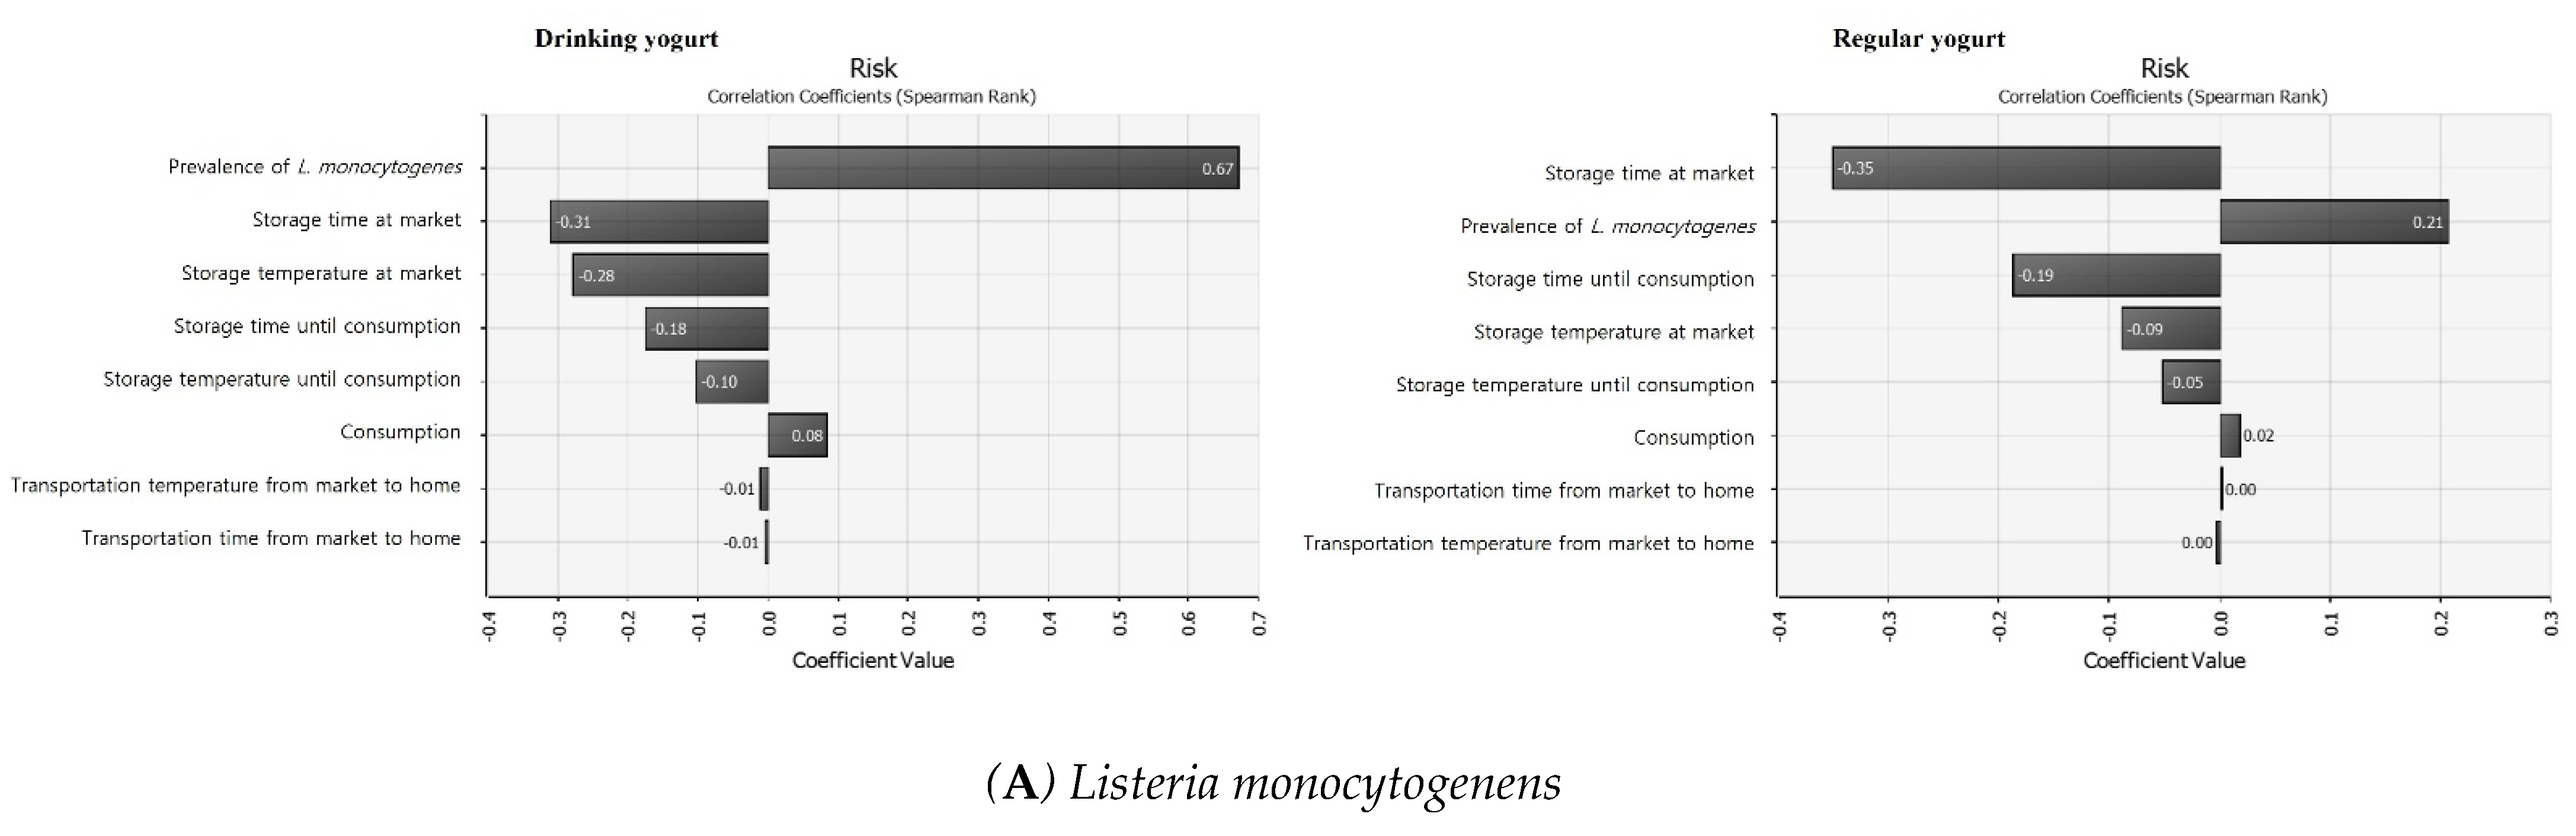
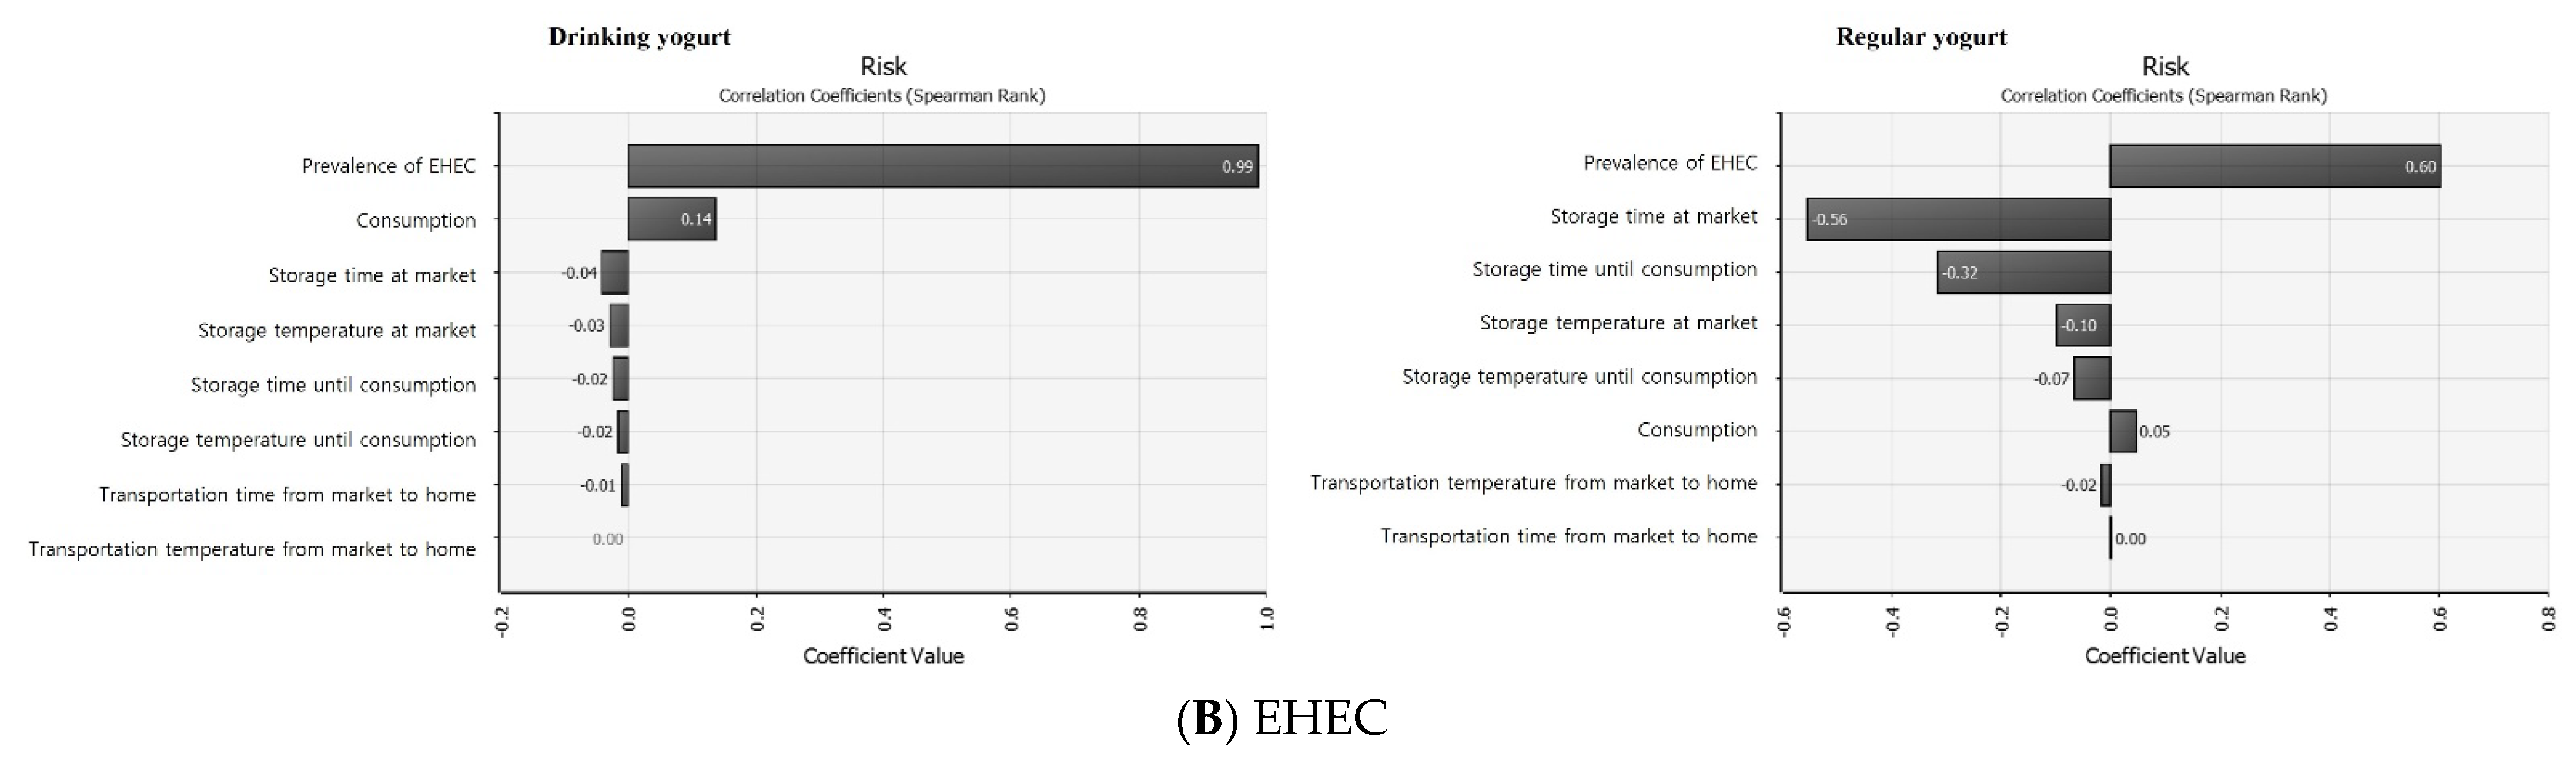
3.7. Sensitivity Analysis

Sensitivity analysis was conducted to identify input variables with a major influence on results. If the result has a negative value, it has a negative correlation. As the input value increases, the output value decreases. If it is 0, there is no correlation. A positive value indicates a positive correlation, meaning that the output value increases as the input value increases [54]. Results of analysis of regression coefficients for the probability risk of foodborne illness caused by LM and EHEC due to yogurt consumption are shown in Figure 5. Both pathogens had a negative correlation with storage time at the market. The risk of foodborne illness decreased with increased storage time at the market. Both pathogens had the greatest positive correlation with the initial contamination level and consumption. As a result, it is considered that initial hygiene management before manufacture can reduce the risk of LM and EHEC. LM can survive longer in yogurt when LM is contaminated with higher concentrations during yogurt manufacture [55]. Kasımoğlu and Akgün [56] found that yogurt contaminated at 102 CFU/g level of E. coli O157:H7 has a lower elimination time than that contaminated at 106 CFU/g level. They suggested that the decline time of E. coli O157:H7 contaminated in the pre-fermentation stage could be affected by the initial contamination level. Therefore, initial hygiene management is important to inhibit the contamination and reduce the risk of pathogens in yogurt.

4. Conclusions

Results showed that the risk of serious illness from LM and EHEC due to drinking and regular yogurt consumption is very low. Yogurt does not permit the growth of LM and EHEC during storage at 4, 10, 17, 25, and 36 °C. The contamination level of both LM and EHEC decreased in yogurt from the market to home, and LM and EHEC died faster in regular yogurt than in drinking yogurt. However, controlling the initial contamination level of EHEC during yogurt manufacture should be emphasized because its survival ability in yogurt is higher in both drinking and regular yogurt than LM.

Author Contributions

Investigation, S.Y.Y.; methodology, S.Y.Y. and K.S.Y.; project administration, K.S.Y.; writing—original draft, S.Y.Y.; writing—review and editing, K.S.Y. All authors have read and agreed to the published version of the manuscript.

Funding

This research was funded by the Ministry of Food and Drug Safety in Korea, grant number 20162MFDS027.

Institutional Review Board Statement

Not applicable.

Informed Consent Statement

Not applicable.

Data Availability Statement

We did not report any additional data for this study.

Conflicts of Interest

The authors declare no conflict of interest.

References

  1. Hamann, W.T.; Marth, E.H. Survival of Streptococcus thermophilus and Lactobacillus bulgaricus in commercial and experimental yogurts. J. Food Prot. 1984, 47, 781–786. [Google Scholar] [CrossRef] [PubMed]
  2. Korea Health Supplements Association (KHSA). Consumer and Market Research Report. 2020. Available online: https://www.khsa.or.kr/user/info/InfoBoardUserView.do?_menuNo=374&boardSeqno=10039&postsSeqno=114886. (accessed on 18 August 2021).
  3. Korea Dairy Committee. Distribution Consumption Statistics (2010–2020). 2021. Available online: https://www.dairy.or.kr/kor/sub05/menu_01_5_1.php (accessed on 18 August 2021).
  4. Nyanzi, R.; Jooste, P.J.; Buys, E.M. Invited review: Probiotic yogurt quality criteria, regulatory framework, clinical evidence, and analytical aspects. J. Dairy Sci. 2021, 104, 1–19. [Google Scholar] [CrossRef] [PubMed]
  5. Kaper, J.B.; Nataro, J.P.; Mobley, H.L. Pathogenic Escherichia coli. Nat. Rev. Microbiol 2004, 2, 123–140. [Google Scholar] [CrossRef] [PubMed]
  6. Korea Disease Control and Prevention Agency (KDCA). The Prevalence of Pathogenic Escherichia coli Isolated by the Enteric Pathogens Active Surveillance Network (Enter-Net), 2010–2019. 2020. Available online: https://kdca.go.kr/board/board.es?mid=a20602010000&bid=0034&act=view&list_no=368538 (accessed on 23 August 2021).
  7. Paton, J.C.; Paton, A.W. Pathogenesis and diagnosis of Shiga toxin-producing Escherichia coli infections. Clin. Microbiol. Rev. 1988, 11, 450–479. [Google Scholar] [CrossRef] [Green Version]
  8. Kim, G.H.; Breidt, F.; Fratamico, P.; Oh, D.H. Acid resistance and molecular characterization of Escherichia coli O157: H7 and different non-O157 Shiga toxin-producing E. coli serogroups. J. Food Sci. 2015, 80, M2257–M2264. [Google Scholar] [CrossRef]
  9. Morgan, D.; Newman, C.P.; Hutchinson, D.N.; Walker, A.M.; Rowe, B.; Majid, F. Verotoxin producing Escherichia coli O 157 infections associated with the consumption of yoghurt. Epidemiol. Infect. 1993, 111, 181–188. [Google Scholar] [CrossRef] [Green Version]
  10. Cutrim, C.S.; de Barros, R.F.; da Costa, M.P.; Franco, R.M.; Conte-Junior, C.A.; Cortez, M.A.S. Survival of Escherichia coli O157: H7 during manufacture and storage of traditional and low lactose yogurt. LWT 2016, 70, 178–184. [Google Scholar] [CrossRef]
  11. Moineau-Jean, A.; Guévremont, E.; Champagne, C.P.; Roy, D.; Raymond, Y.; LaPointe, G. Fate of Escherichia coli and Kluyveromyces marxianus contaminants during storage of Greek-style yogurt produced by centrifugation or ultrafiltration. Int. Dairy J. 2017, 72, 36–43. [Google Scholar] [CrossRef]
  12. Farber, J.M.; Peterkin, P. Listeria monocytogenes, a food-borne pathogen. Microbiol. Rev. 1991, 55, 476–511. [Google Scholar] [CrossRef]
  13. Lado, B.; Yousef, A.E. Characteristics of Listeria monocytogenes Important to Food Processors. In Listeria, Listeriosis and Food Safety, 3rd ed.; Ryser, E.T., Marth, E.H., Eds.; CRC Press: Boca Raton, FL, USA, 2007. [Google Scholar]
  14. Radoshevich, L.; Cossart, P. Listeria monocytogenes: Towards a complete picture of its physiology and pathogenesis. Nat. Rev. Microbiol. 2018, 16, 32–46. [Google Scholar] [CrossRef]
  15. Vázquez-Boland, J.A.; Kuhn, M.; Berche, P.; Chakraborty, T.; Domınguez-Bernal, G.; Goebel, W.; Gonzaılez-Zorn, B.; Wehland, J.; Kreft, J. Listeria pathogenesis and molecular virulence determinants. Clin. Microbiol. Rev. 2001, 14, 584–640. [Google Scholar] [CrossRef] [PubMed] [Green Version]
  16. Farver, J.M.; Ross, W.H.; Harwig, J. Health risk assessment of listeria monocytogenes in Canada. Int. J. Food Microbiol. 1996, 30, 145–156. [Google Scholar] [CrossRef]
  17. Food and Drug Administration (FDA). Listeria (Listeriosis). 2019. Available online: https://www.fda.gov/food/foodborne-pathogens/listeria-listeriosis (accessed on 28 July 2021).
  18. Ulusoy, B.H.; Chirkena, K. Two perspectives of Listeria monocytogenes hazards in dairy products: The prevalence and the antibiotic resistance. Food Qual. Saf. 2019, 3, 233–241. [Google Scholar] [CrossRef] [Green Version]
  19. Lammerding, A.M. An overview of microbial food safety risk assessment. J. Food Prot. 1997, 60, 1420–1425. [Google Scholar] [CrossRef]
  20. World Health Organization (WHO). Microbiological Risk Assessment: Guidance for Food. 2021. Available online: https://www.who.int/publications/i/item/9789240024892 (accessed on 15 August 2021).
  21. Codex. Principles and Guidelines for the Conduct of Microbiological Risk Assessment. 1999. Available online: http://www.fao.org/fao-who-codexalimentarius/sh-proxy/en/?lnk=1&url=https%253A%252F%252Fworkspace.fao.org%252Fsites%252Fcodex%252FStandards%252FCXG%2B30-1999%252FCXG_030e_2014.pdf (accessed on 14 July 2021).
  22. FAO/WHO. Food Safety Risk Analysis: A Guide for National Food Safety Authorities. 2006. Available online: http://apps.who.int/iris/bitstream/handle/10665/43718/9789251056042_eng.pdf;jsessionid=689C4D54F8646357776C37326910DD2A?sequence=1 (accessed on 14 August 2021).
  23. Makita, K.; Desissa, F.; Teklu, A.; Zewde, G.; Grace, D. Risk assessment of staphylococcal poisoning due to consumption of informally-marketed milk and home-made yoghurt in Debre Zeit, Ethiopia. Int. J. Food Microbiol. 2012, 153, 135–141. [Google Scholar] [CrossRef]
  24. Ministry of Food and Drug Safety (MFDS). Study on the Evaluation and Reduction of Risk of Listeria monocytogenes, Pathogenic Escherichia coli and Campylobacter spp. in Dairy Products; Ministry of Food and Drug Safety (MFDS): Cheongju-si, Korea, 2021.
  25. Ministry of Food and Drug Safety (MFDS). Food Code. Dairy Products. 2020. Available online: https://www.foodsafetykorea.go.kr/foodcode/01_03.jsp?idx=39 (accessed on 28 June 2021).
  26. Vose, D.J. The application of quantitative risk assessment to microbial food safety. J. Food Prot. 1998, 61, 640–648. [Google Scholar] [CrossRef]
  27. Sanaa, M.; Coroller, L.; Cerf, O. Risk assessment of listeriosis linked to the consumption of two soft cheeses made from raw milk: Camembert of Normandy and Brie of Meaux. Risk Anal. 2004, 24, 389–399. [Google Scholar] [CrossRef]
  28. Ministry of Food and Drug Safety (MFDS). Risk Assessment and reduction of Listeria monocytogenes in Agriculture, Livestock and Fishery Products. 2019. Available online: https://scienceon.kisti.re.kr/srch/selectPORSrchReport.do?cn=TRKO202000029896 (accessed on 4 August 2021).
  29. Mafart, P.; Couvert, O.; Gaillard, S.; Leguérinel, I. On calculating sterility in thermal preservation methods: Application of the Weibull frequency distribution model. Int. J. Food Microbiol. 2002, 72, 107–113. [Google Scholar] [CrossRef] [Green Version]
  30. Geeraerd, A.H.; Valdramidis, V.P.; Van Impe, J.F. GInaFiT, a freeware tool to assess non-log-linear microbial survivor curves. Int. J. Food Microbiol. 2005, 102, 95–105. [Google Scholar] [CrossRef]
  31. Mataragas, M.; Drosinos, E.H.; Vaidanis, A.; Metaxopoulos, I. Development of a predictive model for spoilage of cooked cured meat products and its validation under constant and dynamic temperature storage conditions. J. Food Sci. 2006, 71, M157–M167. [Google Scholar] [CrossRef]
  32. Jung, H. Consumer Survey and Hazard Analysis for the Improvement of Food Hygiene and Safety in Purchase. Master’s Thesis, Korea University, Seoul, Korea, 2011. [Google Scholar]
  33. Ministry of Food and Drug Safety (MFDS). Food Hygiene in the Home for Consumer Awareness Survey. 2009. Available online: https://scienceon.kisti.re.kr/commons/util/originalView.do?cn=TRKO201000014868&dbt=TRKO&rn= (accessed on 30 August 2021).
  34. Bahk, G.J. Statistical probability analysis of storage temperatures of domestic refrigerator as a risk factor of foodborne illness outbreak. Korean J. Food Sci. Technol. 2010, 42, 373–376. [Google Scholar]
  35. Park, J.H.; Cho, J.L.; Joo, I.S.; Heo, J.J.; Yoon, K.S. Estimation of Amount and Frequency of Consumption of 50 Domestic Livestock and Processed Livestock Products. J. Korean Soc. Food Sci Nutr. 2016, 45, 1177–1191. [Google Scholar] [CrossRef]
  36. Food and Agriculture Organization of the United Nations and the World Health Organization (FAO/WHO). Risk Assessment of Listeria Monocytogenes in Ready-to-Eat Foods: Technical Report. Microbiological Risk Assessment Series 5. 2004. Available online: https://apps.who.int/iris/handle/10665/42875 (accessed on 11 August 2021).
  37. Park, M.S.; Cho, J.L.; Lee, S.H.; Bahk, G.J. A study on dose-response models for foodborne disease pathogens. J. Food Hyg. Saf. 2014, 29, 299–304. [Google Scholar] [CrossRef] [Green Version]
  38. Cheigh, H.S.; Park, K.Y. Biochemical, microbiological and nutritional aspects of kimchi (Korean fermented vegetable products). Crit. Rev. Food Sci. Nutr. 1994, 34, 175–203. [Google Scholar] [CrossRef] [PubMed]
  39. Zhao, S.; Han, J.; Bie, X.; Lu, Z.; Zhang, C.; Lv, F. Purification and characterization of plantaricin JLA-9: A novel bacteriocin against Bacillus spp. produced by Lactobacillus plantarum JLA-9 from Suan-Tsai, a traditional Chinese fermented cabbage. J. Agric. Food Chem. 2016, 64, 2754–2764. [Google Scholar] [CrossRef] [PubMed]
  40. Panebianco, F.; Giarratana, F.; Caridi, A.; Sidari, R.; De Bruno, A.; Giuffrida, A. Lactic acid bacteria isolated from traditional Italian dairy products: Activity against Listeria monocytogenes and modelling of microbial competition in soft cheese. LWT 2021, 137, 110446. [Google Scholar] [CrossRef]
  41. Adamberg, K.; Kask, S.; Laht, T.M.; Paalme, T. The effect of temperature and pH on the growth of lactic acid bacteria: A pH-auxostat study. Int. J. Food Microbiol. 2003, 85, 171–183. [Google Scholar] [CrossRef]
  42. Choi, S.J.; Yang, S.Y.; Yoon, K.S. Lactic acid bacteria starter in combination with sodium chloride controls pathogenic Escherichia coli (EPEC, ETEC, and EHEC) in kimchi. Food Microbiol. 2021, 100, 103868. [Google Scholar] [CrossRef]
  43. Bachrouri, M.; Quinto, E.J.; Mora, M.T. Survival of Escherichia coli O157: H7 during storage of yogurt at different temperatures. J. Food Sci. 2002, 67, 1899–1903. [Google Scholar] [CrossRef]
  44. Szczawinski, J.; Szczawinska, M.E.; Lobacz, A.; Jackowska-Tracz, A. Modeling the effect of temperature on survival rate of Listeria monocytogenes in yogurt. Pol. J. Vet. Sci. 2016, 19. [Google Scholar] [CrossRef]
  45. Millet, L.; Saubusse, M.; Didienne, R.; Tessier, L.; Montel, M.C. Control of Listeria monocytogenes in raw-milk cheeses. Int. J. Food Microbiol. 2006, 108, 105–114. [Google Scholar] [CrossRef] [PubMed]
  46. Guraya, R.; Frank, J.F.; Hassan, A.N. Effectiveness of salt, pH, and diacetyl as inhibitors for Escherichia coli O157: H7 in dairy foods stored at refrigeration temperatures. J. Food Prot. 1998, 61, 1098–1102. [Google Scholar] [CrossRef] [PubMed]
  47. Faradonbeh, R.S.; Armaghani, D.J.; Monjezi, M. Development of a new model for predicting flyrock distance in quarry blasting: A genetic programming technique. Bull. Eng. Geol. Environ. 2016, 75, 993–1006. [Google Scholar] [CrossRef]
  48. Coşansu, S. Survival kinetics of heat-stressed Escherichia coli O157: H7 and Listeria monocytogenes cells as post-fermentation contaminants in kefir during refrigerated storage. LWT 2018, 98, 635–641. [Google Scholar] [CrossRef]
  49. Hu, C.H.; Ren, L.Q.; Zhou, Y.; Ye, B.C. Characterization of antimicrobial activity of three Lactobacillus plantarum strains isolated from Chinese traditional dairy food. Food Sci. Nutr. 2019, 7, 1997–2005. [Google Scholar] [CrossRef] [Green Version]
  50. Ogawa, M.; Shimizu, K.; Nomoto, K.; Tanaka, R.; Hamabata, T.; Yamasaki, S.; Takeda, T.; Takeda, Y. Inhibition of in vitro growth of Shiga toxin-producing Escherichia coli O157: H7 by probiotic Lactobacillus strains due to production of lactic acid. Int. J. Food Microbiol. 2001, 68, 135–140. [Google Scholar] [CrossRef]
  51. Yang, E.; Fan, L.; Jiang, Y.; Doucette, C.; Fillmore, S. Antimicrobial activity of bacteriocin-producing lactic acid bacteria isolated from cheeses and yogurts. AMP Express. 2012, 2, 48. Available online: https://amb-express.springeropen.com/articles/10.1186/2191-0855-2-48 (accessed on 28 July 2021). [CrossRef] [Green Version]
  52. Gulmez, M.; Guven, A. Survival of Escherichia coli O157: H7, Listeria monocytogenes 4b and Yersinia enterocolitica O3 in different yogurt and kefir combinations as prefermentation contaminant. J. Appl. Microbiol. 2003, 95, 631–636. [Google Scholar] [CrossRef] [Green Version]
  53. Afrin, S.; Hoque, M.A.; Sarker, A.K.; Satter, M.A.; Bhuiyan, M.N.I. Characterization and profiling of bacteriocin-like substances produced by lactic acid bacteria from cheese samples. Access Microbiol. 2021, 3, 000234. [Google Scholar] [CrossRef]
  54. Vose, D.J. Understanding and Using the Results of a Risk Analysis. Risk Analysis: A Quantitative Guide; John Wiley Sons: Hoboken, NJ, USA, 2008. [Google Scholar]
  55. Akkaya, L.; Telli, R.; Sagdic, O. Growth-death kinetics of Listeria monocytogenes in strained yogurt. Int. J. Food Prop. 2009, 12, 705–712. [Google Scholar] [CrossRef]
  56. Kasımoğlu, A.; Akgün, S. Survival of Escherichia coli O157: H7 in the processing and post-processing stages of acidophilus yogurt. Int. J. Food Sci. Technol. 2004, 39, 563–568. [Google Scholar] [CrossRef]
Figure 1. The probability distribution of initial contamination level of Listeria monocytogenes and EHEC in drinking (A) and regular yogurt (B).
Foods 11 00971 g001aFoods 11 00971 g001b
Figure 2. Primary survival models of Listeria monocytogenes (LM) and EHEC in yogurt as a function of temperature. LM in drinking yogurt: □, LM in regular yogurt: △, EHEC in drinking yogurt: ■, EHEC in regular yogurt: ▲.
Foods 11 00971 g002
Figure 3. Secondary models for delta values of Listeria monocytogenes (□); and EHEC (■) in drinking (A) and regular yogurt (B).
Foods 11 00971 g003
Figure 4. Probabilistic distribution for daily consumption amount of yogurt with @Risk.
Foods 11 00971 g004
Figure 5. The correlation coefficient for sensitivity analysis affecting illness by Listeria monocytogenes (A) and EHEC (B) with consumption of yogurt with @Risk.
Foods 11 00971 g005aFoods 11 00971 g005b
Table 1. Survival kinetic parameters of Listeria monocytogenes (LM) and EHEC in yogurt 1.
Temperature (°C)PathogensDrinkingRegular
Delta (day) 2p3Delta (day)p
4LM 420.31 ± 0.20 *0.739.04 ± 0.13 *1.07 ± 0.07
EHEC 567.61 ± 1.92 *1.25 ± 0.0114.93 ± 1.20 *1.12 ± 0.06
10LM7.16 *3.1 ± 0.084.76 ± 0.08 *6.88 ± 0.44
EHEC38.31 ± 0.37 *1.45 ± 0.0110.41 ± 0.71 *1.45 ± 0.12
17LM2.15 ± 0.01 *2.27 ± 0.031.89 ± 0.06 *3.32 ± 0.08
EHEC13.42 *1.35 ± 0.088.21 ± 0.11 *4.17 ± 0.16
25LM1.81 ± 0.03 *4.43 ± 0.210.66 *1.98 ± 0.02
EHEC5.51 ± 0.12 *4.09 ± 0.212.23 ± 0.01 *2.84 ± 0.03
36LM0.62 *2.83 ± 0.030.14 *1.17 ± 0.06
EHEC1.42 *3.90 ± 0.050.42 ± 0.04 *2.57 ± 0.33
1 Values are expressed as mean ± SD (n = 3). 2 Delta: Time for 1 log reduction. 3 p: Shape of graph. 4 LM: Listeria monocytogenes. 5 EHEC: Enterohemorrhagic Escherichia coli. * Significant difference of delta values was observed between LM and EHEC at the same temperature by t-test at p < 0.05.
Table 2. Simulation model and formulas in the Excel spreadsheet used to calculate the risk of Listeria monocytogenes (LM) in drinking and regular yogurt with @RISK.
SymbolUnitDefinitionFormulaReference
Product
PR Prevalence of LM in drinking yogurt=RiskBeta(1, 196)MFDS [24]
Prevalence of LM in regular yogurt=RiskBeta(1, 91)
CLCFU/gContamination level of LM=−LN(1 − PR)/25Sanna et al. [27]
IClog CFU/gInitial contamination level=Log(CL)
Market
MTimehStorage time in market of drinking yogurt=RiskPert(0, 240, 312)MFDS [24]
Storage time in market of regular yogurt=RiskPert(0, 240, 480)
MTemp°CStorage temperature in market=RiskPert(2.1, 7, 9.7)
Death
DeltahDrinking yogurt=823.8 + (−100.8) × MTemp + 4.177 × MTemp2 + (−0.0556) × MTemp3This research
Regular yogurt=315.1 + (−27.57) × MTemp + 0.8396 × MTemp2 + (−0.0087) × MTemp3
p Drinking yogurt=2.67 (Fixed)
Regular yogurt=2.882 (Fixed)
LM survival modellog CFU/gC1=IC − (MTime/delta)p
Transportation to home
TTimehStorage time during transportation=RiskPert(0.325, 0.984, 1.643)Jung [32]
TTemp°CStorage temperature during transportation=RiskPert(10, 18, 25)
Death
DeltahDrinking yogurt=823.8 + (−100.8) × TTemp + 4.177 × TTemp2 + (−0.0556) × TTemp3This research
Regular yogurt=315.1 + (−27.57) × TTemp + 0.8396 × TTemp2 + (−0.0087) × TTemp3
p Drinking yogurt=2.67 (Fixed)
Regular yogurt=2.882 (Fixed)
LM survival modellog CFU/gC2=C1-(TTime/delta)p
Home
HTimehStorage time until consumption=RiskPert(0, 60, 720)MFDS [33]
HTemp°CStorage temperature until consumption=RiskLogLogistic(−10.407, 13.616, 8.611)Bahk [34]
Death
DeltahDrinking yogurt=823.8 + (−100.8) × HTemp + 4.177 × HTemp2 + (−0.0556) × HTemp3This research
Regular yogurt=315.1 + (−27.57) × HTemp + 0.8396 × HTemp2 + (−0.0087) × HTemp3
p Drinking yogurt=2.67 (Fixed)
Regular yogurt=2.882 (Fixed)
LM survival modellog CFU/gC3=C2 − (HTime/delta)p
Consumption
Consume (Daily consumption average amount)Drinking yogurt=RiskLaplace(150, 22.833)Park et al. [35]
Regular yogurt=RiskLaplace(100, 10.027)
Intake rate(Distribution for consumption frequency)Drinking yogurt=0.184(Fixed)
Regular yogurt=0.146(Fixed)
Amount Daily consumption average amount considered frequency=Consume × Intake rate
Dose-Response model
Dose(D)LM amount=10C3 × Amount
1-EXP(-r × D)Parameter of r=1.06 × 10⁻¹² (Susceptible population)FDA/WHO [36]
=2.37 × 10⁻¹⁴ (General population)
Risk Characterization
Risk Probability of illness/person/day=1 − exp(−r × D)FDA/WHO [36]
Table 3. Simulation model and formulas in the Excel spreadsheet used to calculate the risk of EHEC in drinking and regular yogurt with @RISK.
SymbolUnitDefinitionFormulaReference
Product
PR Prevalence of EHEC in drinking yogurt=RiskBeta(1, 196)MFDS [24]
Prevalence of EHEC in regular yogurt=RiskBeta(1, 91)
CLCFU/gContamination level of EHEC=−LN(1 − PR)/25Sanna et al. [27]
IClog CFU/gInitial contamination level=Log(CL)
Market
MTimehStorage time in market of drinking yogurt=RiskPert(0, 240, 312) MFDS [24]
Storage time in market of regular yogurt=RiskPert(0, 240, 480)
MTemp°CStorage temperature in market=RiskPert(2.1, 7, 9.7)
Death
DeltahDrinking yogurt=2347 + (−201.9) × MTemp + 6.044 × MTemp2 + (−0.0616) × MTemp3This research
Regular yogurt=391.7 + (−8.478) × MTemp + (−0.4534) × MTemp2 + (−0.0109) × MTemp3
p Drinking yogurt=2.406 (Fixed)
Regular yogurt=2.429 (Fixed)
EHEC survival modellog CFU/gC1=IC − (MTime/delta)p
Transportation to home
TTimehStorage time during transportation=RiskPert(0.325, 0.984, 1.643)Jung [32]
TTemp°CStorage temperature during transportation=RiskPert(10, 18, 25)
Death
DeltahDrinking yogurt=2347 + (−201.9) × TTemp + 6.044 × TTemp2 + (−0.0616) × TTemp3This research
Regular yogurt=391.7 + (−8.478) × TTemp + (−0.4534) × TTemp2 + (−0.0109) × TTemp3
p Drinking yogurt=2.406 (Fixed)
Regular yogurt=2.429 (Fixed)
EHEC survival modellog CFU/gC2=C1 − (TTime/delta)p
Home
HTimehStorage time until consumption=RiskPert(0, 60, 720)MFDS [33]
HTemp°CStorage temperature until consumption=RiskLogLogistic(−10.407, 13.616, 8.611)Bahk [34]
Death
DeltahDrinking yogurt=2347 + (−201.9) × HTemp + 6.044 × HTemp2 + (−0.0616) × HTemp3This research
Regular yogurt=391.7 + (−8.478) × HTemp + (−0.4534) × HTemp2 + (−0.0109) × HTemp3
p Drinking yogurt=2.406 (Fixed)
Regular yogurt=2.429 (Fixed)
EHEC survival modellog CFU/gC3=C2 − (HTime/delta)p
Consumption
Consume (Daily consumption average amount)Drinking yogurt=RiskLaplace(150, 22.833)Park et al. [35]
Regular yogurt=RiskLaplace(100, 10.027)
Intake rate(Distribution for consumption frequency)Drinking yogurt=0.184(Fixed)
Regular yogurt=0.146(Fixed)
Amount Daily consumption average amount considered frequency=Consume × Intake rate
Dose-Response model
Dose(D)EHEC amount=10C3 × Amount
ModelParameter of α=0.49 Park et al. [37]
Parameter of β=1.81 × 10⁵
Risk characterization
Risk Probability of illness/person/day=1 − (1 + D/β)−α Park et al. [37]
Table 4. Probability of illness per day per person by Listeria monocytogenes (LM) and EHEC with consumption of yogurt with @Risk scenario.
Probability of Illness/Person/Day
PathogensSample Min25%Mean95%Max
LMDrinkingSusceptible population001.91 × 10−158.44 × 10−153.65 × 10⁻¹⁴
General population00000
RegularSusceptible population002.87 × 10−162.11 × 10−153.63 × 10⁻¹⁴
General population00000
EHECDrinking 04.01 × 10−91.44 × 10−84.33 × 10−81.75 × 10−7
Regular 04.39 × 10−105.09 × 10−92.12 × 10−89.45 × 10⁻⁸
Publisher’s Note: MDPI stays neutral with regard to jurisdictional claims in published maps and institutional affiliations.

