Abstract
Starmerella bacillaris is a non-Saccharomyces yeast proposed for must fermentation together with Saccharomyces cerevisiae because of its high glycerol and moderate volatile acidity production. Furthermore, it was demonstrated that the same S. bacillaris strains that possess interesting technological properties exhibited antifungal activity against Botrytis cinerea, suggesting the release of this yeast in the vineyard. To obtain a positive effect during the following winemaking process, the maintenance of suitable concentrations of S. bacillaris is essential. Therefore, to obtain information on the survival of S. bacillaris, a small-scale field trial was performed. One week before the harvest, two different concentrations of S. bacillaris (106 and 107 cells/mL) were sprayed on Pinot grigio bunches, and the strain concentration was monitored by means of qPCR during the subsequent fermentation process. In addition, the combined effect of different winemaking techniques was evaluated, i.e., the vinification of juice, juice with marc and cryomaceration treatment. Results demonstrated that, under the tested conditions, S. bacillaris released in the vineyard remained viable for one week on grape bunches and increased glycerol content during the subsequent fermentation process. Different vinification protocols influenced cell concentrations. In particular, the cryomaceration treatment, due to the use of low temperature, supported S. bacillaris growth due to its cryotolerant aptitude. The collected data open new perspectives on the control of alcoholic fermentation, involving both vineyard and cellar management.
1. Introduction
Starmerella bacillaris (formerly Candida zemplinina) is a non-Saccharomyces yeast present in the microbial community of grape surfaces and, generally, of oenological environments [1,2,3]. It has also been isolated from fruits, fruit-associated insects and soil [4]. S. bacillaris tolerates low temperatures, is able to grow at high sugar concentrations [5], shows strong fructophilic character, high glycerol content, low ethanol content and moderate volatile acidity production [6,7,8,9]. Several studies have highlighted its ability to enhance wine flavour and mouthfeel sensations [7,10,11,12]. Recently, its positive effect on wine protein stability has been proven [13,14]. In recent years, the genomes of several S. bacillaris strains have been sequenced [15,16,17,18] and this approach has contributed to the increase in knowledge on important technological properties in winemaking, including glutathione metabolism [19,20].
Due to its interesting technological properties, S. bacillaris has been proposed for wine production, and its potential use as a co-starter, in both sequential and mixed fermentations with Saccharomyces cerevisiae, has been tested [8,21,22,23,24]. When inoculated, at first S. bacillaris strains alleviated the osmotic stress of S. cerevisiae cells due to the selective fructose consumption [25]. Another benefit to the use of mixed non-Saccharomyces–S. cerevisiae inoculation is to the reduction of the total sulphur dioxide addition in wine, due to the fact that, generally, non-Saccharomyces yeasts are sensitive to SO2. In particular, it was shown that 50 mg of total SO2 was sufficient to inhibit the growth of S. bacillaris [26]. Sulphur dioxide is a chemical preservative used in winemaking that possesses antiseptic, antioxidant and antioxidasic properties [27]. However, sulphites are toxic to organisms, and for this reason consumers ask for the reduction in the use of sulphur dioxide in wines. Therefore, the use of S. bacillaris could meet consumer demands for wines with reduced SO2 content.
Moreover, it has been demonstrated that the same S. bacillaris strains that possessed interesting technological properties exhibited antifungal activity against Botrytis cinerea and Penicillium expansum [9,21]. The simultaneous presence of antifungal activities and wine technological properties suggests the potential use of S. bacillaris as a biocontrol agent, by being released in vineyards, and as a fermenting agent after harvest. Indeed, yeast cells present on the grape berry surface can act as starter to initiate the fermentation process. A preliminary work, focused on S. bacillaris’ ability to persist on the grape surface under laboratory scale conditions, demonstrated that the strain sprayed on some grape bunches remained at high concentrations for at least 6 days after the inoculum [28]. Therefore, S. bacillaris demonstrated its potential use as a biocontrol agent at harvest time, when no synthetic fungicide treatments are allowed. At the reference concentration responsible for antifungal activity, S. bacillaris produced high glycerol concentrations, influencing the final wine quality. Moreover, authors reported positive effects on fermentation even when the inoculum concentration was 10 times lower than the reference concentration [28].
These preliminary results encouraged open field trials to evaluate S. bacillaris activity in vineyards and in the grape juice during the post-harvest vinification process. Information on the survival of S. bacillaris on the surface of the grape berries is crucial to maintain a suitable concentration of S. bacillaris in the vineyard; essential to obtaining a positive effect during the winemaking process.
At the moment these data are missing, as well as those related to the effects of different winemaking practices.
In this study, a small-scale field trial was performed to evaluate S. bacillaris survival after vineyard inoculation. One week before harvest, two different concentrations of S. bacillaris, 106 and 107 cells/mL, were sprayed on Pinot grigio bunches to evaluate the effect of direct bunch inoculation on the subsequent fermentation process in terms of glycerol production. In addition, the combined effects of different winemaking techniques were also evaluated: vinification of juice, juice with marc or cryomaceration. Fermentation trials were conducted, taking advantage of the presence of S. bacillaris on the grapes, inoculating S. cerevisiae after 48 h. Grape juice and must originating from untreated grape samples were immediately inoculated with S. cerevisiae and used as controls.
2. Materials and Methods
2.1. Yeast Strains and Growth Conditions
The yeast strains tested in this work were S. bacillaris FRI751 [16], collected from dried grapes of the Raboso Piave variety as previously described [21], and the commercial wine strain S. cerevisiae EC1118 (Lallemand Inc., Montreal, Canada).
Pre-culture of the S. bacillaris strain used in this work was prepared as described by Bovo et al. [29]. The concentration of S. bacillaris in a stationary phase YPD (yeast extract–peptone–dextrose, Difco, Milan, Italy) culture was determined by flow cytometry count using a CyFlow SL flow cytometer (Partec, Münster, Germany), following the manufacturer’s instructions. The culture medium was removed by centrifugation and the cell pellet was re-suspended in a volume of NaCl (0.9% w/v) physiological solution, in order to achieve 3 × 10⁸ cells/mL.
2.2. Yeast Release in the Vineyard and Experimental Procedure
In a vineyard, 15 plants of Pinot grigio variety were selected to be used for the release of S. bacillaris at different concentrations. The plants were split in three groups: five plants were used as the untreated control (NT), five plants were treated with a physiological solution containing 1 × 10⁶ cells/mL of S. bacillaris (low cell concentration, LCC) obtained diluting the yeast pre-culture (3 × 10⁸ cells/mL concentration) and five plants were treated with a physiological solution containing 1 × 10⁷ cells/mL of S. bacillaris (high cell concentration, HCC), obtained by the same pre-culture (Figure 1).
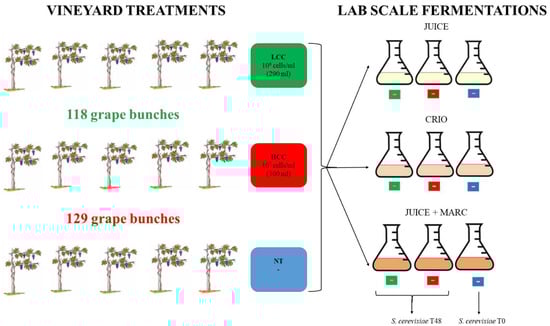
Figure 1.
Experimental procedure.
One week before harvest, the two yeast solutions were sprayed on the grape bunch only with a hand pump, making sure to cover the whole surface. At the end of the treatment, by measuring the remaining volume of each cell suspension, 300 mL was sprayed on 129 grape bunches from the five plants of the HCC trial (107 cells/mL suspension), while 290 mL was sprayed on 118 grape bunches from the five plants of the LCC trial (106 cells/mL suspension). The remaining five plants, used as controls (NT), were not sprayed.
One week after the yeast release in the vineyard, the harvest was performed. For each treatment, 400 g of bunches were collected in triplicate and washed with peptone water to perform microbiological analyses.
The remaining bunches were used for vinification. For each treatment (NT, HCC and LCC), three vinification protocols were performed: grape juice fermentation (JUICE) that mimics white wine fermentation protocols, cryomaceration O.N. of juice and skins at 5 °C followed by juice fermentation after skin removal (CRYO) and fermentation of juice with skins (JUICE + MARC) that mimics red wine fermentation protocols.
2.3. Fermentation Trials
Pre-cultures of the S. cerevisiae strain used in this work were prepared as described by Bovo et al. [29]. Fermentations were performed in 250 mL-capacity Erlenmeyer flasks sealed with a silicon cap and supplied with a bowed glass pipette containing 200 mL of grape juice.
In LCC and HCC, the inoculum of S. cerevisiae (approximately 1 × 10⁶ cells/mL) was performed forty-eight hours after grape crushing. A single strain fermentation with S. cerevisiae EC1118 was used as a control where juices were immediately inoculated with S. cerevisiae.
All the flasks were kept at 18 °C until the end of fermentation. All experiments were performed in triplicate. Alcoholic fermentation was monitored by measuring the weight loss twice a day during the whole fermentation process. Each fermentation was stopped when the weight loss was lower than 0.1 g after 24 h.
At the beginning of fermentation, after 48 h and at the end of fermentation, an aliquot of all samples was collected, centrifuged and the pellet was washed with water and frozen for molecular analyses, while the supernatant was used for the chemical analyses.
2.4. Microbiological Analysis
Total yeast quantification was performed by plate count in YM Agar medium (yeast extract–malt extract–peptone–dextrose–agar, Difco, Milan, Italy) and bacteria quantification was performed by plate count in PCA medium (plate count agar, Difco, Milan, Italy). Chloramphenicol (10 mg/mL) was added to YMA to prevent the growth of bacteria, while to prevent the growth of yeasts and moulds, nystatin (5 mg/mL) was added to PCA. Ten-fold dilutions of samples in Ringer’s solution (Oxoid, Milan, Italy) were spread onto plates. Plates were incubated at 28 °C for 3 days before plate count.
2.5. Chemical Analysis
Ammonia and amino nitrogen were measured enzymatically using commercially available enzymatic kits from Steroglass (Steroglass, San Martino in Campo, Italy) according to the manufacturer’s instructions in the Hyperlab multi-parametric analyser.
HPLC was used to determine the concentrations of glucose, fructose, acetic acid, glycerol and ethanol, as described by Lemos Junior et al. [8]. Ten microlitres of filtered sample was analysed using a Waters 1525 HPLC binary pump (Waters, Milford, MA, USA) equipped with a 300 mm × 7.8 mm stainless steel column packed with an Aminex HPX-87H HPLC column (Bio-Rad, Hercules, CA, USA). A Waters 2414 refractive index detector (Waters, Milford, MA, USA) set at 600 nm wavelength was used for the determination of glucose, fructose, glycerol and ethanol, while the determination of acetic acid and succinic acid was obtained by using a Waters 2487 dual absorbance detector (Waters, Milford, MA, USA) set to 210 nm. The analyses were performed isocratically at 0.6 mL/min and 65 °C with a cation exchange column (Aminex HPX-87H) and a Micro-Guard Cation H+ Cartridge (Bio-Rad Laboratories, Hercules, CA, USA), using 0.01 N H2SO4 as the mobile phase. Calibration curves of the individual compounds were used to calculate their concentrations, expressed as g/L or % v/v in the samples, through the determination of the peak area by the Breeze (Waters, Milford, MA, USA) programme.
2.6. Real Time PCR Quantification of Starmerella Bacillaris
Total DNA was extracted using the DNeasy PowerSoil Pro Kit (Qiagen, Hilden, Germany) according to the manufacturer’s instructions. Quality and quantity of the extracted DNA were determined with Tecan’s NanoQuant Plate (Tecan group, Männedorf, Switzerland). DNA concentration was determined by measuring the absorbance at 260 nm, while DNA quality was estimated from the A260/A280 ratios.
Real-time PCR was carried out on a CFX96 cycler real-time PCR detection system (Bio-Rad Laboratories, Inc., Hercules, CA, USA) in white-walled PCR plates (96 wells) using SsoFast EvaGreen Master Mix (Bio-Rad Laboratories, Inc., Hercules, CA, USA) as described by Nadai et al. [30], with some modifications. The combined primer annealing/elongation step was set at 62 °C for 10 s.
To detect the presence of the S. bacillaris strain FRI751, specific primers were designed (Table 1) which, based on the sequence of its genome, were amplified for a unique region of this strain. It was verified that these primers do not amplify either with other Starmerella strains or with other oenological yeasts (Figure S1).

Table 1.
Details of primers and amplicons used in this work.
A calibration curve was constructed using S. bacillaris FRI751 DNA. Cell samples that were used for DNA extraction were prepared as follows: tubes containing 106 cells of Hanseniaspora uvarum type strain CBS104 (Centraalbureau voor Schimmelcultures, Utrecht, Netherlands) were re-suspended in Pinot grigio grape juice and ten-fold dilutions of a cell culture of S. bacillaris were added in order to obtain a final concentration from 102 to 106 cells. Tubes were centrifuged, DNA was extracted as previously described and used to construct the calibration curve. In this way, the presence of contaminants, such as tannins and other polyphenols, on the efficiency of the qPCR reaction was taken into account [31]. Moreover, it was possible to verify the presence of any variations in the extraction efficiency due to the different concentrations of the cells, evaluating the linearity of the observations. The equation of the curve (R2 = 0.995) was used to estimate the amount of S. bacillaris present in the various sampling points.
2.7. Statistical Analysis
XLSTAT software vers. 2016.02, Addinsoft (Paris, France) was used to perform the statistical data analysis. Data were subjected to the analysis of variance (one-way ANOVA) followed by the Tukey’s post hoc test. The averages of three independent replicates were considered, and p-values lower than 0.05 were chosen to identify statistically significant differences among the samples.
3. Results and Discussion
3.1. Release of Starmerella Bacillaris in Vineyard and Inoculum Evaluation
A small-scale field trial was performed releasing S. bacillaris into a vineyard one week before harvest at two different concentrations: high cell concentration, HCC (107 cells/mL), and low cell concentration, LCC (106 cells/mL). The HCC was selected as it is the standard cell concentration suggested by bioactive yeast manufacturers and used by other authors in biocontrol experiments [32,33,34]. The LCC was tested to verify if a lower concentration of yeast was enough to allow S. bacillaris to persist on grapes.
The ability of the yeast to colonise the bunches is of fundamental importance to obtain a suitable Starmerella concentration that contributes to the fermentation process until the moment of harvest.
One week after the treatment, the bunches were harvested to carry out fermentation trials and to verify the influence of different S. bacillaris concentrations sprayed in the vineyard on the vinification. This length of time, from the inoculation of Starmerella to the crushing of the bunches, was chosen based on previous laboratory tests which have shown that the amount of S. bacillaris sprayed on the bunch remained constant up to one week after the treatment [28].
Different vinification protocols (JUICE, CRYO and JUICE + MARC) were set up to investigate the influence of the main oenological treatments on the grapes on the detachment of S. bacillaris cells from the surface of the berries, and therefore on the increase in glycerol concentration in wine. These treatments included the standard vinification practice used for Pinot grigio wine production: the grapes are crushed and immediately pressed for juice fermentation (JUICE).
In each vinification protocol, the untreated control (NT) was immediately inoculated with S. cerevisiae. This allowed the quantification of the microbial population naturally present on the grapes (T0) and to compare a standard fermentation procedure (S. cerevisiae inoculated immediately after crushing/maceration) with the new one that inoculates with S. cerevisiae 48 h after crushing/maceration of S. bacillaris-treated grapes.
At the harvest time, the concentrations of microbial populations (bacteria and yeasts) present on grapes surface were determined after washing the bunches to recover the microorganisms present on the surface (Figure 2).
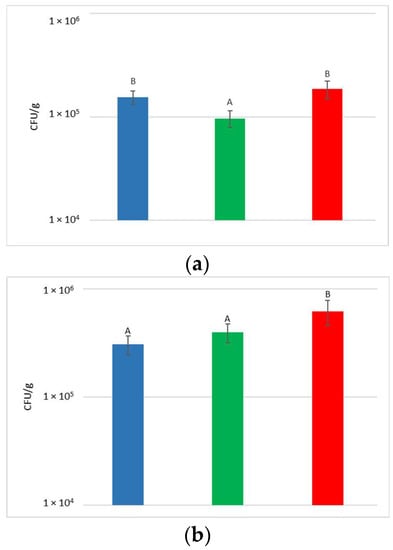
Figure 2.
Total yeast (a) and bacteria (b) concentrations present on grape surfaces one week after the release of S. bacillaris in the vineyard. NT: untreated control (blue), LCC: low cell concentration (green), HCC: high cell concentration (red). Data are expressed as the average of three replicates ± standard deviation. For each figure, different letters indicate significant differences between values (p = 0.05).
With regard to the yeast, their concentration on the bunches varied from 9.7 × 10⁴ to 1.9 × 10⁵ CFU/g, with an average of 1.5 × 10⁵ CFU/g. Despite the limited variability recorded between the treatments, a significantly higher yeast concentration was measured in NT and HCC with respect to LCC.
At the time of the vineyard treatment, each grape bunch, weighing an average of 90 g, was treated with 2.36 ± 0.08 mL of S. bacillaris solution. Taking into account that part of the solution will not adhere to the grape bunch, repeated spraying tests allowed to quantify 0.6 mL as the volume that remains on the bunch surface. Therefore, an estimate of the adherent cells per gram on the grape bunch was about 6 × 10³ in the LCC sample and 6 × 10⁴ in the HCC sample. These results are in accordance with recent work that evaluated two bioactive yeasts (Metschnikowia pulcherrima and Aureobasidium pullulans) in field experiments [32]. Agarbati and colleagues used a solution containing 107 cells/mL of yeast in a field during pre-harvest treatments and, both before and after the treatment, they found a yeast concentration of about 2–8 × 10⁴ CFU/mL on the grapes.
The concentration of total population measured in NT was notably higher than that of Starmerella released with the treatment in the vineyard, even in HCC. For this reason, no increase in the total yeast population was observed, and the different concentrations measured were due to random variations in the populations present on the single bunches.
The concentration of bacteria present on the surface of the bunches varied from 3.1 × 10⁵ to 6.2 × 10⁵ CFU/g. Statistical analysis shows that HCC had a significantly higher concentration of bacteria than LCC and NT.
3.2. Fermentation Trials
To evaluate the fermentation performance, fermentation trials were set up on a laboratory scale. One week after the Starmerella release in the vineyard, the bunches from each treatment were separately harvested, crushed and de-stemmed.
The initial composition of all musts and grape juices, measured in total sugars, ammonia and amino nitrogen, is reported in Table 2.
Table 2.
Initial composition of musts and grape juices.
The analysis of the total sugars highlighted significant differences between the samples, as sugars varied from 188.3 to 198.7 g/L. Regarding the yeast assimilable nitrogen concentrations (92.7 mg/L–127.2 mg/L), the amino nitrogen concentrations varied from 64.4 to 78 mg/L and those of ammonia nitrogen varied from 28.3 to 49.3 mg/L. The limited differences registered (generally about 5%) depended mainly on the maturity level of the collected bunches. No effect of the treatments was observed on juice must composition, as no significant differences are attributable neither to the S. bacillaris treatment nor to the vinification protocol.
In NT, the S. cerevisiae EC1118 strain was immediately inoculated, while in HCC and LCC the inoculum was performed 48 h after the start of fermentation in order to favour S. bacillaris development.
The fermentation kinetics of HCC and LCC were compared with those of NT, to determine how the simultaneous presence of the two species could influence the fermentation process.
The fermentation performance was followed by daily monitoring of the decrease in weight of the flasks, due to the loss of CO2 produced during fermentation (Figure 3).
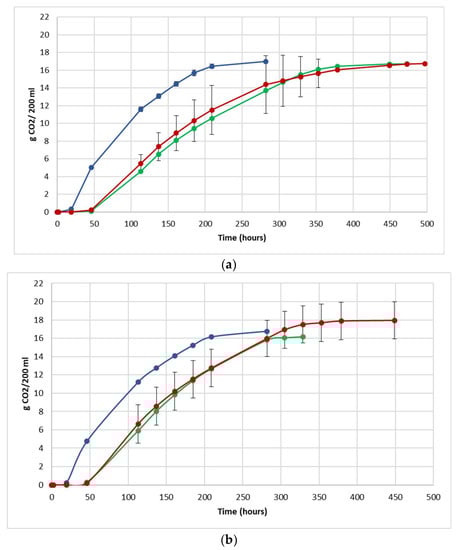
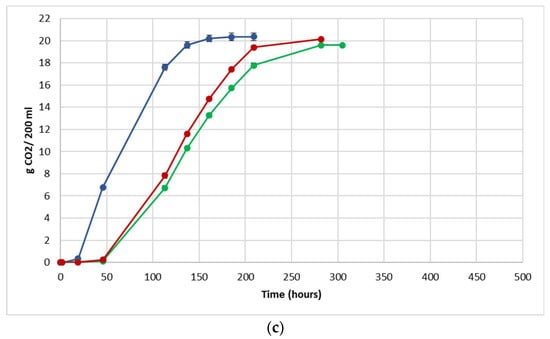
Figure 3.
Fermentation kinetics (CO2 released/time) in natural grape must. (a) JUICE, (b) CRYO and (c) JUICE + MARC. NT: untreated control (blue), LCC: low cell concentration (green), HCC: high cell concentration (red). Data are expressed as the average of three replicates ± standard deviations.
For each vinification protocol, as expected, NT showed the fastest kinetics, completing sugar consumption earlier than LCC and HCC. The fermentation kinetics of HCC and LCC were very similar, regardless of the fermentation protocol. The fermentations ended after between 12 and 19 days in JUICE and CRYO and between 9 and 13 days in JUICE + MARC, confirming that the presence of the skins speed up the fermentation process.
In HCC and LCC, before S. cerevisiae inoculation, a very low CO2 production was registered and after inoculation, the overall fermentation rates appeared to slow down due to the presence of the vineyard population. This fermentation trend is generally observed when S. bacillaris is used in sequential inoculation with S. cerevisiae in both natural and synthetic must fermentations [21,28,35]. A previous study suggested that in sequential fermentations with S. bacillaris, the reduction in growth rate of S. cerevisiae is probably due to the high nutrient consumption before the inoculation of S. cerevisiae [35,36].
After 48 h from the start of fermentation, before the addition of S. cerevisiae in LCC and HCC fermentations, total sugars and ammonia and amino nitrogen concentrations were measured. Residual sugars varied between 112 g/L and 187.3 g/L. The residual amino nitrogen varied between 0 mg/L and 67.4 mg/L, while the ammonia nitrogen residues varied between 3 mg/L and 43.7 mg/L. As expected, NT, where S. cerevisiae was inoculated at T0, consumed significantly more sugars than LCC and HCC, while almost all the available nitrogen was depleted.
Considering the level of variability in the initial sugar and nitrogen content, the percentages of consumption, instead of the residual concentrations, are reported in Table 3.
Table 3.
Percentages of consumption of sugars and YAN (yeast assimilable nitrogen) after 48 h.
As expected, regardless the vinification protocol, NT, where S. cerevisiae was inoculated at T0, consumed significantly more sugars than LCC and HCC (in particular in JUICE + MARC, the fermentation showing the fastest kinetics), while almost all the available nitrogen was depleted. In general, JUICE + MARC showed a lower nitrogen consumption compared to the other vinification protocols, this could be due to a gradual nitrogen release from the part of the pulp generally stuck to the skins that occurred during the fermentation.
Despite the different fermentation times, the transformation of sugar into ethanol was completed in all the vinifications (sugar residue <1 g/L). At the end of fermentation, glycerol, acetic acid and ethanol concentrations were measured (Table 4). The end of fermentation is the time when the last CO2 measurement was collected, shown in Figure 3.
Table 4.
Glycerol, acetic acid and ethanol concentrations at the end of fermentation.
The final ethanol concentrations varied between 11.8 and 12.7% v/v, simply reflecting the different initial sugar content. In some studies, S. bacillaris used in sequential fermentations has demonstrated the ability to reduce ethanol content by up to 1% in presence of high concentrations of yeast (107 cells/mL) and sugars (240 g/L) [37]. In the present study, the effect of the treatments on ethanol content was not appreciable. This could be due to both the limited sugar content and a lower concentration of S. bacillaris released in the vineyard.
Acetic acid production was limited, and values were quite variable (from 0.09 to 0.50 g/L). In JUICE and JUICE + MARC, NT acetic acid concentration showed no significant differences from LCC and HCC, respectively. However, the concentrations are acceptable and lower than the acetic acid detectable level, 0.7–0.9 g/L [38].
Glycerol concentrations varied between 5.8 and 9.1 g/L. The glycerol content in HCC was always significantly higher than NT. Considering LCC in JUICE and JUICE + MARC, no significant differences were found with respect to NT, while CRYO resulted in a significantly higher production of glycerol compared to NT. This finding evidenced that wines obtained from bunches treated with S. bacillaris in high concentration resulted in higher glycerol content than the untreated control, regardless of the vinification protocol. High glycerol content always occurs when S. bacillaris is inoculated in cellar during sequential fermentations with S. cerevisiae in both natural and synthetic must [14,21,22,24,28,37].
Glycerol concentration is proportional to the sugar content, as it is produced as a response to hyperosmolarity [39]. Due to the variability in the initial sugar content, the ratio between the glycerol produced and the sugars consumed (glycerol/sugar ratio) was calculated and compared for each vinification protocol (JUICE, CRYO and JUICE + MARC) and the results are reported in Table 5.
Table 5.
Glycerol produced to sugar consumed ratio at the end of fermentations in JUICE, CRYO and JUICE + MARC.
Taking into account the initial sugar content, NT always produced a low ratio, regardless of the vinification protocol. Considering the inoculum size of S. bacillaris in the vineyard, JUICE HCC showed a significantly higher ratio than LCC and NT. In CRYO and JUICE + MARC, LCC and HCC showed a similar ratio, significantly higher than NT. Due to different initial sugar levels, in JUICE + MARC LCC, the ratio showed significantly higher glycerol production than NT, despite the fact that the glycerol content in the wine was not significantly different from NT. Generally, a significantly higher quantity of glycerol than NT was found even in the trials where S. bacillaris was released at low concentration. This finding is in accordance with previous work, where a positive effect on glycerol production was achieved during sequential fermentation at inoculum concentrations of 104 cells/mL; 100 times less than the conventional S. bacillaris inoculum [28].
3.3. Quantification of Total Yeasts and Starmerella Bacillaris
For each treatment (NT, HCC and LCC), the concentration of total yeast in the must or juice (T0) after 48 h (T48) and at the end of fermentation (EF) was determined by plate count (Figure 4).
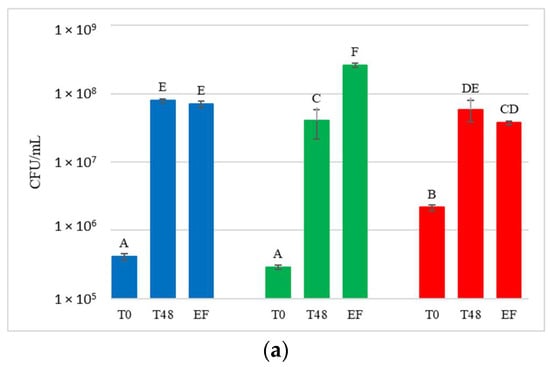
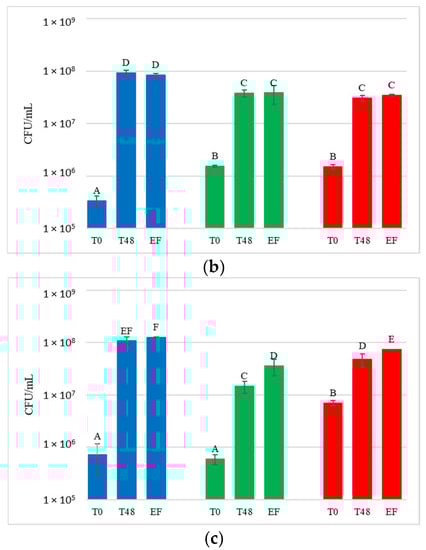
Figure 4.
Total yeast concentrations measured during the fermentation in natural grape must. (a) JUICE, (b) CRYO and (c) JUICE+MARC. NT: untreated control (blue), LCC: low cell concentration (green), HCC: high cell concentration (red). Data are expressed as the average of three replicates ± standard deviations. For each figure, different letters indicate significant differences between values (p = 0.05).
Yeast present in the initial musts and juices (T0) showed very variable concentrations, ranging from 2.9 × 10⁵ to 7 × 10⁶ CFU/mL. Comparing these results with the concentration of yeast present on the grape surface at harvest (9.7 × 10⁴ to 1.9 × 10⁵ CFU/g of bunch), a general increase in the total population immediately after crushing was observed. At T0, NT showed an average concentration of 4.9 × 10⁵ CFU/mL and HCC always had a significantly higher yeast concentration than NT (on average 3.6 × 10⁶ CFU/mL). LCC, on the other hand, showed a significantly higher yeast concentration than NT only in CRYO.
After 48 h, before the inoculation of S. cerevisiae in HCC and LCC, the total number of yeast present in the musts varied between 1.5 × 10⁷ CFU/mL and 1.1 × 10⁸ CFU/mL, indicating that, compared to T0, a significant increase in total yeast population was always observed.
At the end of fermentation, yeast concentration varied between 3.4 × 10⁷ CFU/mL and 2.6 × 10⁸ CFU/mL, and was not significantly different from that at 48 h.
The dynamics of the S. bacillaris population released on the grapes in the vineyard was investigated by real-time PCR during fermentation. A calibration curve, constructed with the specific primers designed for S. bacillaris FRI751, allowed the absolute quantification of S. bacillaris in each sample. This quantification is fundamental to verify whether S. bacillaris cell concentration supported the glycerol/sugar ratio values found in the different trials. Figure 5 shows the trends over time in the S. bacillaris concentrations during fermentation.
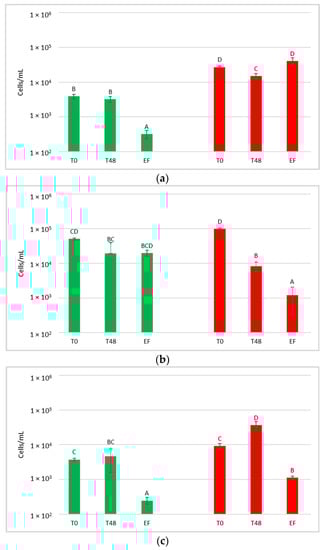
Figure 5.
Starmerella bacillaris concentrations measured during fermentation of natural grape must. (a) JUICE, (b) CRYO and (c) JUICE + MARC. LCC: low cell concentration (green), HCC: high cell concentration (red). Data are expressed as the average of three replicates ± standard deviations. For each figure, different letters indicate significant differences between values (p = 0.05).
DNA from NT samples were amplified using S. bacillaris primers as well, and results showed the presence of S. bacillaris in concentrations from 101 to 102 cells/mL. This finding could be due to the limited contamination of vine plants used as control during the cell spraying treatment. The fermentation of the treated grape bunches evidenced, as expected, the presence of S. bacillaris at higher levels in HCC than in LCC, except for CRYO, where the concentrations were comparable. To verify the effect of cryomaceration on yeast population, plate counts were carried out both before (PRE-CRYO) and after (CRYO) cryomaceration (Figure 6).
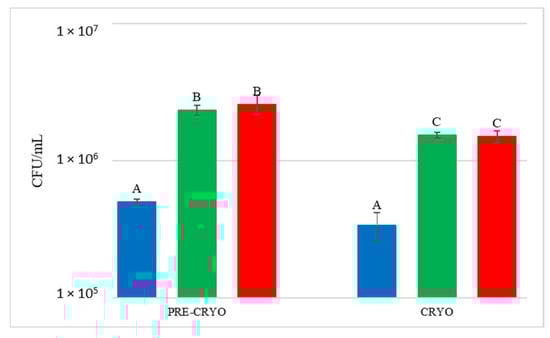
Figure 6.
Total yeast count before (PRE-CRYO) and after (CRYO) cryomaceration. NT: untreated control (blue), LCC: low cell concentration (green), HCC: high cell concentration (red). Data are expressed as the average of three replicates ± standard deviations. Different letters indicate significant differences between values (p = 0.05).
After the treatment, the total yeast concentration did not increase but remained unchanged or decreased, suggesting that generally this practice does not favour either the release of yeast from the skins or yeast growth. In the other treatments, S. bacillaris quantification at T0 showed values similar to the estimated inoculum size.
The quantification of the S. bacillaris population was investigated by qPCR (Figure 7).
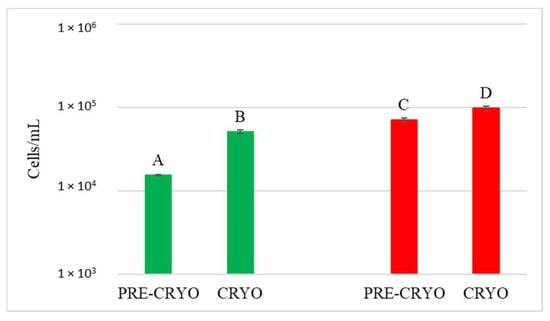
Figure 7.
Starmerella bacillaris concentrations measured before (PRE-CRYO) and after (CRYO) cryomaceration. LCC: low cell concentration (green), HCC: high cell concentration (red). Data are expressed as the average of three replicates ± standard deviations. Different letters indicate significant differences between values (p = 0.05).
Surprisingly, in both LCC and HCC samples, S. bacillaris concentration significantly increased after cryomaceration, suggesting that cryomaceration favoured S. bacillaris growth due to its cryotolerant aptitude.
In JUICE HCC, S. bacillaris concentration remained constant at about 104 cells/mL. JUICE LCC showed a lower initial concentration (3.9 × 10³ cells/mL) compared to HCC and a significant decrease at the end of fermentation (from 3.2 × 10³ cells/mL at 48 h to 3.2 × 10² cells/mL at end of fermentation).
In CRYO LCC the cell concentration did not vary significantly over time, recording an average value of 3 × 10⁴ cells/mL, while CRYO HCC showed high initial cell concentration (9.7 × 10⁴ cells/mL) which decreased over time, reaching 1.2 × 10³ cells/mL at the end of fermentation, indicating no S. bacillaris growth.
Finally, in JUICE + MARC LCC, an increase in cell concentration was registered in the first 48 h (from 9.2 × 10³ to 3.6 × 10⁴ cells/mL) followed by a sharp decrease at the end of fermentation (1.1 × 10³ cells/mL), while in JUICE + MARC HCC, where the initial concentration was 3.8 × 10³ cells/mL, there was no increase in the first 48 h and a sharp decline at the end of fermentation (from 4.6 × 10³ cells/mL at 48 h to 2.5 × 10² cells/mL at the end of fermentation).
Only JUICE LCC showed no significant difference with NT in terms of the glycerol/sugar ratio, although the S. bacillaris cell concentration trend was very similar to JUICE + MARC LCC. This result could be due to the influence of the yeast natural population on the S. bacillaris strain in terms of glycerol metabolism and production.
4. Conclusions
Results reported in this work demonstrated that S. bacillaris released in the vineyard remained viable for one week on grape bunches and increased glycerol content during the subsequent fermentation process.
This small-scale field trial allowed an accurate quantification of the cell fraction of the inoculum that effectively adhered to the grape surface. This information is crucial for the scale-up of future field trials. The strain specific qPCR quantification method demonstrated the presence of S. bacillaris during the fermentation process. The differences in terms of cell concentrations were in accordance with the inoculum size, although generally, no S. bacillaris growth was reported. Therefore, the concentration of S. bacillaris sprayed in the vineyard was crucial in achieving a positive effect on the wine glycerol content. A cellular concentration (LCC, 106 cells/mL) lower than the conventional (HCC, 107 cells/mL) was demonstrated to be effective depending on the vinification protocols. In fact, only the cryomaceration treatment, due to the use of low temperature, supported S. bacillaris growth. Despite the glycerol increase, no ethanol reduction was observed, due to the low sugar content in the grapes and the limited concentration of S. bacillaris released in the vineyard. Acetic acid production was limited, and always lower than the acetic acid detectable level.
The collected data provide information for modulating S. bacillaris concentrations at the start of fermentation and thus the glycerol content in wines. This goal can be achieved in vineyards by choosing a suitable inoculum size and/or repeating the treatment during grape ripening and in the pre-harvest interval. In the cellar, the yeast concentration can be increased using an appropriate vinification protocol.
Supplementary Materials
The following supporting information can be downloaded at: https://www.mdpi.com/article/10.3390/foods12010003/s1, Figure S1: Results of strain-specific primer PCR.
Author Contributions
Conceptualization, V.C.; formal analysis, C.N., V.d.S.D.; investigation, C.N., V.d.S.D., M.C., S.V., J.S.; resources, V.C., A.G.; writing—original draft preparation, C.N., V.C.; writing—review and editing, V.C., C.N., A.G.; supervision, V.C.; funding acquisition, V.C., A.G. All authors have read and agreed to the published version of the manuscript.
Funding
This research was funded by PSR 2014-2020 DGR 736/2018 OZOPLUSWINE project ID 4114168—CUP C24I19001060005 (Regione Veneto), DOR2070848/20 (Università di Padova), DOR1804247/18 (Università di Padova) and DOR1725213/17 (Università di Padova).
Data Availability Statement
Data is contained within the article or supplementary material.
Conflicts of Interest
The authors declare no conflict of interest.
References
- Drumonde-Neves, J.; Franco-Duarte, R.; Lima, T.; Schuller, D.; Pais, C. Association between grape yeast communities and the vineyard ecosystems. PLoS ONE 2017, 12, e0169883. [Google Scholar] [CrossRef] [PubMed]
- Varela, C.; Borneman, A.R. Yeasts found in vineyards and wineries. Yeast 2017, 34, 111–128. [Google Scholar] [CrossRef] [PubMed]
- Bovo, B.; Giacomini, A.; Corich, V. Effects of grape marcs acidification treatment on the evolution of indigenous yeast populations during the production of grappa. J. Appl. Microbiol. 2011, 111, 382–388. [Google Scholar] [CrossRef] [PubMed]
- Csoma, H.; Sipiczki, M. Taxonomic reclassification of Candida stellata strains reveals frequent occurrence of Candida zemplinina in wine fermentation. FEMS Yeast Res. 2008, 8, 328–336. [Google Scholar] [CrossRef]
- Sipiczki, M. Candida zemplinina sp. nov., an osmotolerant and psychrotolerant yeast that ferments sweet botrytized wines. Int. J.Syst. Evol. Microbiol. 2003, 53, 2079–2083. [Google Scholar] [CrossRef]
- Benito, Á.; Calderón, F.; Benito, S. The influence of non-Saccharomyces species on wine fermentation quality parameters. Fermentation 2019, 5, 54. [Google Scholar] [CrossRef]
- Englezos, V.; Giacosa, S.; Rantsiou, K.; Rolle, L.; Cocolin, L. Starmerella bacillaris in winemaking: Opportunities and risks. Curr. Opin. Food Sci. 2017, 17, 30–35. [Google Scholar] [CrossRef]
- Lemos, W.J.F., Jr.; Nadai, C.; Crepalde, L.T.; de Oliveira, V.S.; de Matos, A.D.; Giacomini, A.; Corich, V. Potential use of Starmerella bacillaris as fermentation starter for the production of low-alcohol beverages obtained from unripe grapes. Int. J. Food Microbiol. 2019, 303, 1–8. [Google Scholar] [CrossRef]
- Nadai, C.; Lemos, W.J., Jr.; Favaron, F.; Giacomini, A.; Corich, V. Biocontrol activity of Starmerella bacillaris yeast against blue mold disease on apple fruit and its effect on cider fermentation. PLoS ONE 2018, 13, e0204350. [Google Scholar] [CrossRef]
- Magyar, I.; Tóth, T. Comparative evaluation of some oenological properties in wine strains of Candida stellata, Candida zemplinina, Saccharomyces uvarum and Saccharomyces cerevisiae. Food Microbiol. 2011, 28, 94–100. [Google Scholar] [CrossRef]
- Raymond Eder, M.L.; Rosa, A.L. Genetic, physiological, and industrial aspects of the fructophilic non-Saccharomyces yeast species, Starmerella bacillaris. Fermentation 2021, 7, 87. [Google Scholar] [CrossRef]
- Tufariello, M.; Fragasso, M.; Pico, J.; Panighel, A.; Castellarin, S.D.; Flamini, R.; Grieco, F. Influence of non-Saccharomyces on wine chemistry: A focus on aroma-related compounds. Molecules 2021, 26, 644. [Google Scholar] [CrossRef]
- Lemos, W.J.F., Jr.; Nadai, C.; Rolle, L.; Da Silva Gulao, E.; Miguez da Rocha Leãoe, M.H.; Giacomini, A.; Corich, V.; Vincenzi, S. Influence of the mannoproteins of different strains of Starmerella bacillaris used in single and sequential fermentations on foamability, tartaric and protein stabilities of wines. OENO ONE 2020, 54, 231–243. [Google Scholar] [CrossRef]
- Moreira, L.D.P.D.; Nadai, C.; da Silva Duarte, V.; Brearley-Smith, E.J.; Marangon, M.; Vincenzi, S.; Giacomini, A.; Corich, V. Starmerella bacillaris strains used in sequential alcoholic fermentation with Saccharomyces cerevisiae improves protein stability in white wines. Fermentation 2022, 8, 252. [Google Scholar] [CrossRef]
- Rosa, A.L.; Miot-Sertier, C.; Salin, F.; Sipiczki, M.; Bely, M. Draft genome sequence of the Starmerella bacillaris (syn., Candida zemplinina) type strain CBS 9494. Microbiol. Resour. Announc. 2018, 7, 3. [Google Scholar] [CrossRef]
- Lemos, W.J.F., Jr.; Treu, L.; Duarte, V.D.S.; Campanaro, S.; Nadai, C.; Giacomini, A.; Corich, V. Draft genome sequence of the yeast Starmerella bacillaris (syn. Candida zemplinina) FRI751 isolated from fermenting must of dried Raboso grapes. Genome Announc. 2017, 5, e00224–e00317. [Google Scholar] [CrossRef]
- Lemos, W.J.F., Jr.; Treu, L.; da Silva Duarte, V.; Carlot, M.; Nadai, C.; Campanaro, S.; Giacomini, A.; Corich, V. Whole-genome sequence of Starmerella bacillaris PAS13, a non-conventional enological yeast with antifungal activity. Genome Announc. 2017, 5, e00788–e00817. [Google Scholar] [CrossRef]
- Ko, H.-J.; Park, H.J.; Lee, S.H.; Jeong, H.; Bae, J.-H.; Sung, B.H.; Choi, I.-G.; Sohn, J.-H. Draft genome sequence of an acid-tolerant yeast, Candida zemplinina NP2, a potential producer of organic acids. Genome Announc. 2017, 5, e01052-17. [Google Scholar] [CrossRef]
- Lemos, W., Jr.; da Silva Duarte, V.; Treu, L.; Campanaro, S.; Nadai, C.; Giacomini, A.; Corich, V. Whole genome comparison of two Starmerella bacillaris strains with other wine yeasts uncovers genes involved in modulating important winemaking traits. FEMS Yeast Res. 2018, 18, foy069. [Google Scholar] [CrossRef]
- Lemos, W.J.F., Jr.; de Oliveira, V.S.; Guerra, A.F.; Giacomini, A.; Corich, V. From the vineyard to the cellar: New insights of Starmerella bacillaris (synonym Candida zemplinina) technological properties and genomic perspective. Appl. Microbiol. Biotechnol. 2021, 105, 493–501. [Google Scholar] [CrossRef]
- Lemos, W.J., Jr.; Bovo, B.; Nadai, C.; Crosato, G.; Carlot, M.; Favaron, F.; Giacomini, A.; Corich, V. Biocontrol ability and action mechanism of Starmerella bacillaris (synonym Candida zemplinina) isolated from wine musts against gray mold disease agent Botrytis cinerea on grape and their effects on alcoholic fermentation. Front. Microbiol. 2016, 7, 1249. [Google Scholar] [CrossRef] [PubMed]
- Rantsiou, K.; Dolci, P.; Giacosa, S.; Torchio, F.; Tofalo, R.; Torriani, S.; Suzzi, G.; Rolle, L.; Cocolin, L. Candida zemplinina can reduce acetic acid produced by Saccharomyces cerevisiae in sweet wine fermentations. Appl. Environ. Microbiol. 2012, 78, 1987–1994. [Google Scholar] [CrossRef] [PubMed]
- Tofalo, R.; Patrignani, F.; Lanciotti, R.; Perpetuini, G.; Schirone, M.; Di Gianvito, P.; Pizzoni, D.; Arfelli, G.; Suzzi, G. Aroma profile of Montepulciano d’ Abruzzo wine fermented by single and co-culture starters of autochthonous Saccharomyces and non-Saccharomyces yeasts. Front. Microbiol. 2016, 7, 610. [Google Scholar] [CrossRef] [PubMed]
- Wang, C.; Esteve-Zarzoso, B.; Mas, A. Monitoring of Saccharomyces cerevisiae, Hanseniaspora uvarum, and Starmerella bacillaris (synonym Candida zemplinina) populations during alcoholic fermentation by fluorescence in situ hybridization. Int. J. Food Microbiol. 2014, 191, 1–9. [Google Scholar] [CrossRef] [PubMed]
- Russo, P.; Tufariello, M.; Renna, R.; Tristezza, M.; Taurino, M.; Palombi, L.; Capozzi, V.; Rizzello, C.G.; Grieco, F. New insights into the oenological significance of Candida zemplinina: Impact of selected autochthonous strains on the volatile profile of apulian wines. Microorganisms 2020, 8, 628. [Google Scholar] [CrossRef] [PubMed]
- Englezos, V.; Rantsiou, K.; Torchio, F.; Rolle, L.; Gerbi, V.; Cocolin, L. Exploitation of the non-Saccharomyces yeast Starmerella bacillaris (synonym Candida zemplinina) in wine fermentation: Physiological and molecular characterizations. Int. J. Food Microbiol. 2015, 199, 33–40. [Google Scholar] [CrossRef]
- Ribéreau-Gayon, P.; Dubourdieu, D.; Donèche, B.; Lonvaud, A. Handbook of Enology: The Microbiology of Wine and Vinifications; John Wiley and Sons Ltd.: Chichester, UK, 2006. [Google Scholar]
- Nadai, C.; Giacomini, A.; Corich, V. The addition of wine yeast Starmerella bacillaris to grape skin surface influences must fermentation and glycerol production. OENO ONE 2021, 55, 47–55. [Google Scholar] [CrossRef]
- Bovo, B.; Nadai, C.; Vendramini, C.; Lemos, W.J., Jr.; Carlot, M.; Skelin, A.; Giacomini, A.; Corich, V. Aptitude of Saccharomyces yeasts to ferment unripe grapes harvested during cluster thinning for reducing alcohol content of wine. Int. J. Food Microbiol. 2016, 236, 56–64. [Google Scholar] [CrossRef]
- Nadai, C.; Campanaro, S.; Giacomini, A.; Corich, V. Selection and validation of reference genes for quantitative Real-Time PCR studies during Saccharomyces cerevisiae alcoholic fermentation in the presence of sulfite. Int. J. Food Microbiol. 2015, 215, 49–56. [Google Scholar] [CrossRef]
- Soares-Santos, V.; Pardo, I.; Ferrer, S. Cells-qPCR as a direct quantitative PCR method to avoid microbial DNA extractions in grape musts and wines. Int. J. Food Microbiol. 2017, 261, 25–34. [Google Scholar] [CrossRef]
- Agarbati, A.; Canonico, L.; Pecci, T.; Romanazzi, G.; Ciani, M.; Comitini, F. Biocontrol of non-saccharomyces yeasts in vineyard against the gray mold disease agent Botrytis cinerea. Microorganisms 2002, 10, 200. [Google Scholar] [CrossRef] [PubMed]
- Karabulut, O.A.; Smilanick, J.L.; Gabler, F.M.; Mansour, M.; Droby, S. Near-harvest applications of Metschnikowia fructicola, ethanol, and sodium bicarbonate to control postharvest diseases of grape in central California. Plant Dis. 2003, 87, 1384–1389. [Google Scholar] [CrossRef] [PubMed]
- Pawlikowska, E.; James, S.A.; Breierova, E.; Antolak, H.; Kregiel, D. Biocontrol capability of local Metschnikowia sp. isolates. Antonie van Leeuwenhoek 2019, 112, 1425–1445. [Google Scholar] [CrossRef] [PubMed]
- Gobert, A.; Tourdot-Maréchal, R.; Morge, C.; Sparrow, C.; Liu, Y.; Quintanilla-Casas, B.; Vichi, S.; Alexandre, H. Non-Saccharomyces yeasts nitrogen source preferences: Impact on sequential fermentation and wine volatile compounds profile. Front. Microbiol. 2017, 8, 2175. [Google Scholar] [CrossRef]
- Englezos, V.; Rantsiou, K.; Cravero, F.; Torchio, F.; Ortiz-Julien, A.; Gerbi, V.; Rolle, L.; Cocolin, L. Starmerella bacillaris and Saccharomyces cerevisiae mixed fermentations to reduce ethanol content in wine. Appl. Microbiol. Biotechnol. 2016, 100, 5515–5526. [Google Scholar] [CrossRef]
- Bely, M.; Renault, P.; da Silva, T.; Masneuf-Pomarède, I.; Warren, A.; Moine, V.; Coulon, J.; Sicard, D.; de Vienne, D.; Marullo, P. Alcohol level reduction in wine. In Non-Conventional Yeasts and Alcohol Level Reduction; Teissedre, P.L., Ed.; Vigne et Vin Publications Internationales: Bordeaux, France, 2013; pp. 33–37. [Google Scholar]
- Macías, M.M.; Manso, A.G.; Orellana, C.J.G.; Velasco, H.M.G.; Caballero, R.G.; Chamizo, J.C.P. Acetic acid detection threshold in synthetic wine samples of a portable electronic nose. Sensors 2013, 13, 208–220. [Google Scholar] [CrossRef]
- Tilloy, V.; Cadière, A.; Ehsani, M.; Dequin, S. Microbiological strategies to reduce alcohol levels in wines. In Non-Conventional Yeasts and Alcohol Level Reduction; Teissedre, P.L., Ed.; Vigne et Vin Publications Internationales: Bordeaux, France, 2013; pp. 29–32. [Google Scholar]


Disclaimer/Publisher’s Note: The statements, opinions and data contained in all publications are solely those of the individual author(s) and contributor(s) and not of MDPI and/or the editor(s). MDPI and/or the editor(s) disclaim responsibility for any injury to people or property resulting from any ideas, methods, instructions or products referred to in the content. |
© 2022 by the authors. Licensee MDPI, Basel, Switzerland. This article is an open access article distributed under the terms and conditions of the Creative Commons Attribution (CC BY) license (https://creativecommons.org/licenses/by/4.0/).