3.1. Drying Kinetics
Table 2 presents the reduction in drying time, as well as in the water content on a wet and dry basis, as there was an increase in temperature. For smelling peppers, in the variation from 50 to 80 °C, there was a reduction of more than 300% in the drying time, as well as a reduction of 41.52 and 44.04% for the water content on a wet and dry basis, respectively.
Still, according to
Table 2, for pout peppers, in the variation from 50 to 80 °C, there was a reduction of more than 200% in the drying time, as well as a reduction of 30.79 and 40.04% for water content on a wet and dry basis, respectively. A reduction in the equilibrium water content with increasing drying air temperature has also been reported for fruits of Cumari-do-Pará pepper [
27], Moroccan pepper [
28], Cabacinha pepper [
29], red pepper [
30], green pepper [
31], Cabacinha pepper seeds [
19], and Kampot pepper [
32]. This result indicates that the increase in temperature acts in the intensification of the drying process since higher temperatures can contribute to the improvement of the transfer of heat between the drying air and the samples, promoting a greater loss of water. Kumar et al. [
33] pointed out that this intensification is related to the increase in the internal partial vapor pressure due to the increase in temperature, which amplifies the difference between the vapor pressure of the drying air and the product, allowing the water to be eliminated more easily and quickly.
Table 3 and
Table 4 show the parameters, the coefficients of determination (R
2), the mean squared deviations (MSD), and the chi-square (χ
2) of the mathematical models adjusted to the experimental data of the drying of smelling peppers and pout peppers at temperatures from 50 to 80 °C. The coefficients of determination (R
2) showed values greater than 0.98 in all models and at all temperatures evaluated. For smelling peppers, at a temperature of 50 °C, the Logarithmic model resulted in the highest coefficient of determination (R
2 = 0.9997) and the lowest values for MSD and χ
2. At the other temperatures (60, 70, and 80 °C), the Midilli model provided the highest values of the coefficient of determination (R
2 > 0.9967) and the lowest values for MSD and χ
2, resulting in very close adjustment parameters.
For pout peppers, at a temperature of 50 °C, the Two Term model showed the highest coefficient of determination (R2 = 0.9997) and the lowest values for MSD and χ2. At temperatures of 60 and 70 °C, the Verna model obtained the highest coefficient of determination values (R2 > 0.9987) and the lowest values for MSD and χ2. At a temperature of 80 °C, the Midilli model resulted in the highest coefficient of determination (R2 = 0.9995) and the lowest values for MSD and χ2.
Comparing the magnitude of the R2, for the smelling peppers, it was observed that the Logarithmic, Midilli, Page, and Verna models presented values of R2 ≥ 0.9900 in all temperatures, while the other models presented an R2 from 0.9800, which indicates a good fit of the models to the experimental data. For the pout peppers, when comparing the magnitude of R2, it was observed that the Two Term, Henderson and Pabis, Henderson and Pabis Modified, Logarithmic, Logistic, Midilli, Page, and Verna models obtained R2 values ≥ 0.9900 in all temperatures, while the Newton and Thompson models presented an R2 from 0.9800, also indicating a good fit of the models to the experimental drying data.
Silva et al. [
29] studied the drying kinetics of Cabacinha pepper fruits at temperatures of 60, 70, 80, 90, and 100 °C, reporting that the Midilli model was the one that presented the best adjustment to the experimental drying data, with an R
2 > 0.9990. Tekin and Baslar [
34] investigated the effect of ultrasound-assisted vacuum drying on red peppers (
Capsicum annuum L.) at temperatures of 45, 55, 65, and 75 °C, noting that the Logarithmic model showed a better fit, with R
2 > 0.9950. Souza et al. [
35] evaluated the drying kinetics of pequi mesocarp, reporting that, among the analyzed models, Midilli presented the most adequate fit to describe the drying curves at temperatures of 40, 50, 60, and 70 °C, with an R
2 > 0.9979 and the lowest values for mean relative error and estimated mean error. Midilli et al. [
19] developed this model through experiments with mushrooms, pollen, and pistachios dried in laboratory conditions, under direct sunlight and in a system with a combination of sunlight and forced air circulation, in order to describe the drying kinetics in a single layer. They compared data statistically with other commonly used empirical or semi-empirical models.
Still, according to
Table 3 and
Table 4, it can be verified for the Midilli model that the coefficient did not increase as the drying temperature increased. The other coefficients, a, k, and b, did not express a clear trend as a function of temperature. The variations of the a, n, and b coefficients, unlike the k coefficient, were more associated with the mathematical modeling of the adjustments than with the drying phenomenon, since Midilli is a semi-empirical model [
36]. Tekin and Baslar [
34] observed the same behavior of the coefficients involved in modeling the drying of red peppers.
Figure 1 shows the drying curves for smelling peppers (
Figure 1a) and pout peppers (
Figure 1b) adjusted by the Midilli model at temperatures from 50 to 80 °C. In both varieties, the increase in drying temperature resulted in an increase in the water evaporation rate from the samples. For smelling peppers, the curves showed different behavior for different temperatures. In pout peppers, at temperatures of 70 and 80 °C, the curves showed similar behavior. There is also a low dispersion of the experimental values in relation to the adjustment curves, which was a result of the high values of R
2 and low MSD and χ
2.
3.2. Effective Diffusivity
Table 5 shows the effective diffusivities (D
eff) obtained in the drying of smelling and pout peppers at the studied temperatures. The diffusivity values increased with the increase in the temperature of the drying air by approximately 264 and 247% for smelling and pout peppers, respectively, among the evaluated temperatures, including all values in the range frequently reported for foodstuffs, which is from 10
−9 to 10
−11 m
2 s
−1 [
32].
The effective diffusivity is directly influenced by the increase in temperature, since this change modifies the removal of water from the sample. Gandolfi et al. [
31], evaluating the drying of green peppers at two temperatures (60 and 75 °C) and two air speeds (1.5 and 3.0 m s
−1), reported D
eff values above those usually reported for food products, ranging from 4.63 × 10
−8 to 7.98 × 10
−8, indicating that the increase in temperature had a greater influence than the air velocity on the increase in diffusivity. Silva et al. [
29] indicated D
eff values ranging from 4.07 × 10
−9 to 21.42 × 10
−9 in the drying of Cabacinha pepper fruits at temperatures from 60 to 100 °C.
Differences in diffusivity values can be caused by the chemical composition, lipid content, initial amount of water, and especially by the structure, shape, and size of each material. In the migration of water from the interior to the surface of the product, the physical and chemical properties are influenced by the composition, depending on a greater or lesser affinity, which is also related to the structural nature of each raw material [
37].
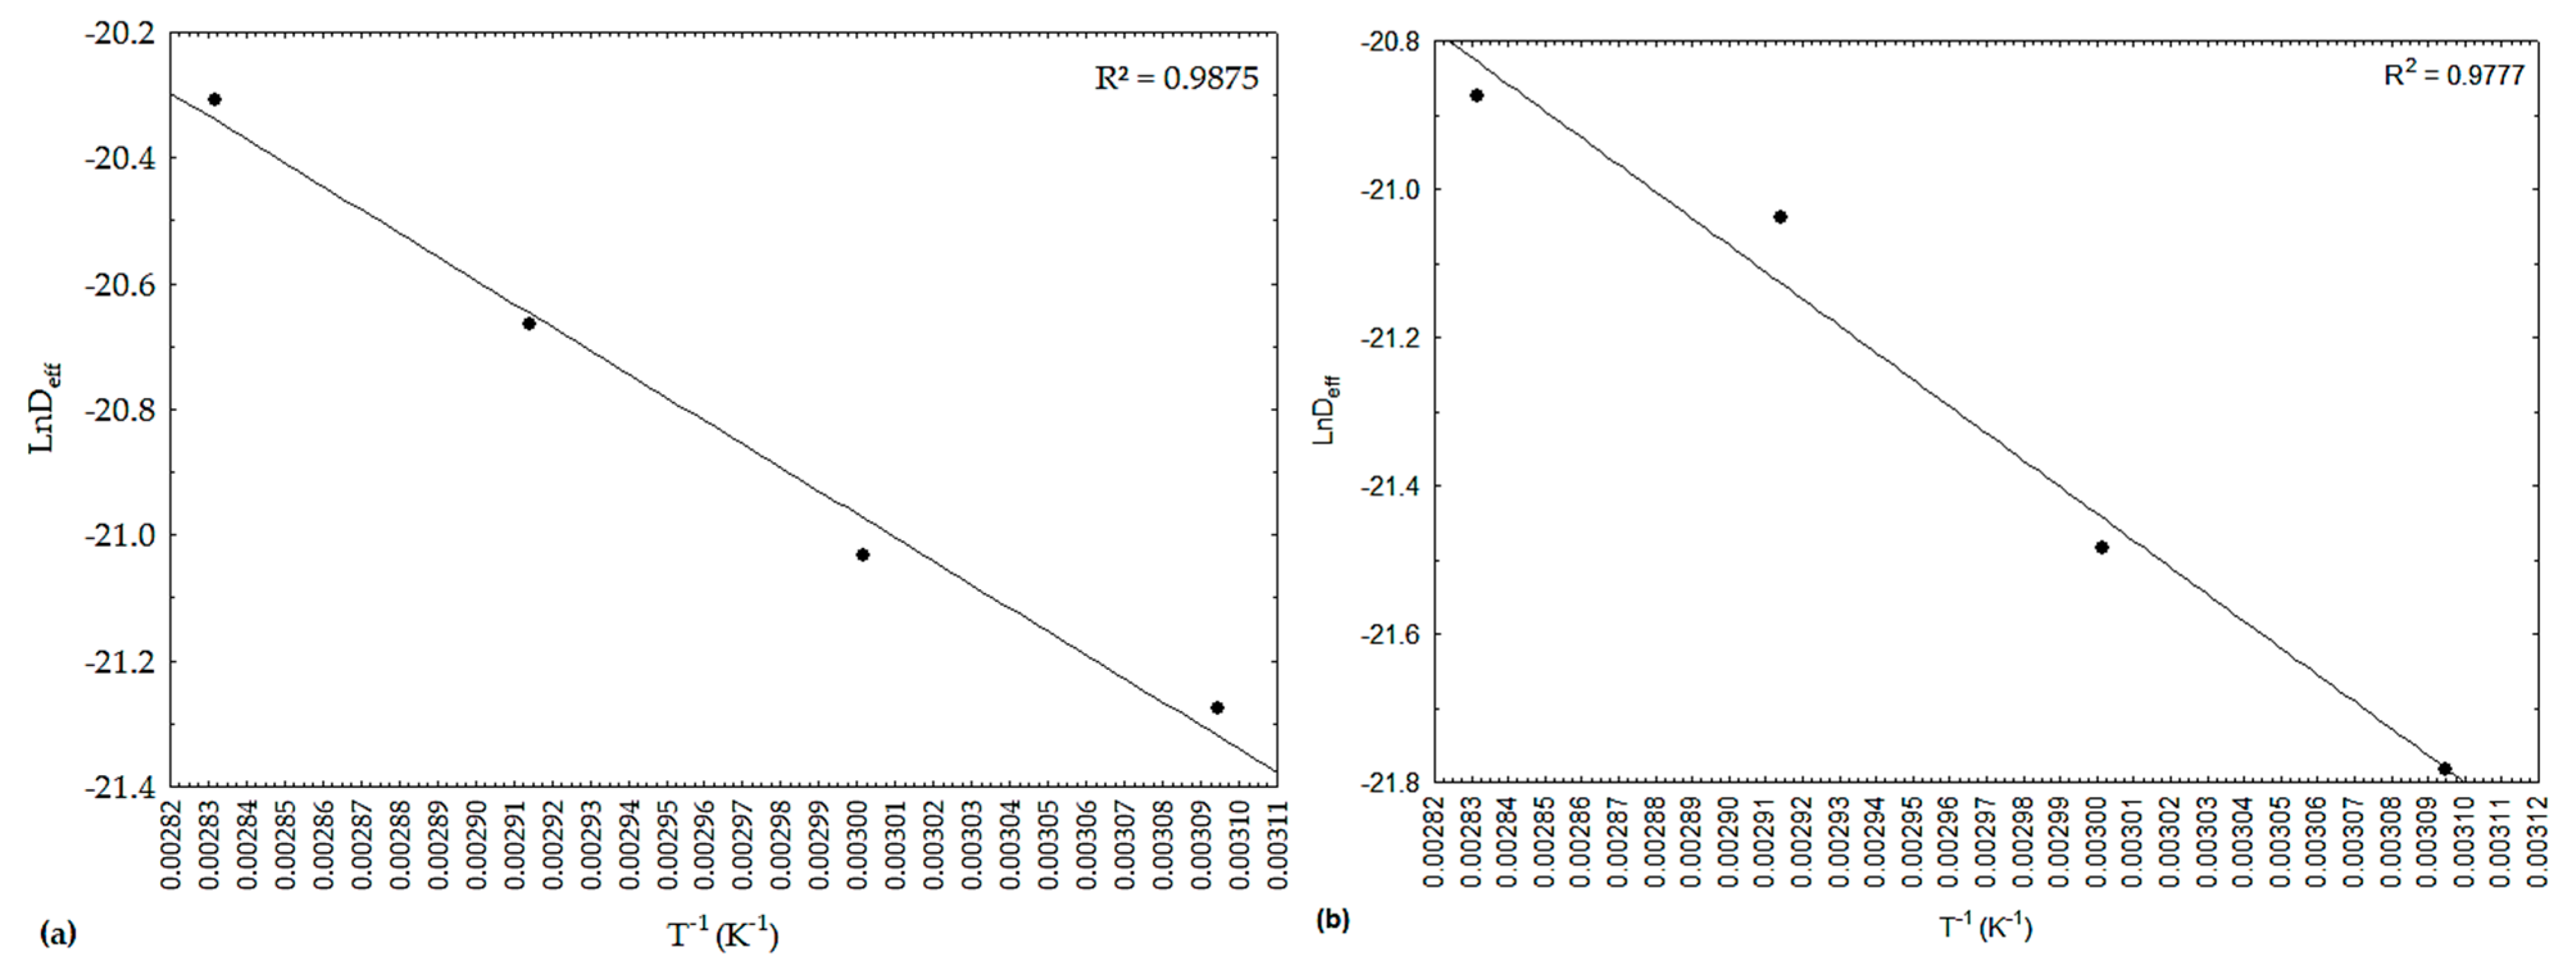
In
Figure 2, there is a representation of the effective diffusivities (D
eff), in the form of ‘ln D
eff’, as a function of the inverse of the absolute temperature (1/T), referring to the drying of the peppers under study. It was observed that the dependence was satisfactorily described by the Arrhenius-type equation, with values revealing linear behavior and R
2 values above 0.9770.
Table 6 shows the values of activation energy for smelling and pout peppers quantified from the Arrhenius-type equation (
Figure 2).
Activation energy refers to the amount of energy required to stimulate the water diffusion process. Therefore, the lower the activation energy, the greater the effective diffusivity of the water contained in the material; consequently, the energy required to transform liquid free water into steam will be lower [
38]. This energy must be overcome to allow the migration of water molecules from the inside to the outside of the product and varies according to structure and chemical composition. It was noted that the drying process of smelling and pout peppers showed very close activation energies, with a slightly higher value for Smelling peppers, with values that fall within the range of 12.7 to 110 kJ·mol
−1, often reported for foodstuffs [
39].
Higher values than the present study were reported by Kumar and Shrivastava [
40] for green peppers (43.38 kJ·mol
−1); Silva et al. [
29] for Cabacinha pepper (36.09 kJ·mol
−1); Vega et al. [
41] for red peppers (39.70 kJ·mol
−1); and Kaleemullah and Kailappan [
42] for red peppers (37.76 kJ·mol
−1). Onwude et al. [
43] carried out a comprehensive review study on the thin-layer drying of fruits and vegetables and found, in the researched bibliography, that 90% of the values for activation energy were in the range of 14.42 to 43.26 kJ·mol
−1.
3.3. Thermodynamic Properties
Table 7 shows the thermodynamic properties of the drying process of smelling and pout peppers, with the respective enthalpy, entropy, and Gibbs free energy for the evaluated temperatures. The enthalpy (ΔH) decreased with increasing drying temperature, which indicates that a smaller amount of energy was required for drying to occur at higher temperatures. Silva et al. [
29] reported equivalent behavior, with ΔH values ranging from 33.3233 to 32.9908 kJ·mol
−1 for the enthalpy in drying Cabacinha peppers at temperatures from 60 to 100 °C. During the drying process, the enthalpy is related to the energy required to remove the water bound to the product. In our study, the pout pepper had a lower ΔH than the smelling pepper, indicating a lower amount of energy needed to dry them, corroborating their initial water content (
Table 8).
Entropy behaved similarly to enthalpy, showing a slight decrease with increasing temperature and with higher values for smelling pepper. Entropy is a thermodynamic property associated with the degree of disorder of the system, and when it reduces with increasing temperature, it indicates that there is an increase in the order of the system [
11].
The Gibbs free energy (ΔG) was positive and increased with temperature, indicating an endergonic reaction, which requires the addition of energy from the environment involved in the drying of the product. This energy is related to the work required to make the sorption sites available, and this behavior was expected since the desorption process was not spontaneous. Values close to ΔG were determined by Rodovalho et al. [
44], who evaluated the drying kinetics of goat pepper grains at temperatures of 30, 35, and 40 °C, reporting values for ΔG of 113.15, 135.10, and 137.05 kJ·mol
−1, respectively.
3.4. Proximal Composition of in Natura and Dried Peppers
Table 8 presents the average values that resulted from the proximal composition of the peppers in natura and dried at temperatures of 50, 60, 70, and 80 °C. Drying promoted a reduction in water content and an increase in lipid concentration, influencing the energy value. According to Leite et al. [
10], the degradation of nutrients due to heat is often compensated by the concentration in view of the reduction in water content. However, the volatilization of thermolabile principles or the conversion into other compounds can cause changes in composition, even causing a decrease in nutritional values, which explains the variations observed for carbohydrates, ashes, and proteins.
For the parameters evaluated in the proximal composition, statistically significant differences were observed when comparing the two varieties of peppers and the applied treatments. Peppers in natura showed high water content (above 80%) and the increase in drying air temperature reduced the water content to average values between 6 and 8%. The loss of water observed with the increase in drying temperature promoted less water availability for the activity of microorganisms and enzymes, which increases the shelf life of the product. Vega-Gálvez et al. [
45] studied the effect of drying air temperature on the physicochemical properties of red pepper, reporting a water content of 89.40% for fresh samples. A maximum water content value of 10.63% was observed at 70 °C; however, lower water contents were observed at 50 °C (8.75%) and 60 °C (9.01%), as well as at 80 °C (8.72%) and 90 °C (8.88%) due to long drying times and high temperatures.
In the determination of lipids, there is a tendency for their concentration to increase with an increase in temperature. When in natura there was no significant difference between the analyzed peppers and, after drying, the pout pepper had a higher lipid content with statistically significant differences between the analyzed varieties. Reis et al. [
46] found the following percentages for Cumari do Pará peppers in different treatments: 0.52% (in natura, 45 and 55 °C) and 0.49% (65 °C), lower values compared to the present study, which can be explained by the probable absence of seeds, since whole peppers were used in this study.
Proteins showed slight changes. For in natura smelling peppers compared to dried peppers, a slight decrease was observed. In pout peppers, a subtle addition to the dried ones could be seen in comparison with the in natura treatment. Pinar et al. [
47] evaluated two pepper cultivars in different drying methods, reporting 7.97 and 9.45% of crude protein for the Bozok cultivar at temperatures of 60 and 80 °C and for the Pinar cultivar, 7.68% (60 °C) and 10.68% (80 °C) crude protein. It was noted that, at the highest temperature, there was a better preservation of the protein content, and similar behavior occurred in the present study, where the protein value was higher at 80 °C than at 50 °C. It was noticed that, in both varieties, the protein content at the temperature of 80 °C did not differ significantly in relation to in natura treatments, confirming the non-degradation of the proteins. This happens because higher temperatures reduce enzymatic activity, thus contributing to the prevention of losses.
The ashes also showed few changes that were mostly non-significant, both in comparison among varieties and among drying temperatures and in natura samples. Faustino, Barroca, and Guiné [
48], in a study on the drying and characterization of green peppers, obtained percentages of 5.14% (in natura), 6.78% (30 °C), and 6.42% (70 °C), not showing significant differences between fresh and dried samples. Similar behavior was verified for smelling peppers, where the mean value obtained at 80 °C did not differ significantly from the sample in natura.
Carbohydrates revealed values between 71 and 77% for peppers in natura. For smelling peppers dried at 50 °C, there was a significant increase in the average value, with a tendency to decrease for the other temperatures, whereas the pout pepper showed a tendency for a decrease for all temperatures in comparison with the in natura treatment. Faustino, Barroca, and Guinea [
48], when evaluating green peppers, mentioned the following percentages for total carbohydrates: 85.27% (in natura), 4.36% (30 °C), and 4.58% (70 °C), revealing a significant loss, where the drying operation induced a reduction of 95% of these. However, in the present study, slight variations were observed, where for smelling peppers, the average value obtained at 80 °C did not differ statistically from the in natura treatment. There was no significant difference between the two varieties evaluated at this temperature. This behavior suggests the existence of some protective mechanism or component activated during the drying of these peppers.
The energy value in kilocalories (kcal 100
−1 g
−1 d.b.) for both varieties under study, in the in natura treatment, there were very close values with no significant difference. It was possible to notice that the elevation of the drying temperature promoted a tendency to increase the energy value, since the reduction of the water content tends to concentrate the macronutrients, providing the increase of the caloric value. Vega-Gálvez et al. [
45] determined the proximal composition of fresh red pepper, quoting an energy value of 272.17 kcal 100
−1 g
−1. From the composition carried out by Faustino, Barroca, and Guiné [
48] for green peppers in natura, it is possible to indicate an energy value of 471.50 kcal 100
−1 g
−1, placing the values of the present study within the range mentioned by the authors.

 ,
, 


