
Novel Method Based on Ion Mobility Spectrometry Combined with Machine Learning for the Discrimination of Fruit Juices

 ,
,  , ,
, ,  and
and
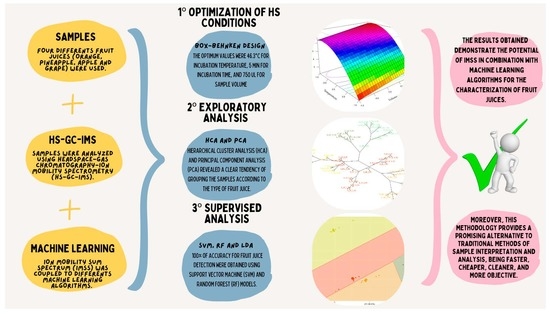
Abstract
1. Introduction
2. Materials and Methods
2.1. Juice Samples
2.2. HS-GC-IMS Analysis Acquisition
2.2.1. Box–Behnken Design (BBD)
2.3. Data Analysis
2.3.1. IMS Sum Spectrum Acquisition
2.3.2. Multivariate Analysis
3. Results and Discussion
3.1. Optimization Study
3.2. Exploratory Analysis
3.3. Classification Models
3.3.1. Support Vector Machine (SVM) with Radial Basis Function (RBF)
3.3.2. Random Forest (RF)
3.3.3. Lineal Discriminant Analysis
4. Conclusions
Supplementary Materials
Author Contributions
Funding
Data Availability Statement
Acknowledgments
Conflicts of Interest
References
- European Parliament Directive 2012/12/EU of the European Parliament and of the Council of 19 April 2012 Amending Council Directive 2001/112/EC Relating to Fruit Juices and Certain Similar Products Intended for Human Consumption. Off. J. Eur. Union. 2012, 1–11.
- Alhabeeb, H.; Sohouli, M.H.; Lari, A.; Fatahi, S.; Shidfar, F.; Alomar, O.; Salem, H.; Al-Badawi, I.A.; Abu-Zaid, A. Impact of Orange Juice Consumption on Cardiovascular Disease Risk Factors: A Systematic Review and Meta-Analysis of Randomized-Controlled Trials. Crit. Rev. Food Sci. Nutr. 2020, 62, 3389–3402. [Google Scholar] [CrossRef]
- Ho, K.K.H.Y.; Ferruzzi, M.G.; Wightman, J.L.D. Potential Health Benefits of (Poly)Phenols Derived from Fruit and 100% Fruit Juice. Nutr. Rev. 2020, 78, 145–174. [Google Scholar] [CrossRef]
- Crowe-White, K.; Parrott, J.S.; Stote, K.S.; Gutschall, M.; Benson-Davies, S.; Droke, E.; O’Neil, C.E.; Wolfram, T.; Ziegler, P. Metabolic Impact of 100% Fruit Juice Consumption on Antioxidant/Oxidant Status and Lipid Profiles of Adults: An Evidence-Based Review. Crit. Rev. Food Sci. Nutr. 2017, 57, 152–162. [Google Scholar] [CrossRef]
- Zielinski, A.A.F.; Haminiuk, C.W.I.; Nunes, C.A.; Schnitzler, E.; van Ruth, S.M.; Granato, D. Chemical Composition, Sensory Properties, Provenance, and Bioactivity of Fruit Juices as Assessed by Chemometrics: A Critical Review and Guideline. Compr. Rev. Food Sci. Food Saf. 2014, 13, 300–316. [Google Scholar] [CrossRef]
- Monterisi, S.; Zuluaga, M.Y.A.; Porceddu, A.; Cesco, S.; Pii, Y. The Application of High-Resolution Melting Analysis to TrnL (UAA) Intron Allowed a Qualitative Identification of Apple Juice Adulterations. Foods 2023, 12, 1437. [Google Scholar] [CrossRef]
- Liang, Y.L.; Ding, Y.J.; Liu, X.; Zhou, P.F.; Ding, M.X.; Yin, J.J.; Song, Q. A Duplex PCR–RFLP–CE for Simultaneous Detection of Mandarin and Grapefruit in Orange Juice. Eur. Food Res. Technol. 2021, 247, 1–7. [Google Scholar] [CrossRef]
- Jungen, M.; Lotz, P.; Patz, C.-D.; Steingass, C.B.; Schweiggert, R. Coumarins, Psoralens, and Quantitative 1H-NMR Spectroscopy for Authentication of Lemon (Citrus limon [L.] Burm.f.) and Persian Lime (Citrus × latifolia [Yu.Tanaka] tanaka) Juices. Food Chem. 2021, 359, 129804. [Google Scholar] [CrossRef]
- Vigneau, E.; Thomas, F. Model Calibration and Feature Selection for Orange Juice Authentication by 1H NMR Spectroscopy. Chemom. Intell. Lab. Syst. 2012, 117, 22–30. [Google Scholar] [CrossRef]
- Jahani, R.; Yazdanpanah, H.; van Ruth, S.M.; Kobarfard, F.; Alewijn, M.; Mahboubi, A.; Faizi, M.; Aliabadi, M.H.S.; Salamzadeh, J. Novel Application of Near-Infrared Spectroscopy and Chemometrics Approach for Detection of Lime Juice Adulteration. Iran. J. Pharm. Res. 2020, 19, 34. [Google Scholar] [CrossRef]
- Tan, C.; Chen, H.; Lin, Z.; Wu, D.; Cheng, B.; Liu, W. Characterization of Apple Juice Adulteration by Attenuated Total Reflection–Mid-Infrared Spectroscopy and Partial Least Squares. Anal. Lett. 2023, 1–13. [Google Scholar] [CrossRef]
- Mohammadian, A.; Barzegar, M.; Mani-Varnosfaderani, A. Detection of Fraud in Lime Juice Using Pattern Recognition Techniques and FT-IR Spectroscopy. Food Sci. Nutr. 2021, 9, 3026–3038. [Google Scholar] [CrossRef] [PubMed]
- Calle, J.L.P.; Ferreiro-González, M.; Ruiz-Rodríguez, A.; Fernández, D.; Palma, M. Detection of Adulterations in Fruit Juices Using Machine Learning Methods over FT-IR Spectroscopic Data. Agronomy 2022, 12, 683. [Google Scholar] [CrossRef]
- Willems, J.L.; Low, N.H. Authenticity Analysis of Pear Juice Employing Chromatographic Fingerprinting. J. Agric. Food Chem. 2014, 62, 11737–11747. [Google Scholar] [CrossRef]
- Shojaee AliAbadi, M.H.; Karami-Osboo, R.; Kobarfard, F.; Jahani, R.; Nabi, M.; Yazdanpanah, H.; Mahboubi, A.; Nasiri, A.; Faizi, M. Detection of Lime Juice Adulteration by Simultaneous Determination of Main Organic Acids Using Liquid Chromatography-Tandem Mass Spectrometry. J. Food Compos. Anal. 2022, 105, 104223. [Google Scholar] [CrossRef]
- Yeganeh-Zare, S.; Farhadi, K.; Amiri, S. Rapid Detection of Apple Juice Concentrate Adulteration with Date Concentrate, Fructose and Glucose Syrup Using HPLC-RID Incorporated with Chemometric Tools. Food Chem. 2022, 370, 131015. [Google Scholar] [CrossRef]
- Li, S.; Hu, Y.; Liu, W.; Chen, Y.; Wang, F.; Lu, X.; Zheng, W. Untargeted Volatile Metabolomics Using Comprehensive Two-Dimensional Gas Chromatography-Mass Spectrometry—A Solution for Orange Juice Authentication. Talanta 2020, 217, 121038. [Google Scholar] [CrossRef] [PubMed]
- Zhou, Q.; Li, G.; Ou-Yang, Z.; Yi, X.; Huang, L.; Wang, H. Volatile Organic Compounds Profiles to Determine Authenticity of Sweet Orange Juice Using Head Space Gas Chromatography Coupled with Multivariate Analysis. Foods 2020, 9, 505. [Google Scholar] [CrossRef] [PubMed]
- Gao, C.; Wang, R.; Zhang, F.; Sun, Z.; Meng, X. The Process Monitors of Probiotic Fermented Sour Cherry Juice Based on the HS-GC-IMS. Microchem. J. 2022, 180, 107537. [Google Scholar] [CrossRef]
- Wang, Z.; Mi, S.; Wang, X.; Mao, K.; Liu, Y.; Gao, J.; Sang, Y. Characterization and Discrimination of Fermented Sweet Melon Juice by Different Microbial Strains via GC-IMS-Based Volatile Profiling and Chemometrics. Food Sci. Hum. Wellness 2023, 12, 1241–1247. [Google Scholar] [CrossRef]
- Xuan, X.; Sun, R.; Zhang, X.; Cui, Y.; Lin, X.; Sun, Y.; Deng, W.; Liao, X.; Ling, J. Novel Application of HS-GC-IMS with PCA for Characteristic Fingerprints and Flavor Compound Variations in NFC Chinese Bayberry (Myrica rubra) Juice during Storage. LWT 2022, 167, 113882. [Google Scholar] [CrossRef]
- Zhang, J.; Pan, L.; Tu, K. Aroma in Freshly Squeezed Strawberry Juice during Cold Storage Detected by E-Nose, HS–SPME–GC–MS and GC-IMS. J. Food Meas. Charact. 2023, 1–14. [Google Scholar] [CrossRef]
- Aliaño-González, M.J.; Ferreiro-González, M.; Espada-Bellido, E.; Barbero, G.F.; Palma, M. Novel Method Based on Ion Mobility Spectroscopy for the Quantification of Adulterants in Honeys. Food Control 2020, 114, 107236. [Google Scholar] [CrossRef]
- Arroyo-Manzanares, N.; García-Nicolás, M.; Castell, A.; Campillo, N.; Viñas, P.; López-García, I.; Hernández-Córdoba, M. Untargeted Headspace Gas Chromatography—Ion Mobility Spectrometry Analysis for Detection of Adulterated Honey. Talanta 2019, 205, 120123. [Google Scholar] [CrossRef] [PubMed]
- Gerhardt, N.; Birkenmeier, M.; Sanders, D.; Rohn, S.; Weller, P. Resolution-Optimized Headspace Gas Chromatography-Ion Mobility Spectrometry (HS-GC-IMS) for Non-Targeted Olive Oil Profiling. Anal. Bioanal. Chem. 2017, 409, 3933–3942. [Google Scholar] [CrossRef] [PubMed]
- Contreras, M.d.M.; Jurado-Campos, N.; Arce, L.; Arroyo-Manzanares, N. A Robustness Study of Calibration Models for Olive Oil Classification: Targeted and Non-Targeted Fingerprint Approaches Based on GC-IMS. Food Chem. 2019, 288, 315–324. [Google Scholar] [CrossRef]
- Konieczka, P.P.; Aliaño-González, M.J.; Ferreiro-González, M.; Barbero, G.F.; Palma, M. Characterization of Arabica and Robusta Coffees by Ion Mobility Sum Spectrum. Sensors 2020, 20, 3123. [Google Scholar] [CrossRef] [PubMed]
- Calle, J.L.P.; Barea-Sepúlveda, M.; Ruiz-Rodríguez, A.; Álvarez, J.Á.; Ferreiro-González, M.; Palma, M. Rapid Detection and Quantification of Adulterants in Fruit Juices Using Machine Learning Tools and Spectroscopy Data. Sensors 2022, 22, 3852. [Google Scholar] [CrossRef] [PubMed]
- Lyu, W.; Yuan, B.; Liu, S.; Simon, J.E.; Wu, Q. Assessment of Lemon Juice Adulteration by Targeted Screening Using LC-UV-MS and Untargeted Screening Using UHPLC-QTOF/MS with Machine Learning. Food Chem. 2022, 373, 131424. [Google Scholar] [CrossRef]
- Hong, X.; Wang, J. Detection of Adulteration in Cherry Tomato Juices Based on Electronic Nose and Tongue: Comparison of Different Data Fusion Approaches. J. Food Eng. 2014, 126, 89–97. [Google Scholar] [CrossRef]
- Putri, A.R.; Aliaño-González, M.J.; Ferreiro, M.; Setyaningsih, W.; Rohman, A.; Riyanto, S.; Palma, M. Development of a Methodology Based on Headspace-Gas Chromatography-Ion Mobility Spectrometry for the Rapid Detection and Determination of Patin Fish Oil Adulterated with Palm Oil. Arab. J. Chem. 2020, 13, 7524–7532. [Google Scholar] [CrossRef]
- González-de-Peredo, A.V.; Vázquez-Espinosa, M.; Espada-Bellido, E.; Ferreiro-González, M.; Barbero, G.F.; Palma, M.; Carrera, C. Optimization of a Microwave Assisted Extraction Method for Maximum Flavonols and Antioxidant Activity of Onion Extracts. Antioxidants 2022, 11, 2393. [Google Scholar] [CrossRef] [PubMed]
- Lenth, R.V. Response-Surface Methods in R, Using RSM. J. Stat. Softw. 2009, 32, 1–17. [Google Scholar] [CrossRef]
- Wickham, H. Ggplot2: Elegant Graphics for Data Analysis; Springer-New York: New York, NY, USA, 2016; ISBN 978-3-319-24277-4. [Google Scholar]
- Köhn, H.-F.; Hubert, L.J. Hierarchical Cluster Analysis. In Wiley StatsRef: Statistics Reference Online; John Wiley & Sons, Ltd: Chichester, UK, 2015; pp. 1–13. [Google Scholar]
- Kuhn, M. Building Predictive Models in R Using the Caret Package. J. Stat. Softw. 2008, 28, 1–26. [Google Scholar] [CrossRef]
- Géron, A. Hands-on Machine Learning with Scikit-Learn and TensorFlow, 2nd ed.; Rachel Roumeliotis, N.T., Ed.; O’Reilly Media, Inc.: Sebastopol, CA, USA, 2019. [Google Scholar]
- Rasekh, M.; Karami, H. Application of Electronic Nose with Chemometrics Methods to the Detection of Juices Fraud. J. Food Process. Preserv. 2021, 45, e15432. [Google Scholar] [CrossRef]


| Variable | −1 | 0 | 1 |
|---|---|---|---|
| Incubation time (min) | 5 | 10 | 15 |
| Incubation temperature (°C) | 40 | 60 | 80 |
| Sample volume (µL) | 250 | 500 | 750 |
| Effect | Estimated Coefficient | Standard Error | p-Value |
|---|---|---|---|
| Intercept | 6.3332 | 0.2471 | <0.001 |
| Temperature | −2.0942 | 0.1513 | <0.001 |
| Volume | 0.5031 | 0.1513 | 0.0209 |
| Time | −0.2830 | 0.1513 | 0.1203 |
| Temperature:Volume | 0.0034 | 0.2140 | 0.9879 |
| Temperature:Time | −0.2145 | 0.2140 | 0.3622 |
| Volume:Time | −0.2246 | 0.2140 | 0.3420 |
| Temperature 2 | −1.5351 | 0.2227 | <0.001 |
| Volume 2 | −0.2111 | 0.2227 | 0.3866 |
| Time 2 | 0.0643 | 0.2227 | 0.7843 |
Disclaimer/Publisher’s Note: The statements, opinions and data contained in all publications are solely those of the individual author(s) and contributor(s) and not of MDPI and/or the editor(s). MDPI and/or the editor(s) disclaim responsibility for any injury to people or property resulting from any ideas, methods, instructions or products referred to in the content. |
© 2023 by the authors. Licensee MDPI, Basel, Switzerland. This article is an open access article distributed under the terms and conditions of the Creative Commons Attribution (CC BY) license (https://creativecommons.org/licenses/by/4.0/).
Share and Cite
Calle, J.L.P.; Vázquez-Espinosa, M.; Barea-Sepúlveda, M.; Ruiz-Rodríguez, A.; Ferreiro-González, M.; Palma, M. Novel Method Based on Ion Mobility Spectrometry Combined with Machine Learning for the Discrimination of Fruit Juices. Foods 2023, 12, 2536. https://doi.org/10.3390/foods12132536
Calle JLP, Vázquez-Espinosa M, Barea-Sepúlveda M, Ruiz-Rodríguez A, Ferreiro-González M, Palma M. Novel Method Based on Ion Mobility Spectrometry Combined with Machine Learning for the Discrimination of Fruit Juices. Foods. 2023; 12(13):2536. https://doi.org/10.3390/foods12132536
Chicago/Turabian StyleCalle, José Luis P., Mercedes Vázquez-Espinosa, Marta Barea-Sepúlveda, Ana Ruiz-Rodríguez, Marta Ferreiro-González, and Miguel Palma. 2023. "Novel Method Based on Ion Mobility Spectrometry Combined with Machine Learning for the Discrimination of Fruit Juices" Foods 12, no. 13: 2536. https://doi.org/10.3390/foods12132536
APA StyleCalle, J. L. P., Vázquez-Espinosa, M., Barea-Sepúlveda, M., Ruiz-Rodríguez, A., Ferreiro-González, M., & Palma, M. (2023). Novel Method Based on Ion Mobility Spectrometry Combined with Machine Learning for the Discrimination of Fruit Juices. Foods, 12(13), 2536. https://doi.org/10.3390/foods12132536