
Quality Information Detection of Agaricus bisporus Based on a Portable Spectrum Acquisition Device

Abstract
:1. Introduction
2. Materials and Methods
2.1. Agaricus bisporus Sample Preparation
2.2. Portable Agaricus bisporus Spectrum Acquisition Device
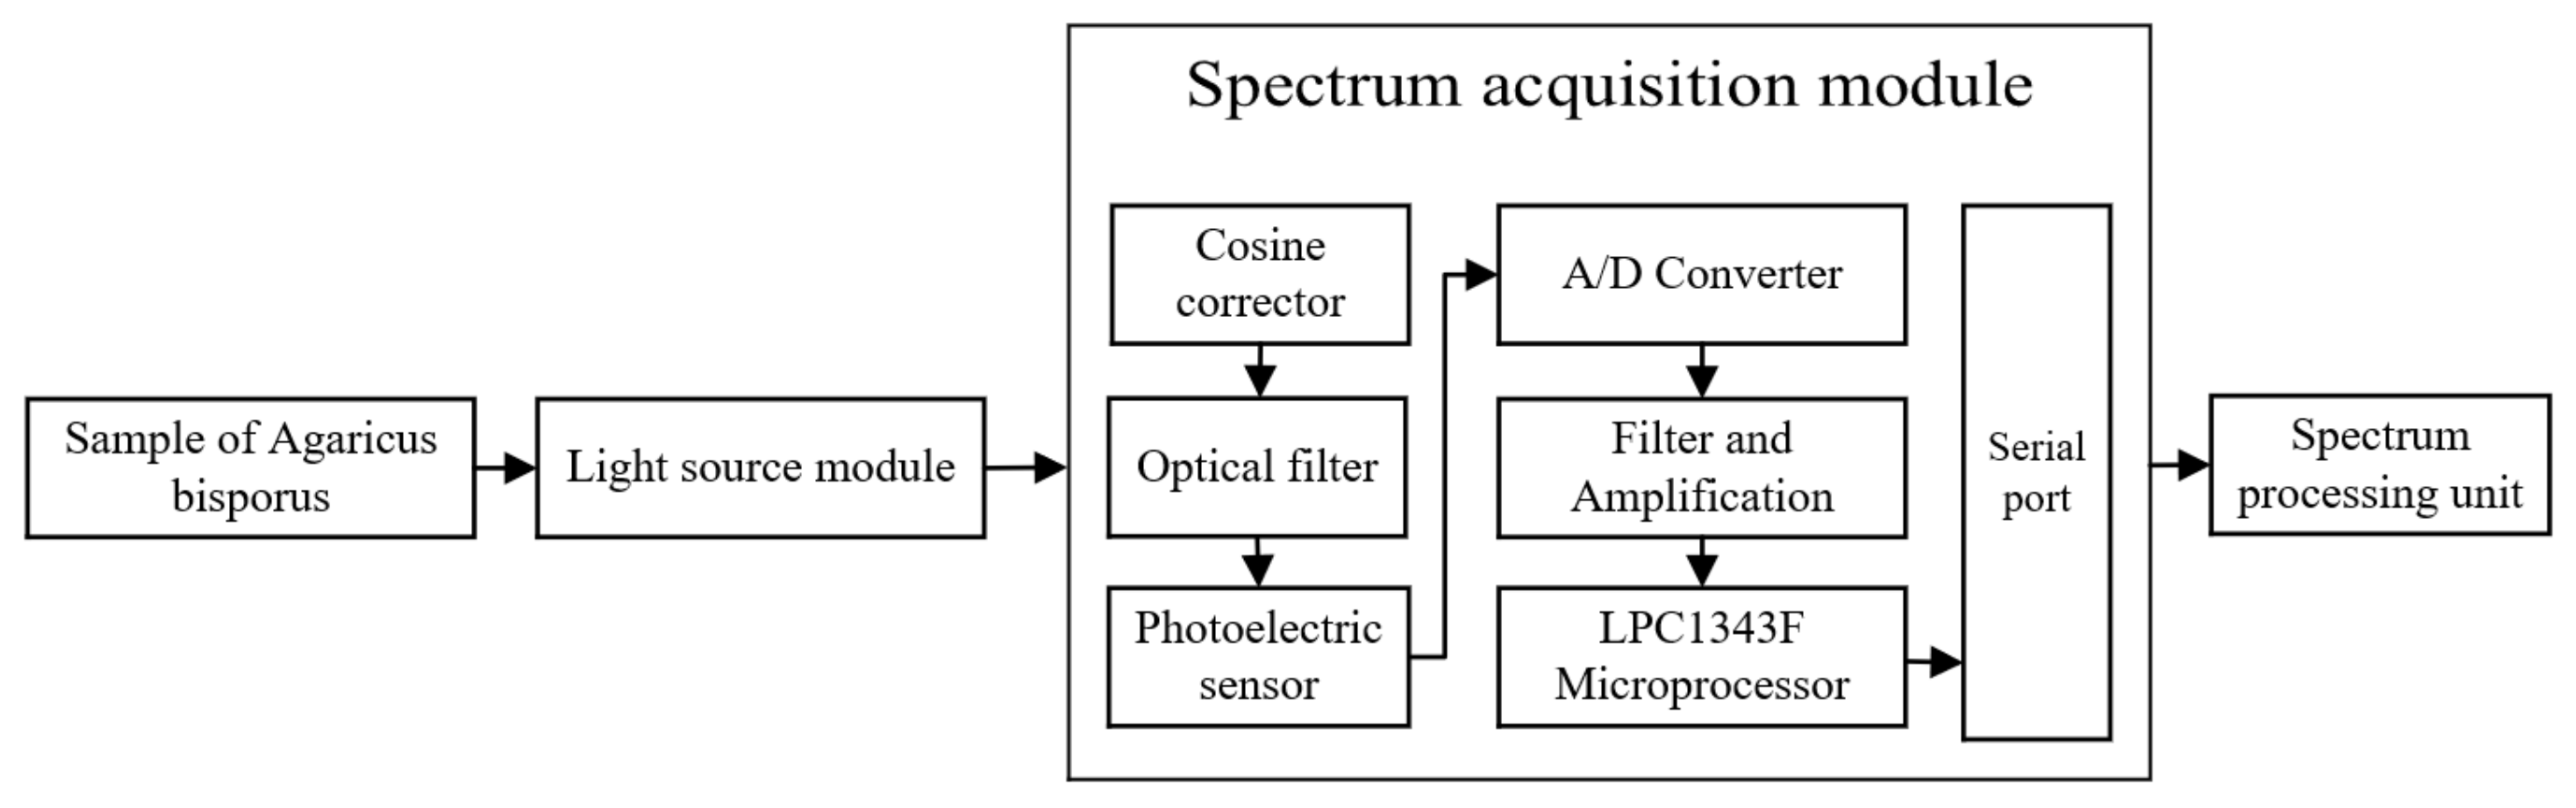
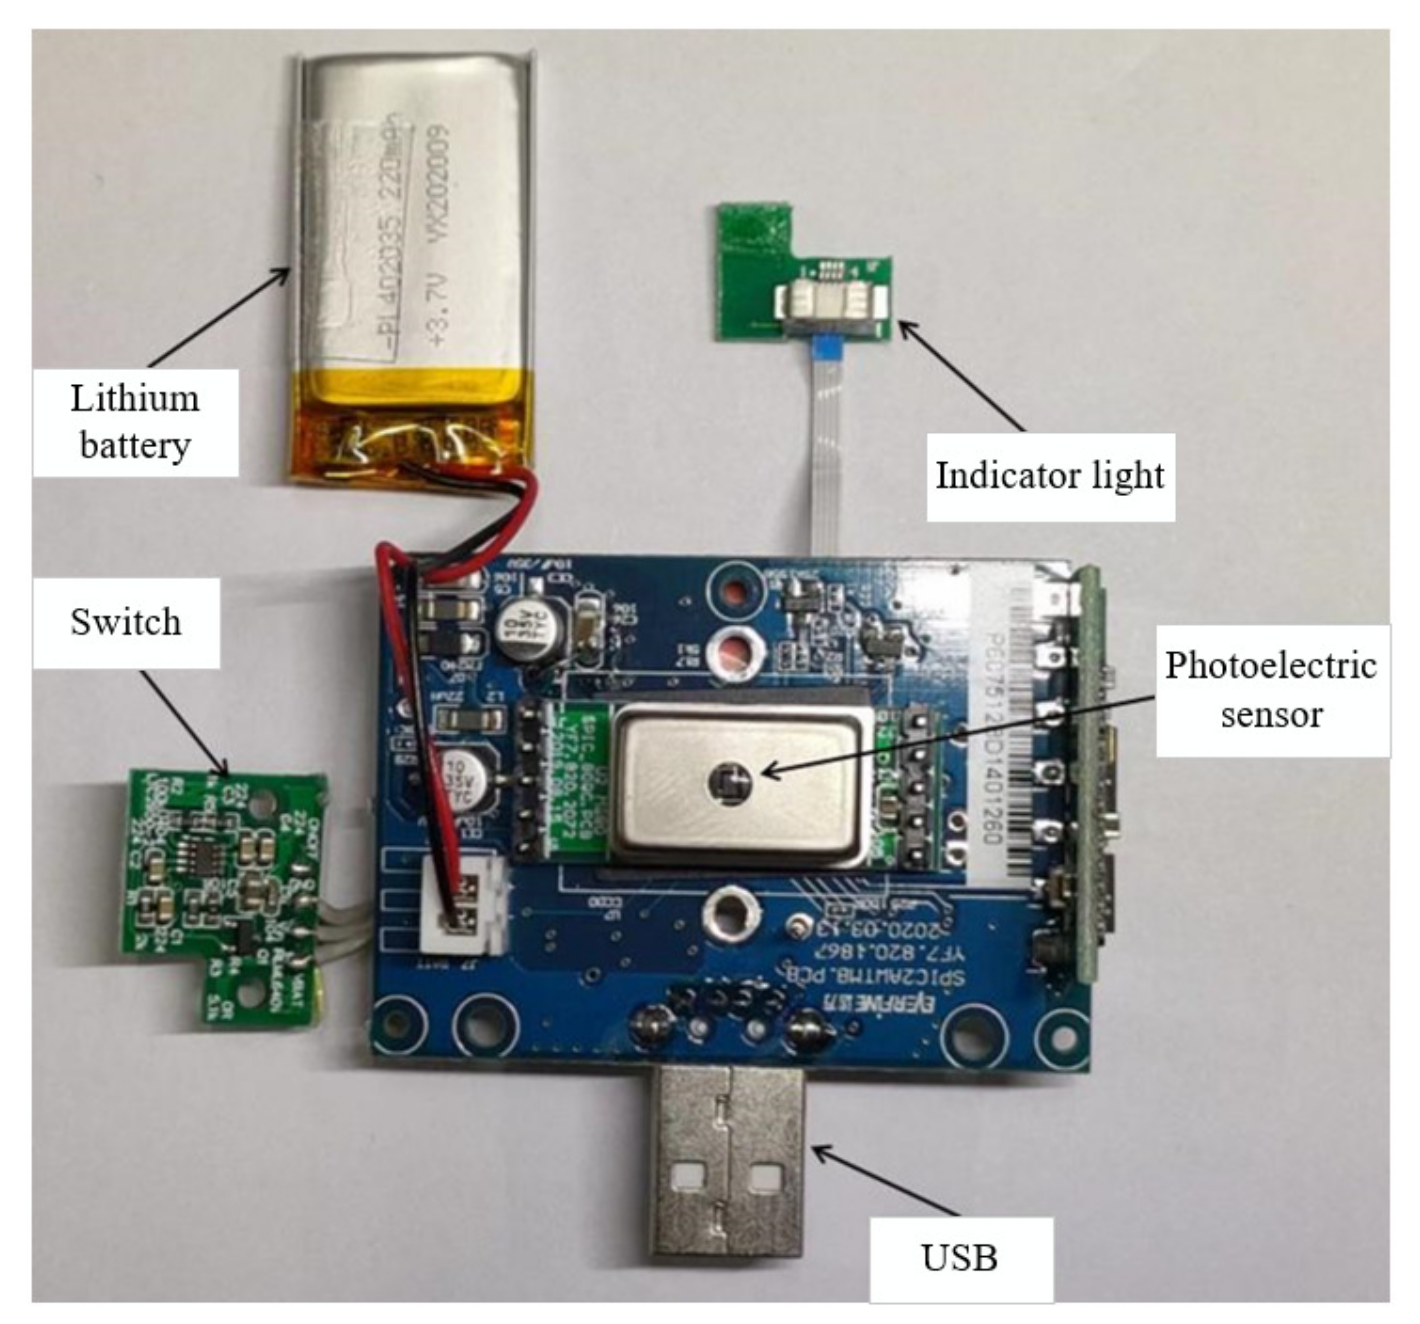
2.2.1. Spectrum Acquisition Module
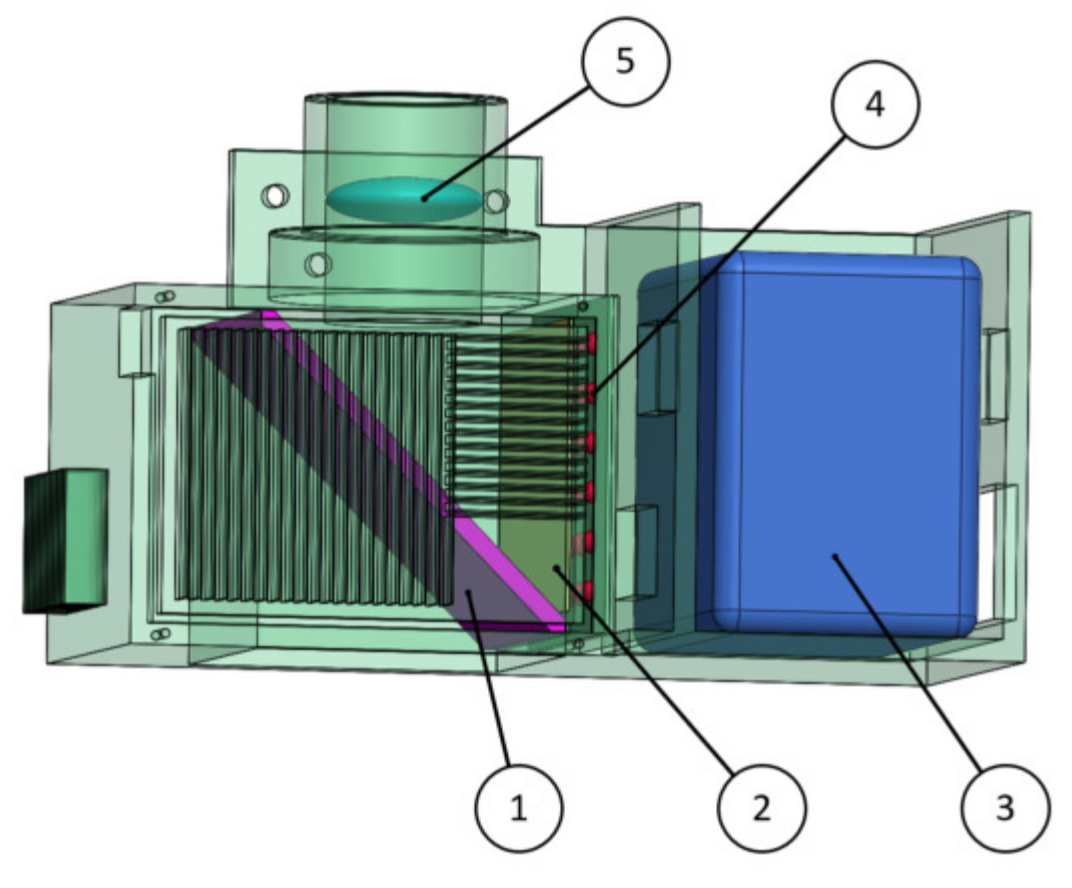
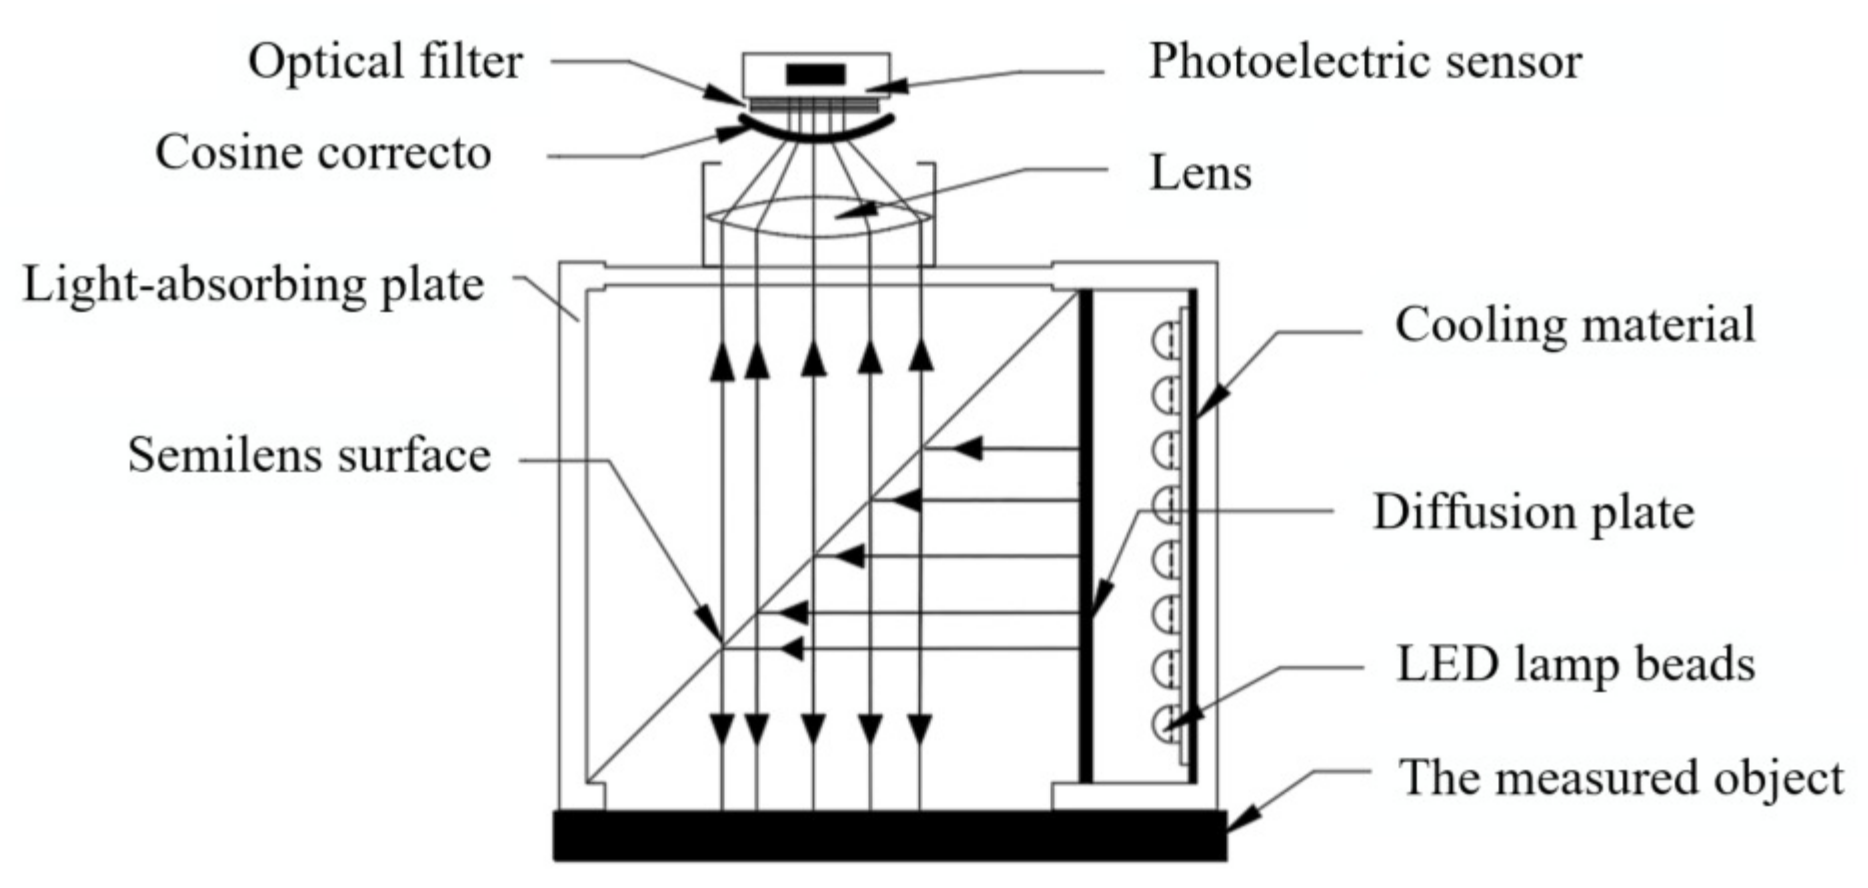
2.2.2. Light Source Module
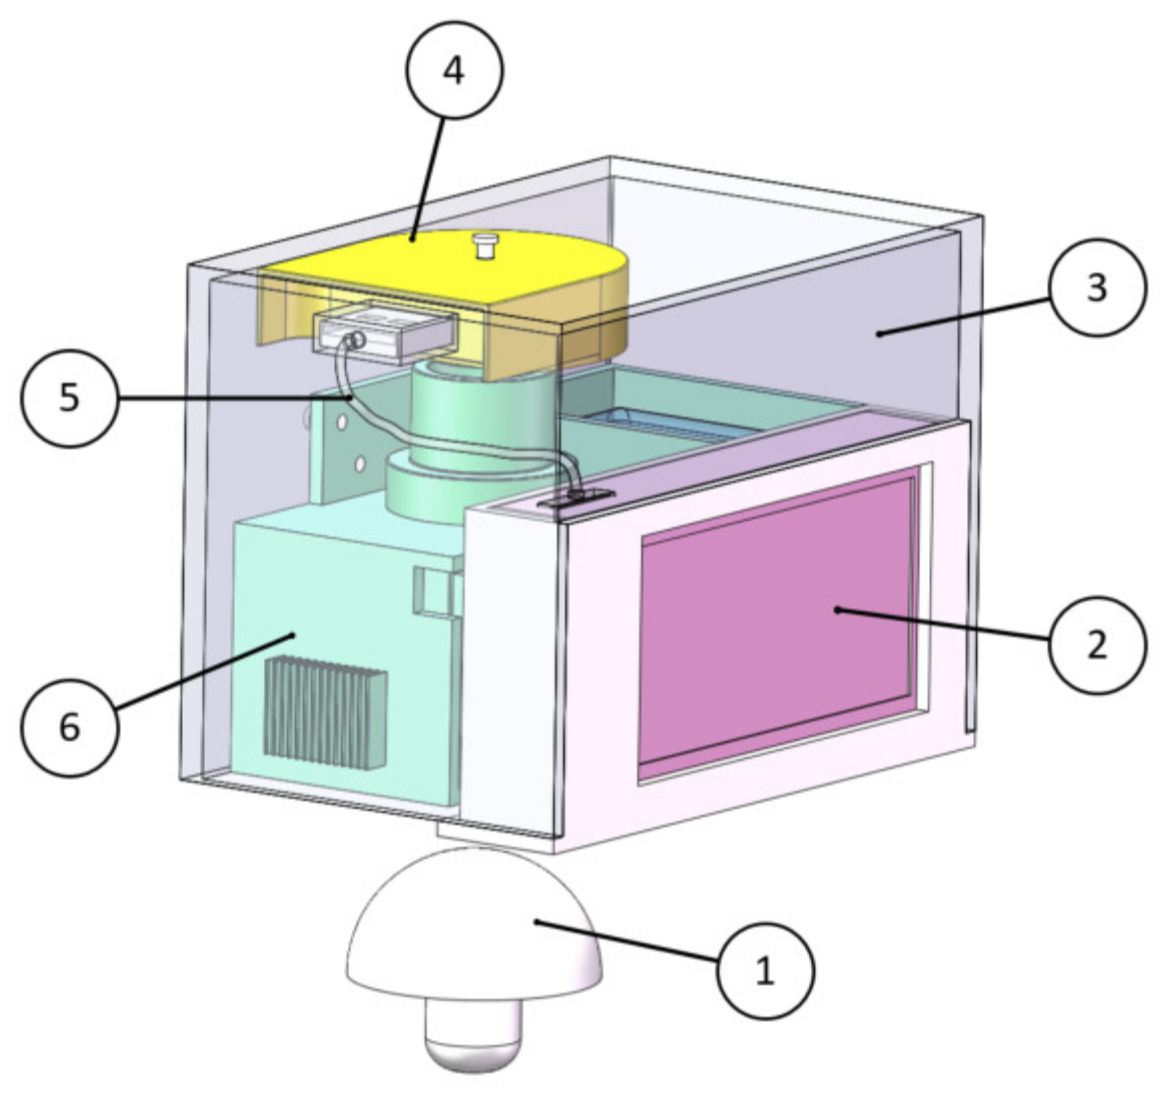
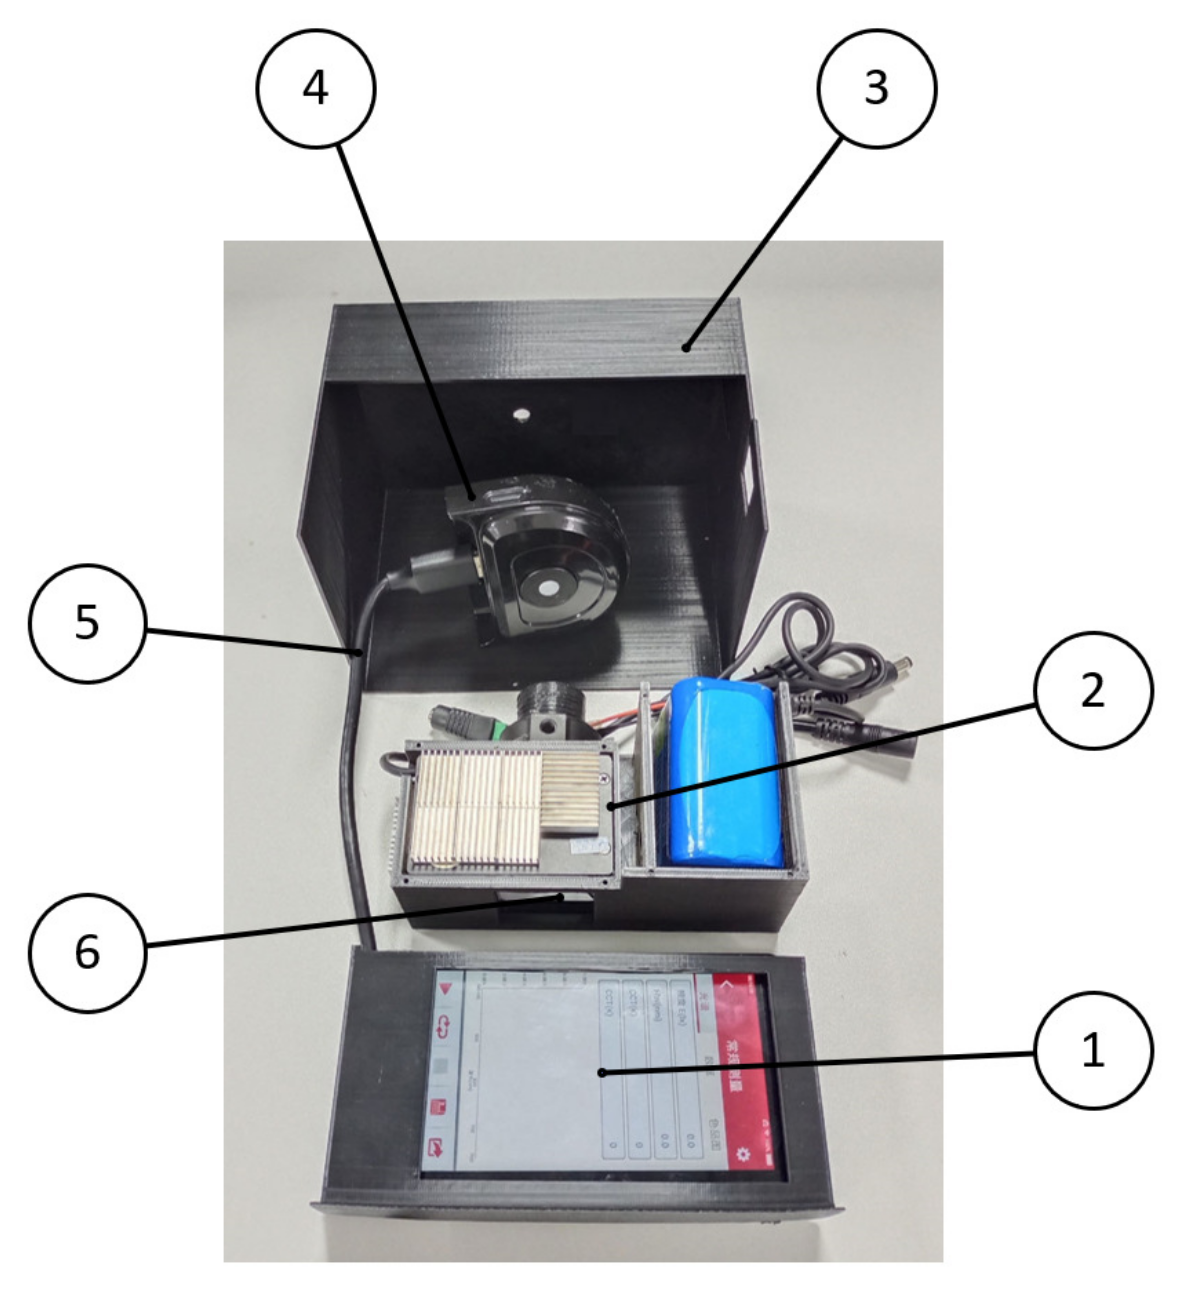
2.2.3. Device Integration
2.3. Spectrum Acquisition, Calibration and Preprocessing
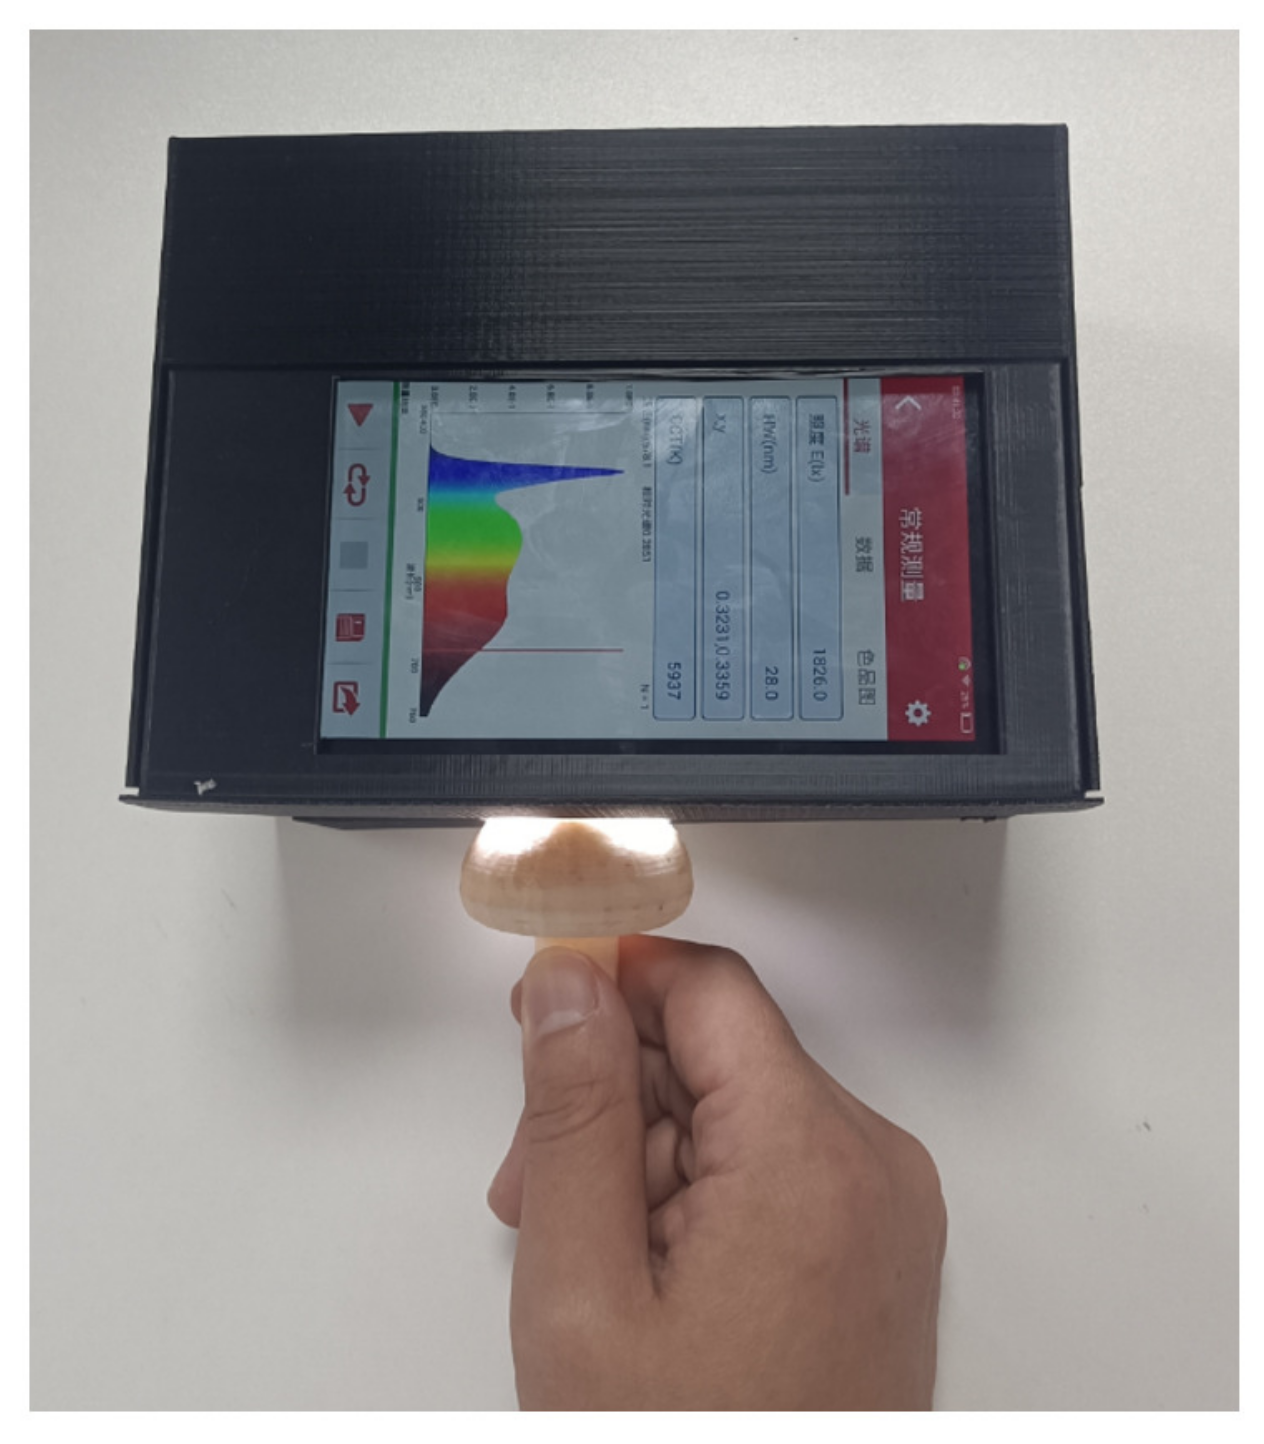
2.3.1. Spectrum Acquisition
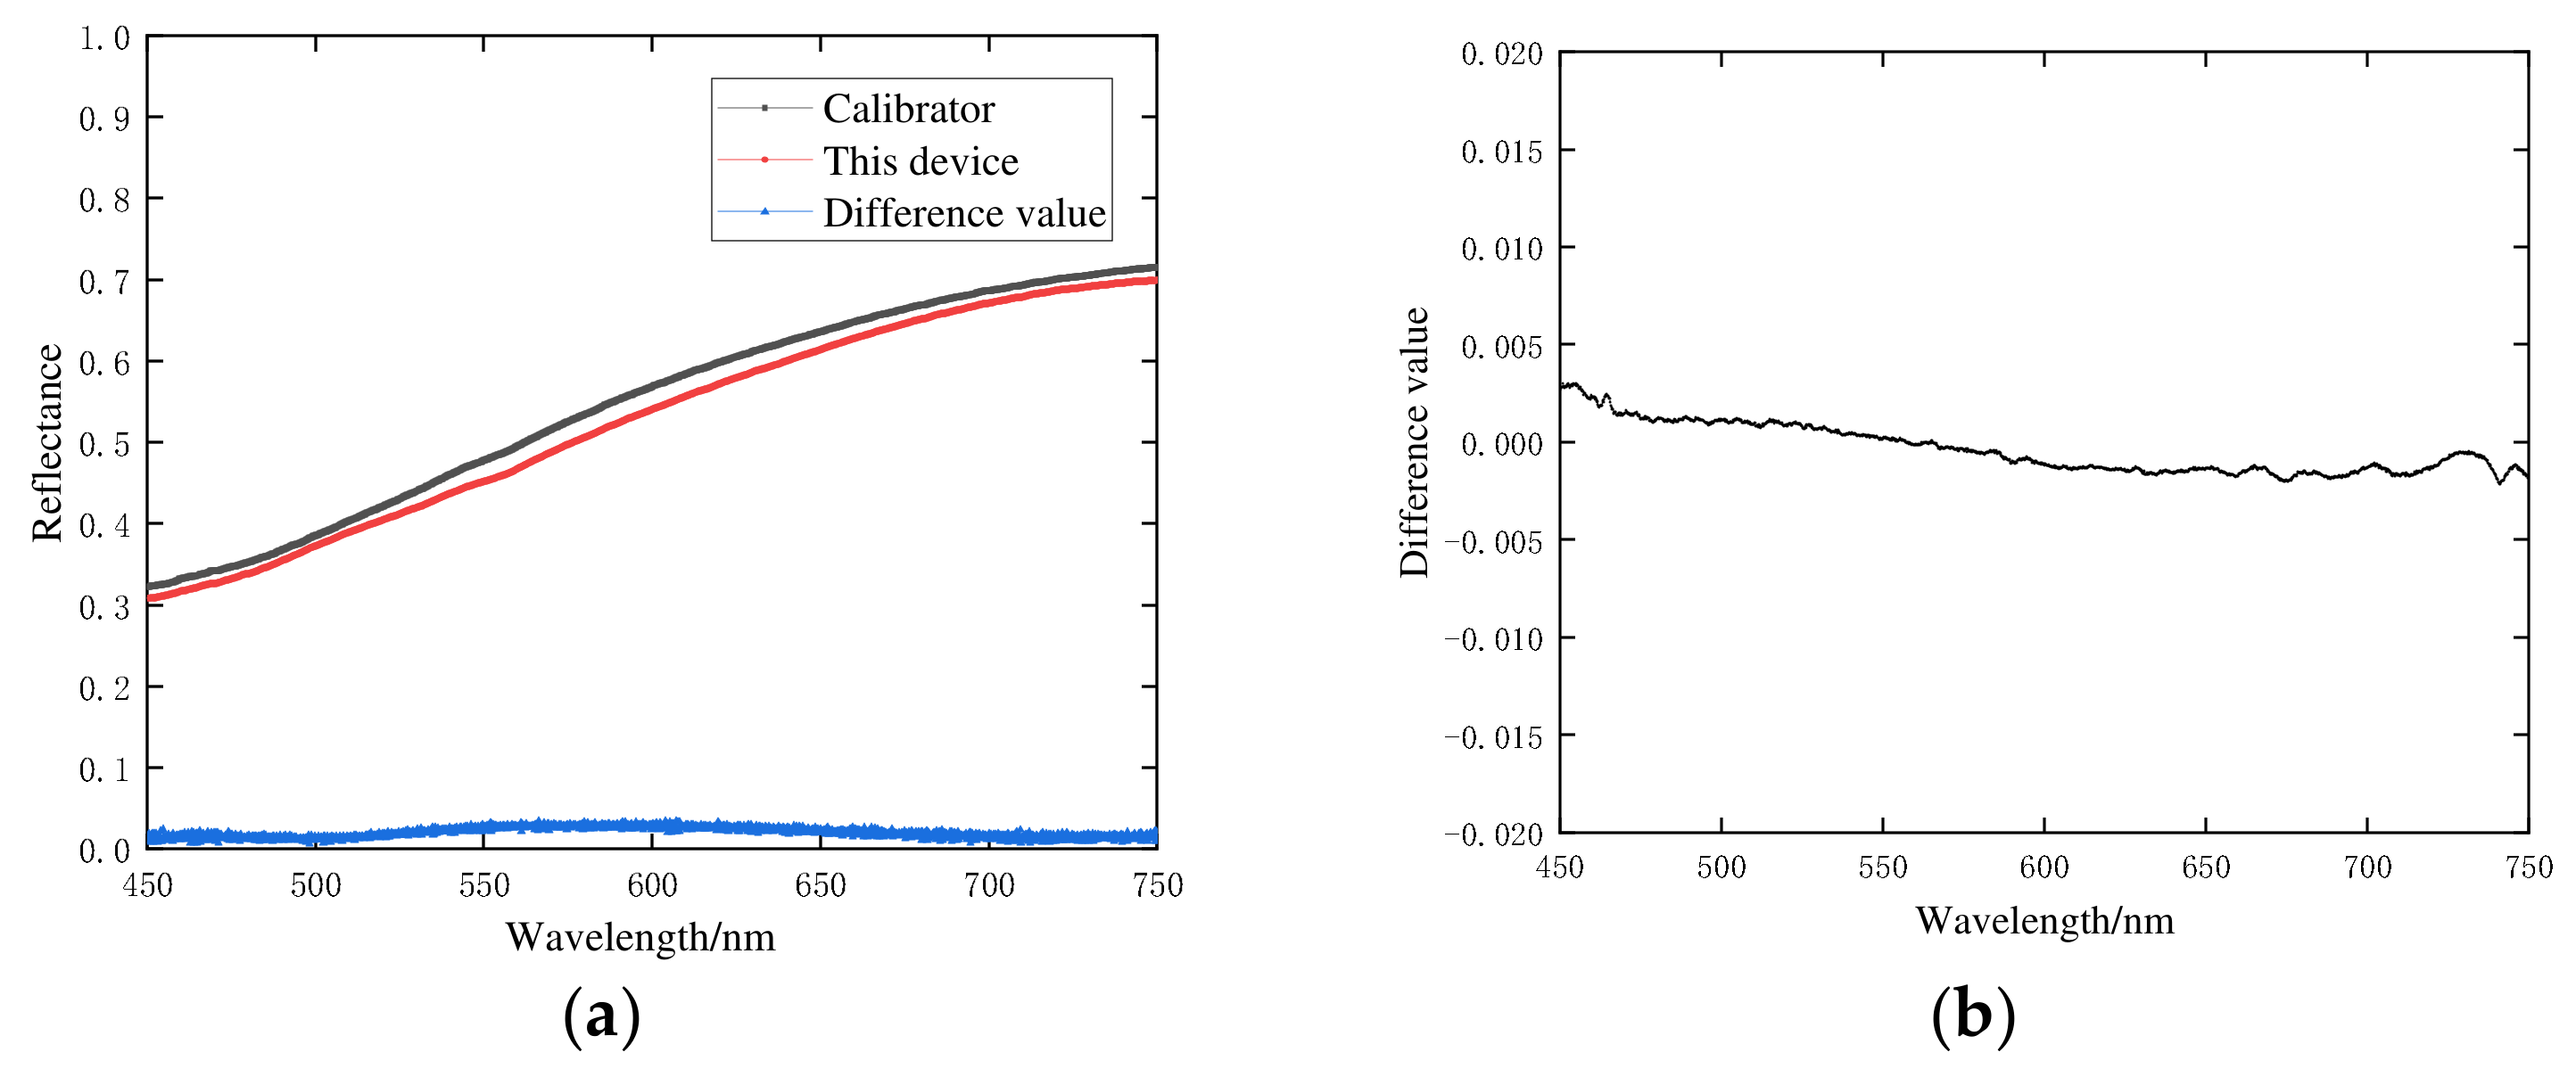
2.3.2. Spectral Calibration
2.3.3. Spectral Preprocessing
2.4. Dimensionality Reduction Method
2.4.1. Successive Projections Algorithm
2.4.2. Principal Component Analysis
2.5. Moisture Content Detection Method
2.5.1. BP Neural Network
2.5.2. Partial LEAST Squares Regression
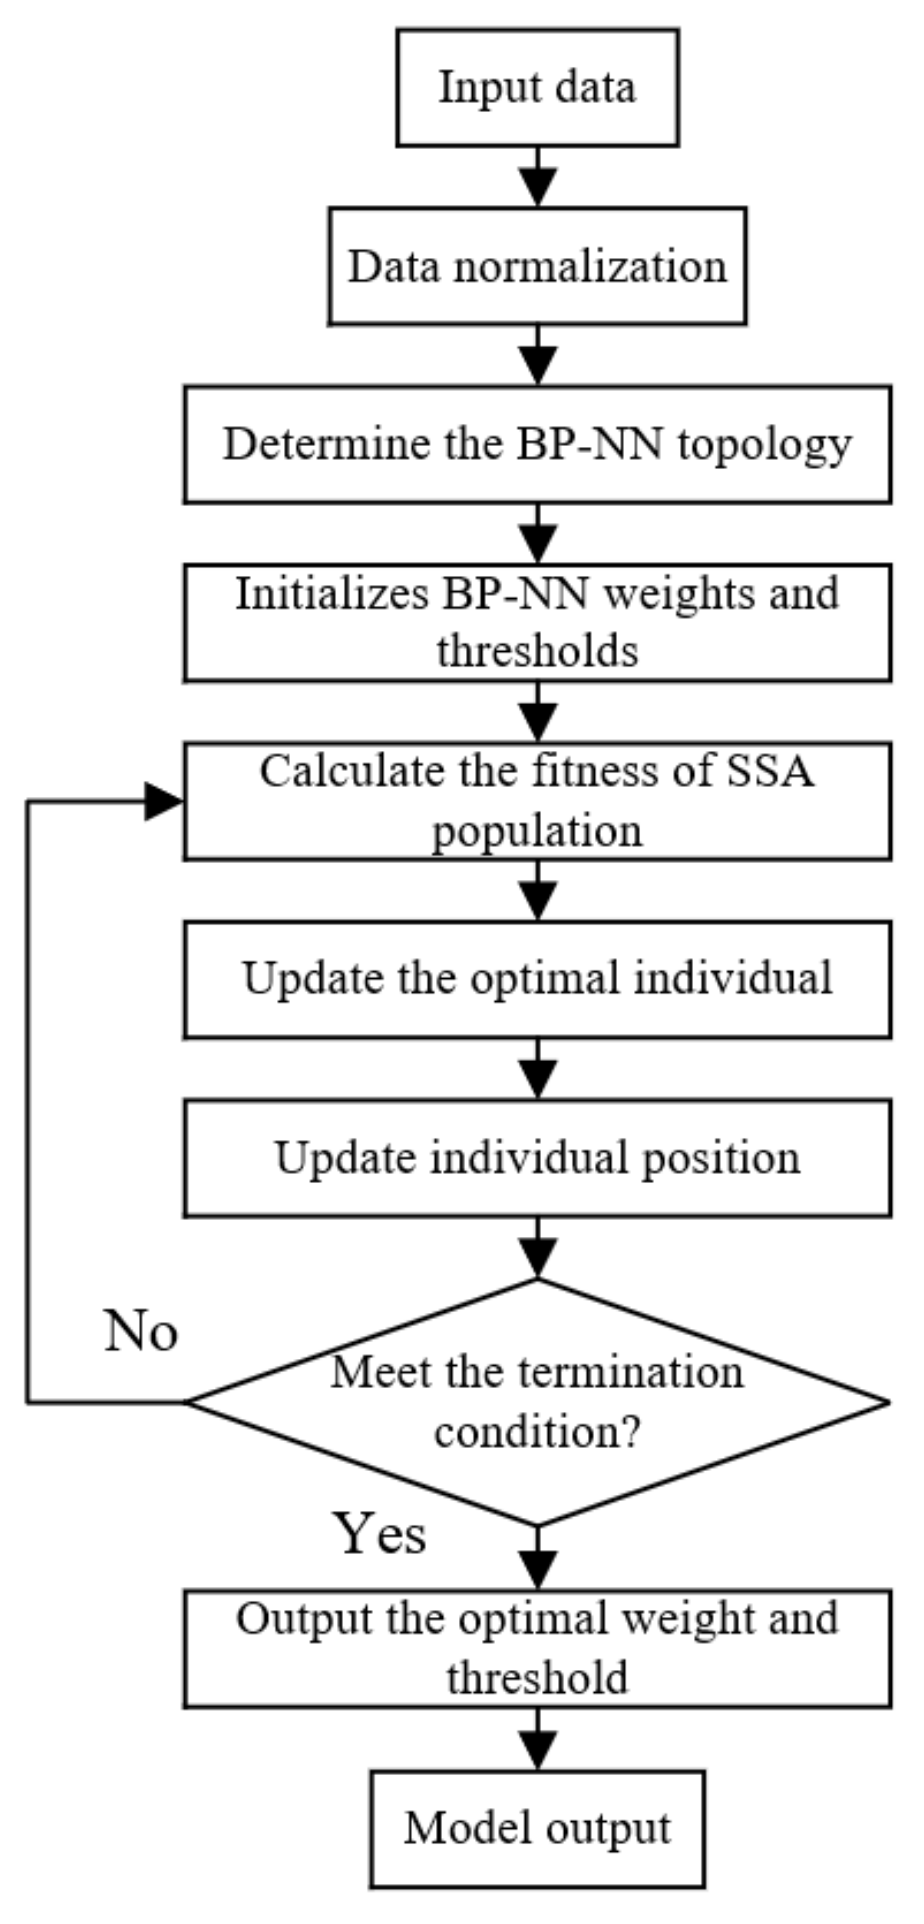
2.5.3. Optimization Algorithm
2.6. Whiteness Detection Method
3. Results
3.1. Calibration and Preprocessing Results
3.1.1. Calibration Results
3.1.2. Preprocessing Results
3.2. Dimensionality Reduction Results
3.2.1. SPA Results
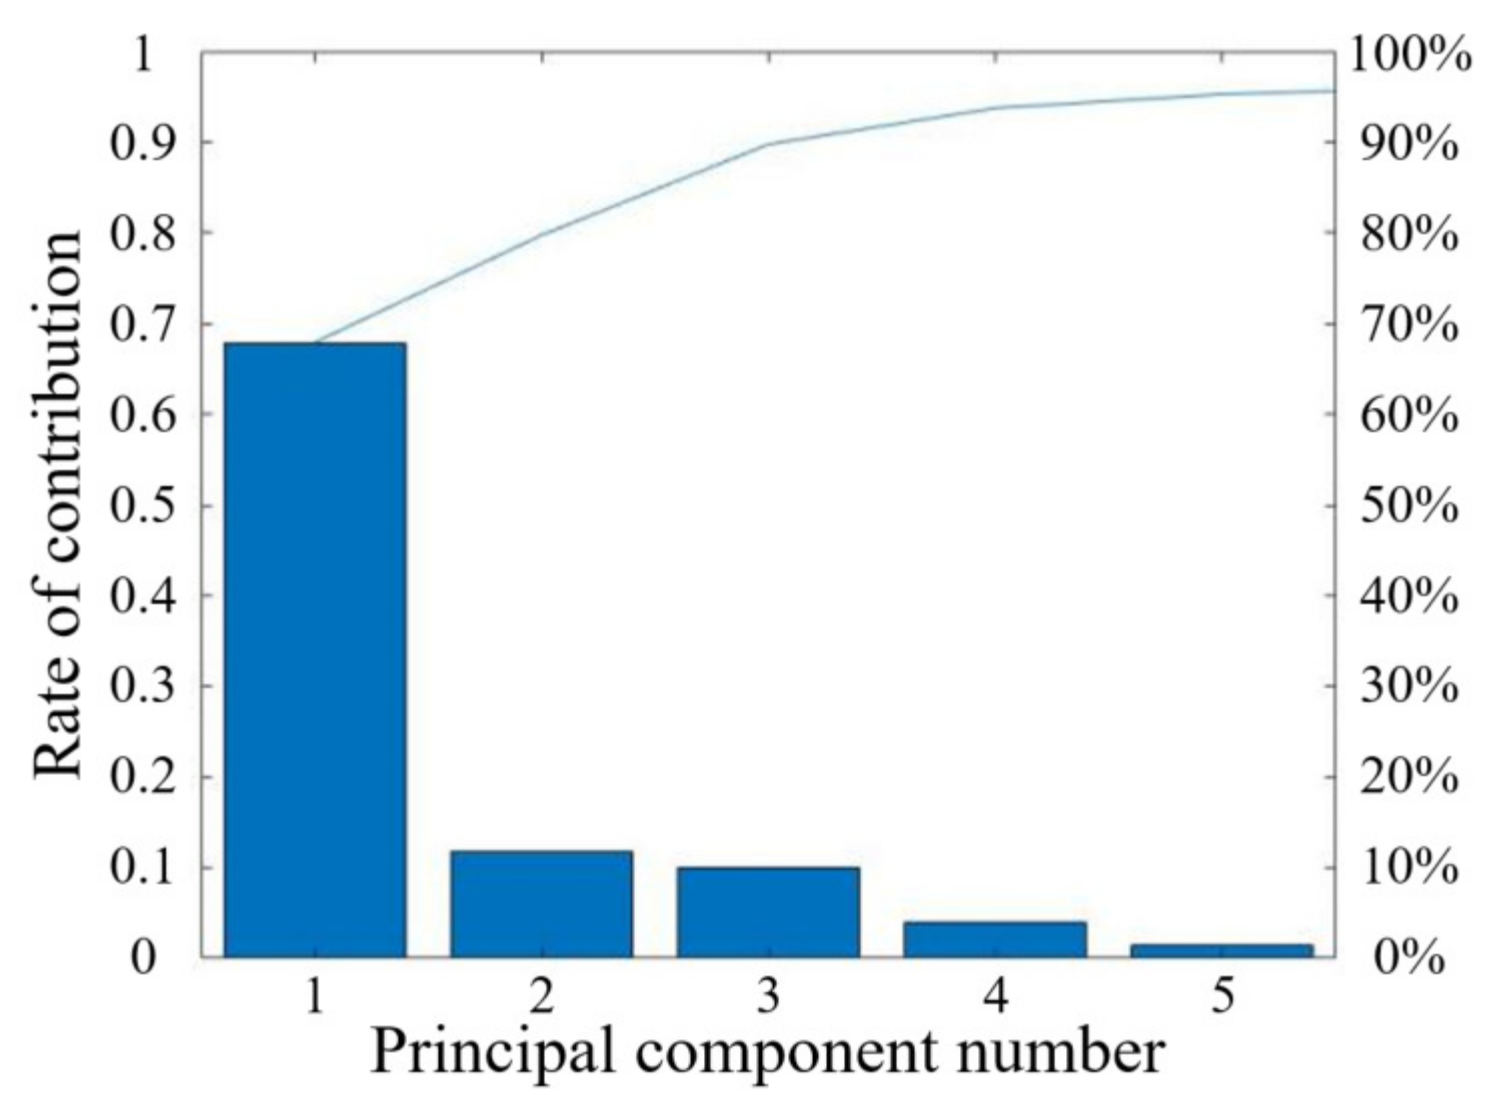
3.2.2. PCA Results
3.3. The Test Results of the Moisture Content
3.3.1. Predicted Results of Moisture Content
3.3.2. The Result of Optimization
3.4. The Results of Whiteness Test
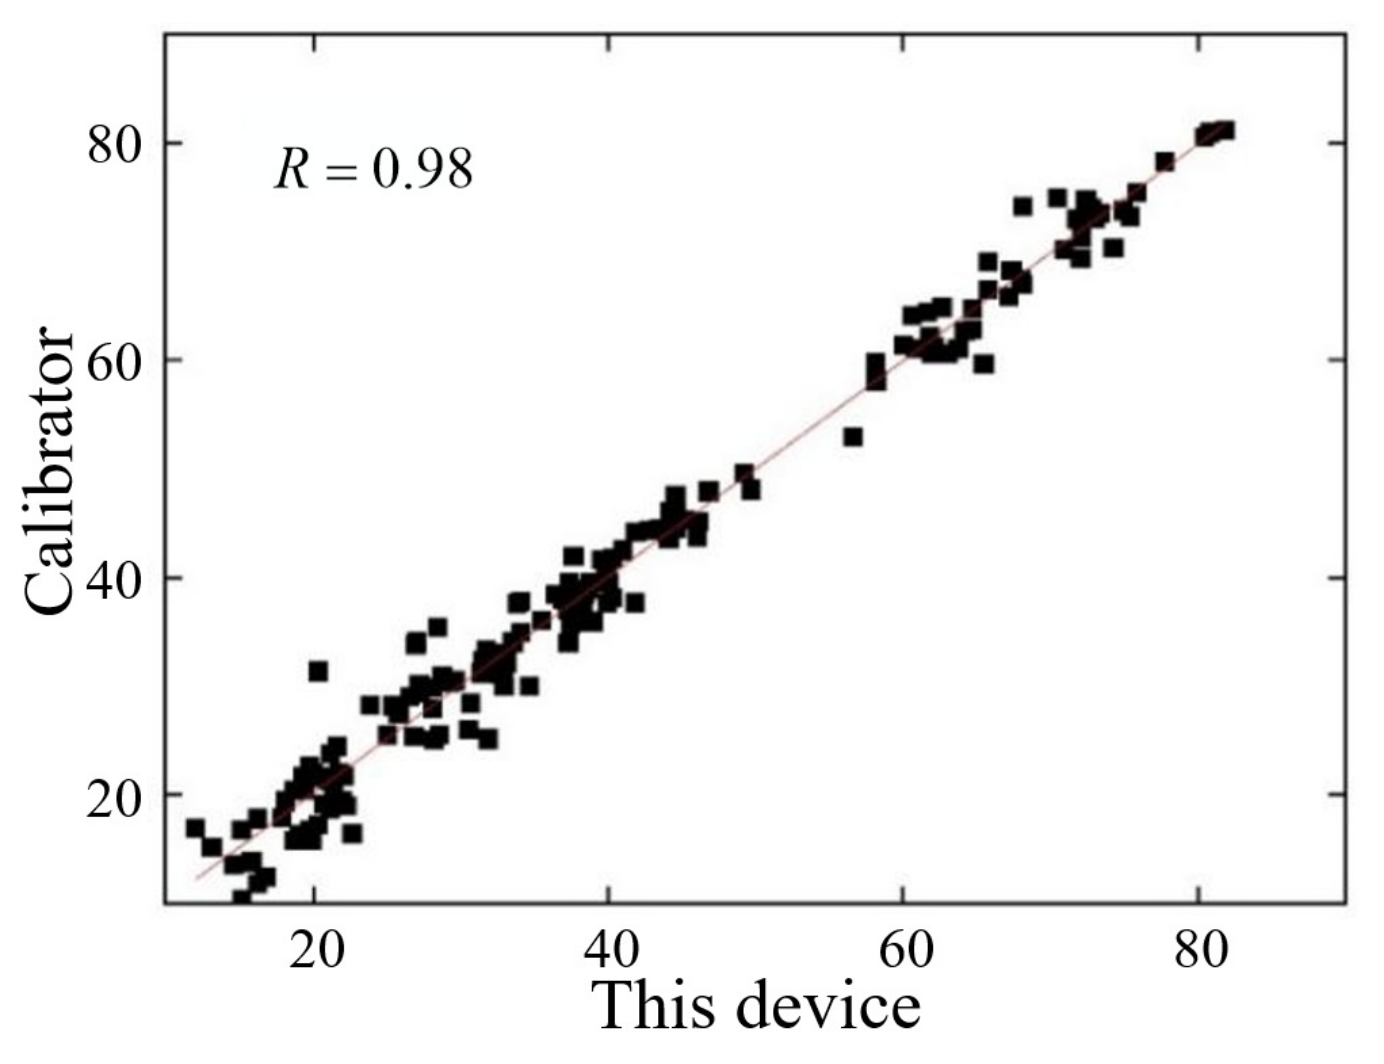
3.4.1. Correlation Analysis of the Whiteness of Agaricus bisporus
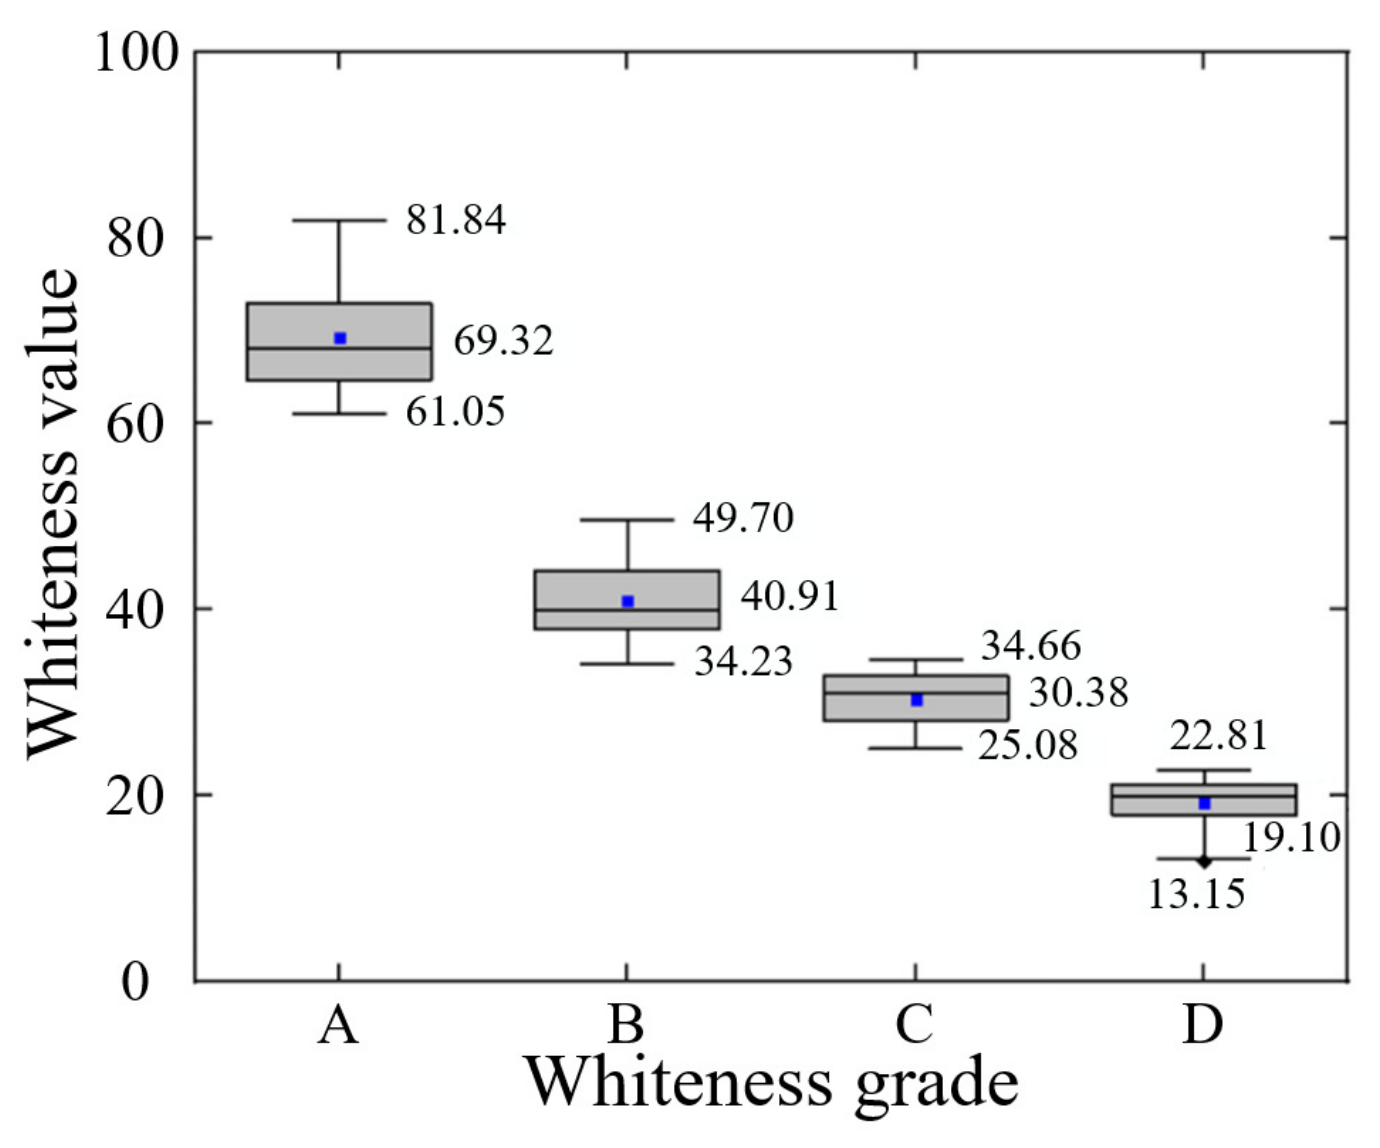
3.4.2. Whiteness Grading Results of Agaricus bisporus
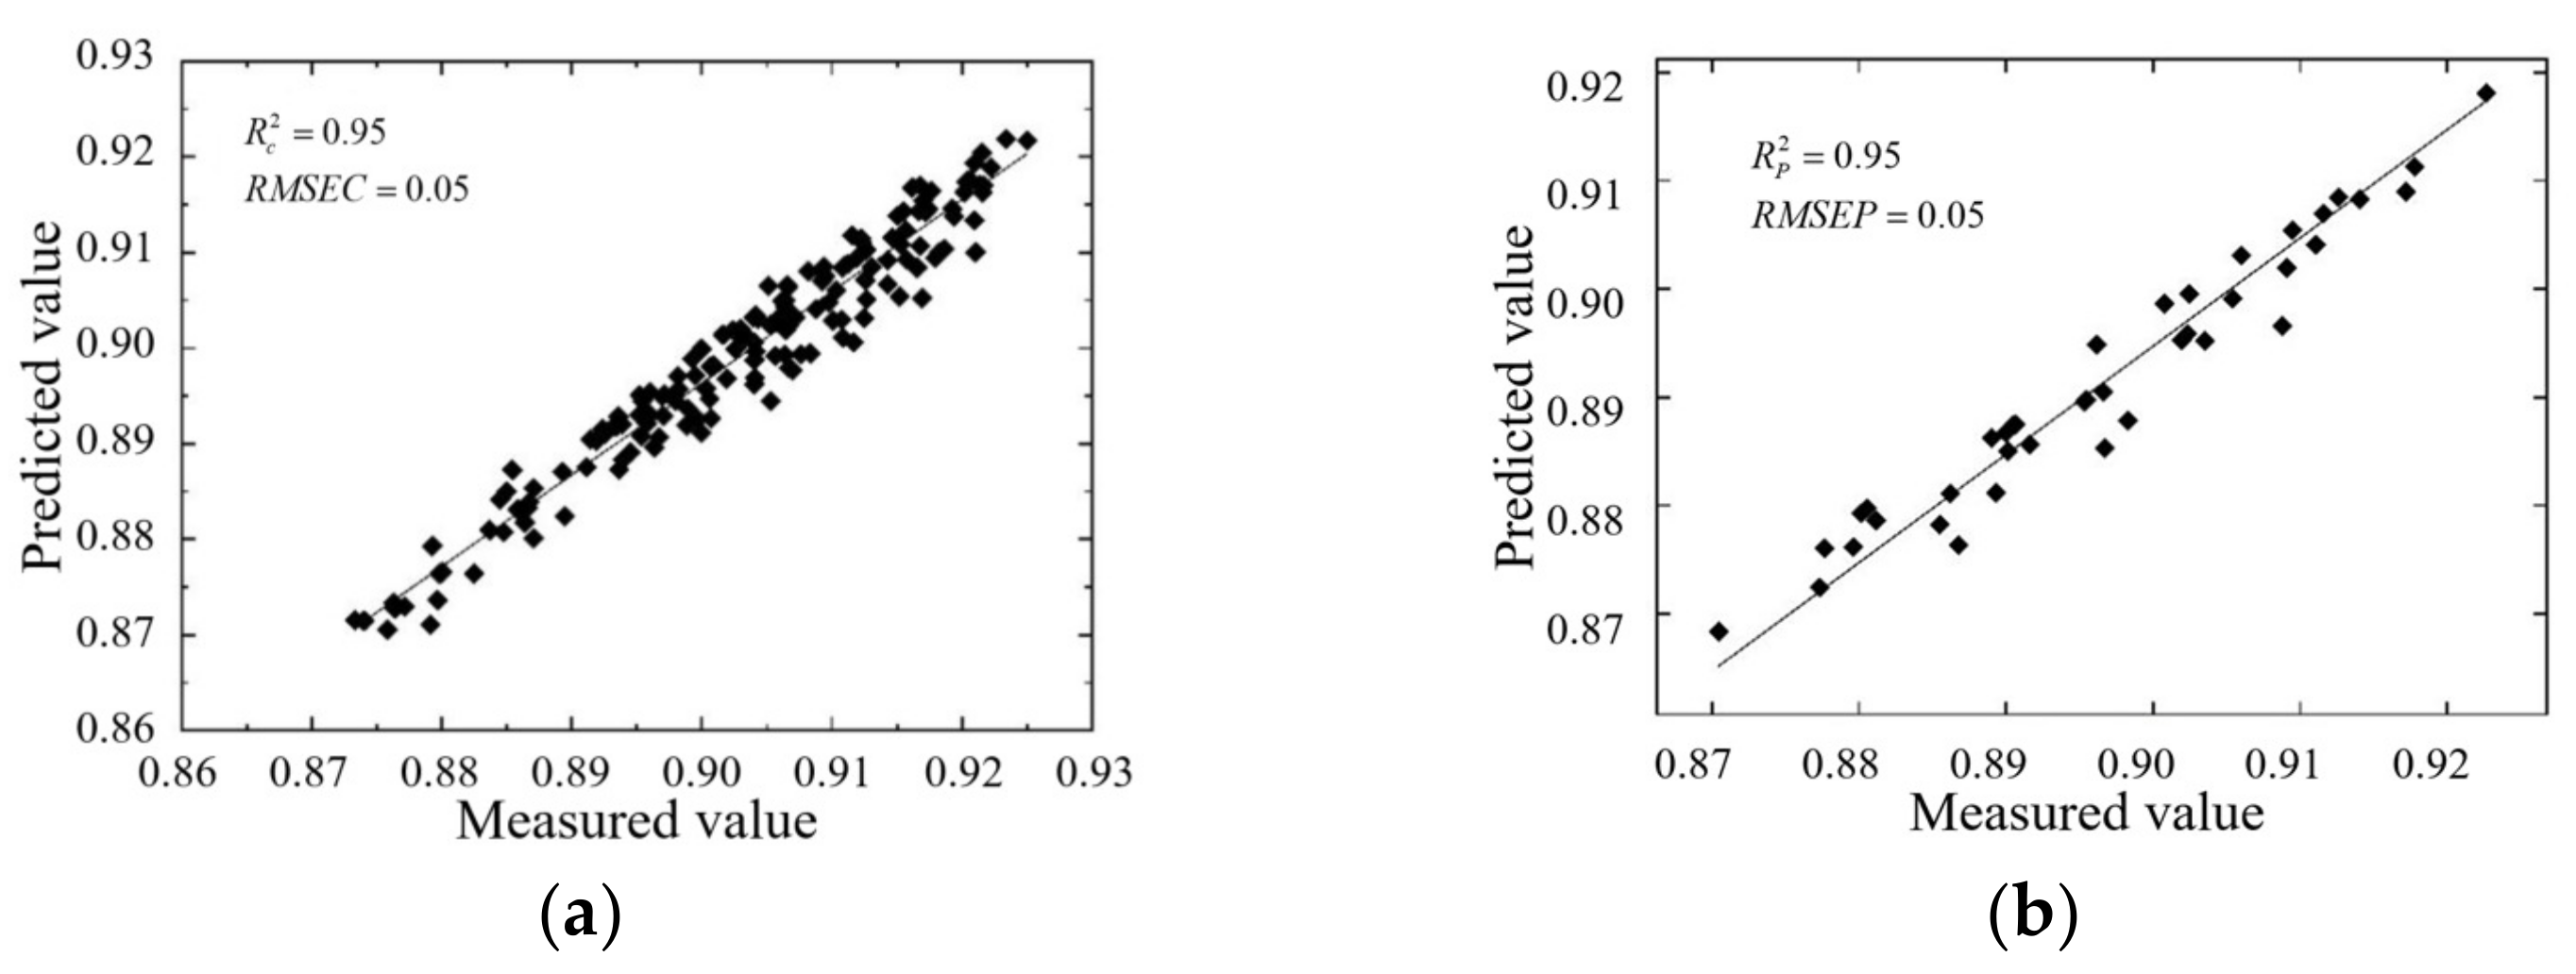
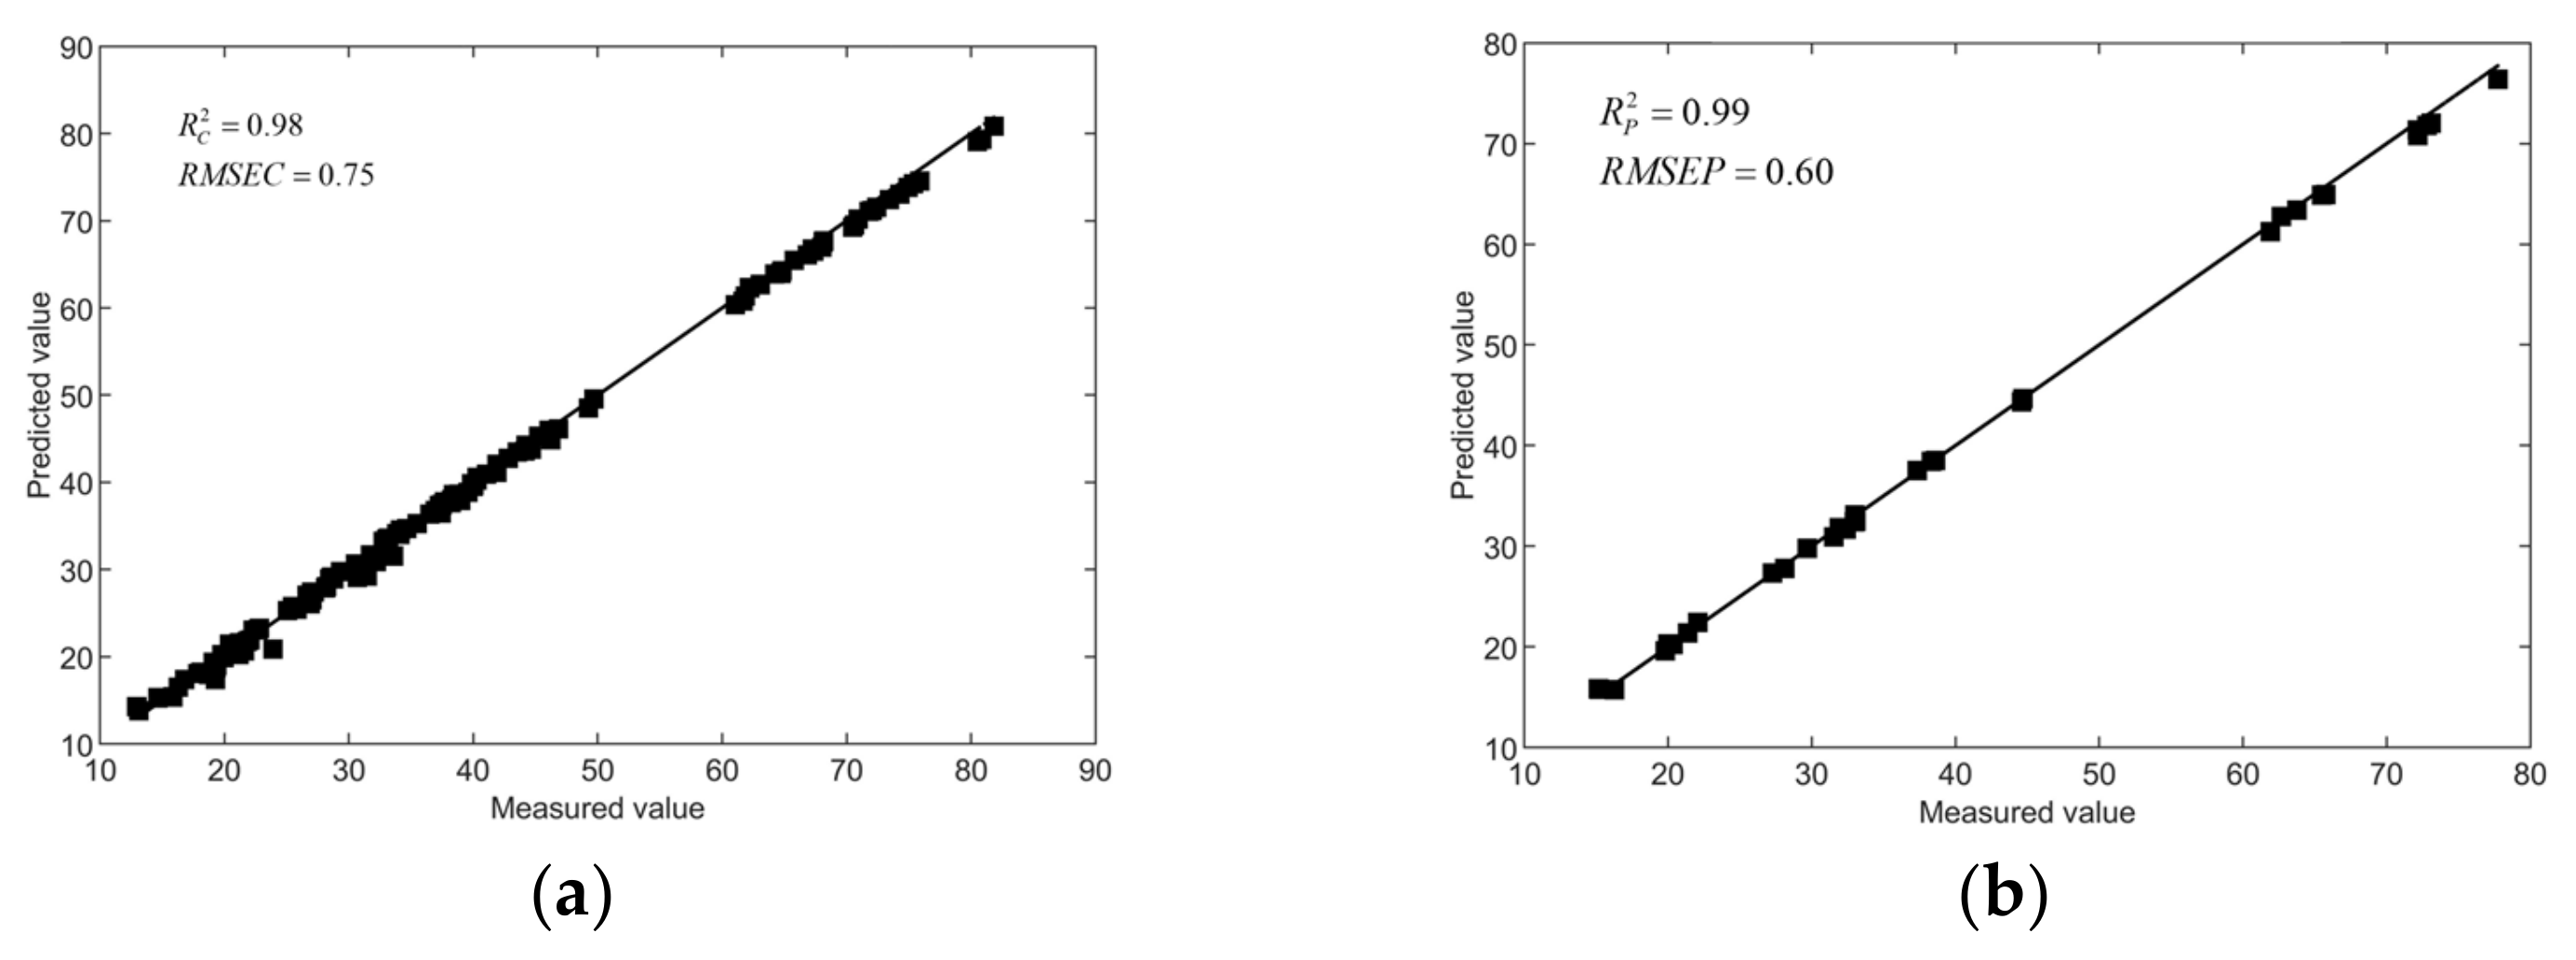
3.4.3. The result of the whiteness prediction model
4. Discussion
4.1. Comparison of Related Studies
4.2. Error Analysis
- (1)
- The spectral calibration of the device is based on the Ocean spectrometer, and the Ocean spectrometer itself has errors, so the research device will inevitably have prediction errors.
- (2)
- To reduce the complexity of feature extraction, not all features are used as input variables, and some features are discarded, which will produce prediction errors.
- (3)
- The limited number of samples leads to errors caused by the inaccuracy of the model training results.
- (4)
- Random errors caused by unprofessional operation in the process of experimental operation.
- (5)
- This device uses LED lamp beads instead of a D65 standard light source, so a measurement error will be generated.
5. Conclusions
Author Contributions
Funding
Data Availability Statement
Conflicts of Interest
References
- Chang, S.T.; Wasser, S.P. The cultivation and environmental impact of mushrooms. In Oxford Research Encyclopedia of Environmental Science; Oxford University Press: Oxford, UK, 2017. [Google Scholar]
- Ramos, M.; Burgos, N.; Barnard, A.; Evans, G.; Preece, J.; Graz, M.; Ruthes, A.C.; Jimenez-Quero, A.; Martinez-Abad, A.; Vilaplana, F.; et al. Agaricus bisporus and its by-products as a source of valuable extracts and bioactive compounds. Food Chem. 2019, 292, 176–187. [Google Scholar] [CrossRef] [PubMed] [Green Version]
- Yin, H.; Yi, W.L.; Hu, D.M. Computer vision and machine learning applied in the mushroom industry: A critical review. Comput. Electron. Agric. 2022, 198, 107015. [Google Scholar] [CrossRef]
- Lin, X.H.; Sun, D.W. Research advances in browning of button mushroom (Agaricus bisporus): Affecting factors and controlling methods. Trends Food Sci. Technol. 2019, 90, 63–75. [Google Scholar] [CrossRef]
- Lin, H.; Jiang, H.; Lin, J.J.; Chen, Q.S.; Ali, S.; Teng, S.W.; Zuo, M. Rice Freshness Identification Based on Visible Near-Infrared Spectroscopy and Colorimetric Sensor Array. Food Anal. Methods 2021, 14, 1305–1314. [Google Scholar] [CrossRef]
- Tan, B.H.; You, W.H.; Huang, C.X.; Xiao, T.F.; Tian, S.A.; Luo, L.N.; Xiong, N.X. An Intelligent Near-Infrared Diffuse Reflectance Spectroscopy Scheme for the Non-Destructive Testing of the Sugar Content in Cherry Tomato Fruit. Electronics 2022, 11, 3504. [Google Scholar] [CrossRef]
- Zhang, J.; Li, M.; Pan, T.; Yao, L.; Chen, J. Purity analysis of multi-grain rice seeds with non-destructive visible and near-infrared spectroscopy. Comput. Electron. Agric. 2019, 164, 104882. [Google Scholar] [CrossRef]
- Hasanzadeh, B.; Abbaspour-Gilandeh, Y.; Soltani-Nazarloo, A.; De la Cruz-Gamez, E.; Hernandez-Hernandez, J.L.; Martinez-Arroyo, M. Non-Destructive Measurement of Quality Parameters of Apple Fruit by Using Visible/Near-Infrared Spectroscopy and Multivariate Regression Analysis. Sustainability 2022, 14, 14918. [Google Scholar] [CrossRef]
- Yun, L.; Qing-Wei, P.; Jian-Cheng, Y.; Yan-Lin, T. Identification of tea based on CARS-SWR variable optimization of visible/near-infrared spectrum. J. Sci. Food Agric. 2020, 100, 371–375. [Google Scholar] [CrossRef]
- Wang, J.; Shen, C.W.; Liu, N.; Jin, X.; Fan, X.S.; Dong, C.X.; Xu, Y.C. Non-Destructive Evaluation of the Leaf Nitrogen Concentration by in-Field Visible/Near-Infrared Spectroscopy in Pear Orchards. Sensors 2017, 17, 538. [Google Scholar] [CrossRef] [Green Version]
- Mollazade, K. Non-destructive Identifying Level of Browning Development in Button Mushroom (Agaricus bisporus) Using Hyperspectral Imaging Associated with Chemometrics. Food Anal. Methods 2017, 10, 2743–2754. [Google Scholar] [CrossRef]
- Lin, X.H.; Xu, J.L.; Sun, D.W. Investigation of moisture content uniformity of microwave-vacuum dried mushroom (Agaricus bisporus) by NIR hyperspectral imaging. Lwt-Food Sci. Technol. 2019, 109, 108–117. [Google Scholar] [CrossRef]
- Baskar, C.; Nesakumar, N.; Kesavan, S.; Rayappan, J.B.B.; Alwarappan, S. ATR-FTIR as a versatile analytical tool for the rapid determination of storage life of fresh Agaricus bisporus via its moisture content. Postharvest Biol. Technol. 2019, 154, 159–168. [Google Scholar] [CrossRef]
- Parrag, V.; Felfoldi, J.; Baranyai, L.; Getsel, A.; Firtha, F. Early Detection of Cobweb Disease Infection on Agaricus bisporus Sporocarps Using Hyperspectral Imaging. Acta Aliment. 2014, 43, 107–113. [Google Scholar] [CrossRef] [Green Version]
- Xiao, K.P.; Liu, Q.; Wang, L.Q.; Zhang, B.; Zhang, W.; Yang, W.J.; Hu, Q.H.; Pei, F. Prediction of soluble solid content of Agaricus bisporus during ultrasound-assisted osmotic dehydration based on hyperspectral imaging. Lwt-Food Sci. Technol. 2020, 122, 109030. [Google Scholar] [CrossRef]
- Su, W.H.; Slaughter, D.C.; Fennimore, S.A. Non-destructive evaluation of photostability of crop signaling compounds and dose effects on celery vigor for precision plant identification using computer vision. Comput. Electron. Agric. 2020, 168, 105155. [Google Scholar] [CrossRef]
- Fan, S.X.; Wang, Q.Y.; Tian, X.; Yang, G.Y.; Xia, Y.; Li, J.B.; Huang, W.Q. Non-destructive evaluation of soluble solids content of apples using a developed portable Vis/NIR device. Biosyst. Eng. 2020, 193, 138–148. [Google Scholar] [CrossRef]
- Mireei, S.A.; Bagheri, R.; Sadeghi, M.; Shahraki, A. Developing an electronic portable device based on dielectric power spectroscopy for non-destructive prediction of date moisture content. Sens. Actuators A-Phys. 2016, 247, 289–297. [Google Scholar] [CrossRef]
- Jie, D.F.; Wei, X. Review on the recent progress of non-destructive detection technology for internal quality of watermelon. Comput. Electron. Agric. 2018, 151, 156–164. [Google Scholar] [CrossRef]
- Sadeghi, M.; Behnia, F.; Amiri, R. Window Selection of the Savitzky–Golay Filters for Signal Recovery from Noisy Measurements. IEEE Trans. Instrum. Meas. 2020, 69, 5418–5427. [Google Scholar] [CrossRef]
- Vu, T.; Riekeberg, E.; Qiu, Y.; Powers, R. Comparing normalization methods and the impact of noise. Metabolomics 2018, 14, 1–10. [Google Scholar] [CrossRef]
- Wang, Q.; Liu, Y.; Xu, Q.; Feng, J.; Yu, H. Identification of mildew degrees in honeysuckle using hyperspectral imaging combined with variable selection. J. Food Meas. Charact. 2019, 13, 2157–2166. [Google Scholar] [CrossRef]
- Wu, Y.; Peng, S.; Xie, Q.; Han, Q.; Zhang, G.; Sun, H. An improved weighted multiplicative scatter correction algorithm with the use of variable selection: Application to near-infrared spectra. Chemom. Intell. Lab. Syst. 2019, 185, 114–121. [Google Scholar] [CrossRef]
- Soares, S.F.C.; Gomes, A.A.; Araujo, M.C.U.; Galvão Filho, A.R.; Galvão, R.K.H. The successive projections algorithm. TrAC Trends Anal. Chem. 2013, 42, 84–98. [Google Scholar] [CrossRef]
- Kherif, F.; Latypova, A. Principal component analysis. In Machine Learning; Elsevier: Amsterdam, The Netherlands, 2020; pp. 209–225. [Google Scholar]
- Sun, Y.; Liu, Y.; Yu, H.; Xie, A.; Li, X.; Yin, Y.; Duan, X. Non-destructive prediction of moisture content and freezable water content of purple-fleshed sweet potato slices during drying process using hyperspectral imaging technique. Food Anal. Methods 2017, 10, 1535–1546. [Google Scholar] [CrossRef]
- Li, J.; Cheng, J.-H.; Shi, J.-Y.; Huang, F. Brief introduction of back propagation (BP) neural network algorithm and its improvement. In Advances in Computer Science and Information Engineering: Volume 2; Springer: Berlin/Heidelberg, Germany, 2012; pp. 553–558. [Google Scholar]
- Abdi, H. Partial least square regression (PLS regression). Encycl. Res. Methods Soc. Sci. 2003, 6, 792–795. [Google Scholar]
- Gharehchopogh, F.S.; Namazi, M.; Ebrahimi, L.; Abdollahzadeh, B. Advances in sparrow search algorithm: A comprehensive survey. Arch. Comput. Methods Eng. 2023, 30, 427–455. [Google Scholar] [CrossRef]
- Araújo, M.C.U.; Saldanha, T.C.B.; Galvao, R.K.H.; Yoneyama, T.; Chame, H.C.; Visani, V. The successive projections algorithm for variable selection in spectroscopic multicomponent analysis. Chemom. Intell. Lab. Syst. 2001, 57, 65–73. [Google Scholar] [CrossRef]
- Giovenzana, V.; Tugnolo, A.; Casson, A.; Guidetti, R.; Beghi, R. Application of visible-near infrared spectroscopy to evaluate the quality of button mushrooms. J. Near Infrared Spectrosc. 2019, 27, 38–45. [Google Scholar] [CrossRef]
- Gowen, A.; O’donnell, C.; Taghizadeh, M.; Gaston, E.; O’gorman, A.; Cullen, P.; Frias, J.; Esquerre, C.; Downey, G. Hyperspectral imaging for the investigation of quality deterioration in sliced mushrooms (Agaricus bisporus) during storage. Sens. Instrum. Food Qual. Saf. 2008, 2, 133–143. [Google Scholar] [CrossRef]
- Zhao, K.X.; Zhang, M.K.; Ji, J.T.; Sun, J.W.; Ma, H. Whiteness measurement of Agaricus bisporus based on image processing and color calibration model. J. Food Meas. Charact. 2022, 17, 2152–2161. [Google Scholar] [CrossRef]

| Whiteness Grade | Characteristic |
|---|---|
| Level 1 | Pure white, no brown spots |
| Level 2 | White with slight brown spots |
| Level 3 | Milky white with brown spots |
| Level 4 | Yellowish brown with numerous brown spots |
| Modeling Method | Training Set | Prediction Set | ||
|---|---|---|---|---|
| RMSEC of Moisture Content (%) | RMSEP of Moisture Content (%) | |||
| SG-BP | 0.83 | 15.38% | 0.78 | 21.42% |
| SNV-BP | 0.83 | 16.12% | 0.79 | 19.21% |
| MSC-BP | 0.84 | 15.01% | 0.80 | 18.26% |
| Normalization-BP | 0.81 | 18.13% | 0.78 | 20.35% |
| Modeling Method | Training Set | Prediction Set | ||
|---|---|---|---|---|
| RMSEC (%) | RMSEP (%) | |||
| Full-PLSR | 0.78 | 18.21% | 0.76 | 22.15% |
| Full-BP | 0.83 | 15.06% | 0.80 | 19.24% |
| SPA-BP | 0.92 | 7.23% | 0.91 | 8.07% |
| PCA-BP (5 components) | 0.89 | 9.69% | 0.91 | 8.37% |
| PCA-BP (4 components) | 0.90 | 8.74% | 0.90 | 8.62% |
| PCA-BP (3 components) | 0.90 | 8.70% | 0.90 | 9.38% |
| SPA-PLSR | 0.90 | 10.34% | 0.86 | 13.45% |
| PCA-PLSR | 0.87 | 11.26% | 0.87 | 12.17% |
| Modeling Method | Training Set | Test Set | ||
|---|---|---|---|---|
| RMSEC (%) | RMSEP (%) | |||
| SPA-BP | 0.92 | 7.23% | 0.91 | 8.07% |
| SPA-SSA-BP | 0.95 | 5.11% | 0.95 | 5.04% |
| Δ | 3% | −2.12% | 4% | −3.03% |
| Detection Technology | Detect Content | Model | R2 | RMSEP | Portable/Fixed Detection Device | Ref. |
|---|---|---|---|---|---|---|
| Significant Difference (p) | ||||||
| Visible-near infrared spectroscopy | Moisture content | SSA-SPA-BP | 0.95 | 5.11% | Portable | This work |
| Whiteness | SPA-BP | 0.99 | 0.60 | |||
| p < 0.01 | ||||||
| Near-infrared hyperspectral imaging | Moisture content | PLSR | 0.96 | 6.31% | Fixed | [12] |
| Visible-near infrared spectroscopy | Moisture content | PLSR | 0.78 | 8.81% | Portable | [31] |
| Hyperspectral imaging | Moisture content | PCR | 0.75 | 0.74% | Fixed | [32] |
| Machine vision and image processing | Whiteness | CIE-Ganz whiteness formula | p < 0.01 | Fixed | [33] | |
Disclaimer/Publisher’s Note: The statements, opinions and data contained in all publications are solely those of the individual author(s) and contributor(s) and not of MDPI and/or the editor(s). MDPI and/or the editor(s) disclaim responsibility for any injury to people or property resulting from any ideas, methods, instructions or products referred to in the content. |
© 2023 by the authors. Licensee MDPI, Basel, Switzerland. This article is an open access article distributed under the terms and conditions of the Creative Commons Attribution (CC BY) license (https://creativecommons.org/licenses/by/4.0/).
Share and Cite
Ji, J.; He, Y.; Zhao, K.; Zhang, M.; Li, M.; Li, H. Quality Information Detection of Agaricus bisporus Based on a Portable Spectrum Acquisition Device. Foods 2023, 12, 2562. https://doi.org/10.3390/foods12132562
Ji J, He Y, Zhao K, Zhang M, Li M, Li H. Quality Information Detection of Agaricus bisporus Based on a Portable Spectrum Acquisition Device. Foods. 2023; 12(13):2562. https://doi.org/10.3390/foods12132562
Chicago/Turabian StyleJi, Jiangtao, Yongkang He, Kaixuan Zhao, Mengke Zhang, Mengsong Li, and Hongzhen Li. 2023. "Quality Information Detection of Agaricus bisporus Based on a Portable Spectrum Acquisition Device" Foods 12, no. 13: 2562. https://doi.org/10.3390/foods12132562