
Effect of Herbal Feed Additives on Goat Milk Volatile Flavor Compounds

 ,
,  , , ,
, , ,  , , , ,
Abstract
:1. Introduction
2. Materials and Methods
2.1. Ethical Approval
2.2. Geographical Orientation and Animals
- Group I-20 (receiving 20 g of herbal supplement—a mix of seven herbs);
- Group I-40 (receiving 40 g of herbal supplement—a mix of seven herbs);
- Group II-20 (receiving 20 g of herbal supplement—a mix of nine herbs);
- Group II-40 (receiving 40 g of herbal supplement—a mix of nine herbs);
- Group CG (control group, no herbal supplements).
2.3. Herbal Supplements
2.4. Animal Nutrition
- A total of 20 g DM of Herbal Mix 1 (6.6 g 100 g−1 concentrate dry matter)—Group I-20;
- A total of 40 g DM of Herbal Mix 1 (13.2 g 100 g−1 concentrate dry matter)—Group I-40;
- A total of 20 g DM of Herbal Mix 2 (6.6 g 100 g−1 concentrate dry matter)—Group II-20;
- A total of 40 g DM of Herbal Mix 2 (13.2 g 100 g−1 concentrate dry matter)—Group II-40.
2.5. Determination of Fatty Acid Composition
2.6. Volatile Compounds
2.6.1. Isolation Method
2.6.2. Gas Chromatography/Mass Spectrometry
2.6.3. Data Quantitation
2.7. Sensory Evaluation of Milk Samples
2.8. Statistical Snalysis
3. Results and Discussion
3.1. Basic Chemical Composition and Hygienic–Cytological Quality of Bulk Tank Milk Samples at the 12th Week of the Experiment
3.2. Fatty Acid Profile of Bulk Tank Milk Samples
3.3. Volatile Compounds in Goat Milk
3.4. Sensory Quality of Milk
4. Conclusions
Author Contributions
Funding
Institutional Review Board Statement
Informed Consent Statement
Data Availability Statement
Conflicts of Interest
References
- Pulina, G.; Milán, M.J.; Lavín, M.P.; Theodoridis, A.; Morin, E.; Capote, J.; Thomas, D.L.; Francesconi, A.H.D.; Caja, G. Current production trends, farm structures, and economics of the dairy sheep and goat sectors. J. Dairy Sci. 2018, 101, 6715–6729. [Google Scholar] [CrossRef] [PubMed] [Green Version]
- dos Santos, W.M.; Gomes, A.C.G.; de Caldas Nobre, M.S.; de Souza Pereira, Á.M.; dos Santos Pereira, E.V.; dos Santos, K.M.O.; Florentino, E.R.; Buriti, F.C.A. Goat milk as a natural source of bioactive compounds and strategies to enhance the amount of these beneficial components. Int. Dairy J. 2023, 137, 105515. [Google Scholar] [CrossRef]
- Park, Y.W.; Juárez, M.; Ramos, M.; Haenlein, G.F.W. Physico-chemical characteristics of goat and sheep milk. Small Rumin. Res. 2007, 68, 88–113. [Google Scholar] [CrossRef] [Green Version]
- Ribeiro, A.C.; Ribeiro, S.D.A. Specialty products made from goat milk. Small Rumin. Res. 2010, 89, 225–233. [Google Scholar] [CrossRef]
- Barłowska, J.; Szwajkowska, M.; Litwińczuk, Z.; Król, J. Nutritional value and technological suitability of milk from various animal species used for dairy production. Compr. Rev. Food Sci. Food Saf. 2011, 6, 291–302. [Google Scholar] [CrossRef]
- Pikul, J.; Wójtowski, J.; Danków, R.; Teichert, J.; Czyżak-Runowska, G.; Cais-Sokolińska, D.; Cieślak, A.; Szumacher-Strabel, M.; Bagnicka, E. The effect of false flax (Camelina sativa) cake dietary supplementation in dairy goats on fatty acid profile of kefir. Small Rum. Res. 2014, 122, 44–49. [Google Scholar] [CrossRef]
- Regulation (EC) No 1831/2003 of the European Parliament and of the Council of 22 September 2003 on Additives for Use in Animal Nutrition (OJ L 268, 18.10.2003, pp. 29–43). Available online: https://eur-lex.europa.eu/summary/PL-EN-DE/TXT/LEGISSUM:l12037d?from=PL (accessed on 20 February 2021).
- Zhang, Q.; Bai, Y.; Wang, W.; Li, J.; Zhang, L.; Tang, Y.; Yue, S. Role of herbal medicine and gut microbiota in the prevention and treatment of obesity. J. Ethnopharmacol. 2023, 305, 116127. [Google Scholar] [CrossRef]
- Cieślak, A.; Stanisz, M.; Wójtowski, J.; Pers-Kamczyc, E.; Szczechowiak, J.; El-Sherbiny, M.; Szumacher-Strabel, M. Camelina sativa affects the fatty acid contents in M. longissimus muscle of lambs. Eur. J. Lipid Sci. Technol. 2013, 115, 1258–1265. [Google Scholar] [CrossRef]
- Shabnam, F.; Rani, I.; Vivek, D.; Goyal, R.; Kumar Gautam, R. Therapeutic benefits of miracle tree moringa oleifera: A complete overview. Curr. Tradit. Med. 2023, 9, 82–92. [Google Scholar] [CrossRef]
- Wójtowski, J.; Danków, R.; Foksowicz-Flaczyk, J.; Grajek, K. Herbal additives in the nutrition of cows, sheep and dairy goats. Życie Weter. 2019, 94, 550–556. (In Polish) [Google Scholar]
- Foksowicz-Flaczyk, J.; Wójtowski, J.A.; Danków, R.; Mikołajczak, P.; Pikul, J.; Gryszczyńska, A.; Łowicki, Z.; Zajączek, K.; Stanisławski, D. The effect of herbal feed additives in the diet of dairy goats on intestinal Lactic Acid Bacteria (LAB) count. Animals 2022, 12, 255. [Google Scholar] [CrossRef]
- Karaźniewicz-Łada, M.; Wójtowski, J.A.; Główka, F.K.; Danków, R.; Pikul, J.; Gryszczyńska, A.; Foksowicz-Flaczyk, J.; Mikołajczak, P.Ł. Application of UPLC-MS/MS method for analysis of apigenin, apigenin 7-glucoside and chlorogenic acid in goat serum. Chromatographia 2023, 86, 401–411. [Google Scholar] [CrossRef]
- Akbağ, H.I.; Savaş, T.; Karagül Yüceer, Y. The effect of fenugreek seed (Trigonella foenum-graecum) supplementation on the performance and milk yield characteristics of dairy goats. Arch. Anim. Breed. 2022, 65, 385–395. [Google Scholar] [CrossRef] [PubMed]
- Giorgino, A.; Raspa, F.; Valle, E.; Bergero, D.; Cavallini, D.; Gariglio, M.; Bongiorno, V.; Bussone, G.; Bergagna, S.; Cimino, F.; et al. Effect of dietary organic acids and botanicals on metabolic status and milk parameters in mid–late lactating goats. Animals 2023, 13, 797. [Google Scholar] [CrossRef]
- Aprea, E. Special Issue “Volatile compounds and smell chemicals (odor and aroma) of food”. Molecules 2020, 25, 3811. [Google Scholar] [CrossRef]
- Stefanon, B.; Procida, G. Effects of including silage in the diet on volatile compound profiles in Montasio cheese and their modification during ripening. J. Dairy Res. 2004, 71, 58–65. [Google Scholar] [CrossRef]
- Bennato, F.; Ianni, A.; Martino, C.; Di Luca, A.; Innosa, D.; Fusco, A.M.; Pomilio, F.; Martino, G. Dietary supplementation of Saanen goats with dried licorice root modifies chemical and textural properties of dairy products. J. Dairy Sci. 2020, 103, 52–62. [Google Scholar] [CrossRef] [PubMed] [Green Version]
- Cais-Sokolińska, D.; Wójtowski, J.; Pikul, J.; Danków, R.; Majcher, M.; Teichert, J.; Bagnicka, E. Formation of volatile compounds in kefir made of goat and sheep milk with high polyunsaturated fatty acids content. J. Dairy Sci. 2015, 98, 6692–6705. [Google Scholar] [CrossRef] [PubMed] [Green Version]
- Skrzypek, R.; Wójtowski, J.; Fahr, R.D. Hygienic quality of cow bulk tank milk depending on the method of udder preparation for milking (short communication). Arch. Fur Tierz. 2003, 46, 405–411. [Google Scholar] [CrossRef]
- INRA (Institut National de la Recherche Agronomique). Feeding of Cattle, Sheep and Goats. Requirements for Animals. Food Values (in French: Alimentation des Bovins, Ovins et Caprins. Besoins des Animaux. Valeurs des Aliments); Éditions Quæ (INRA): Versailles, France, 2007; ISBN 978-2-7592-0020-7. [Google Scholar]
- Folch, J.; Lees, M.; Sloane Stanley, G.H. A simple method for isolation and purification of total lipids from animal tissues. J. Biol. Chem. 1957, 226, 497–509. [Google Scholar] [CrossRef]
- IUPAC. Standard methods for the analysis of oil, fats and derivates. In Blackwell Scientific Publications, 7th ed.; IUPAC Method 2.301 Report of IUPAC Working Group WG 2/87; Blackwell Scientific Publications: Oxford, UK, 1987. [Google Scholar]
- Baryłko-Pikielna, N.; Matuszewska, I. Rozdział 10. Metody Sensorycznej Analizy Opisowej. In Sensoryczne Badania Zywności. Podstawy-Metody-Zastosowania; Wydawnictwo Naukowe PTTZ: Kraków, Poland, 2014; pp. 181–226. ISBN 978-83-935421-3-0. [Google Scholar]
- ISO 8586; Sensory Analysis—General Guidelines for the Selection, Training and Monitoring of Selected Assessors and Expert Sensory Assessors. ISO: Geneva, Switzerland, 2012.
- ISO 8589; Sensory Analysis—General Guidance for the Design of Test Rooms. ISO: Geneva, Switzerland, 2007.
- TIBCO Software Inc. Statistica (Data Analysis Software System). 2017. Available online: https://www.tibco.com (accessed on 1 February 2023).
- Pazzola, M.; Amalfitano, N.; Bittante, G.; Dettori, M.L.; Vacca, G.M. Composition, coagulation properties, and predicted cheesemaking traits of bulk goat milk from different farming systems, breeds, and stages of production. J. Dairy Sci. 2022, 105, 6724–6738. [Google Scholar] [CrossRef] [PubMed]
- Koop, G.; Nielen, M.; van Werven, T. Bulk milk somatic cell counts are related to bulk milk total bacterial counts and several herd-level risk factors in dairy goats. J. Dairy Sci. 2009, 92, 4355–4364. [Google Scholar] [CrossRef] [PubMed] [Green Version]
- Koop, G.; Dik, N.; Nielen, M.; Lipman, L.J.A. Repeatability of differential goat bulk milk culture and associations with somatic cell count, total bacterial count, and standard plate count. J. Dairy Sci. 2010, 93, 2569–2573. [Google Scholar] [CrossRef] [PubMed] [Green Version]
- Paape, M.; Poutrel, B.; Contreras, A.; Marco, J.C.; Capuco, A. Milk somatic cells and lactation in small ruminants. J. Dairy Sci. 2001, 84, E237–E244. [Google Scholar] [CrossRef]
- Silanikove, N.; Merin, U.; Shapiro, F.; Leitner, G. Subclinical mastitis in goats is associated with upregulation of nitric oxidederived oxidative stress that causes reduction of milk antioxidative properties and impairment of its quality. J. Dairy Sci. 2014, 97, 3449–3455. [Google Scholar] [CrossRef]
- Leitner, G.; Merin, U.; Silanikove, N. Changes in milk composition as affected by subclinical mastitis in goats. J. Dairy Sci. 2004, 87, 1719–1726. [Google Scholar] [CrossRef] [Green Version]
- Markiewicz-Kęszycka, M.; Czyżak-Runowska, G.; Lipińska, P.; Wójtowski, J. Fatty acid profile of milk—A review. Bull. Vet. Inst. Pulawy 2013, 57, 135–139. [Google Scholar] [CrossRef] [Green Version]
- Bennato, F.; Ianni, A.; Innosa, D.; Grotta, L.; D’Onofrio, A.; Martino, G. Chemical-nutritional characteristics and aromatic profile of milk and related dairy products obtained from goats fed with extruded linseed. Asian-Australas. J. Anim. Sci. 2020, 33, 148–156. [Google Scholar] [CrossRef] [Green Version]
- Muelas, R.; Romero, G.; Díaz, J.R.; Monllor, P.; Fernández-López, J.; Viuda-Martos, M.; Cano-Lamadrid, M.; Sendra, E. Quality and Functional Parameters of Fermented Milk Obtained from Goat Milk Fed with Broccoli and Artichoke Plant By-Products. Foods 2022, 11, 2601. [Google Scholar] [CrossRef]
- Eknæs, M.; Havrevoll, Ø.; Volden, H.; Hove, K. Fat content, fatty acid profile and off-flavours in goats milk—Effects of feed concentrates with different fat sources during the grazing season. Anim. Feed Sci. Tech. 2009, 152, 112–122. [Google Scholar] [CrossRef]
- Clark, S.; García, M.B.M. A 100-year review: Advances in goat milk research. J. Dairy Sci. 2017, 100, 10026–10044. [Google Scholar] [CrossRef] [PubMed] [Green Version]
- Haenlein, G.F.W. Producing quality goat milk. Int. J. Anim. Sci. 1993, 8, 79–84. [Google Scholar]
- Šlyžius, E.; Anskienė, L.; Palubinskas, G.; Juozaitienė, V.; Šlyžienė, B.; Juodžentytė, R.; Laučienė, L. Associations between somatic cell count and milk fatty acid and amino acid profile in Alpine and Saanen goat breeds. Animals 2023, 13, 965. [Google Scholar] [CrossRef] [PubMed]
- Vulić, A.; Kudumija, N.; Lešić, T.; Tanković, S.; Jelušić, V.; Ferizbegović, J.; Bilandžić, N.; Pleadin, J. Chemical composition and fatty acid profile of Alpine and Saanen goat milk from Bosnia and Herzegovina. Vet. Stanica 2021, 52, 13–21. [Google Scholar] [CrossRef]
- Yelnetty, A.; Purwadi; Ekawati Tallei, T. Indigenous lactic acid bacteria isolated from spontaneously fermented goat milk as potential probiotics. Pak. J. Biol. Sci. 2020, 23, 883–890. [Google Scholar] [CrossRef]
- Özer, B.; Yaman, H. Milk and Milk Products: Microbiology of Liquid Milk. In Encyclopedia of Food Microbiology; Batt, C.A., Tortorello, M.L., Eds.; Academic Press: Cambridge, MA, USA, 2014; Volume 2, ISBN 9780123847300. [Google Scholar]
- Rita de Cássia, R.; Neta, M.T.S.L.; Donizete, R.; Sandes, D.; Narain, N.; de Sousa Galvão, M.; Madruga, M.S.; Costa, R.G. An insight in key volatile compounds in goat milk based on their odor active values. J. Food Sci. Nutr. Res. 2019, 2, 49–60. [Google Scholar] [CrossRef]
- Altaie, R.; Richter, R.L. Formation of volatile free fatty acids during ripening of cheddar-like hard goat cheeses. J. Dairy Sci. 1996, 79, 21–27. [Google Scholar]
- Frank, D.C.; Owen, C.M.; Patterson, J. Solid phase microextraction (SPME) combined with gas-chromatography and olfactometry-mass spectrometry for characterization of cheese aroma compounds. LWT 2004, 37, 139–154. [Google Scholar] [CrossRef]
- Gallois, A.; Langlois, D. New results in the volatile odorous compounds of French cheeses. Lait 1990, 70, 89–106. [Google Scholar] [CrossRef] [Green Version]
- Curioni, P.M.G.; Bosset, J.O. Key odorants in various cheese types as determined by gas chromatography-olfactometry. Int. Dairy J. 2002, 12, 959–984. [Google Scholar] [CrossRef]
- Fox, P.F.; Uniacke-Lowe, T.; McSweeney, P.L.H.; O’Mahony, J.A. Dairy Chemistry and Biochemistry, 2nd ed.; Springer: Berlin/Heidelberg, Germany, 2015; ISBN 978-3-319-14891-5. [Google Scholar]
- Jolliffe, I.T. Principal Component Analysis, 2nd ed.; Springer: New York, NY, USA; Berlin/Heidelberg, Germany, 2002. [Google Scholar]
- Polowy, K.; Molińska-Glura, M. Data mining in the analysis of tree harvester performance based on automatically collected data. Forests 2023, 14, 165. [Google Scholar] [CrossRef]
- Shan, B.; Cai, Y.Z.; Brooks, J.D.; Corke, H. Potential application of spice and herb extracts as natural preservatives in cheese. J. Med. Food 2011, 14, 284–290. [Google Scholar] [CrossRef] [PubMed]
- Gliguem, H.; Ben Hassine, D.; Ben Haj Said, L.; Ben Tekaya, I.; Rahmani, R.; Bellagha, S. Supplementation of double cream cheese with Allium roseum: Effects on quality improvement and shelf-life extension. Foods 2021, 10, 1276. [Google Scholar] [CrossRef] [PubMed]
- Pluta-Kubica, A.; Najgebauer-Lejko, D.; Domagała, J.; Štefániková, J.; Golian, J. The effect of cow breed and wild garlic leaves (Allium ursinum L.) on the sensory quality, volatile compounds, and physical properties of unripened soft rennet-curd cheese. Foods 2022, 11, 3948. [Google Scholar] [CrossRef]


| Features | CG | I-20 | I-40 | II-20 | II-40 | |||||
|---|---|---|---|---|---|---|---|---|---|---|
| SD | SD | SD | SD | SD | ||||||
| Fat (%) | 4.01 | 0.04 | 4.30 | 0.08 | 4.36 | 0.08 | 4.13 | 0.05 | 4.35 | 0.08 |
| Protein (%) | 3.41 | 0.04 | 3.34 | 0.03 | 3.51 | 0.04 | 3.43 | 0.04 | 3.58 | 0.05 |
| Lactose (%) | 4.46 | 0.05 | 4.32 | 0.05 | 4.41 | 0.04 | 4.38 | 0.05 | 4.38 | 0.05 |
| TBC (103/cm3) | 41.18 | 2.35 | 43.26 | 3.05 | 39.22 | 1.61 | 40.62 | 2.05 | 41.78 | 2.16 |
| SCC (103/cm3) | 397.78 | 11.31 | 426.11 | 13.62 | 387.38 | 11.75 | 406.44 | 12.67 | 411.34 | 12.34 |
| FA, g/100 g of Total FA | CG | I-20 | I-40 | II-20 | II-40 |
|---|---|---|---|---|---|
| C4:0 | 1.7 ± 0.1 | 1.7 ± 0.1 | 1.6 ± 0.1 | 1.7 ± 0.1 | 1.6 ± 0.1 |
| C6:0 | 2.2 ± 0.1 | 2.0 ± 0.1 | 2.0 ± 0.1 | 2.1 ± 0.1 | 1.9 ± 0.1 |
| C8:0 | 2.6 ± 0.1 | 2.4 ± 0.1 | 2.3 ± 0.1 | 2.4 ± 0.1 | 2.3 ± 0.1 |
| C10:0 | 9.7 ± 0.5 | 9.4 ± 0.5 | 8.5 ± 0.5 | 9.3 ± 0.5 | 8.6 ± 0.5 |
| C10:1 | 0.2 ± 0.1 | 0.2 ± 0.1 | 0.2 ± 0.1 | 0.2 ± 0.1 | 0.2 ± 0.1 |
| C12:0 | 4.7 ± 0.2 | 4.3 ± 0.2 | 3.8 ± 0.2 | 4.2 ± 0.2 | 3.7 ± 0.2 |
| C12:1 | 0.1 ± 0.05 | 0.1 ± 0.05 | 0.1 ± 0.05 | 0.1 ± 0.05 | 0.1 ± 0.05 |
| C13:0 | 0.1 ± 0.05 | 0.1 ± 0.05 | 0.1 ± 0.05 | 0.1 ± 0.05 | 0.1 ± 0.05 |
| C14:0 | 11.0 ± 0.5 | 10.9 ± 0.5 | 9.8 ± 0.5 | 11.0 ± 0.5 | 9.9 ± 0.5 |
| C14:1 | 0.3 ± 0.1 | 0.3 ± 0.1 | 0.3 ± 0.1 | 0.3 ± 0.1 | 0.3 ± 0.1 |
| C15:0 | 1.1 ± 0.1 | 1.1 ± 0.1 | 1.0 ± 0.1 | 1.1 ± 0.1 | 1.0 ± 0.1 |
| C15:1 | 0.2 ± 0.1 | 0.2 ± 0.1 | 0.2 ± 0.1 | 0.2 ± 0.1 | 0.2 ± 0.1 |
| C16:0 | 28.6 ± 1.4 | 28.6 ± 1.4 | 27.2 ± 1.4 | 28.2 ± 1.4 | 27.4 ± 1.4 |
| C16:1 | 1.2 ± 0.1 | 1.2 ± 0.1 | 1.3 ± 0.1 | 1.2 ± 0.1 | 1.3 ± 0.1 |
| C17:0 | 1.4 ± 0.1 | 1.3 ± 0.1 | 1.7 ± 0.1 | 1.3 ± 0.1 | 1.6 ± 0.1 |
| C17:1 | 0.3 ± 0.1 | 0.3 ± 0.1 | 0.3 ± 0.1 | 0.3 ± 0.1 | 0.3 ± 0.1 |
| C18:0 | 7.7 ± 0.4 | 7.7 ± 0.4 | 8.5 ± 0.4 | 7.5 ± 0.4 | 8.4 ± 0.4 |
| C18:1 trans | 1.8 ± 0.1 | 2.0 ± 0.1 | 2.0 ± 0.1 | 2.0 ± 0.1 | 2.0 ± 0.1 |
| C18:1 cis-9 | 19.4 ± 1.0 | 20.2 ± 1.0 | 22.8 ± 1.0 | 20.8 ± 1.0 | 22.9 ± 1.0 |
| C18:1 cis-11 | 0.7 ± 0.1 | 0.7 ± 0.1 | 0.7 ± 0.1 | 0.7 ± 0.1 | 0.7 ± 0.1 |
| C18:1n7 | 1.0 ± 0.1 | 1.0 ± 0.1 | 1.0 ± 0.1 | 1.0 ± 0.1 | 1.0 ± 0.1 |
| C18:2 | 2.6 ± 0.1 | 2.8 ± 0.1 | 3.0 ± 0.1 | 2.8 ± 0.1 | 2.9 ± 0.1 |
| C18:3 n-3 (ALA) | 0.2 ± 0.1 | 0.2 ± 0.1 | 0.2 ± 0.1 | 0.2 ± 0.1 | 0.2 ± 0.1 |
| C18:2 cis9 trans11 (CLA) | 0.6 ± 0.1 | 0.7 ± 0.1 | 0.8 ± 0.1 | 0.7 ± 0.1 | 0.8 ± 0.1 |
| C20:0 | 0.2 ± 0.05 | 0.1 ± 0.05 | 0.1 ± 0.05 | 0.1 ± 0.05 | 0.1 ± 0.05 |
| C20:1 | 0.1 ± 0.05 | 0.1 ± 0.05 | 0.1 ± 0.05 | 0.1 ± 0.05 | 0.1 ± 0.05 |
| C20:4 n-6 | 0.2 ± 0.1 | 0.3 ± 0.1 | 0.2 ± 0.1 | 0.3 ± 0.1 | 0.2 ± 0.1 |
| C22:5 n-3 | 0.1 ± 0.05 | 0.1 ± 0.05 | 0.1 ± 0.05 | 0.1 ± 0.05 | 0.1 ± 0.05 |
| VOC | T0 | T1 | T4 | T8 | T12 | ||||||||
|---|---|---|---|---|---|---|---|---|---|---|---|---|---|
| All Groups | CG | I-20 | I-40 | CG | I-20 | I-40 | CG | I-20 | I-40 | CG | I-20 | I-40 | |
| ACI | |||||||||||||
| AA | 0.00 ± 0.00 | 0.00 ± 0.00 | 0.00 ± 0.00 | 0.00 ± 0.00 | 0.00 ± 0.00 | 0.00 ± 0.00 | 0.00 ± 0.00 | 0.00 ± 0.00 | 0.00 ± 0.00 | 0.00 ± 0.00 | 0.00 ± 0.00 | 27.49 ± 2.91 | 29.55 ± 1.74 |
| PA | 0.00 ± 0.00 | 0.00 ± 0.00 | 0.00 ± 0.00 | 0.00 ± 0.00 | 0.00 ± 0.00 | 53.89 ± 1.89 | 10.34 ± 1.09 | 0.00 ± 0.00 | 59.30 ± 3.49 | 50.25 ± 1.76 | 0.00 ± 0.00 | 67.63 ± 3.98 | 80.92 ± 2.83 |
| HA | 34.22 ± 2.71 | 34.22 ± 2.71 | 129.95 ± 13.75 | 73.79 ± 7.81 | 71.07 ± 4.18 | 147.15 ± 15.57 | 79.43 ± 8.41 | 73.83 ± 7.81 | 148.63 ± 15.73 | 75.51 ± 7.99 | 79.90 ± 8.45 | 164.83 ± 17.44 | 79.43 ± 8.40 |
| OA | 67.02 ± 2.61 | 67.02 ± 2.61 | 153.57 ± 15.58 | 89.91 ± 5.29 | 69.21 ± 7.32 | 149.83 ± 5.24 | 87.38 ± 8.87 | 72.02 ± 7.31 | 181.34 ± 10.66 | 115.25 ± 4.03 | 72.77 ± 2.55 | 196.14 ± 11.53 | 115.77 ± 4.05 |
| DA | 72.24 ± 3.72 | 72.24 ± 3.72 | 128.37 ± 7.55 | 83.04 ± 8.43 | 79.43 ± 8.41 | 131.43 ± 4.60 | 87.39 ± 5.14 | 88.96 ± 5.23 | 156.12 ± 15.84 | 90.21 ± 3.16 | 89.26 ± 3.12 | 213.65 ± 21.68 | 143.82 ± 5.03 |
| MKE | |||||||||||||
| 2H | 1.83 ± 0.07 | 1.83 ± 0.07 | 33.78 ± 1.99 | 36.48 ± 3.86 | 8.00 ± 0.28 | 51.08 ± 5.18 | 64.19 ± 3.77 | 14.35 ± 0.84 | 60.03 ± 6.35 | 74.73 ± 7.58 | 23.99 ± 2.43 | 100.57 ± 10.64 | 237.28 ± 24.08 |
| 2N | 4.83 ± 0.13 | 4.83 ± 0.13 | 47.83 ± 5.06 | 77.43 ± 4.55 | 15.52 ± 1.57 | 118.50 ± 12.03 | 128.95 ± 13.65 | 64.11 ± 6.78 | 143.63 ± 8.45 | 159.54 ± 16.19 | 102.93 ± 10.45 | 411.78 ± 24.22 | 710.11 ± 72.07 |
| MES | |||||||||||||
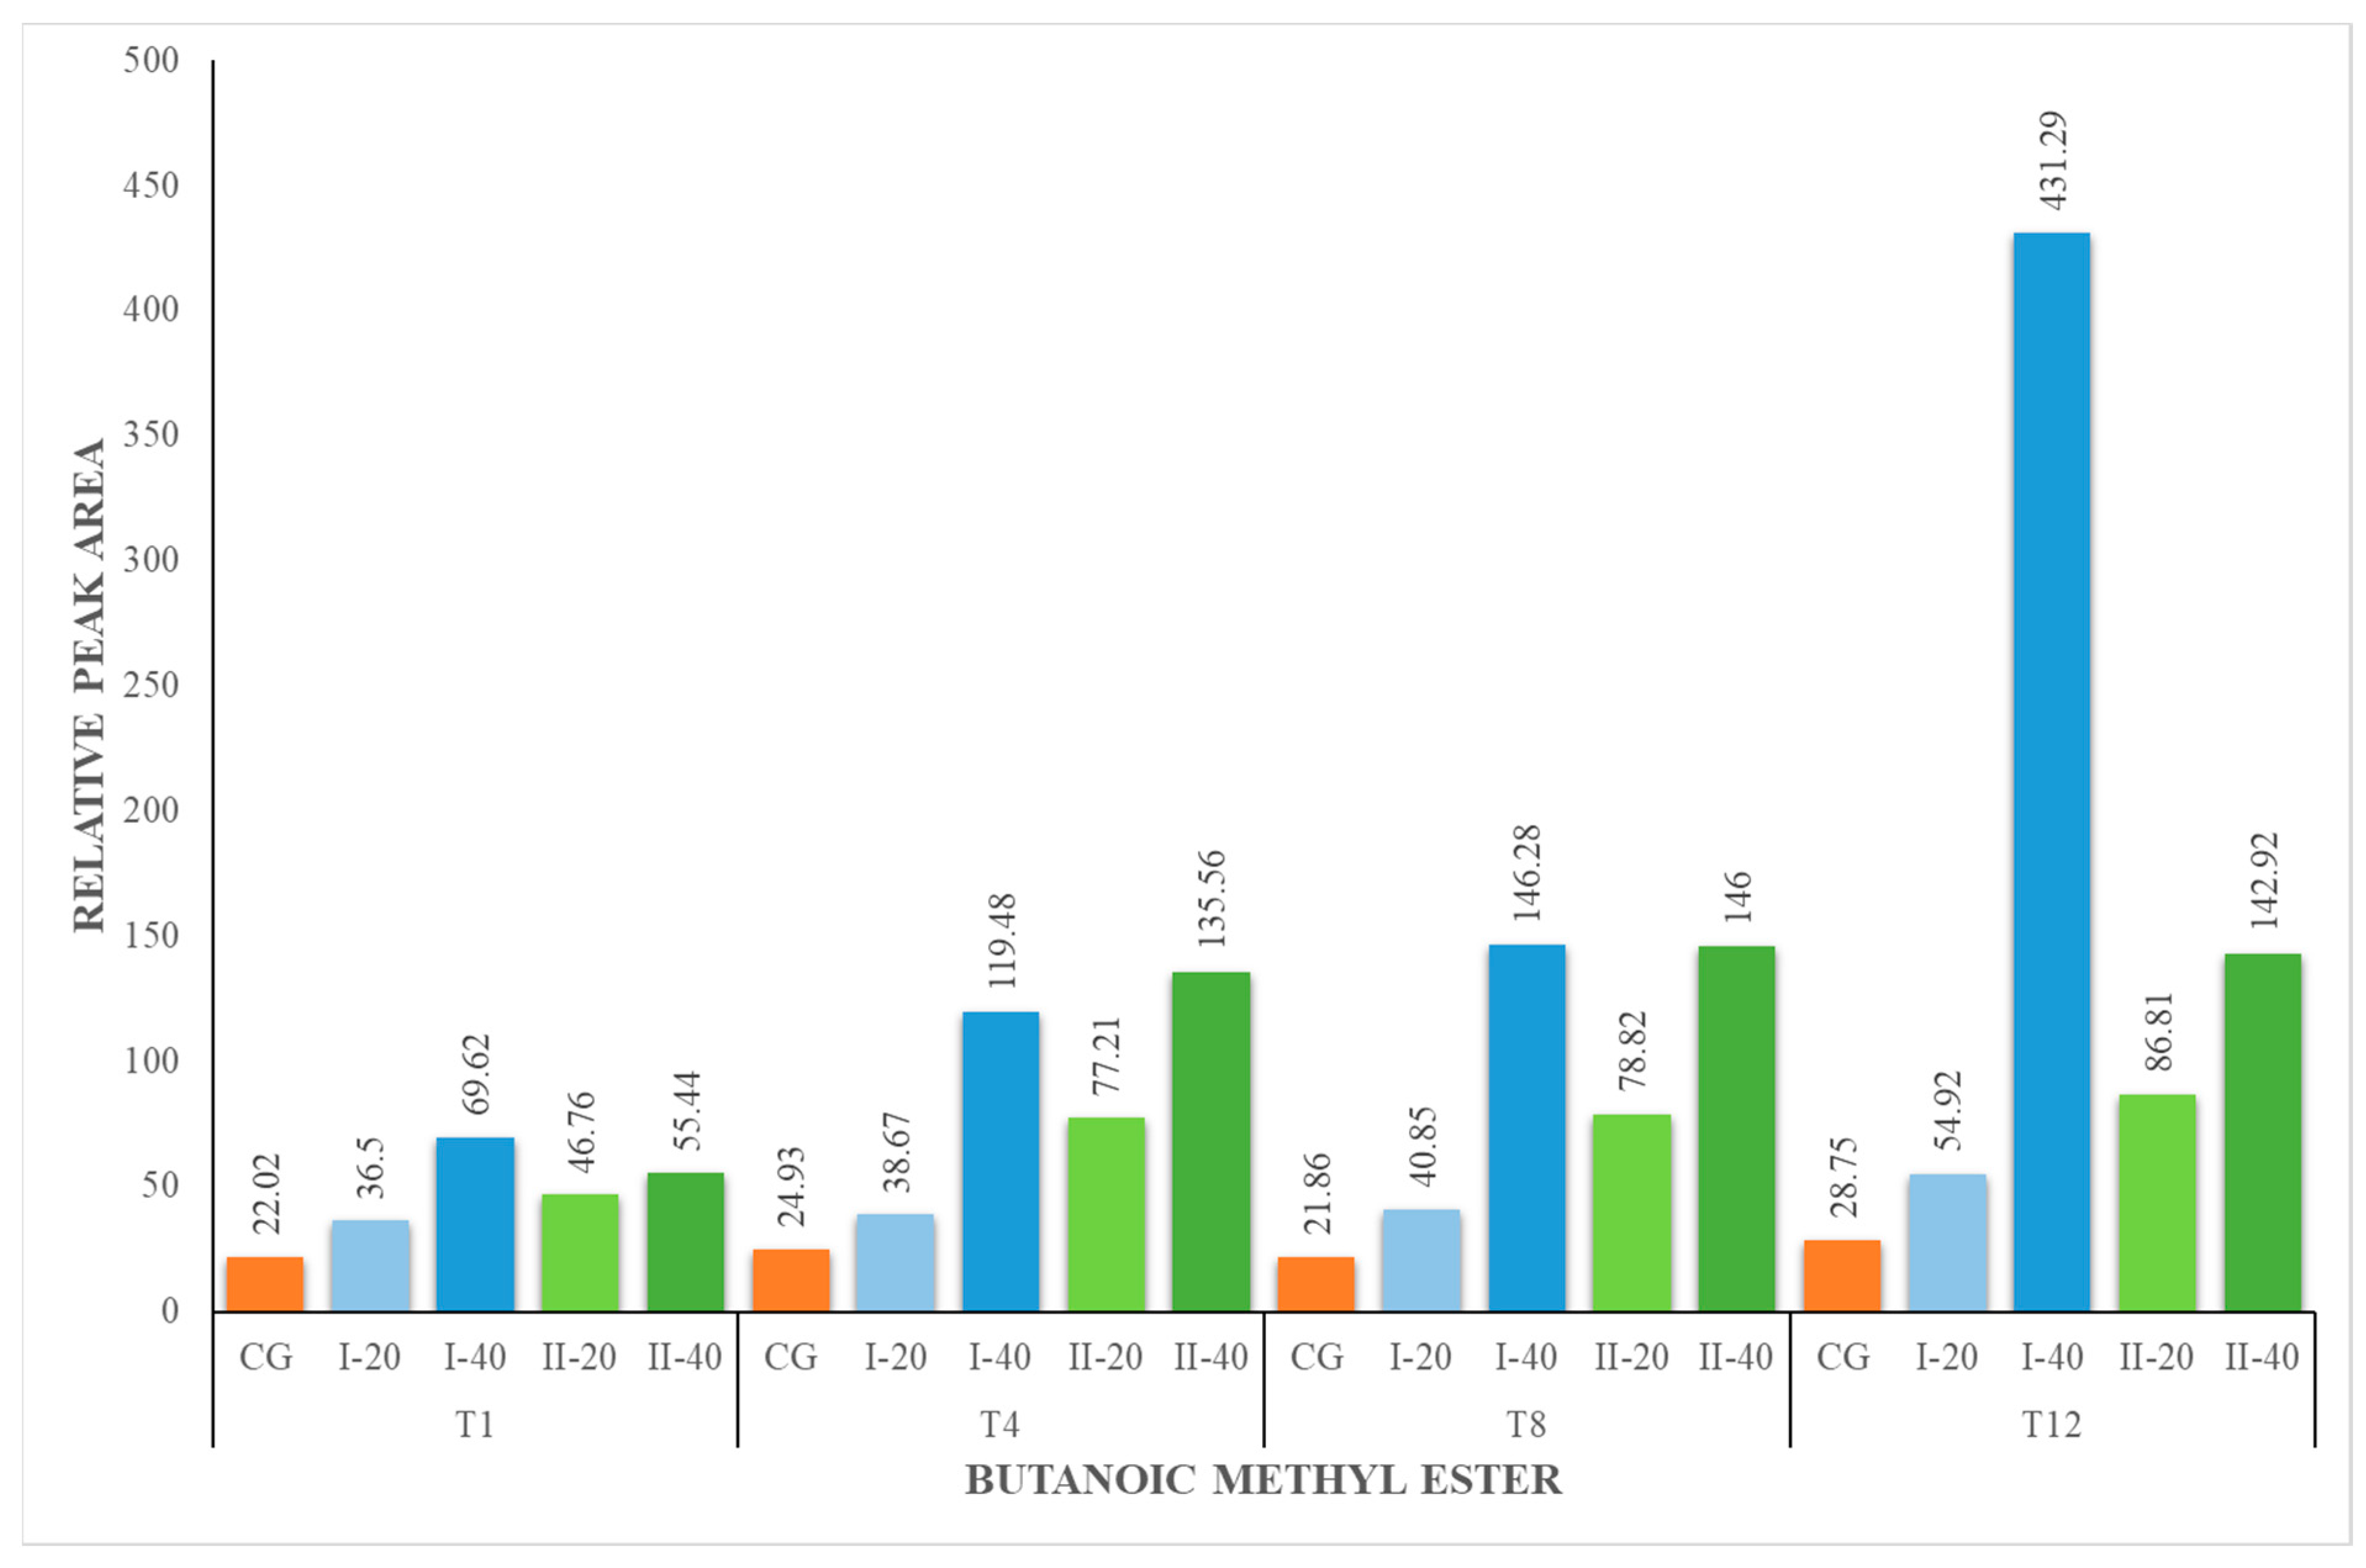
| BM | 22.02 ± 1.60 | 22.02 ± 1.60 | 36.50 ± 1.28 | 69.62 ± 2.44 | 24.93 ± 0.87 | 38.67 ± 4.09 | 119.48 ± 4.18 | 21.86 ± 0.76 | 40.85 ± 0.43 | 146.28 ± 15.48 | 28.75 ± 3.04 | 54.92 ± 1.92 | 431.29 ± 45.64 |
| HM | 73.60 ± 2.99 | 73.60 ± 2.99 | 189.60 ± 19.24 | 262.42 ± 26.63 | 72.70 ± 7.38 | 149.83 ± 15.86 | 274.49 ± 27.86 | 71.74 ± 7.28 | 143.60 ± 14.57 | 341.16 ± 36.10 | 72.19 ± 7.64 | 142.64 ± 14.48 | 1032.01 ± 109.22 |
| OM | 46.98 ± 3.33 | 46.98 ± 3.33 | 116.56 ± 4.08 | 128.62 ± 4.50 | 41.89 ± 2.46 | 119.84 ± 7.05 | 307.05 ± 10.75 | 44.24 ± 1.55 | 114.66 ± 4.01 | 473.81 ± 27.86 | 42.04 ± 2.47 | 118.80 ± 4.16 | 723.54 ± 42.55 |
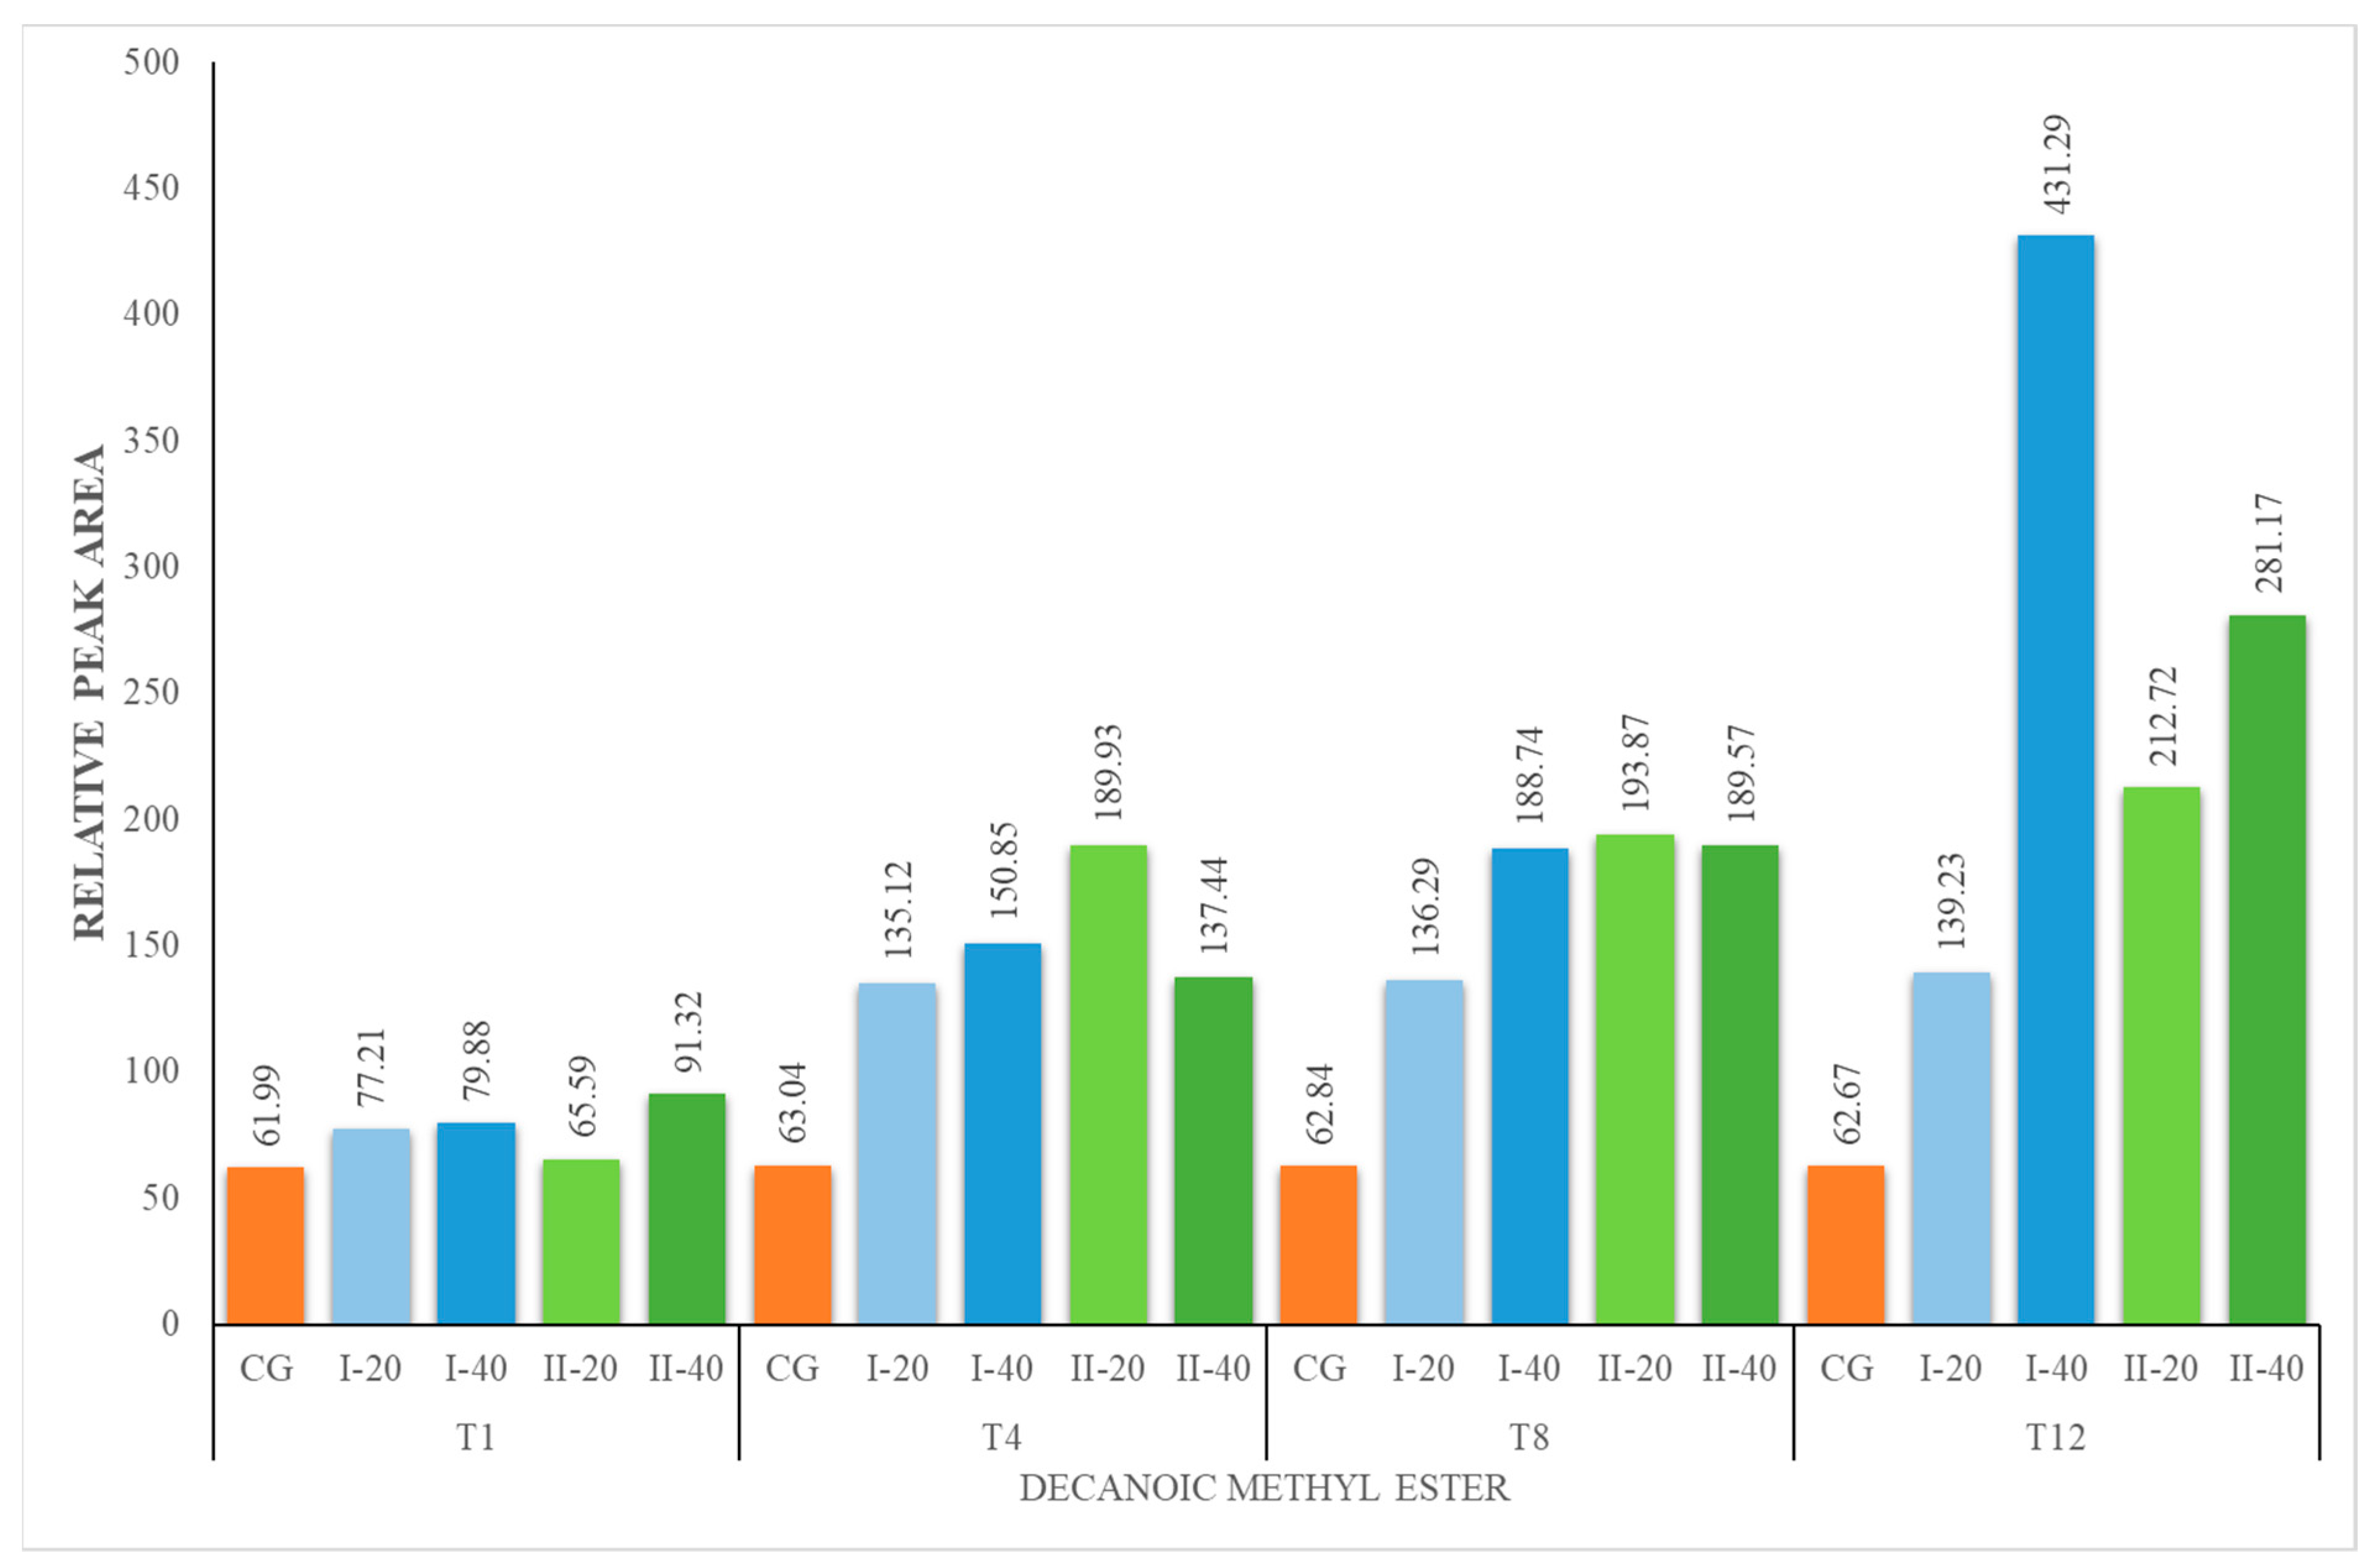
| DM | 61.99 ± 6.07 | 61.99 ± 6.07 | 77.21 ± 8.17 | 79.88 ± 5.42 | 63.04 ± 6.40 | 135.12 ± 4.73 | 150.85 ± 15.96 | 62.84 ± 6.65 | 136.29 ± 9.24 | 188.74 ± 6.61 | 62.67 ± 2.19 | 139.23 ± 9.44 | 431.29 ± 15.09 |
| All groups | CG | II-20 | II-40 | CG | II-20 | II-40 | CG | II-20 | II-40 | CG | II-20 | II-40 | |
| ACI | |||||||||||||
| AA | 0.00 ± 0.00 | 0.00 ± 0.00 | 0.00 ± 0.00 | 0.00 ± 0.00 | 0.00 ± 0.00 | 0.00 ± 0.00 | 0.00 ± 0.00 | 0.00 ± 0.00 | 0.00 ± 0.00 | 0.00 ± 0.00 | 0.00 ± 0.00 | 111,29 ± 6,54 | 661.95 ± 70.05 |
| PA | 0.00 ± 0.00 | 0.00 ± 0.00 | 0.00 ± 0.00 | 0.00 ± 0.00 | 0.00 ± 0.00 | 0.00 ± 0.00 | 0.00 ± 0.00 | 0.00 ± 0.00 | 0.00 ± 0.00 | 50,57 ± 2,97 | 0.00 ± 0.00 | 82,28 ± 2,88 | 537.50 ± 31 |
| HA | 34.22 ± 2.71 | 34.22 ± 2.71 | 72.00 ± 7.62 | 44.42 ± 2.61 | 71.07 ± 4.18 | 104.15 ± 11.02 | 72.93 ± 7.72 | 73.83 ± 7.81 | 398.93 ± 42.22 | 76.00 ± 8.04 | 79.90 ± 8.45 | 401.18 ± 42.46 | 486.59 ± 51. |
| OA | 67.02 ± 2.61 | 67.02 ± 2.61 | 97.39 ± 3.41 | 55.20 ± 5.84 | 69.21 ± 7.32 | 103.03 ± 6.06 | 117.79 ± 11.95 | 72.02 ± 7.31 | 761.95 ± 77.33 | 116.30 ± 6.84 | 79.90 ± 8.45 | 435.70 ± 15.25 | 393.75 ± 23 |
| DA | 72.24 ± 3.72 | 72.24 ± 3.72 | 91.01 ± 3.18 | 87.60 ± 9.27 | 79.43 ± 8.41 | 96.36 ± 9.78 | 139.00 ± 8.17 | 88.96 ± 5.23 | 570.01 ± 33.52 | 90.00 ± 9.13 | 89.26 ± 3.12 | 409.76 ± 14.34 | 243.48 ± 24.71 |
| MKE | |||||||||||||
| 2H | 1.83 ± 0.07 | 1.83 ± 0.07 | 28.61 ± 2.90 | 8.67 ± 0.30 | 8.00 ± 0.28 | 36.18 ± 3.83 | 30.14 ± 1.77 | 14.35 ± 0.84 | 166.69 ± 9.80 | 75.00 ± 7.94 | 23.99 ± 2.43 | 245.42 ± 24.91 | 80.16 ± 8. |
| 2N | 4.83 ± 0.13 | 4.83 ± 0.13 | 59.87 ± 6.08 | 17.13 ± 1.74 | 15.52 ± 1.57 | 68.91 ± 4.05 | 78.71 ± 8.33 | 64.11 ± 6.78 | 155.05 ± 16.41 | 161.81 ± 9.52 | 102.93 ± 10.45 | 192.72 ± 19.56 | 103.80 ± 6. |
| MES | |||||||||||||
| BM | 22.02 ± 1.60 | 22.02 ± 1.60 | 46.76 ± 4.95 | 55.44 ± 1.94 | 24.93 ± 0.87 | 77.21 ± 2.70 | 135.56 ± 4.74 | 21.86 ± 0.76 | 78.82 ± 2.76 | 146.00 ± 5.11 | 28.75 ± 3.04 | 86.81 ± 9.19 | 142.92 ± 5. |
| HM | 73.60 ± 2.99 | 73.60 ± 2.99 | 210.21 ± 22.25 | 223.50 ± 22.68 | 72.70 ± 7.38 | 337.90 ± 34.29 | 283.34 ± 28.76 | 71.74 ± 7.28 | 190.89 ± 19.37 | 341.00 ± 34.61 | 72.19 ± 7.64 | 187.25 ± 19.82 | 243.22 ± 24 |
| OM | 46.98 ± 3.33 | 46.98 ± 3.33 | 100.33 ± 5.90 | 109.42 ± 6.43 | 41.89 ± 2.46 | 152.41 ± 5.33 | 127.90 ± 4.48 | 44.24 ± 1.55 | 187.81 ± 6.57 | 469.00 ± 16.41 | 42.04 ± 2.47 | 200.41 ± 11.79 | 255.34 ± 8. |
| DM | 61.99 ± 6.07 | 61.99 ± 6.07 | 65.59 ± 2.29 | 91.32 ± 9.27 | 63.04 ± 6.40 | 189.93 ± 12.88 | 137.44 ± 14.54 | 62.84 ± 6.65 | 193.87 ± 20.52 | 189.57 ± 12.86 | 62.67 ± 2.19 | 212.72 ± 7.44 | 281.17 ± 19 |
| Values Number | Eigenvalue | % of Variance | Cumulative Eigenvalue | Cumulative Eigenvalue (%) |
|---|---|---|---|---|
| 1 | 5.499781 | 49.99801 | 5.49978 | 49.9980 |
| 2 | 3.272662 | 29.75147 | 8.77244 | 79.7495 |
| 3 | 1.599775 | 14.54341 | 10.37222 | 94.2929 |
| 4 | 0.307912 | 2.79920 | 10.68013 | 97.0921 |
| 5 | 0.142566 | 1.29605 | 10.82270 | 98.3881 |
| 6 | 0.098043 | 0.89130 | 10.92074 | 99.2794 |
| 7 | 0.044982 | 0.40893 | 10.96572 | 99.6884 |
| 8 | 0.022630 | 0.20573 | 10.98835 | 99.8941 |
| 9 | 0.004761 | 0.04328 | 10.99311 | 99.9374 |
| 10 | 0.004458 | 0.04052 | 10.99757 | 99.9779 |
| 11 | 0.002430 | 0.02209 | 11.00000 | 100.0000 |
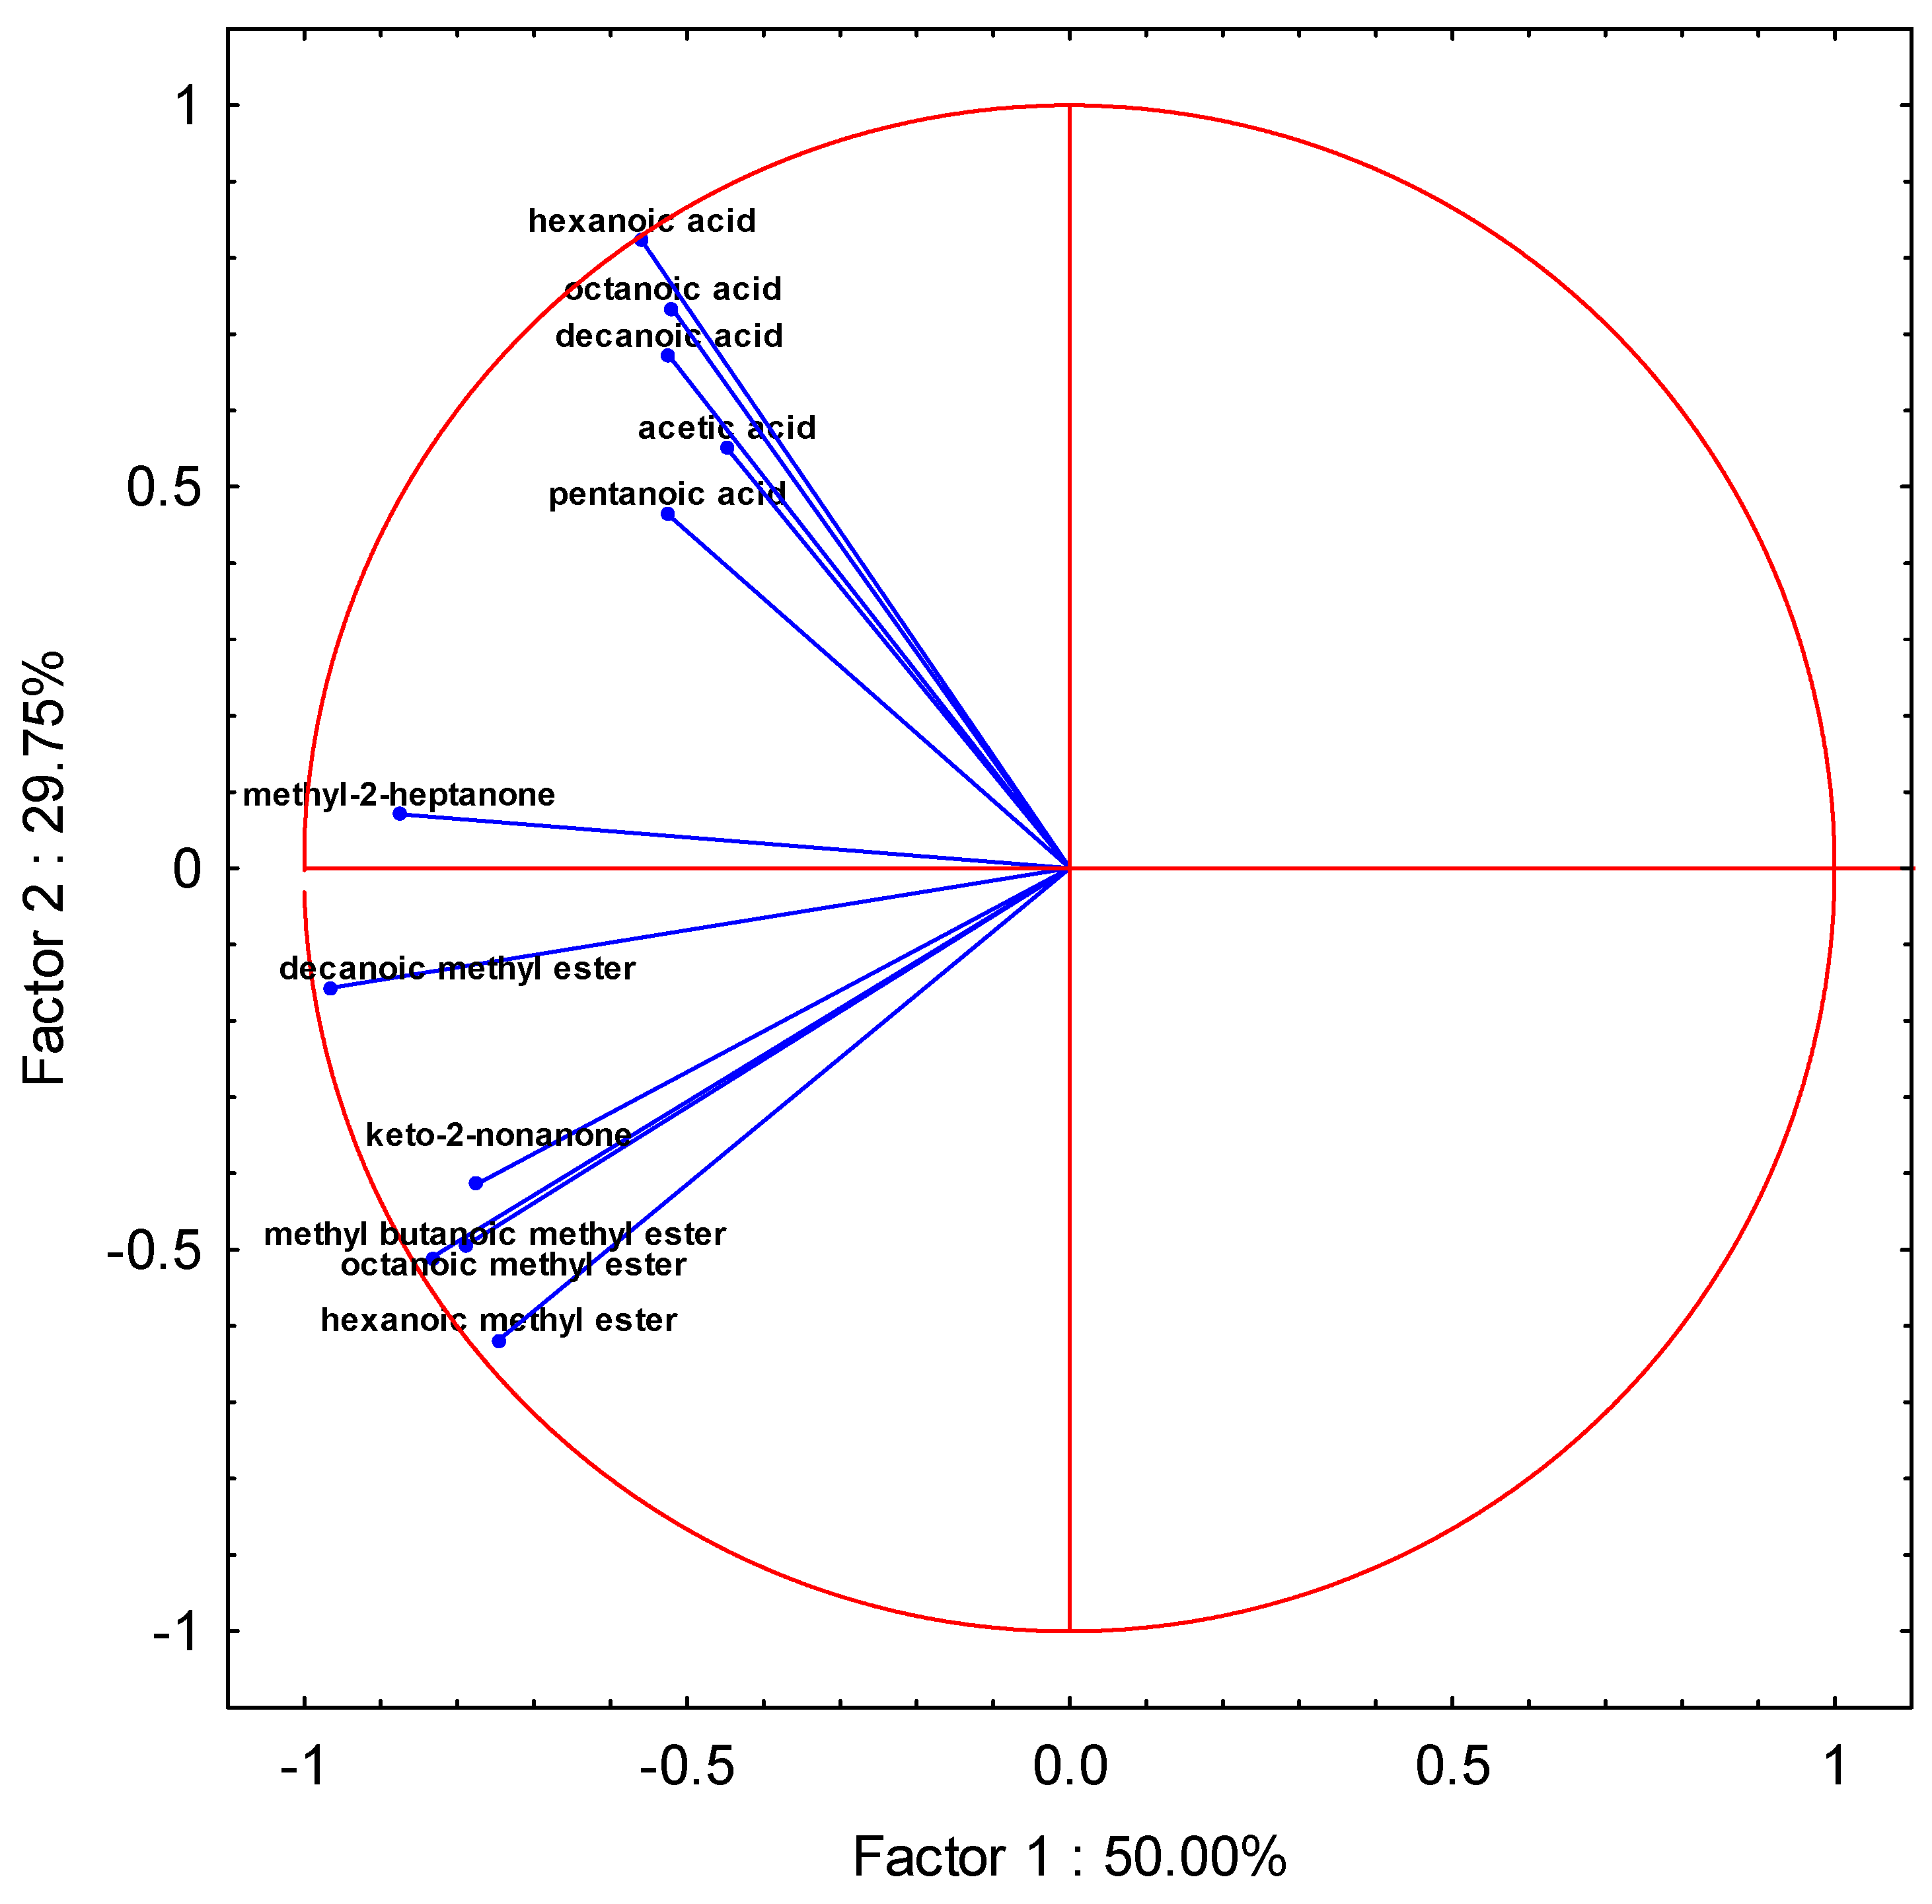
| Variable | Factor 1 | Factor 2 | Factor 3 | Factor 4 | Factor 5 |
|---|---|---|---|---|---|
| 1. (acetic acid) | −0.448070 | 0.551151 | 0.696656 | 0.033408 | −0.038816 |
| 2. (pentanoic acid) | −0.525627 | 0.464894 | 0.703003 | 0.078567 | 0.043553 |
| 3. (hexanoic acid) | −0.559014 | 0.823092 | −0.000238 | 0.005803 | 0.022618 |
| 4. (octanoic acid) | −0.518691 | 0.733243 | −0.385769 | −0.150077 | −0.052815 |
| 5. (decanoic acid) | −0.523602 | 0.672100 | −0.513320 | −0.037523 | −0.062334 |
| 6. (methyl-2-heptanone) | −0.875596 | 0.070782 | −0.391512 | 0.123622 | 0.131460 |
| 7. (ketony-2-nonanone) | −0.775271 | −0.414122 | −0.169318 | 0.424033 | −0.001076 |
| 8. (methyl-butanoic methyl) ester | −0.832828 | −0.509708 | 0.101182 | −0.092405 | −0.107786 |
| 9. (hexanoic methyl ester) | −0.745704 | −0.617916 | 0.038817 | −0.110467 | −0.190158 |
| 10. (octanoic methyl ester) | −0.787199 | −0.493212 | 0.069796 | −0.241167 | 0.255057 |
| 11. (decanoic methyl ester) | −0.964345 | −0.156641 | 0.096700 | −0.051665 | −0.043134 |
| Features | CG | I-20 | I-40 | II-20 | II-40 | SE | p-Value | |||||
|---|---|---|---|---|---|---|---|---|---|---|---|---|
| SD | SD | SD | SD | SD | ||||||||
| Milky taste | 3.42 | 0.58 | 3.71 | 0.62 | 3.75 | 0.61 | 3.63 | 0.65 | 3.83 | 0.64 | 0.06 | 0.1870 |
| Herbal taste | 0.00 | 0.00 | 0.21 | 0.41 | 0.25 | 0.44 | 0.13 | 0.34 | 0.17 | 0.38 | 0.03 | 0.1414 |
| Bitter taste | 0.08 | 0.28 | 0.25 | 0.53 | 0.29 | 0.46 | 0.21 | 0.41 | 0.21 | 0.41 | 0.04 | 0.5335 |
| Sweet taste | 1.46 | 0.51 | 1.38 | 0.49 | 1.33 | 0.48 | 1.29 | 0.46 | 1.42 | 0.50 | 0.04 | 0.7850 |
| Salty taste | 0.75 | 0.44 | 0.67 | 0.48 | 0.88 | 0.34 | 0.83 | 0.38 | 0.92 | 0.28 | 0.04 | 0.1852 |
| Sour taste | 0.79 | 0.41 | 0.75 | 0.44 | 0.71 | 0.46 | 0.67 | 0.48 | 0.67 | 0.48 | 0.04 | 0.8517 |
| Pleasant taste | 4.25 | 0.68 | 4.42 | 0.65 | 4.50 | 0.66 | 4.29 | 0.69 | 4.63 | 0.49 | 0.06 | 0.2456 |
| Milky smell | 3.63 | 0.65 | 3.83 | 0.64 | 3.92 | 0.50 | 3.92 | 0.65 | 4.04 | 0.46 | 0.05 | 0.1645 |
| Herbal smell | 0.00 | 0.00 | 0.17 | 0.38 | 0.25 | 0.44 | 0.13 | 0.34 | 0.21 | 0.41 | 0.03 | 0.1414 |
| Goaty smell | 1.21 A | 0.41 | 0.50 B | 0.59 | 0.25 B | 0.44 | 0.46 B | 0.66 | 0.17 B | 0.38 | 0.06 | 0.0001 |
| Sour smell | 0.88 | 0.34 | 0.71 | 0.46 | 0.58 | 0.50 | 0.67 | 0.48 | 0.50 | 0.51 | 0.04 | 0.0704 |
| Pleasant smell | 4.33 A | 0.56 | 4.38 A | 0.58 | 4.67 B | 0.48 | 4.46 B | 0.59 | 4.75 B | 0.44 | 0.05 | 0.0281 |
Disclaimer/Publisher’s Note: The statements, opinions and data contained in all publications are solely those of the individual author(s) and contributor(s) and not of MDPI and/or the editor(s). MDPI and/or the editor(s) disclaim responsibility for any injury to people or property resulting from any ideas, methods, instructions or products referred to in the content. |
© 2023 by the authors. Licensee MDPI, Basel, Switzerland. This article is an open access article distributed under the terms and conditions of the Creative Commons Attribution (CC BY) license (https://creativecommons.org/licenses/by/4.0/).
Share and Cite
Wójtowski, J.A.; Majcher, M.; Danków, R.; Pikul, J.; Mikołajczak, P.; Molińska-Glura, M.; Foksowicz-Flaczyk, J.; Gryszczyńska, A.; Łowicki, Z.; Zajączek, K.; et al. Effect of Herbal Feed Additives on Goat Milk Volatile Flavor Compounds. Foods 2023, 12, 2963. https://doi.org/10.3390/foods12152963
Wójtowski JA, Majcher M, Danków R, Pikul J, Mikołajczak P, Molińska-Glura M, Foksowicz-Flaczyk J, Gryszczyńska A, Łowicki Z, Zajączek K, et al. Effect of Herbal Feed Additives on Goat Milk Volatile Flavor Compounds. Foods. 2023; 12(15):2963. https://doi.org/10.3390/foods12152963
Chicago/Turabian StyleWójtowski, Jacek Antoni, Małgorzata Majcher, Romualda Danków, Jan Pikul, Przemysław Mikołajczak, Marta Molińska-Glura, Joanna Foksowicz-Flaczyk, Agnieszka Gryszczyńska, Zdzisław Łowicki, Karolina Zajączek, and et al. 2023. "Effect of Herbal Feed Additives on Goat Milk Volatile Flavor Compounds" Foods 12, no. 15: 2963. https://doi.org/10.3390/foods12152963