
Plasmalogen Profiling in Porcine Brain Tissues by LC-MS/MS

Abstract
:1. Introduction
2. Materials and Methods
2.1. Samples
2.2. Chemicals and Reagents for Analyzing
2.3. Sample Preparation for Analyzing
2.4. LC-MS/MS Analysis
2.5. Statistical Analysis and Nutritional Assessment
3. Results and Discussion
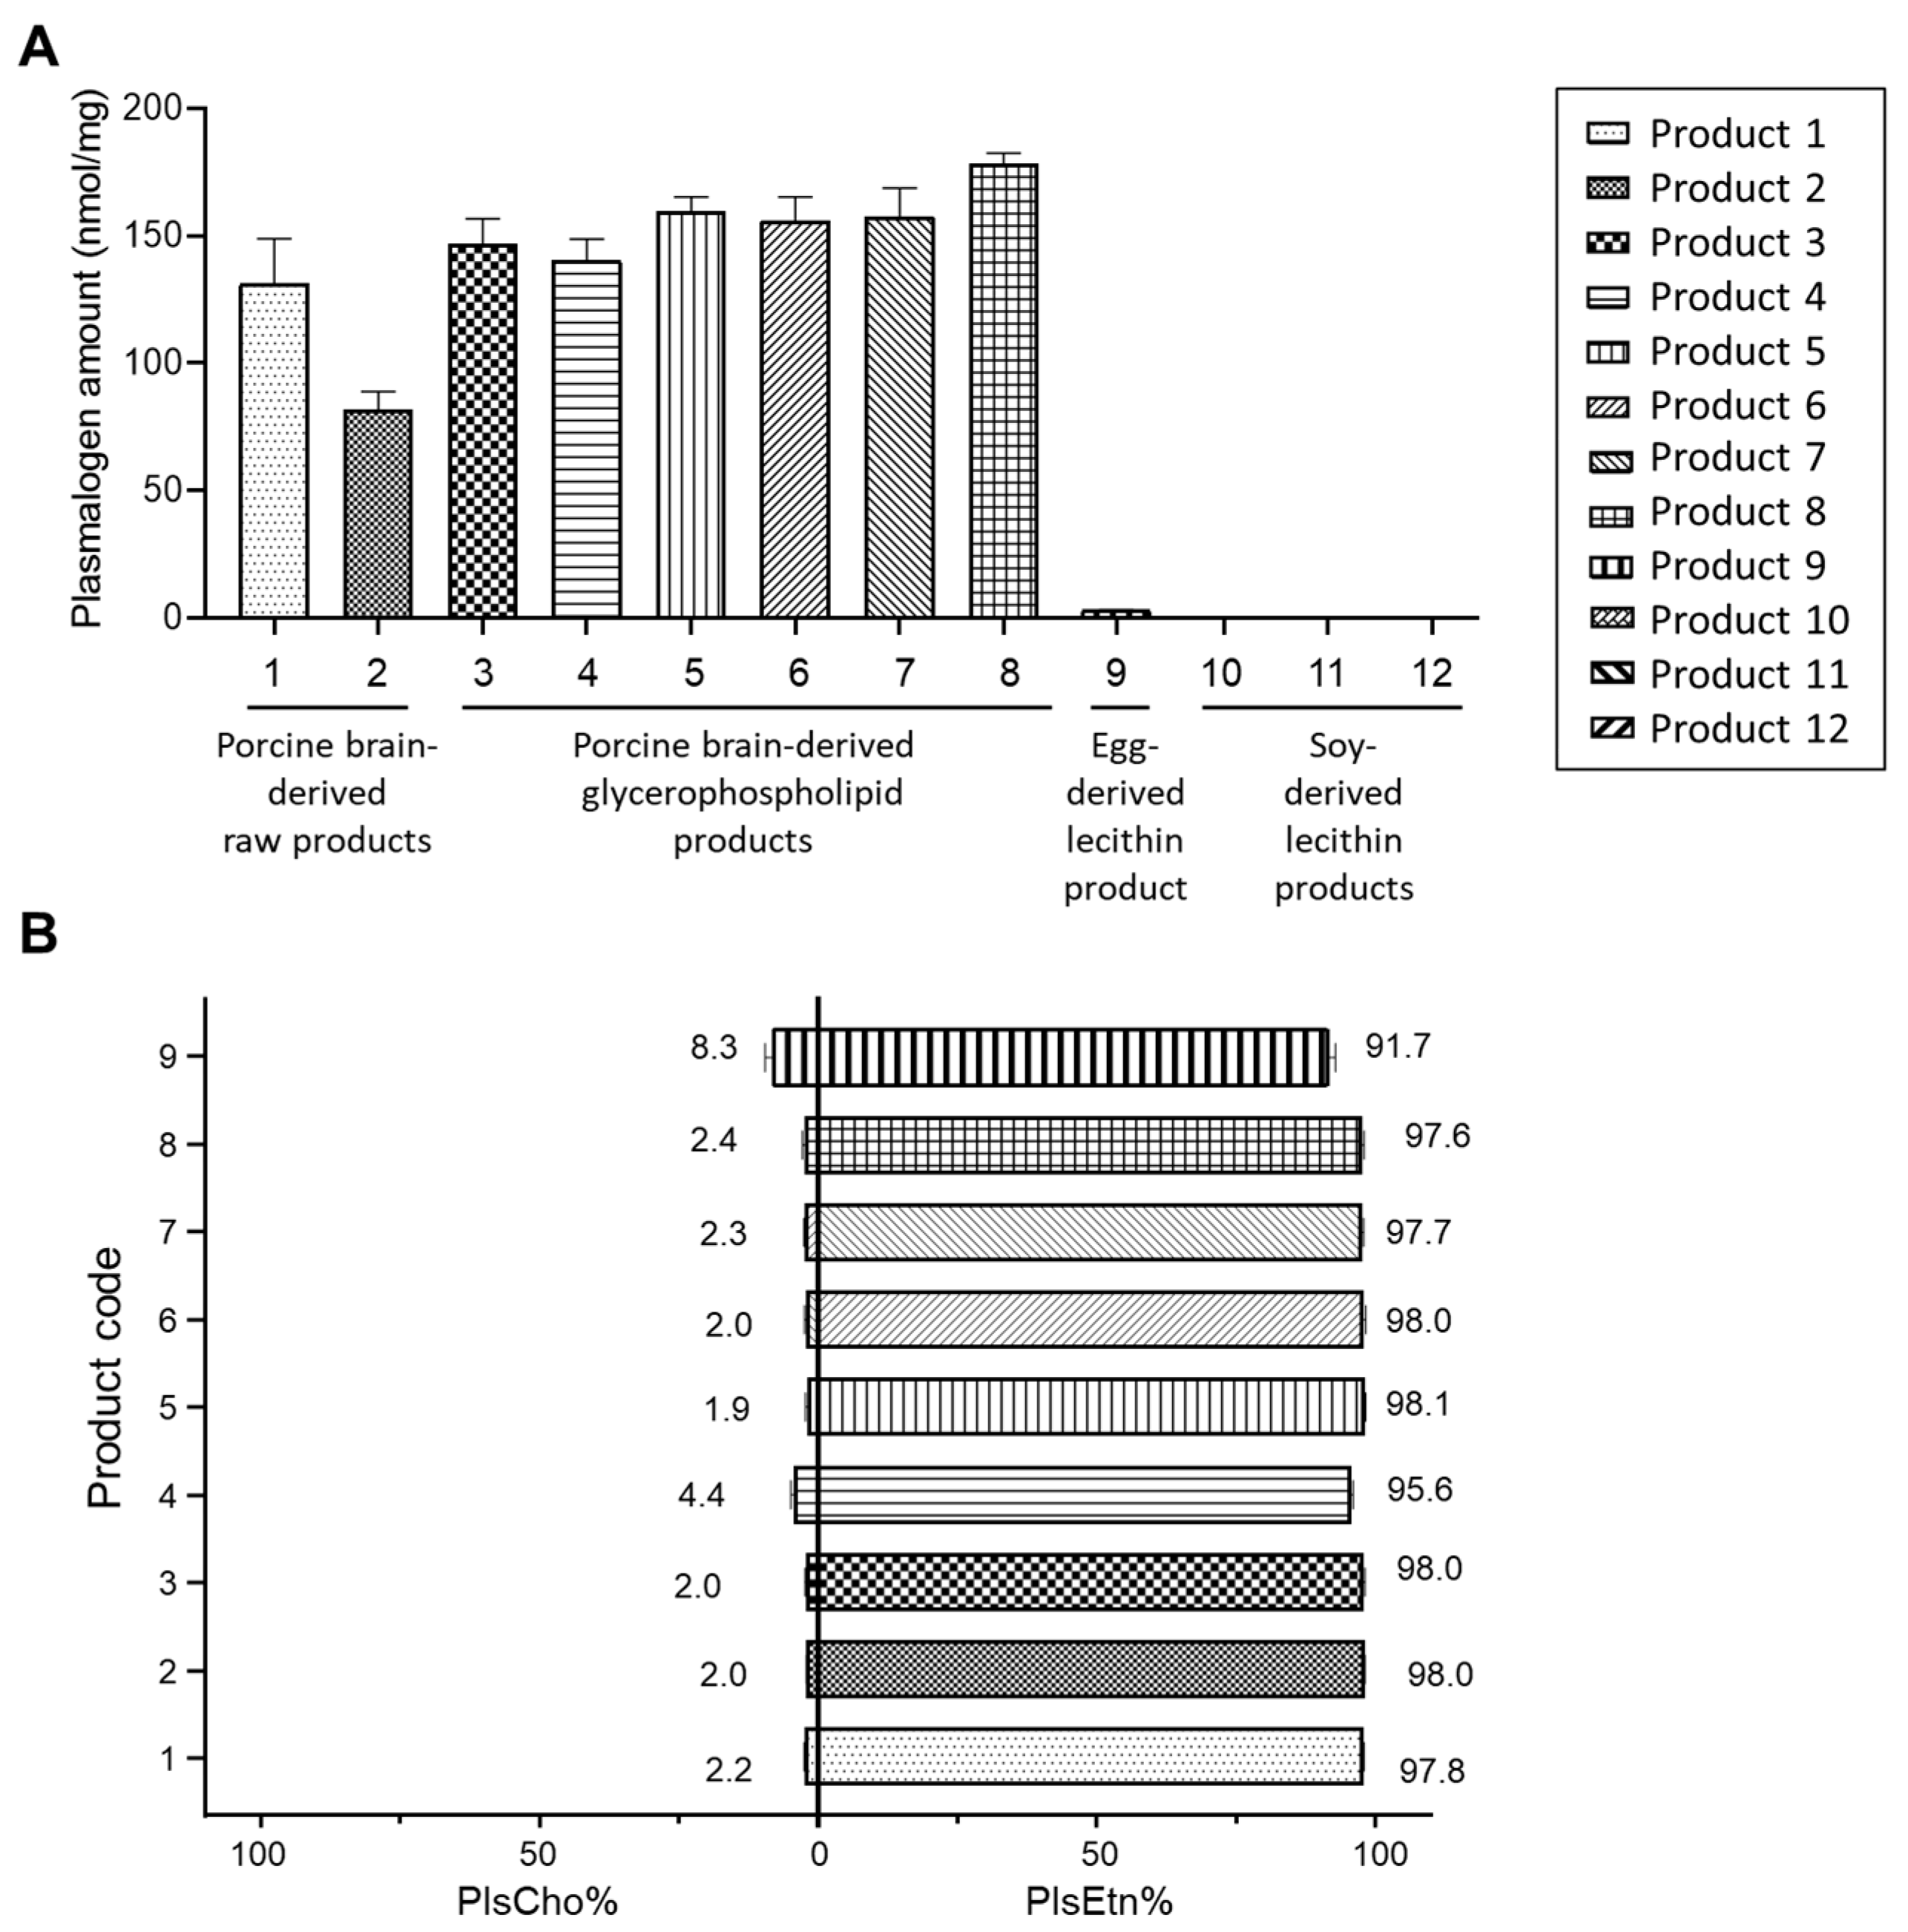
3.1. Characteristics and Residual Solvents of the Porcine Brain Products
3.2. LC-MS/MS Analysis and Identification of Plasmalogen Species
3.3. Comparison of Plasmalogen Amount
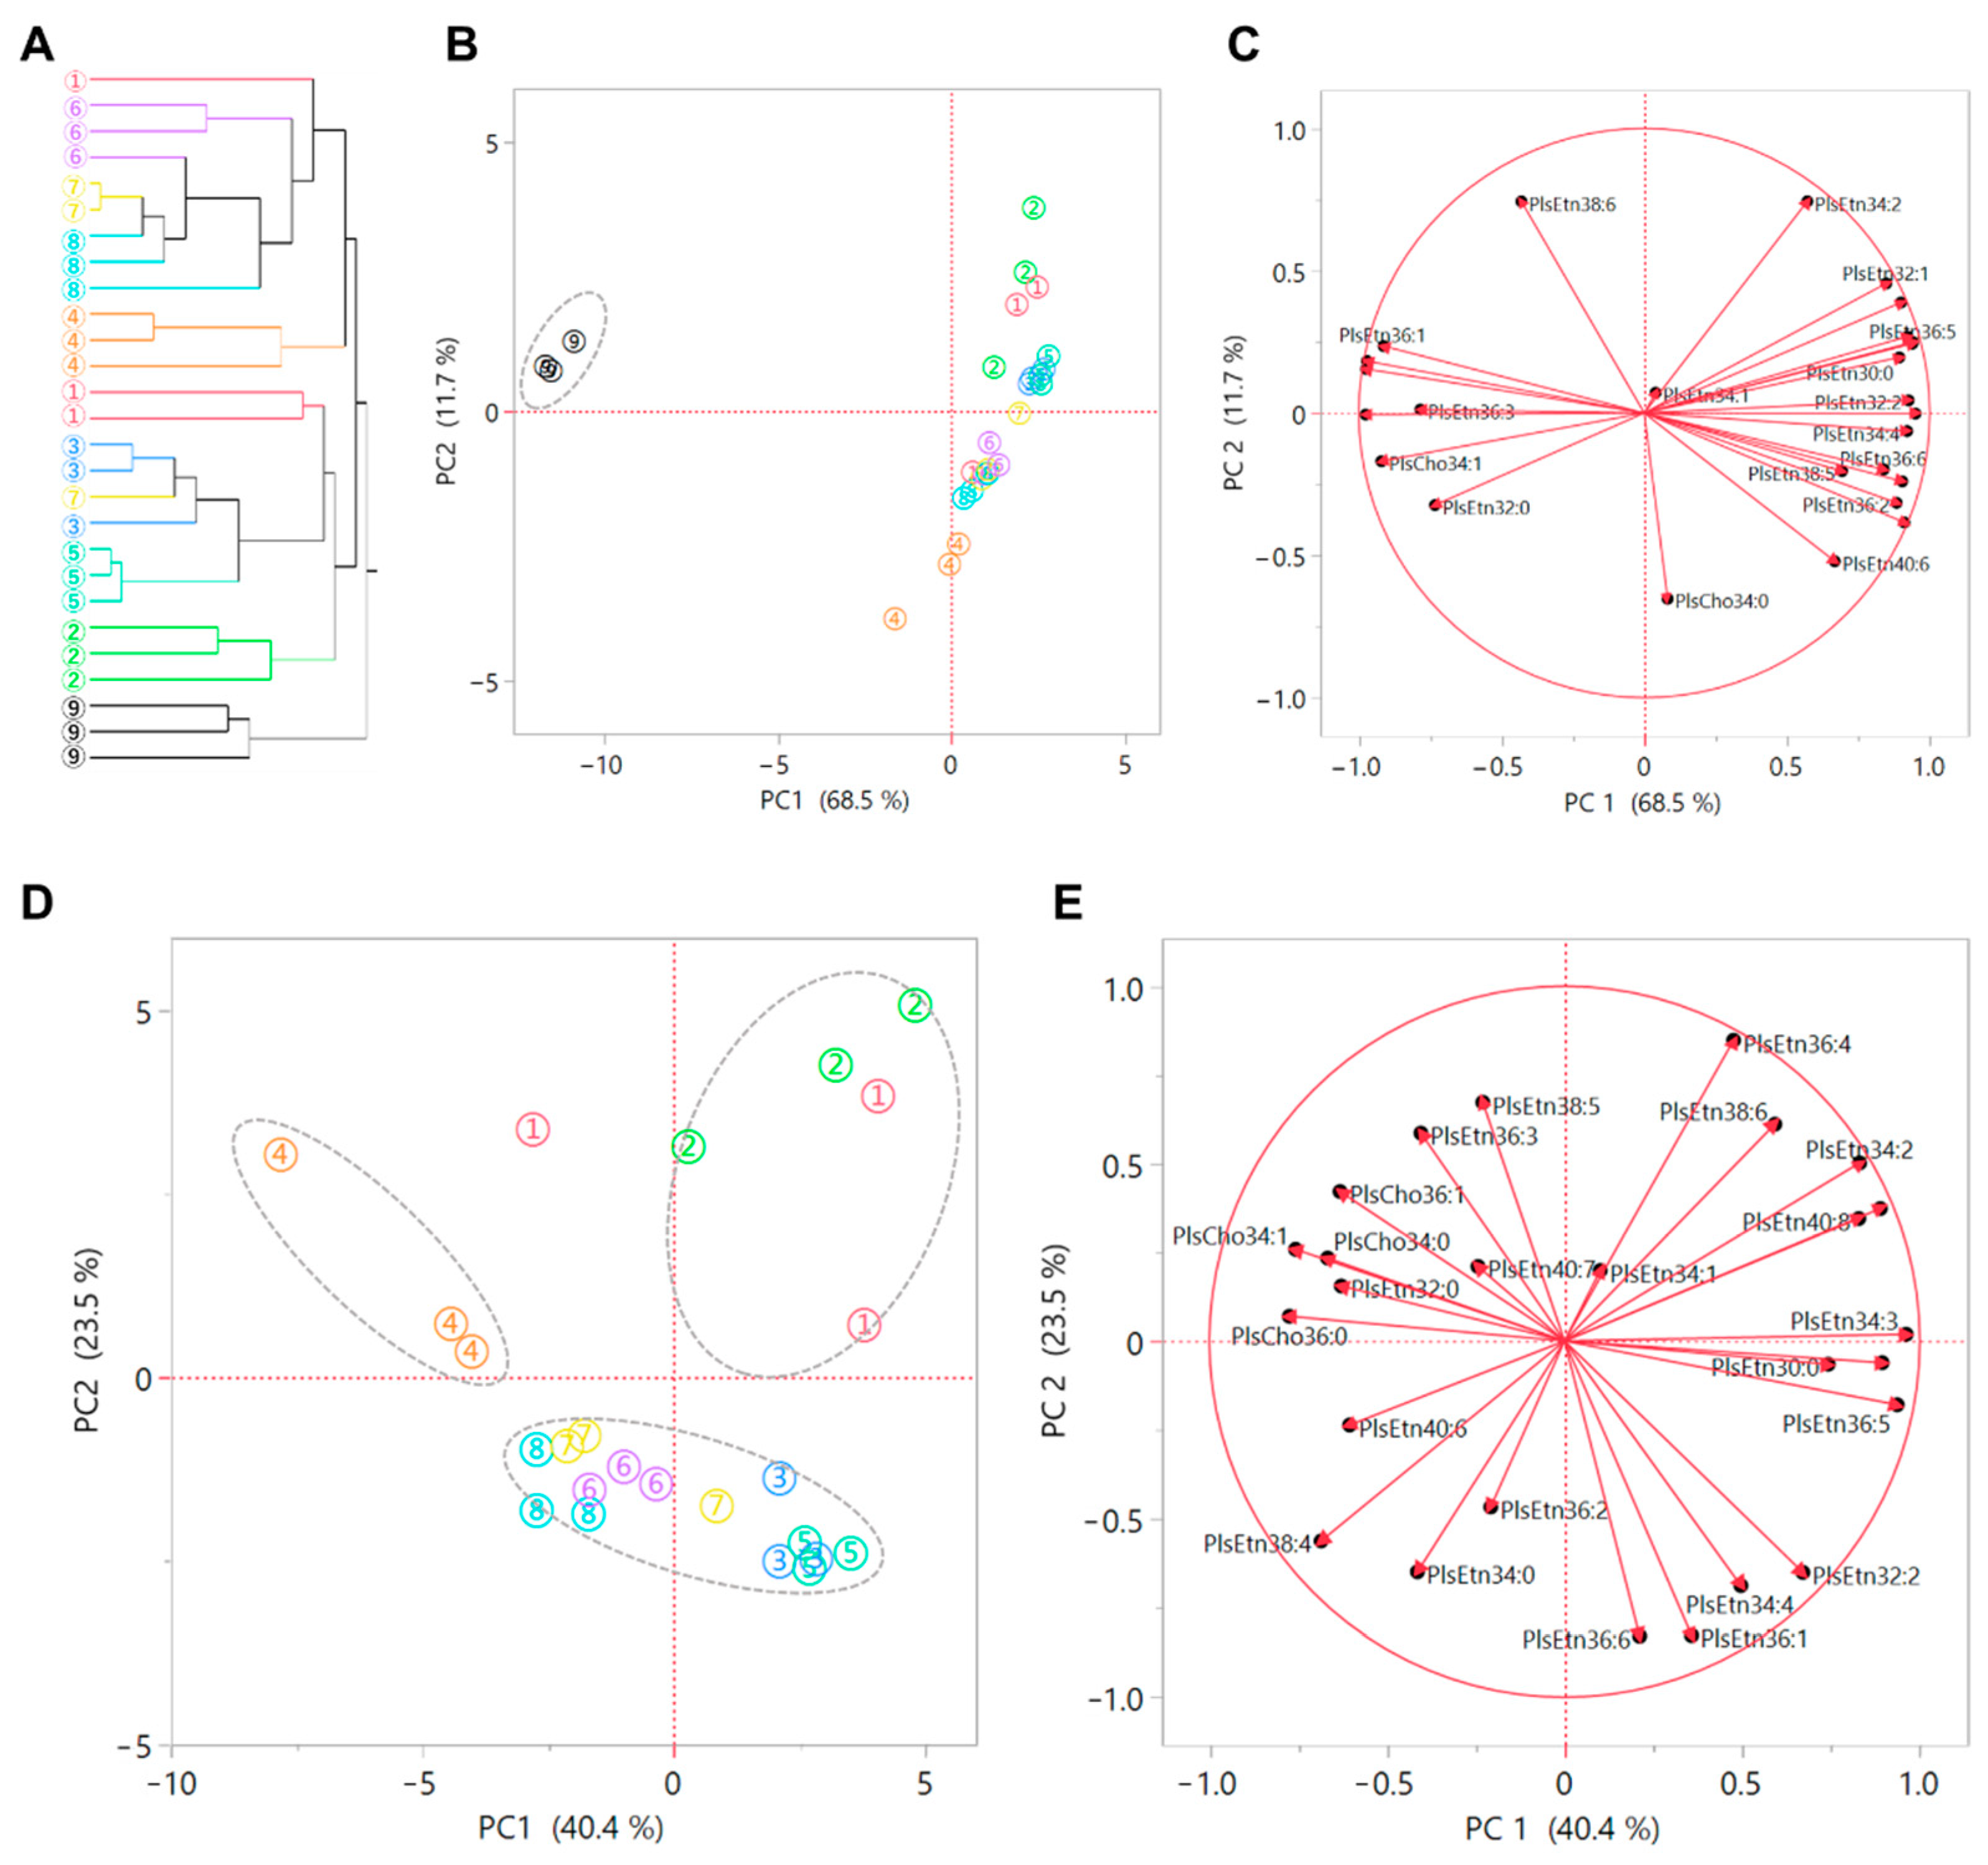
3.4. Characteristics of Plasmalogen Profile
3.5. Nutritional Assessment of Porcine Brain Plasmalogens
4. Conclusions
Supplementary Materials
Author Contributions
Funding
Data Availability Statement
Acknowledgments
Conflicts of Interest
References
- Brites, P.; Waterham, H.R.; Wanders, R.J.A. Functions and biosynthesis of plasmalogens in health and disease. Biochim. Biophys. Acta Mol. Cell Biol. Lipids 2004, 1636, 219–231. [Google Scholar] [CrossRef]
- Braverman, N.E.; Moser, A.B. Functions of plasmalogen lipids in health and disease. Biochim. Biophys. Acta Mol. Basis Dis. 2012, 1822, 1442–1452. [Google Scholar] [CrossRef] [PubMed] [Green Version]
- Luoma, A.M.; Kuo, F.; Cakici, O.; Crowther, M.N.; Denninger, A.R.; Avila, R.L.; Brites, P.; Kirschner, D.A. Plasmalogen phospholipids protect internodal myelin from oxidative damage. Free Radic. Biol. Med. 2015, 84, 296–310. [Google Scholar] [CrossRef] [PubMed]
- Wu, Y.; Chen, Z.; Darwish, W.S.; Terada, K.; Chiba, H.; Hui, S.-P. Choline and Ethanolamine Plasmalogens Prevent Lead-Induced Cytotoxicity and Lipid Oxidation in HepG2 Cells. J. Agric. Food Chem. 2019, 67, 7716–7725. [Google Scholar] [CrossRef]
- Bozelli, J.C.; Lu, D.; Atilla-Gokcumen, G.E.; Epand, R.M. Promotion of plasmalogen biosynthesis reverse lipid changes in a Barth Syndrome cell model. Biochim. Biophys. Acta Mol. Cell Biol. Lipids 2020, 1865, 158677. [Google Scholar] [CrossRef] [PubMed]
- Sejimo, S.; Hossain, M.S.; Akashi, K. Scallop-derived plasmalogens attenuate the activation of PKCδ associated with the brain inflammation. Biochem. Biophys. Res. Commun. 2018, 503, 837–842. [Google Scholar] [CrossRef] [PubMed]
- Yamashita, S.; Kanno, S.; Honjo, A.; Otoki, Y.; Nakagawa, K.; Kinoshita, M.; Miyazawa, T. Analysis of Plasmalogen Species in Foodstuffs. Lipids 2016, 51, 199–210. [Google Scholar] [CrossRef]
- Garcia, C.; Lutz, N.W.; Confort-Gouny, S.; Cozzone, P.J.; Armand, M.; Bernard, M. Phospholipid fingerprints of milk from different mammalians determined by31P NMR: Towards specific interest in human health. Food Chem. 2012, 135, 1777–1783. [Google Scholar] [CrossRef] [Green Version]
- Fujino, T.; Yamada, T.; Asada, T.; Tsuboi, Y.; Wakana, C.; Mawatari, S.; Kono, S. Efficacy and Blood Plasmalogen Changes by Oral Administration of Plasmalogen in Patients with Mild Alzheimer’s Disease and Mild Cognitive Impairment: A Multicenter, Randomized, Double-blind, Placebo-controlled Trial. eBioMedicine 2017, 17, 199–205. [Google Scholar] [CrossRef] [Green Version]
- Nguma, E.; Yamashita, S.; Han, K.-H.; Otoki, Y.; Yamamoto, A.; Nakagawa, K.; Fukushima, M.; Miyazawa, T.; Kinoshita, M. Dietary Ethanolamine Plasmalogen Alleviates DSS-Induced Colitis by Enhancing Colon Mucosa Integrity, Antioxidative Stress, and Anti-inflammatory Responses via Increased Ethanolamine Plasmalogen Molecular Species: Protective Role of Vinyl Ether Linkages. J. Agric. Food Chem. 2021, 69, 13034–13044. [Google Scholar] [CrossRef]
- Hossain, M.S.; Tajima, A.; Kotoura, S.; Katafuchi, T. Oral ingestion of plasmalogens can attenuate the LPS-induced memory loss and microglial activation. Biochem. Biophys. Res. Commun. 2018, 496, 1033–1039. [Google Scholar] [CrossRef]
- Wu, Y.; Chen, Z.; Jia, J.; Chiba, H.; Hui, S. Quantitative and Comparative Investigation of Plasmalogen Species in Daily Foodstuffs. Foods 2021, 10, 124. [Google Scholar] [CrossRef] [PubMed]
- Toldrá, F.; Aristoy, M.-C.; Mora, L.; Reig, M. Innovations in value-addition of edible meat by-products. Meat Sci. 2012, 92, 290–296. [Google Scholar] [CrossRef] [PubMed]
- Chanted, J.; Panpipat, W.; Panya, A.; Phonsatta, N.; Cheong, L.-Z.; Chaijan, M. Compositional Features and Nutritional Value of Pig Brain: Potential and Challenges as a Sustainable Source of Nutrients. Foods 2021, 10, 2943. [Google Scholar] [CrossRef]
- Intarasirisawat, R.; Benjakul, S.; Visessanguan, W. Chemical compositions of the roes from skipjack, tongol and bonito. Food Chem. 2011, 124, 1328–1334. [Google Scholar] [CrossRef]
- Chen, Z.; Jia, J.; Wu, Y.; Chiba, H.; Hui, S.-P. LC/MS analysis of storage-induced plasmalogen loss in ready-to-eat fish. Food Chem. 2022, 383, 132320. [Google Scholar] [CrossRef]
- Wu, Y.; Chen, Z.; Chiba, H.; Hui, S.-P. Plasmalogen fingerprint alteration and content reduction in beef during boiling, roasting, and frying. Food Chem. 2020, 322, 126764. [Google Scholar] [CrossRef]
- Chang, N.W.; Huang, P.C. Effects of the ratio of polyunsaturated and monounsaturated fatty acid to saturated fatty acid on rat plasma and liver lipid concentrations. Lipids 1998, 33, 481–487. [Google Scholar] [CrossRef]
- Ulbricht, T.L.V.; Southgate, D.A.T. Coronary heart disease: Seven dietary factors. Lancet 1991, 338, 985–992. [Google Scholar] [CrossRef]
- Logue, J.A.; de Vries, A.L.; Fodor, E.; Cossins, A.R. Lipid compositional correlates of temperature-adaptive interspecific differences in membrane physical structure. J. Exp. Biol. 2000, 203, 2105–2115. [Google Scholar] [CrossRef] [PubMed]
- ICH Guideline Q3C (R8) on Impurities: Guideline for Residual Solvents. Available online: https://www.ich.org/page/quality-guidelines (accessed on 19 July 2023).
- Hsu, F.-F.; Turk, J. Differentiation of 1-O-alk-1′-enyl-2-acyl and 1-O-alkyl-2-acyl glycerophospholipids by multiple-stage linear ion-trap mass spectrometry with electrospray ionization. J. Am. Soc. Mass Spectrom. 2007, 18, 2065–2073. [Google Scholar] [CrossRef] [PubMed] [Green Version]
- Hui, S.-P.; Chiba, H.; Kurosawa, T. Liquid chromatography-mass spectrometric determination of plasmalogens in human plasma. Anal. Bioanal. Chem. 2011, 400, 1923–1931. [Google Scholar] [CrossRef] [PubMed]
- Han, X.; Holtzman, D.M.; McKeel, D.W. Plasmalogen deficiency in early Alzheimer’s disease subjects and in animal models: Molecular characterization using electrospray ionization mass spectrometry. J. Neurochem. 2001, 77, 1168–1180. [Google Scholar] [CrossRef] [PubMed]
- Koch, J.; Lackner, K.; Wohlfarter, Y.; Sailer, S.; Zschocke, J.; Werner, E.R.; Watschinger, K.; Keller, M.A. Unequivocal Mapping of Molecular Ether Lipid Species by LC–MS/MS in Plasmalogen-Deficient Mice. Anal. Chem. 2020, 92, 11268–11276. [Google Scholar] [CrossRef] [PubMed]
- Boselli, E.; Pacetti, D.; Lucci, P.; Frega, N.G. Characterization of Phospholipid Molecular Species in the Edible Parts of Bony Fish and Shellfish. J. Agric. Food Chem. 2012, 60, 3234–3245. [Google Scholar] [CrossRef]
- Lever, J.; Krzywinski, M.; Altman, N. Principal component analysis. Nat. Methods 2017, 14, 641–642. [Google Scholar] [CrossRef] [Green Version]
- Alles, M.S.; Eussen, S.R.B.M.; van der Beek, E.M. Nutritional Challenges and Opportunities during the Weaning Period and in Young Childhood. Ann. Nutr. Metab. 2014, 64, 284–293. [Google Scholar] [CrossRef]


| Index | No. 1 | No. 2 | No. 3 | No. 4 | No. 5 | No. 6 | No. 7 | No. 8 |
|---|---|---|---|---|---|---|---|---|
| Acetone residue (%) | ND | ND | 0.001 | 0.003 | 0.001 | 0.003 | 0.002 | 0.002 |
| Ethanol residue (%) | ND | ND | 0.005 | 0.005 | 0.005 | 0.020 | 0.010 | 0.010 |
| Plasmalogen Species | LIMIDMAPS Nomenclature | RT (min) | High-Resolution MS1 Signals | MS/MS Signals | ||||
|---|---|---|---|---|---|---|---|---|
| Species Level | Molecular Species Level | Ion | Calc. m/z | Exp. m/z | Δppm | |||
| PlsEtn | ||||||||
| PlsEtn30:0 | PE P-30:0 | NA | 10.71 | [M−H]− | 646.4817 | 646.4823 | −0.93 | ND |
| PlsEtn32:0 | PE P-32:0 | NA | 11.08 | [M−H]− | 674.5130 | 674.5143 | −1.93 | ND |
| PlsEtn32:1 | PE P-32:1 | PE P-16:0/16:1 | 10.77 | [M−H]− | 672.4974 | 672.4985 | −1.64 | 253,436,418 |
| PlsEtn32:2 | PE P-32:2 | NA | 10.54 | [M−H]− | 670.4817 | 670.4827 | −1.49 | ND |
| PlsEtn33:0 | PE P-33:0 | PE P-16:0/17:0 (ISTD) | 11.25 | [M−H]− | 688.5287 | 688.5300 | −1.89 | 269,436,418 |
| PlsEtn34:0 | PE P-34:0 | NA | 11.51 | [M−H]− | 702.5443 | 702.5458 | −2.14 | ND |
| PlsEtn34:1 | PE P-34:1 | PE P-16:0/18:1 | 11.14 | [M−H]− | 700.5287 | 700.5306 | −2.71 | 281,436,418 |
| PlsEtn34:2 | PE P-34:2 | PE P-16:0/18:2 | 10.85 | [M−H]− | 698.5130 | 698.5153 | −3.29 | 279,436,418 |
| PlsEtn34:3 | PE P-34:3 | NA | 10.60 | [M−H]− | 696.4974 | 696.4990 | −2.30 | ND |
| PlsEtn34:4 | PE P-34:4 | NA | 10.54 | [M−H]− | 694.4817 | 694.4812 | 0.72 | ND |
| PlsEtn36:1 | PE P-36:1 | PE P-18:0/18:1 | 11.59 | [M−H]− | 728.5600 | 728.5611 | −1.51 | 281,464,446 |
| PlsEtn36:2 | PE P-36:2 | PE P-18:1/18:1 | 11.22 | [M−H]− | 726.5443 | 726.5464 | −2.89 | 281,462,444 |
| PlsEtn36:3 | PE P-36:3 | PE P-16:0/20:3 PE P-18:1/18:2 | 11.11 | [M−H]− | 724.5287 | 724.531 | −3.17 | 305,436,418 279,462,444 |
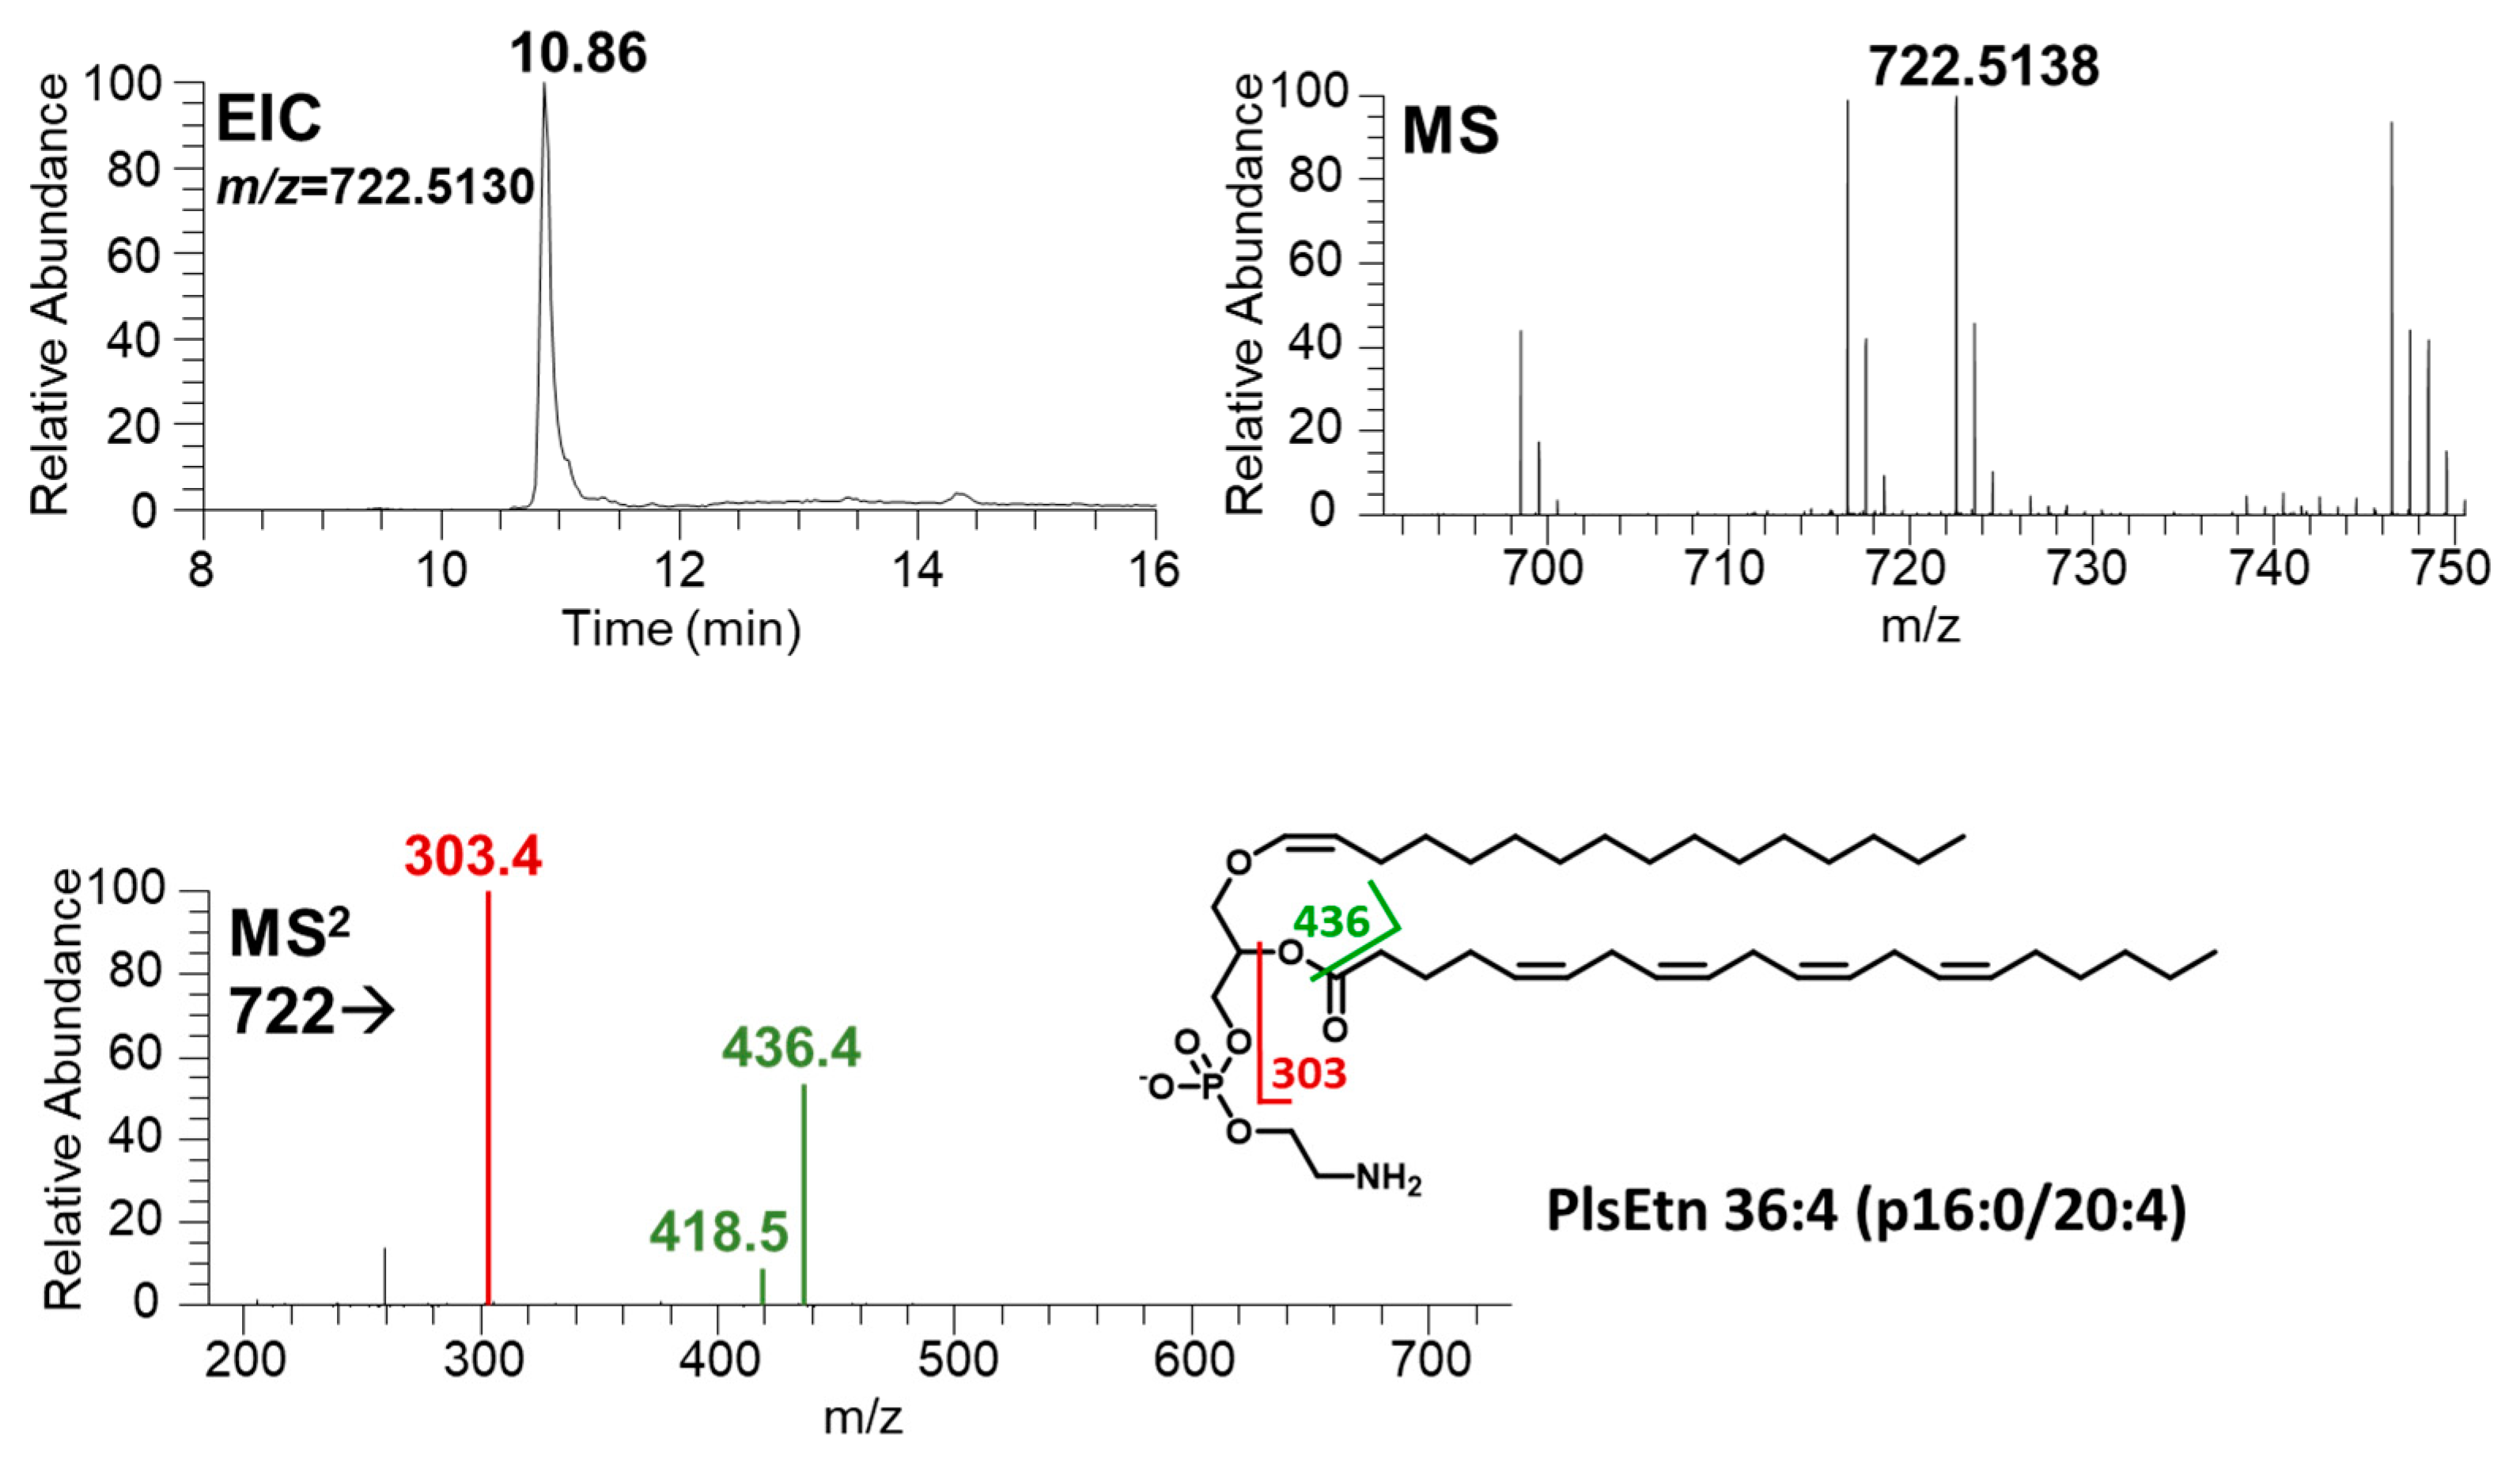
| PlsEtn36:4 | PE P-36:4 | PE P-16:0/20:4 | 10.88 | [M−H]− | 722.5130 | 722.5130 | 0.00 | 303,436,418 |
| PlsEtn36:5 | PE P-36:5 | PE P-16:0/20:5 | 10.54 | [M−H]− | 720.4974 | 720.4975 | −0.14 | 301,436,418 |
| PlsEtn36:6 | PE P-36:6 | NA | 10.54 | [M−H]− | 718.4817 | 718.4816 | 0.14 | ND |
| PlsEtn38:4 | PE P-38:4 | PE P-18:0/20:4 PE P-16:0/22:4 | 11.30 | [M−H]− | 750.5443 | 750.5421 | 2.93 | 303,464,446 331,436,418 |
| PlsEtn38:5 | PE P-38:5 | PE P-18:1/20:4 | 10.96 | [M−H]− | 748.5287 | 748.5265 | 2.94 | 303,462,444 |
| PlsEtn38:6 | PE P-38:6 | PE P-18:2/20:4 PE P-16:0/22:6 | 10.85 | [M−H]− | 746.5130 | 746.5110 | 2.68 | 303,460,442 327,436,418 |
| PlsEtn38:7 | PE P-38:7 | NA | 10.60 | [M−H]− | 744.4974 | 744.4978 | −0.54 | ND |
| PlsEtn40:6 | PE P-40:6 | PE P-18:0/22:6 | 11.25 | [M−H]− | 774.5443 | 774.5421 | 2.84 | 327,464,446 |
| PlsEtn40:7 | PE P-40:7 | PE P-18:1/22:6 | 10.91 | [M−H]− | 772.5287 | 772.5281 | 0.78 | 327,462,444 |
| PlsEtn40:8 | PE P-40:8 | NA | 10.71 | [M−H]− | 770.5130 | 770.5124 | 0.78 | ND |
| PlsCho | ||||||||
| PlsCho33:0 | PC P-33:0 | PC P-16:0/17:0 (ISTD) | 11.01 | [M+CH3COO]− | 790.5967 | 790.5959 | 1.01 | 269,464,716 |
| PlsCho34:0 | PC P-34:0 | PC P-16:0/18:0 | 11.28 | [M+CH3COO]− | 804.6124 | 804.6118 | 0.75 | 283,464,730 |
| PlsCho34:1 | PC P-34:1 | PC P-16:0/18:1 | 11.22 | [M+CH3COO]− | 802.5967 | 802.5958 | 1.12 | 281,464,728 |
| PlsCho36:0 | PC P-36:0 | PC P-18:0/18:0 | 11.85 | [M+CH3COO]− | 832.6437 | 832.6443 | −0.72 | 283,492,758 |
| PlsCho36:1 | PC P-36:1 | PC P-18:0/18:1 | 11.48 | [M+CH3COO]− | 830.6280 | 830.6282 | −0.24 | 281,492,756 |
| Sample Code | ||||||||||||||||||
|---|---|---|---|---|---|---|---|---|---|---|---|---|---|---|---|---|---|---|
| 1 | 2 | 3 | 4 | 5 | 6 | 7 | 8 | 9 | ||||||||||
| Etn | Cho | Etn | Cho | Etn | Cho | Etn | Cho | Etn | Cho | Etn | Cho | Etn | Cho | Etn | Cho | Etn | Cho | |
| 16:1 | 2.01 | ND | 2.40 | ND | 1.83 | ND | 1.31 | ND | 1.95 | ND | 1.51 | ND | 1.53 | ND | 1.36 | ND | 0.29 | ND |
| 18:0 | ND | 76.07 | ND | 77.86 | ND | 80.97 | ND | 75.30 | ND | 81.50 | ND | 79.31 | ND | 80.57 | ND | 78.28 | ND | 44.64 |
| 18:1 | 45.45 | 23.93 | 41.12 | 22.14 | 45.66 | 19.03 | 44.13 | 24.70 | 45.95 | 18.50 | 45.39 | 20.69 | 44.80 | 19.43 | 45.69 | 21.72 | 56.06 | 55.36 |
| 18:2 | 3.05 | ND | 3.31 | ND | 2.98 | ND | 2.76 | ND | 2.91 | ND | 2.82 | ND | 2.83 | ND | 2.76 | ND | 2.92 | ND |
| 20:3 | 0.62 | ND | 0.63 | ND | 0.60 | ND | 0.64 | ND | 0.58 | ND | 0.63 | ND | 0.61 | ND | 0.61 | ND | 0.76 | ND |
| 20:4 | 27.22 | ND | 27.56 | ND | 25.29 | ND | 26.49 | ND | 24.79 | ND | 25.51 | ND | 25.76 | ND | 25.29 | ND | 17.78 | ND |
| 20:5 | 0.32 | ND | 0.31 | ND | 0.36 | ND | 0.22 | ND | 0.37 | ND | 0.26 | ND | 0.28 | ND | 0.24 | ND | ND | ND |
| 22:4 | 6.46 | ND | 6.66 | ND | 6.92 | ND | 7.24 | ND | 6.90 | ND | 7.11 | ND | 7.15 | ND | 7.31 | ND | 3.66 | ND |
| 22:6 | 13.90 | ND | 16.93 | ND | 15.06 | ND | 16.10 | ND | 15.27 | ND | 15.63 | ND | 15.91 | ND | 15.70 | ND | 13.55 | ND |
| Others | 0.97 | ND | 1.08 | ND | 1.30 | ND | 1.11 | ND | 1.29 | ND | 1.13 | ND | 1.12 | ND | 1.03 | ND | 4.97 | ND |
| Index | Sample Code | ||||||||
|---|---|---|---|---|---|---|---|---|---|
| 1 | 2 | 3 | 4 | 5 | 6 | 7 | 8 | 9 | |
| ΣSFA | 0.017 ± 0.001 | 0.015 ± 0.001 | 0.017 ± 0.002 | 0.033 ± 0.002 | 0.016 ± 0.002 | 0.016 ± 0.004 | 0.018 ± 0.002 | 0.018 ± 0.002 | 0.037 ± 0.005 |
| ΣMUFA | 0.469 ± 0.029 | 0.431 ± 0.001 | 0.469 ± 0.004 | 0.445 ± 0.002 | 0.473 ± 0.003 | 0.464 ± 0.009 | 0.457 ± 0.003 | 0.465 ± 0.010 | 0.563 ± 0.003 |
| ΣPUFA | 0.504 ± 0.028 | 0.543 ± 0.002 | 0.502 ± 0.003 | 0.511 ± 0.002 | 0.498 ± 0.002 | 0.509 ± 0.008 | 0.514 ± 0.005 | 0.507 ± 0.011 | 0.355 ± 0.006 |
| ΣPUFA/ΣSFA | 30.0 ± 1.6 | 35.8 ± 2.6 | 30.7 ± 3.5 | 15.6 ± 1.1 | 31.9 ± 4.0 | 32.4 ± 6.6 | 28.3 ± 2.7 | 27.7 ± 3.3 | 9.7 ± 1.4 |
| n-6/n-3 | 2.58 ± 0.10 | 2.18 ± 0.02 | 2.28 ± 0.02 | 2.24 ± 0.06 | 2.21 ± 0.01 | 2.23 ± 0.02 | 2.21 ± 0.01 | 2.22 ± 0.01 | 1.80 ± 0.04 |
| IT | 0.014 ± 0.001 | 0.011 ± 0.001 | 0.013 ± 0.002 | 0.025 ± 0.002 | 0.012 ± 0.001 | 0.012 ± 0.003 | 0.014 ± 0.001 | 0.014 ± 0.001 | 0.028 ± 0.004 |
| UI | 270 ± 9 | 287 ± 1 | 271 ± 1 | 274 ± 1 | 271 ± 0 | 275 ± 3 | 276 ± 2 | 274 ± 4 | 217 ± 3 |
| EPA + DHA | 18.2 ± 2.0 | 13.8 ± 1.2 | 22.2 ± 1.5 | 21.9 ± 1.7 | 24.5 ± 0.9 | 24.3 ± 1.6 | 25.0 ± 2.0 | 27.7 ± 1.1 | 0.4 ± 0.0 |
Disclaimer/Publisher’s Note: The statements, opinions and data contained in all publications are solely those of the individual author(s) and contributor(s) and not of MDPI and/or the editor(s). MDPI and/or the editor(s) disclaim responsibility for any injury to people or property resulting from any ideas, methods, instructions or products referred to in the content. |
© 2023 by the authors. Licensee MDPI, Basel, Switzerland. This article is an open access article distributed under the terms and conditions of the Creative Commons Attribution (CC BY) license (https://creativecommons.org/licenses/by/4.0/).
Share and Cite
Wu, Y.; Chen, Y.; Zhang, M.; Chiba, H.; Hui, S.-P. Plasmalogen Profiling in Porcine Brain Tissues by LC-MS/MS. Foods 2023, 12, 2990. https://doi.org/10.3390/foods12162990
Wu Y, Chen Y, Zhang M, Chiba H, Hui S-P. Plasmalogen Profiling in Porcine Brain Tissues by LC-MS/MS. Foods. 2023; 12(16):2990. https://doi.org/10.3390/foods12162990
Chicago/Turabian StyleWu, Yue, Yifan Chen, Min Zhang, Hitoshi Chiba, and Shu-Ping Hui. 2023. "Plasmalogen Profiling in Porcine Brain Tissues by LC-MS/MS" Foods 12, no. 16: 2990. https://doi.org/10.3390/foods12162990