
Non-Targeted Detection and Quantification of Food Adulteration of High-Quality Stingless Bee Honey (SBH) via a Portable LED-Based Fluorescence Spectroscopy


Abstract
:1. Introduction
2. Materials and Methods
2.1. Stingless Bee Honey (SBH) Samples
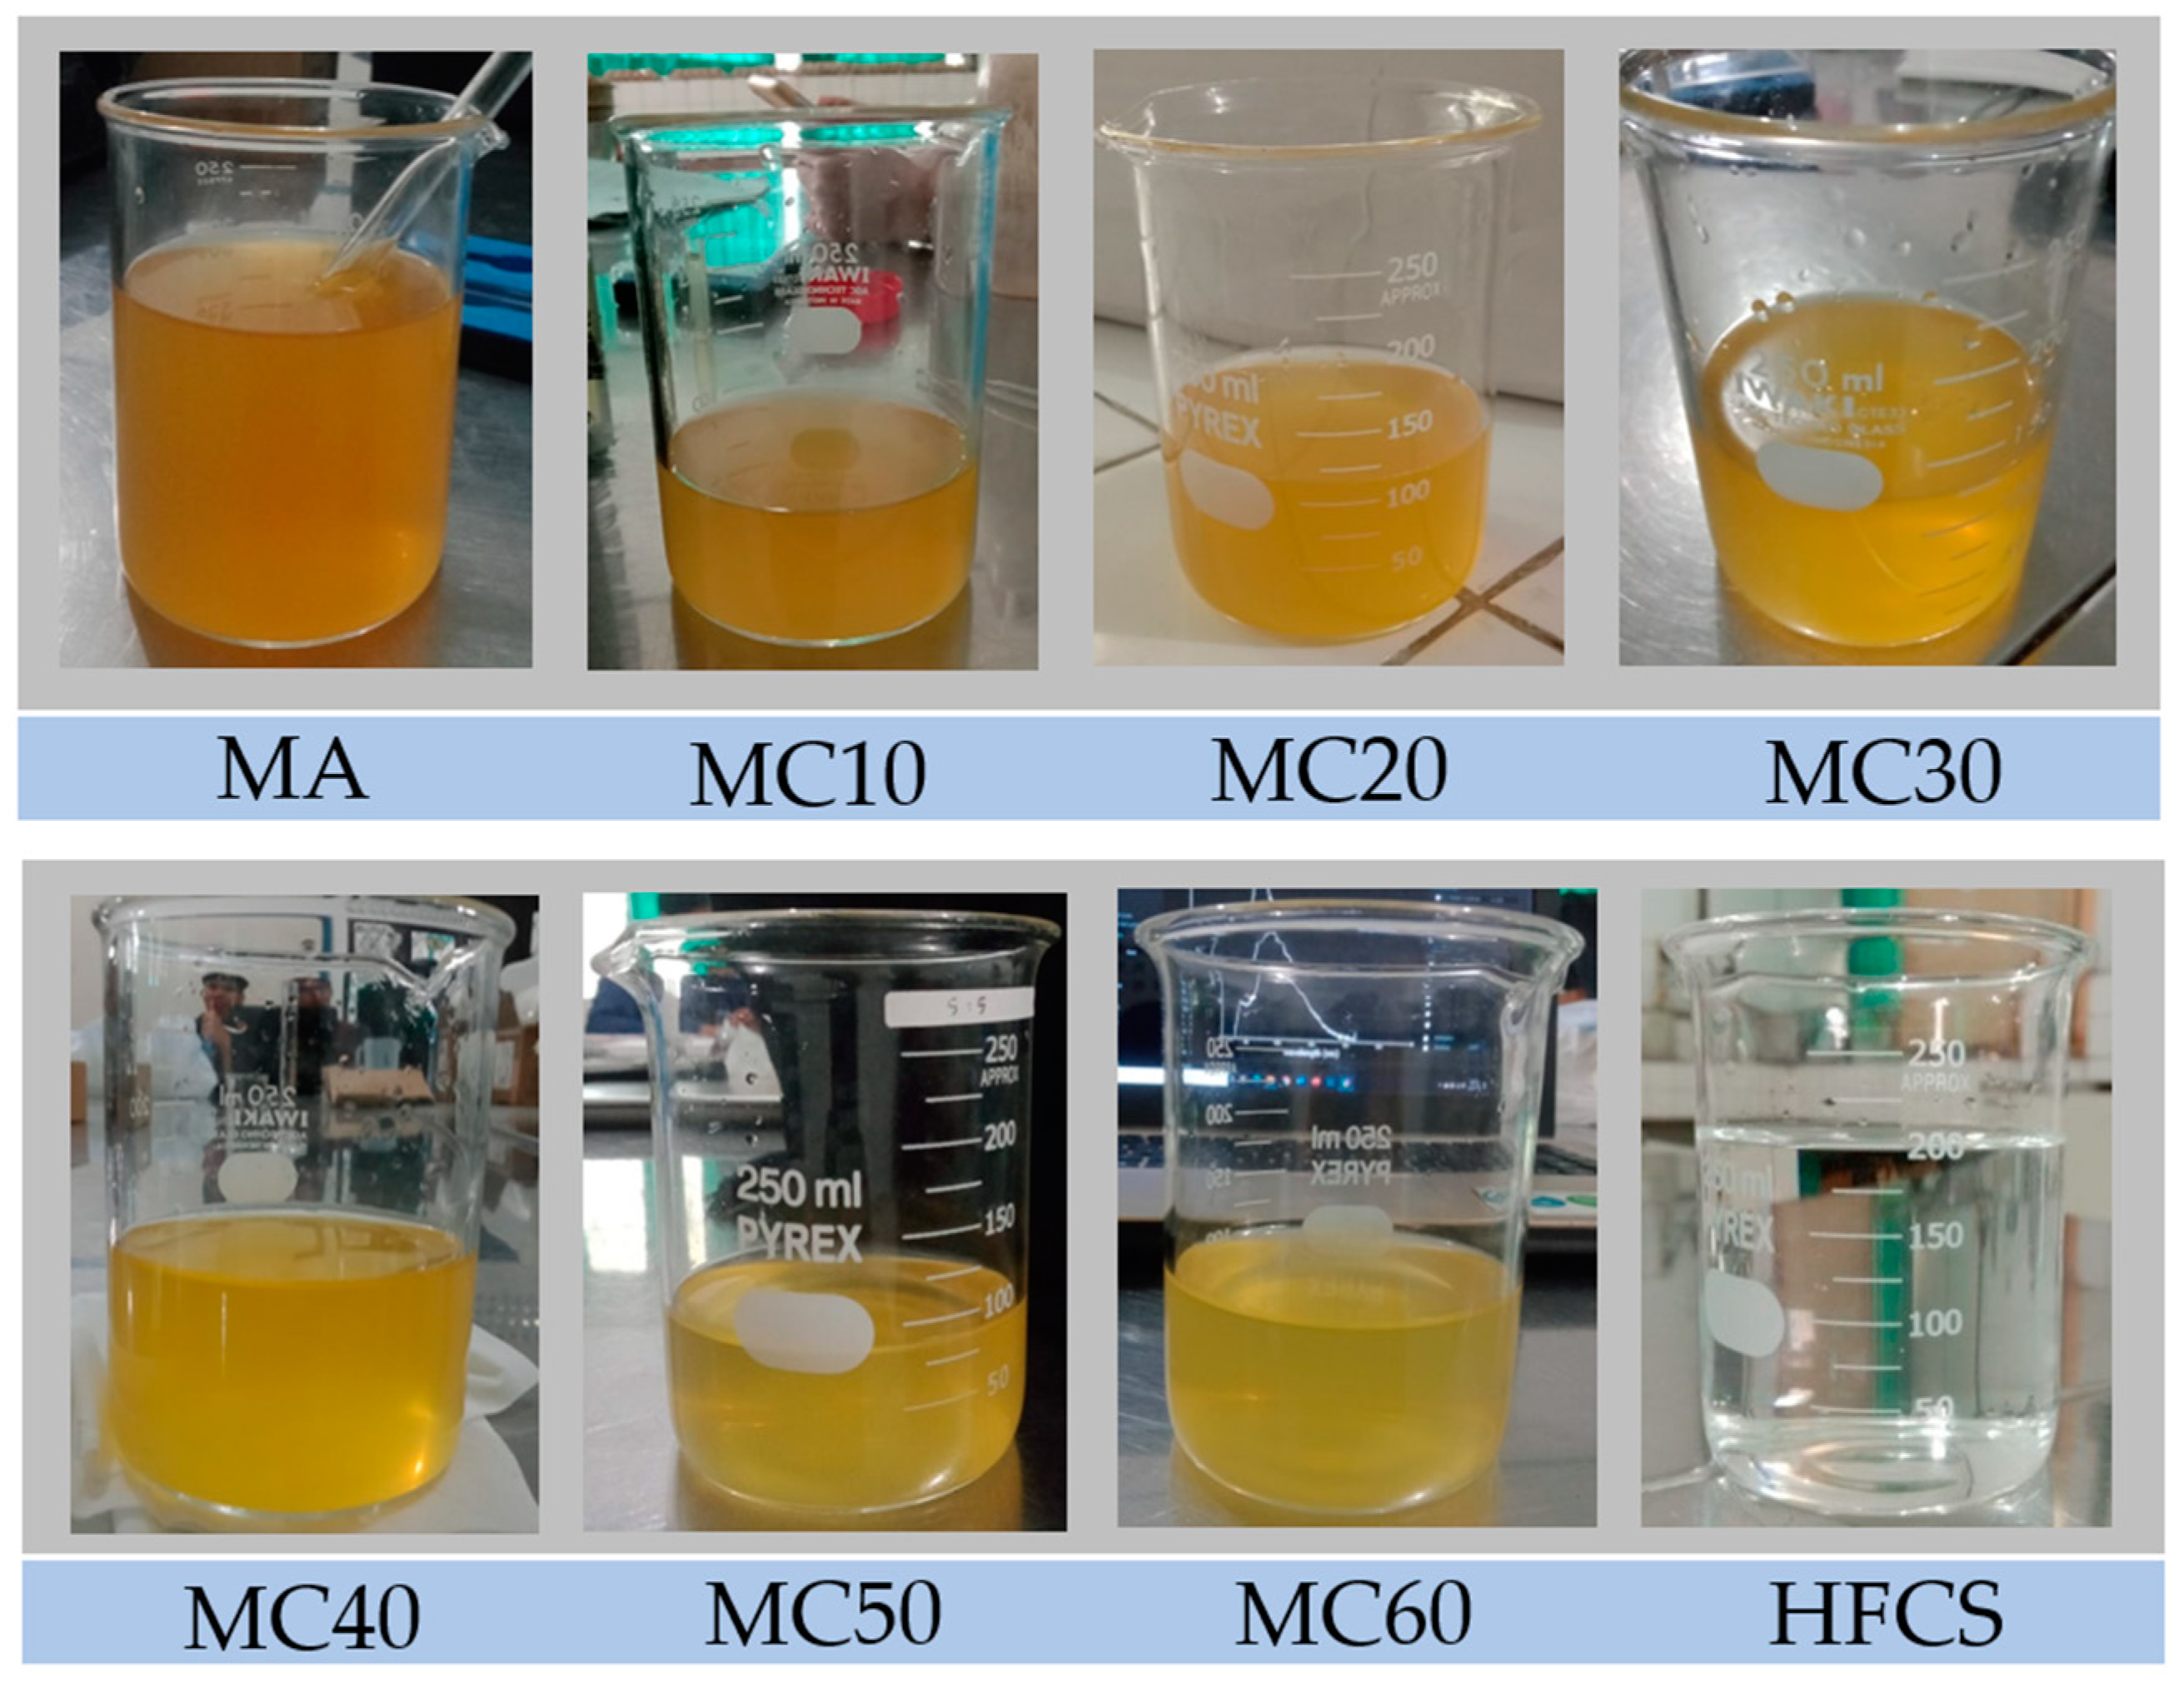
2.2. Sample Preparation
2.3. Fluorescence Spectral Data Acquisition
2.4. Chemometric Analysis
3. Results and Discussion
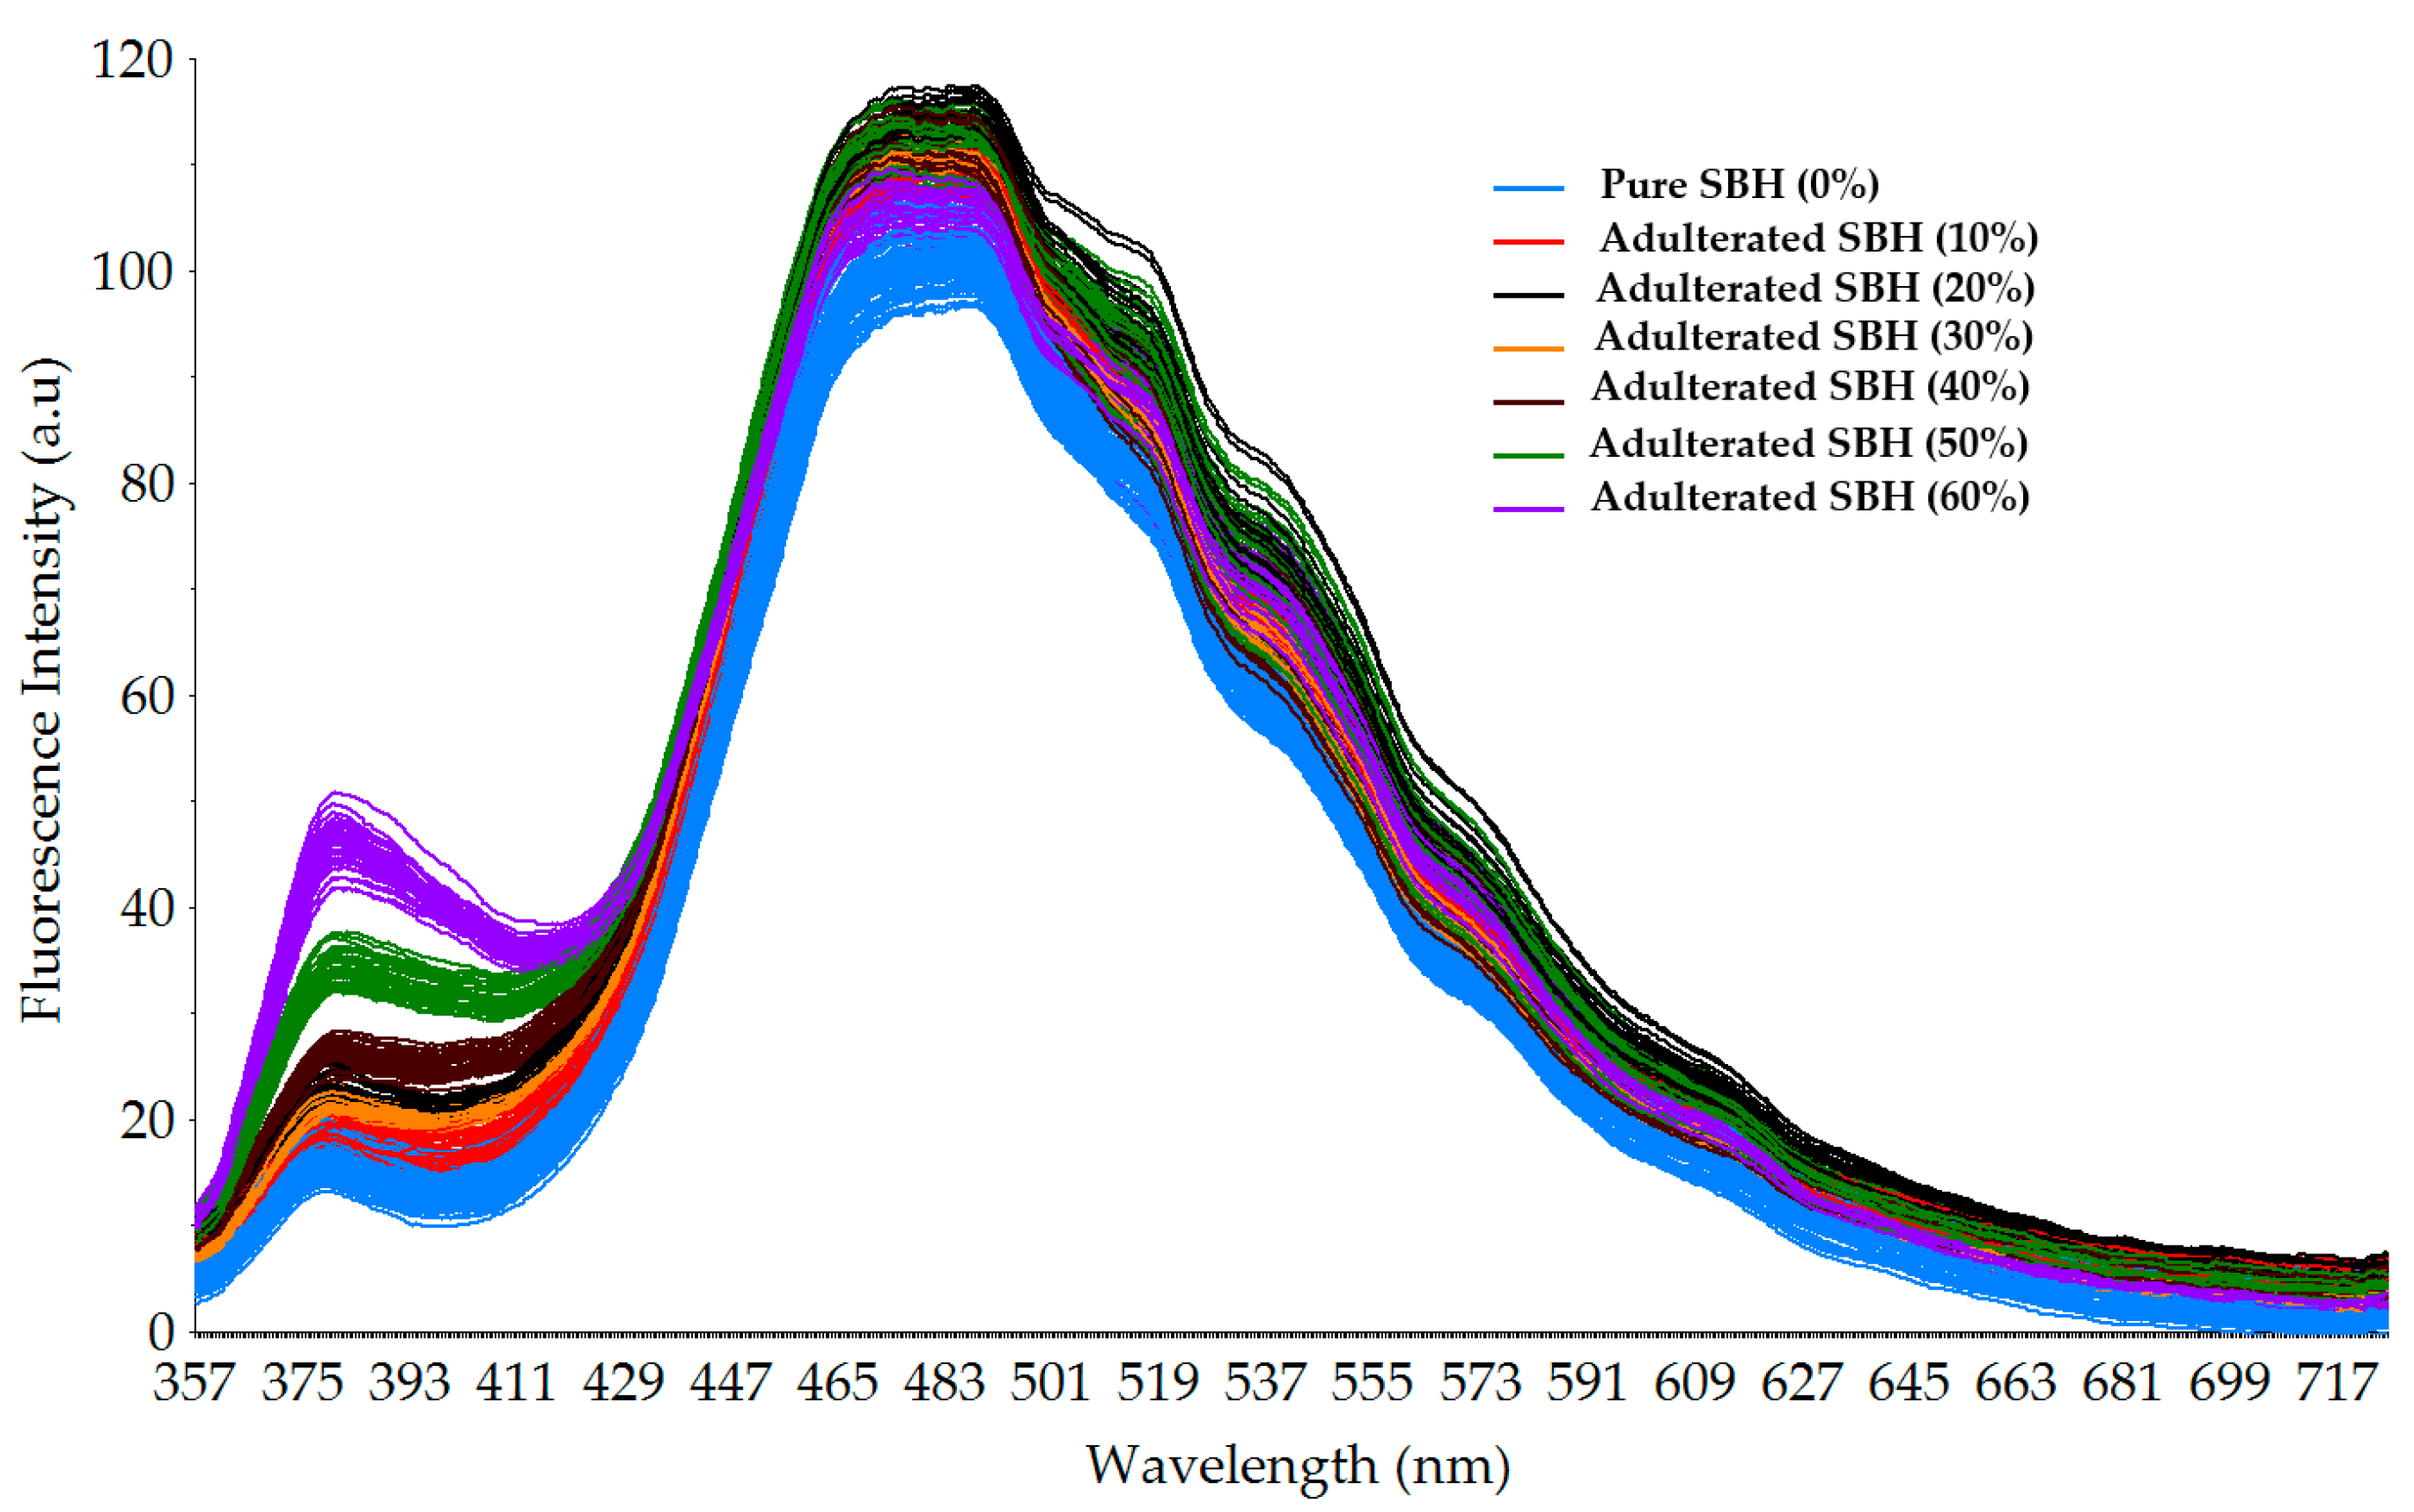
3.1. Fluorescence Spectral Intensity of Pure and Adulterated SBH Samples
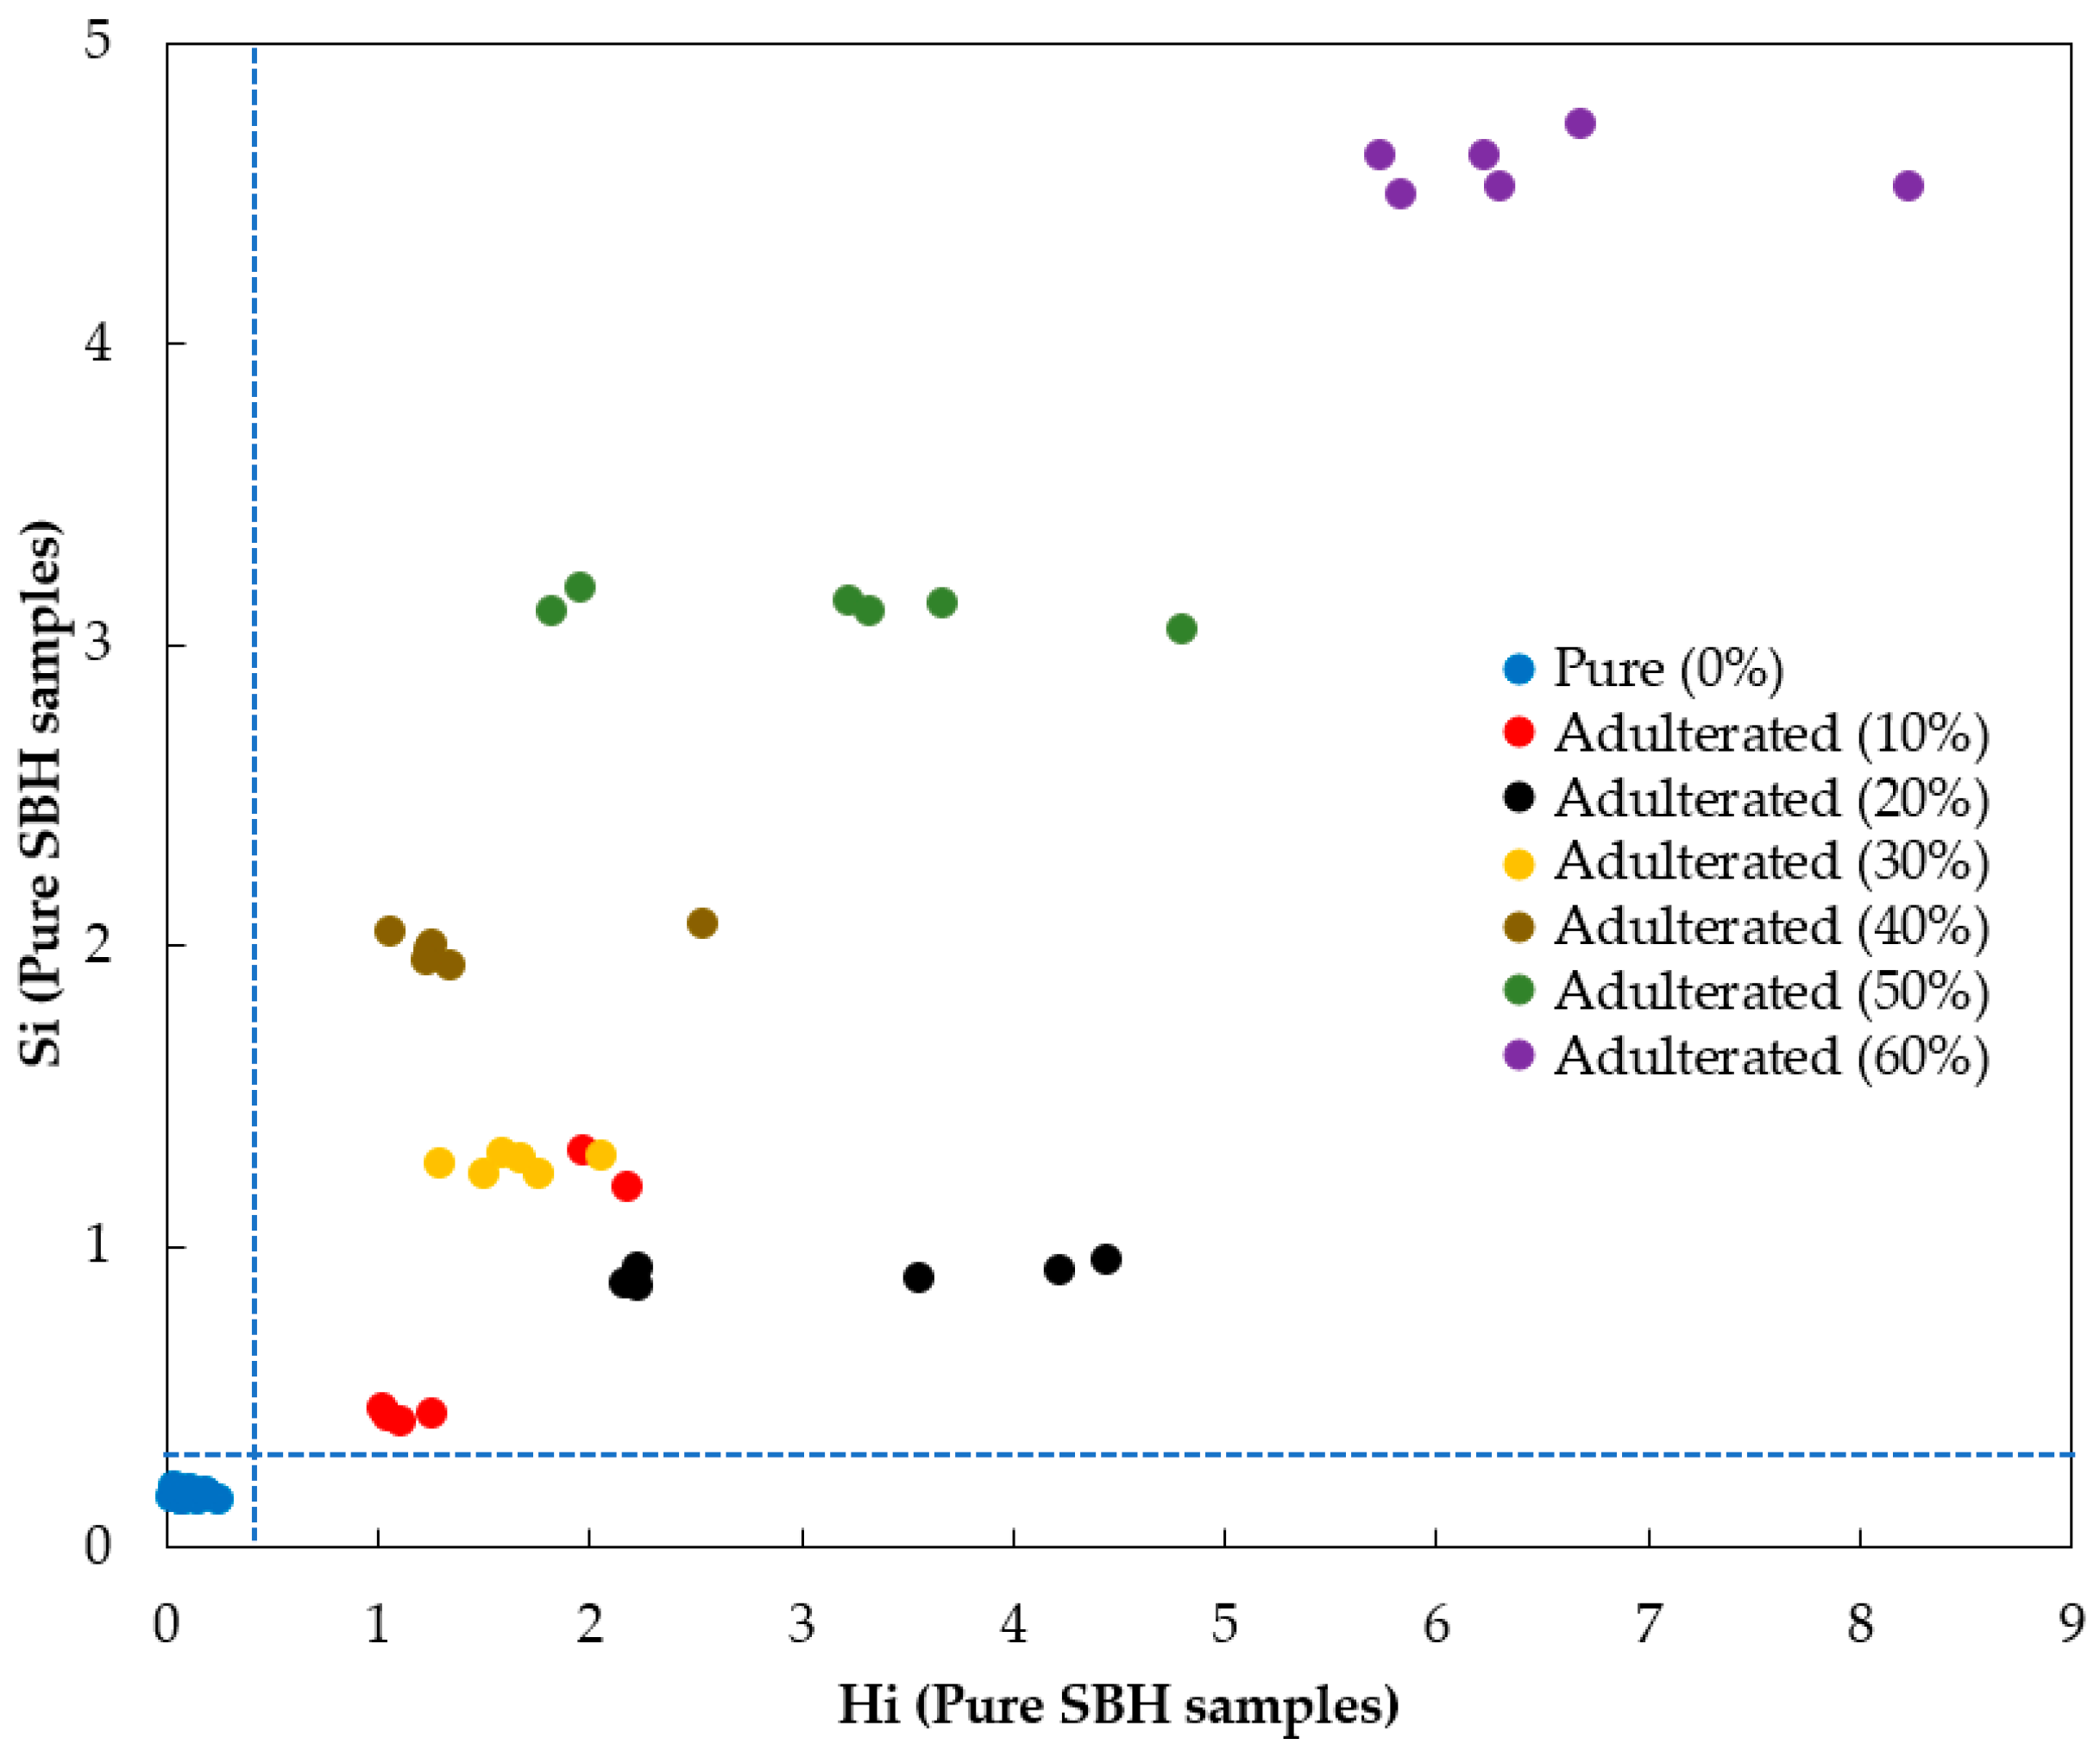
3.2. PCA and SIMCA Results
3.3. Quantification of SBH Adulteration Level Using Different Regression Methods
4. Conclusions
Author Contributions
Funding
Data Availability Statement
Acknowledgments
Conflicts of Interest
References
- da Silva, I.A.A.; da Silva, T.M.S.; Camara, C.A.; Queiroz, N.; Magnani, M.; de Novais, J.S.; Soledade, L.E.B.; de Oliveira Lima, E.; de Souza, A.L.; de Souza, A.G. Phenolic Profile, Antioxidant Activity and Palynological Analysis of Stingless Bee Honey from Amazonas, Northern Brazil. Food Chem. 2013, 141, 3552–3558. [Google Scholar] [CrossRef] [PubMed] [Green Version]
- Jalil, M.A.A.; Kasmuri, A.R.; Hadi, H. Stingless Bee Honey, the Natural Wound Healer: A Review. Skin Pharmacol. Physiol. 2017, 30, 66–75. [Google Scholar] [CrossRef] [PubMed]
- Aziz, M.S.A.; Giribabu, N.; Rao, P.V.; Salleh, N. Pancreatoprotective Effects of Geniotrigona thoracica Stingless Bee Honey in Streptozotocin-Nicotinamide-Induced Male Diabetic Rats. Biomed. Pharmacother. 2017, 89, 135–145. [Google Scholar] [CrossRef]
- Oses, S.M.; Nieto, S.; Rodrigo, S.; Perez, S.; Rojo, S.; Sancho, M.T.; Fernandez-Muino, M.A. Authentication of Strawberry Tree (Arbutus unedo L.) Honeys from Southern Europe Based on Compositional Parameters and Biological Activities. Food Biosci. 2020, 38, 100768. [Google Scholar] [CrossRef]
- Alevia, M.; Rasines, S.; Cantero, L.; Sancho, M.T.; Fernandez-Muino, M.A.; Oses, S.M. Chemical Extraction and Gastrointestinal Digestion of Honey: Influence on Its Antioxidant, Antimicrobial and Anti-Inflammatory Activities. Foods 2021, 10, 1412. [Google Scholar] [CrossRef]
- Hossain, K.S.; Hossain, M.G.; Moni, A.; Rahman, M.M.; Rahman, U.H.; Alam, M.; Kundu, S.; Rahman, M.M.; Hannan, M.A.; Uddin, M.J. Prospects of Honey in Fighting Against COVID-19: Pharmacological Insights and Therapeutic Promises. Heliyon 2020, 6, e05798. [Google Scholar] [CrossRef] [PubMed]
- Al-Hatamleh, M.A.I.; Hatmal, M.M.; Sattar, K.; Ahmad, S.; Mustafa, M.Z.; Bittencourt, M.D.C.; Mohamud, R. Antiviral and Immunomodulatory Effects of Phytochemicals from Honey against COVID-19: Potential Mechanisms of Action and Future Directions. Molecules 2020, 25, 5017. [Google Scholar] [CrossRef]
- Abedi, F.; Ghasemi, S.; Farkhondeh, T.; Azimi-Nezhad, M.; Shakibaei, M.; Samarghandian, S. Possible Potential Effects of Honey and Its Main Components Against COVID-19 Infection. Dose-Response 2021, 19. [Google Scholar] [CrossRef]
- Lim, J.R.; Chua, L.S.; Dawood, D.A.S. Evaluating Biological Properties of Stingless Bee Propolis. Foods 2023, 12, 2290. [Google Scholar] [CrossRef]
- Biluca, F.C.; Braghini, F.; Gonzaga, L.V.; Costa, A.C.O.; Fett, R. Physicochemical Profiles, Minerals and Bioactive Compounds of Stingless Bee Honey (Meliponinae). J. Food Compos. Anal. 2016, 50, 61–69. [Google Scholar] [CrossRef]
- Shamsudin, S.; Selamat, J.; Sanny, M.; Bahari, S.A.R.; Jambari, N.N.; Khatib, A.A. Comparative Characterization of Physicochemical and Antioxidants Properties of Processed Heterotrigona itama Honey from Different Origins and Classification by Chemometrics Analysis. Molecules 2019, 24, 3898. [Google Scholar] [CrossRef] [PubMed] [Green Version]
- Se, K.W.; Ghoshal, S.K.; Wahab, R.A.; Ibrahim, R.K.R.; Lani, M.N. A Simple Approach for Rapid Detection and Quantification of Adulterants in Stingless Bees (Heterotrigona itama) Honey. Food Res. Int. 2018, 105, 453–460. [Google Scholar] [CrossRef] [PubMed]
- Cárdenas-Escudero, J.; Galán-Madruga, D.; Cáceres, J.O. Rapid, Reliable and Easy-to-Perform Chemometric-Less Method for Rice Syrup Adulterated Honey Detection using FTIR-ATR. Talanta 2023, 253, 123961. [Google Scholar] [CrossRef] [PubMed]
- Limm, W.; Karunathilaka, S.R.; Mossoba, M.M. Fourier Transform Infrared Spectroscopy and Chemometrics for The Rapid Screening of Economically Motivated Adulteration of Honey Spiked with Corn or Rice Syrup. J. Food Prot. 2023, 86, 100054. [Google Scholar] [CrossRef]
- Akyildiz, I.E.; Uzunöner, D.; Raday, S.; Acar, S.; Erdem, O.; Damarli, E. Identification of the Rice Syrup Adulterated Honey by Introducing a Candidate Marker Compound for Brown Rice Syrups. LWT 2022, 154, 112618. [Google Scholar] [CrossRef]
- Mohamat, R.N.; Noor, N.R.A.M.; Yusof, Y.A.; Sabri, S.; Zawawi, N. Differentiation of High-Fructose Corn Syrup Adulterated Kelulut Honey Using Physicochemical, Rheological, and Antibacterial Parameters. Foods 2023, 12, 1670. [Google Scholar] [CrossRef]
- Chuttong, B.; Chanbang, Y.; Sringarm, K.; Burgett, M. Physicochemical Profiles of Stingless Bee (Apidae: Meliponini) Honey from South East Asia (Thailand). Food Chem. 2016, 192, 149–155. [Google Scholar] [CrossRef]
- Das, C.; Chakraborty, S.; Acharya, K.; Bera, N.K.; Chattopadhyay, D.; Karmakar, A.; Chattopadhyay, S. FT-MIR Supported Electrical Impedance Spectroscopy Based Study of Sugar Adulterated Honeys from Different Floral Origin. Talanta 2017, 171, 327–334. [Google Scholar] [CrossRef]
- Li, S.; Shan, Y.; Zhu, X.; Zhang, X.; Ling, G. Detection of Honey Adulteration by High Fructose Corn Syrup and Maltose Syrup using Raman Spectroscopy. J. Food Compos. Anal. 2012, 28, 69–74. [Google Scholar] [CrossRef]
- Yan, S.; Song, M.; Wang, K.; Fang, X.; Peng, W.; Wu, L.; Xue, X. Detection of Acacia Honey Adulteration with High Fructose Corn Syrup Through Determination of Targeted α-Dicarbonyl Compound using Ion Mobility-Mass Spectrometry Coupled with UHPLCMS/MS. Food Chem. 2021, 352, 129312. [Google Scholar] [CrossRef]
- Huang, T.K.; Chuang, M.C.; Kung, Y.; Hsieh, B.C. Impedimetric Sensing of Honey Adulterated with High Fructose Corn Syrup. Food Control 2021, 130, 108326. [Google Scholar] [CrossRef]
- Cengiz, M.F.; Durak, M.Z. Rapid Detection of Sucrose Adulteration in Honey using Fourier Transform Infrared Spectroscopy. Spectrosc. Lett. 2019, 52, 267–273. [Google Scholar] [CrossRef]
- Lenhardt, L.; Zeković, I.; Dramićanin, T.; Dramićanin, M.D.; Bro, R. Determination of the Botanical Origin of Honey by Front-Face Synchronous Fluorescence Spectroscopy. Appl. Spectrosc. 2014, 68, 557–563. [Google Scholar] [CrossRef]
- Lozano-Torres, B.; Martínez-Bisbal, M.C.; Soto, J.; Borrás, M.J.; Martínez-Máñez, R.; Escriche, I. Monofloral Honey Authentication by Voltammetric Electronic Tongue: A Comparison with 1H NMR Spectroscopy. Food Chem. 2022, 383, 132460. [Google Scholar] [CrossRef]
- Rachineni, K.; Kakita, V.M.R.; Awasthi, N.P.; Shirke, V.S.; Hosur, R.V.; Shukla, S.C. Identifying Type of Sugar Adulterants in Honey: Combined Application of NMR Spectroscopy and Supervised Machine Learning Classification. Curr. Res. Food Sci. 2022, 5, 272–277. [Google Scholar] [CrossRef] [PubMed]
- Valinger, D.; Longin, L.; Grbeš, F.; Benković, M.; Jurina, T.; Kljusurić, J.G.; Tušek, A.J. Detection of Honey Adulteration—The Potential of UV-VIS and NIR Spectroscopy Coupled with Multivariate Analysis. LWT-Food Sci. Technol. 2021, 145, 111316. [Google Scholar] [CrossRef]
- Suhandy, D.; Yulia, M. Classification of Lampung Robusta Specialty Coffee According to Differences in Cherry Processing Methods using UV Spectroscopy and Chemometrics. Agriculture 2021, 11, 109. [Google Scholar] [CrossRef]
- Suhandy, D.; Yulia, M. The Use of Ultraviolet (UV) Spectroscopy and Chemometrics to Quantify the Percentages of Adulteration in Kalosi Ground Roasted Specialty Coffee. J. Eng. Sci. Technol. 2021, 16, 350–364. [Google Scholar]
- Yulia, M.; Suhandy, D. Quantification of Corn Adulteration in Wet and Dry-Processed Peaberry Ground Roasted Coffees by UV–Vis Spectroscopy and Chemometrics. Molecules 2021, 26, 6091. [Google Scholar] [CrossRef]
- Suhandy, D.; Yulia, M. Authentication of Java Preanger Steamed Green Tea by Using Ultraviolet Spectroscopy and Discriminant Analysis Method. J. Eng. Sci. Technol. 2021, 16, 4650–4665. [Google Scholar]
- Suhandy, D.; Yulia, M. The Use of UV Spectroscopy and SIMCA for the Authentication of Indonesian Honeys According to Botanical, Entomological and Geographical Origins. Molecules 2021, 26, 915. [Google Scholar] [CrossRef] [PubMed]
- Beć, K.B.; Grabska, J.; Huck, C.W. Miniaturized NIR Spectroscopy in Food Analysis and Quality Control: Promises, Challenges, and Perspectives. Foods 2022, 11, 1465. [Google Scholar] [CrossRef] [PubMed]
- Crocombe, R.; Leary, P.; Kammrath, B. Portable Spectroscopy and Spectrometry 1: Technologies and Instrumentation, 1st ed.; John Wiley & Sons, Ltd.: Chichester, UK, 2021; pp. 179–207. [Google Scholar] [CrossRef]
- Wang, W.; Ma, P.; Song, D. Applications of Surface-Enhanced Raman spectroscopy Based on Portable Raman Spectrometers: A Review of Recent Developments. Luminescence 2022, 37, 1822–1835. [Google Scholar] [CrossRef] [PubMed]
- Escuredo, O.; Rodríguez-Flores, M.S.; Meno, L.; Seijo, M.C. Prediction of Physicochemical Properties in Honeys with Portable Near-Infrared (microNIR) Spectroscopy Combined with Multivariate Data Processing. Foods 2021, 10, 317. [Google Scholar] [CrossRef]
- Moskowitz, J.; Yakes, B.J. Portable Spectroscopy for Food Safety and Adulteration Screening. Int. J. Regul. Sci. 2022, 10, 1–18. [Google Scholar] [CrossRef]
- McVey, C.; Elliott, C.T.; Cannavan, A.; Kelly, S.D.; Petchkongkaew, A.; Haughey, S.A. Portable Spectroscopy for High Throughput Food Authenticity Screening: Advancements in Technology and Integration into Digital Traceability Systems. Trends Food Sci. Tech. 2021, 118 Pt B, 777–790. [Google Scholar] [CrossRef]
- Correia, R.M.; Domingos, E.; Cáo, V.M.; Araujo, B.R.F.; Sena, S.; Pinheiro, L.U.; Fontes, A.M.; Aquino, L.F.M.; Ferreira, E.C.; Filgueiras, P.R.; et al. Portable Near Infrared Spectroscopy Applied to Fuel Quality Control. Talanta 2018, 176, 26–33. [Google Scholar] [CrossRef]
- Santos, F.D.; Vianna, S.G.T.; Cunha, P.H.P.; Folli, G.S.; de Paulo, E.H.; Moro, M.K.; Romão, W.; de Oliveira, E.C.; Filgueiras, P.R. Characterization of Crude Oils with A Portable NIR Spectrometer. Microchem. J. 2022, 181, 107696. [Google Scholar] [CrossRef]
- Schubert, E.F. Light-Emitting Diodes, 3rd ed.; Cambridge University Press: Cambridge, UK, 2018; pp. 1–18. [Google Scholar]
- Graf, A.; Claßen, J.; Solle, D.; Hitzmann, B.; Rebner, K.; Hoehse, M.A. Novel LED-Based 2D-Fluorescence Spectroscopy System for In-Line Monitoring of Chinese Hamster Ovary Cell Cultivations—Part I. Eng. Life Sci. 2019, 19, 352–362. [Google Scholar] [CrossRef] [Green Version]
- Shin, Y.-H.; Gutierrez-Wing, M.T.; Choi, J.-W. Review—Recent Progress in Portable Fluorescence Sensors. J. Electrochem. Soc. 2021, 168, 017502. [Google Scholar] [CrossRef]
- Hart, S.J.; Jiji, R.D. Light Emitting Diode Excitation Emission Matrix Fluorescence Spectroscopy. Analyst 2002, 127, 1693–1699. [Google Scholar] [CrossRef]
- Lastra-Mejías, M.; Torreblanca-Zanca, A.; Aroca-Santos, R.; Cancilla, J.C.; Izquierdo, J.G.; Torrecilla, J.S. Characterization of An Array of Honeys of Different Types and Botanical Origins Through Fluorescence Emission Based on LEDs. Talanta 2018, 185, 196–202. [Google Scholar] [CrossRef]
- Mukunda, D.C.; Joshi, V.K.; Mahato, K.K. Light Emitting Diodes (LEDs) in Fluorescence-Based Analytical Applications: A Review. Appl. Spectrosc. Rev. 2022, 57, 1–38. [Google Scholar] [CrossRef]
- Mohamed, M.; Sirajudeen, K.N.S.; Swamy, M.; Yaacob, N.S.; Sulaiman, S.A. Studies on the Antioxidant Properties of Tualang Honey of Malaysia. Afr. J. Tradit. Complement. Altern. Med. 2010, 7, 59–63. [Google Scholar] [CrossRef] [Green Version]
- Castiglioni, S.; Astolfi, P.; Conti, C.; Monaci, E.; Stefano, M.; Carloni, P. Morphological, Physicochemical and FTIR Spectroscopic Properties of Bee Pollen Loads from Different Botanical Origin. Molecules 2019, 24, 3974. [Google Scholar] [CrossRef] [PubMed] [Green Version]
- Can, Z.; Yildiz, O.; Sahin, H.; Akyuz Turumtay, E.; Silici, S.; Kolayli, S. An Investigation of Turkish Honeys: Their Physico-Chemical Properties, Antioxidant Capacities and Phenolic Profiles. Food Chem. 2015, 180, 133–141. [Google Scholar] [CrossRef] [PubMed]
- Frausto-Reyes, C.; Casillas-Peñuelas, R.; Quintanar-Stephano, J.L.; Macías-López, E.; Bujdud-Pérez, J.M.; Medina-Ramírez, I. Spectroscopic Study of Honey from Apis mellifera from Different Regions in Mexico. Spectrochim. Acta A Mol. Biomol. Spectrosc. 2017, 178, 212–217. [Google Scholar] [CrossRef]
- Karasawa, K.; Takakura, M.; Kato, S.; Akatsuka, M.; Kato, M. Simple and Rapid Evaluation of the Unique Manuka Factor in Manuka Honey Using Fluorescence Fingerprints and Principal Component Analysis. Chem. Pharm. Bull. 2020, 68, 762–765. [Google Scholar] [CrossRef]
- Aleixandre-Tudo, J.L.; Castello-Cogollos, L.; Aleixandre, J.L.; Aleixandre-Benavent, R. Chemometrics in Food Science and Technology: A Bibliometric Study. Chemom. Intell. Lab. Syst. 2022, 222, 104514. [Google Scholar] [CrossRef]
- Galvan, D.; de Aguiar, L.M.; Bona, E.; Marini, F.; Killner, M.H.M. Successful Combination of Benchtop Nuclear Magnetic Resonance Spectroscopy and Chemometric Tools: A Review. Anal. Chim. Acta 2023, 1273, 341495. [Google Scholar] [CrossRef]
- Ringnér, M. What is Principal Component Analysis? Nat. Biotechnol. 2008, 26, 303–304. [Google Scholar] [CrossRef]
- Bro, R.; Smilde, A.K. Principal Component Analysis. Anal. Methods 2014, 6, 2812–2831. [Google Scholar] [CrossRef] [Green Version]
- Xu, L.; Cai, C.B.; Cui, H.F.; Ye, Z.H.; Yu, X.P. Rapid Discrimination of Pork in Halal and Non-Halal Chinese Ham Sausages by Fourier Transform Infrared (FTIR) Spectroscopy and Chemometrics. Meat Sci. 2012, 92, 506–510. [Google Scholar] [CrossRef]
- Máquina, A.D.V.; Sitoe, B.V.; Buiatte, J.E.; Santos, D.Q.; Neto, W.B. Quantification and Classification of Cotton Biodiesel Content in Diesel Blends, using Mid-Infrared Spectroscopy and Chemometric Methods. Fuel 2019, 237, 373–379. [Google Scholar] [CrossRef]
- Milani, M.I.; Rossini, E.L.; Catelani, T.A.; Pezza, L.; Toci, A.T.; Pezza, H.R. Authentication of Roasted and Ground Coffee Samples Containing Multiple Adulterants using NMR and A Chemometric Approach. Food Control 2020, 112, 107104. [Google Scholar] [CrossRef]
- Rambla-Alegre, M.; Esteve-Romero, J.; Carda-Broch, S. Is It Really Necessary to Validate an Analytical Method or Not? That is the Question. J. Chromatogr. A 2012, 1232, 101–109. [Google Scholar] [CrossRef]
- Ghosh, N.; Verma, Y.; Majumder, S.K.; Gupta, P.K. A Fluorescence Spectroscopic Study of Honey and Cane Sugar Syrup. Food Sci. Technol. Res. 2005, 11, 59–62. [Google Scholar] [CrossRef] [Green Version]
- Yan, S.; Sun, M.; Wang, X.; Shan, J.; Xue, X. A Novel, Rapid Screening Technique for Sugar Syrup Adulteration in Honey Using Fluorescence Spectroscopy. Foods 2022, 11, 2316. [Google Scholar] [CrossRef] [PubMed]
- Nikolova, K.; Eftimov, T.; Aladjadjiyan, A. Fluorescence Spectroscopy as Method for Quality Control of Honey. Adv. Res. 2014, 2, 95–108. [Google Scholar] [CrossRef]
- Ruoff, K.; Karoui, R.; Dufour, E.; Luginbühl, W.; Bosset, J.O.; Bogdanov, S.; Amadò, R. Authentication of the Botanical Origin of Honey by Front-Face Fluorescence Spectroscopy. A Preliminary Study. J. Agric. Food Chem. 2005, 53, 1343–1347. [Google Scholar] [CrossRef] [PubMed]
- Ali, H.; Khan, S.; Ullah, R.; Khan, B. Fluorescence Fingerprints of Sidr Honey in Comparison with Uni/Polyfloral Honey Samples. Eur. Food Res. Technol. 2020, 246, 1829–1837. [Google Scholar] [CrossRef]
- Biluca, F.C.; Santos de Gois, J.; Schulz, M.; Braghini, F.; Gonzaga, L.V.; Maltez, H.F.; Rodrigues, E.; Vitali, L.; Micke, G.A.; Borges, D.L.G.; et al. Phenolic Compounds, Antioxidant Capacity and Bioaccessibility of Minerals of Stingless Bee Honey (Meliponinae). J. Food Compos. Anal. 2017, 63, 89–97. [Google Scholar] [CrossRef]
- Lang, M.; Stober, F.; Uchtenthaler, H.K. Fluorescence Emission Spectra of Plant Leaves and Plant Constituents. Rad. Environ. Biophys. 1991, 30, 333–347. [Google Scholar] [CrossRef] [PubMed]
- Sergiel, I.; Pohl, P.; Biesaga, M.; Mironczyk, A. Suitability of Three-Dimensional Synchronous Fluorescence Spectroscopy for Fingerprint Analysis of Honey Samples with Reference to Their Phenolic Profiles. Food Chem. 2014, 145, 319–326. [Google Scholar] [CrossRef] [PubMed]
- Hu, L.; Yin, C.; Ma, S.; Liu, Z. Vis-NIR Spectroscopy Combined with Wavelengths Selection by PSO Optimization Algorithm for Simultaneous Determination of Four Quality Parameters and Classification of Soy Sauce. Food Anal. Methods 2019, 12, 633–643. [Google Scholar] [CrossRef]
- Se, K.W.; Wahab, R.A.; Yaacob, S.N.S.; Ghoshal, S.K. Detection Techniques for Adulterants in Honey: Challenges and Recent Trends. J. Food Compos. Anal. 2019, 80, 16–32. [Google Scholar] [CrossRef]
- Wang, S.; Guo, Q.; Wang, L.; Lin, L.; Shi, H.; Cao, H.; Cao, B. Detection of Honey Adulteration with Starch Syrup by High Performance Liquid Chromatography. Food Chem. 2015, 172, 669–674. [Google Scholar] [CrossRef]
- Chen, Q.; Qi, S.; Li, H.; Han, X.; Ouyang, Q.; Zhao, J. Determination of Rice Syrup Adulterant Concentration in Honey Using Three-Dimensional Fluorescence Spectra and Multivariate Calibrations. Spectrochim. Acta A Mol. Biomol. Spectrosc. 2014, 131, 177–182. [Google Scholar] [CrossRef]
- Ferreiro-González, M.; Espada-Bellido, E.; Guillén-Cueto, L.; Palma, M.; Barroso, C.G.; Barbero, G.F. Rapid Quantification of Honey Adulteration by Visible-Near Infrared Spectroscopy Combined with Chemometrics. Talanta 2018, 188, 288–292. [Google Scholar] [CrossRef]
- Benković, M.; Jurina, T.; Longin, L.; Grbeš, F.; Valinger, D.; Tušek, A.J.; Kljusurić, J.G. Qualitative and Quantitative Detection of Acacia Honey Adulteration with Glucose Syrup Using Near-Infrared Spectroscopy. Separations 2022, 9, 312. [Google Scholar] [CrossRef]
- Raypah, M.E.; Omar, A.F.; Muncan, J.; Zulkurnain, M.; Najib, A.R.A. Identification of Stingless Bee Honey Adulteration Using Visible-Near Infrared Spectroscopy Combined with Aquaphotomics. Molecules 2022, 27, 2324. [Google Scholar] [CrossRef]
- Aliaño-González, M.J.; Ferreiro-González, M.; Espada-Bellido, E.; Palma, M.; Barbero, G.F. A Screening Method Based on Visible-NIR spectroscopy for the Identification and Quantification of Different Adulterants in High-Quality Honey. Talanta 2019, 203, 235–241. [Google Scholar] [CrossRef]
- Peng, J.; Xie, W.; Jiang, J.; Zhao, Z.; Zhou, F.; Liu, F. Fast Quantification of Honey Adulteration with Laser-Induced Breakdown Spectroscopy and Chemometric Methods. Foods 2020, 9, 341. [Google Scholar] [CrossRef] [Green Version]
- Raypah, M.E.; Zhi, L.J.; Loon, L.Z.; Omar, A.F. Near-Infrared Spectroscopy with Chemometrics for Identification and Quantification of Adulteration in High-Quality Stingless Bee Honey. Chemom. Intell. Lab. Syst. 2022, 224, 104540. [Google Scholar] [CrossRef]
- Wu, X.; Xu, B.; Ma, R.; Niu, Y.; Gao, S.; Liu, H.; Zhang, Y. Identification and Quantification of Adulterated Honey by Raman Spectroscopy Combined with Convolutional Neural Network and Chemometrics. Spectrochim. Acta A Mol. Biomol. Spectrosc. 2022, 274, 21133. [Google Scholar] [CrossRef]
- Wu, X.; Xu, B.; Ma, R.; Niu, Y.; Zhang, X.; Du, Z.; Liu, H.; Zhang, Y. Botanical Origin Identification and Adulteration Quantification of Honey Based on Raman Spectroscopy Combined with Convolutional Neural Network. Vib. Spectrosc. 2022, 123, 103439. [Google Scholar] [CrossRef]
- Parrini, S.; Stagliano, N.; Bozzi, R.; Argenti, G. Can Grassland Chemical Quality Be Quantified Using Transform Near-Infrared Spectroscopy? Animals 2022, 12, 86. [Google Scholar] [CrossRef] [PubMed]
- Suhandy, D.; Yulia, M.; Ogawa, Y.; Kondo, N. L-Ascorbic Acid Prediction in Aqueous Solution Based on FTIR-ATR Terahertz Spectroscopy. Eng. Agric. Environ. Food 2012, 5, 152–158. [Google Scholar] [CrossRef]
- Rambo, M.K.D.; Ferreira, M.M.C.; Amorim, E.P. Multi-Product Calibration Models using NIR Spectroscopy. Chemom. Intell. Lab. Syst. 2016, 151, 108–114. [Google Scholar] [CrossRef]
- Yasmin, J.; Ahmed, M.R.; Lohumi, S.; Wakholi, C.; Lee, H.; Mo, C.; Cho, B.-K. Rapid Authentication Measurement of Cinnamon Powder using FT-NIR and FT-IR Spectroscopic Techniques. Qual. Assur. Saf. Crops Foods 2019, 11, 211–312. [Google Scholar] [CrossRef]
- Nespeca, M.G.; Vieira, A.L.; Júnior, D.S.; Neto, J.A.G.; Ferreira, E.C. Detection and Quantification of Adulterants in Honey by LIBS. Food Chem. 2020, 311, 125886. [Google Scholar] [CrossRef] [PubMed]
- Mouazen, A.M.; Al-Walaan, N. Glucose Adulteration in Saudi Honey with Visible and Near Infrared Spectroscopy. Int. J. Food Prop. 2014, 17, 2263–2274. [Google Scholar] [CrossRef] [Green Version]
- Rhee, Y.; Shilliday, E.R.; Matviychuk, Y.; Nguyen, T.; Robinson, N.; Holland, D.J.; Connolly, P.R.J.; Johns, M.L. Detection of Honey Adulteration Using Benchtop 1H NMR spectroscopy. Anal. Methods 2023, 15, 1690–1699. [Google Scholar] [CrossRef] [PubMed]
- Brar, D.S.; Pant, K.; Krishnan, R.; Kaur, S.; Rasane, P.; Nanda, V.; Saxena, S.; Gautam, S. A Comprehensive Review on Unethical Honey: Validation by Emerging Techniques. Food Control 2023, 145, 109482. [Google Scholar] [CrossRef]


| Sample Code | Adulteration Level (%) 1 | Number of Samples |
|---|---|---|
| MA | 0 | 100 |
| MC10 | 10 | 40 |
| MC20 | 20 | 40 |
| MC30 | 30 | 40 |
| MC40 | 40 | 40 |
| MC50 | 50 | 40 |
| MC60 | 60 | 40 |
| Classes | Calibration Set | Validation Set | Prediction Set |
|---|---|---|---|
| Pure SBH | 51 | 33 | 16 |
| Adulterated SBH | 126 | 78 | 36 |
| Items | Calibration Set | Validation Set | Prediction Set |
|---|---|---|---|
| Number of samples | 177 | 111 | 52 |
| Range 1 | 0–60 | 0–60 | 0–60 |
| Standard deviation (SD) 1 | 21.48 | 21.57 | 21.72 |
| Mean 1 | 24.92 | 24.59 | 24.23 |
| Principal Components (PCs) | Cumulative Percent Variance (CPV) (%) | |||
|---|---|---|---|---|
| Pure SBH | Adulterated SBH | |||
| Calibration | Validation | Calibration | Validation | |
| PC1 | 84.08973 | 80.41664 | 63.44584 | 63.91681 |
| PC2 | 94.11534 | 91.30837 | 93.14684 | 93.60857 |
| PC3 | 98.08557 | 96.70327 | 98.38311 | 98.59088 |
| PC4 | 99.64038 | 99.54868 | 99.70518 | 99.66491 |
| PC5 | 99.73003 | 99.60417 | 99.88976 | 99.85424 |
| PC6 | 99.77257 | 99.64778 | 99.90607 | 99.86829 |
| Predicted Class | ||||
|---|---|---|---|---|
| Pure SBH | Adulterated SBH | Total | ||
| Actual Class | Pure SBH | True Positive (TP) = 16 | False Negative (FN) = 0 | 16 |
| Adulterated SBH | False Positive (FP) = 0 | True Negative (TN) = 34 | 34 | |
| Total | 16 | 34 | ||
| Regressions | R2p | RMSEP 1 | SEP 1 | Bias 1 | RER | RPD | LOD 1 | LOQ 1 |
|---|---|---|---|---|---|---|---|---|
| PLSR | 0.9566 | 4.4818 | 4.3547 | 1.2197 | 13.79 | 4.99 | 13.59 | 45.31 |
| PCR | 0.9627 | 4.1579 | 4.0469 | 1.1073 | 14.81 | 5.36 | 12.79 | 42.63 |
| MLR | 0.9497 | 4.8259 | 4.5601 | 1.7015 | 13.16 | 4.76 | 14.55 | 48.51 |
Disclaimer/Publisher’s Note: The statements, opinions and data contained in all publications are solely those of the individual author(s) and contributor(s) and not of MDPI and/or the editor(s). MDPI and/or the editor(s) disclaim responsibility for any injury to people or property resulting from any ideas, methods, instructions or products referred to in the content. |
© 2023 by the authors. Licensee MDPI, Basel, Switzerland. This article is an open access article distributed under the terms and conditions of the Creative Commons Attribution (CC BY) license (https://creativecommons.org/licenses/by/4.0/).
Share and Cite
Suhandy, D.; Al Riza, D.F.; Yulia, M.; Kusumiyati, K. Non-Targeted Detection and Quantification of Food Adulteration of High-Quality Stingless Bee Honey (SBH) via a Portable LED-Based Fluorescence Spectroscopy. Foods 2023, 12, 3067. https://doi.org/10.3390/foods12163067
Suhandy D, Al Riza DF, Yulia M, Kusumiyati K. Non-Targeted Detection and Quantification of Food Adulteration of High-Quality Stingless Bee Honey (SBH) via a Portable LED-Based Fluorescence Spectroscopy. Foods. 2023; 12(16):3067. https://doi.org/10.3390/foods12163067
Chicago/Turabian StyleSuhandy, Diding, Dimas Firmanda Al Riza, Meinilwita Yulia, and Kusumiyati Kusumiyati. 2023. "Non-Targeted Detection and Quantification of Food Adulteration of High-Quality Stingless Bee Honey (SBH) via a Portable LED-Based Fluorescence Spectroscopy" Foods 12, no. 16: 3067. https://doi.org/10.3390/foods12163067
APA StyleSuhandy, D., Al Riza, D. F., Yulia, M., & Kusumiyati, K. (2023). Non-Targeted Detection and Quantification of Food Adulteration of High-Quality Stingless Bee Honey (SBH) via a Portable LED-Based Fluorescence Spectroscopy. Foods, 12(16), 3067. https://doi.org/10.3390/foods12163067