Article

Cadmium Exposure in Aquatic Products and Health Risk Classification Assessment in Residents of Zhejiang, China

1
Department of Nutrition and Food Safety, Zhejiang Provincial Center for Disease Control and Prevention, Hangzhou 310051, China
2
Hangzhou Linping District Center for Disease Control and Prevention, Hangzhou 311100, China
3
Department of Physical-Chemistry, Zhejiang Provincial Center for Disease Control and Prevention, Hangzhou 310051, China
*
Author to whom correspondence should be addressed.
Foods 2023, 12(16), 3094; https://doi.org/10.3390/foods12163094
Submission received: 31 July 2023 / Revised: 15 August 2023 / Accepted: 16 August 2023 / Published: 17 August 2023
(This article belongs to the Section Foods of Marine Origin)

Abstract

:
Cadmium (Cd) pollution of food safety is a prominent food safety concern worldwide. The concentration of Cd in six aquatic food categories collected from 2018 to 2022 was analyzed using inductively coupled plasma mass spectrometry, and the Cd exposure levels were calculated by combining the Cd concentration and food consumption data of 18913 urban and rural residents in Zhejiang Province in 2015–2016. The mean Cd concentration was 0.699 mg/kg and the mean Cd exposure of aquatic foods was 0.00951 mg/kg BW/month for the general population. Marine crustaceans were the largest Cd contributor, corresponding to 82.7%. The regional distribution results showed that the average Cd exposure levels of 11 cities did not exceed the provisional tolerable monthly intake (PTMI). According to the subgroups, the Cd mean exposure level of 2–3-year-old children was significantly higher than that of the other age groups but did not exceed the PTMI. Health risk classification assessment demonstrated that the final risk score was six, and the health risk level of Cd exposure in aquatic products in the Zhejiang population was medium. These results demonstrated that the risk of Cd exposure in certain food types or age groups should be given more concern.

1. Introduction

Cadmium (Cd) is a nonessential transition and toxic metal that poses severe threats to human health and may be associated with numerous diseases. Cd can enter the body through water, soil, air, diet, tobacco, and occupational exposure and has a long half-life of approximately 10–30 years [1]. Important anthropogenic Cd sources include mining, atmospheric deposition of combustion emissions, and the use of Cd-containing fertilizers [2]. Cd is an extremely toxic heavy metal, and there is no specific, safe, and efficacious therapeutic management for Cd toxicity [3]. Epidemiological evidence has revealed that environmental and occupational Cd can be associated with various types of cancer, cardiovascular disease, diabetes, chronic renal disease, osteoporosis, and Alzheimer’s disease [4,5,6]. Recent research has elucidated that Cd acts as an immunotoxic agent, modulates the immune system, and responds [7,8]. Cd toxicity as an important health hazard which may compromise host defense against pathogenic microorganisms and homeostatic reparative activities. Cd exposure triggers oxidative stress, necroptosis, and Th1/Th2 imbalance, and promotes inflammation through the TNF-α/NF-κB pathway [9]. Moreover, Cd affects cell proliferation, differentiation, apoptosis, and other cell activities at the cellular level [10].
Due to a relatively high volatility, large ionic radius, and chemical speciation, Cd is susceptible to mobilization by anthropogenic and natural processes [11]. Cd in the environment can be enriched by foods and then transferred to human beings by the food chain. In 2011, the joint FAO/WHO Expert Committee on Food Additives (JECFA) formulated the health guideline value (HBGV) of Cd, which states that the daily intake of Cd for adults should not exceed 50 μg, and the provisional tolerable monthly intake (PTMI) for Cd was 0.025 mg/kg body weight (BW) [12]. The European Food Safety Commission (EFSA) set an HBGV of no more than 21.6 μg/day [13]. The National Health and Nutrition Examination Survey (NHANES) 2007–2012 showed that dietary exposure to Cd in the American people was 4.63 μg/day [14]. A Northern Italian dietary study reported that the estimated median dietary Cd intake was 5.00 μg/day, which far exceeds the daily dietary intakes recommended by national international agencies [15]. In China, especially in the southern area, some foods contain Cd that exceeds the Chinese food limits, which are limited from 0.003 mg/kg in natural mineral water to 3 mg/kg in sea crab [16,17]. Compared to other standards worldwide, the food limits of Cd are 0.005–3 mg/kg in the European Union, 0.05–2.5 mg/kg in Australia, and 0.003–2 mg/kg in the international Codex Alimentarius Commission (CAC), respectively. A health risk assessment in China’s Guangdong Province indicated that rice grain, leaf vegetables, bivalves, and shrimp and crabs were the main contributors of Cd exposure [18].
Generally, the quality of water is compromised due to the contamination of toxic metals, which adversely impacts the health of humans, animals, and plants. A risk assessment of 87 Chinese lakes from 2009 to 2019 indicated that 5.6% of lake water and 88.2% of lake sediments were polluted by Cd [19]. The survey of 108 sediment samples from the Bohai Sea showed that the Cd concentrations were considerably higher than the average upper crust value and presented high potential ecological risk [20]. Aquatic products from fresh water or the ocean present numerous health benefits but also accumulate toxic metals and metalloids, which can have harmful effects on human health if consumed in excess [21]. Fish, crustaceans, and bivalves are the most common aquatic foods and are also significant sources of Cd exposure [22]. These aquatic products can accumulate Cd in their tissues, undergo osmotic exchange and ingestion at the body surface, and absorb Cd from water [23]. A study from Laizhou Bay in China revealed that Cd was the second most abundant metal and the most accumulated element in seafood, and crabs showed a much higher enrichment ability of Cd than others [24]. A baseline study showed that swimming crabs (Portunus trituberculatus) from the Shanghai market had varying degrees of Cd contamination [25]. Thus, there is great importance in assessing the Cd exposure in aquatic products.
Zhejiang Province is located on the southeast coast of China, with latitude from 27°02′ N to 31°11′ N and longitude from 118°01′ E to 123°10′ E, and is also home to 50.95 million people; this population not only consumes but also provides seafood for the rest of China and even abroad [26]. The objective of the present study was to evaluate the Cd health risk in aquatic foods based on food consumption data from residents in Zhejiang Province, China. The paper can offer several insights about Cd accumulation in aquatic products and serve as a basis to compare with other regions worldwide.

2. Materials and Methods

2.1. Sample Collection and Preparation

A total of 10,356 food samples were collected by professional samplers between 2018 and 2022 from shopping malls, seafood retail stores, and restaurants in 11 cities of Zhejiang Province, China. The 10,356 samples were separated into six food types: freshwater fish, marine fish, freshwater crustaceans, marine crustaceans, mollusks, and others. The samples were saved in a freezer at −18 °C and used experiments as quickly as possible.

2.2. Inductively Coupled Plasma Mass Spectrometry

The analysis of Cd in aquatic products was carried out based on the elemental analysis guide in the China Food Safety National Monitoring Manual and China National Food Safety Standard GB 5000.268-2016 [27]. A quantity of 0.2–0.5 g of each sample was placed in a microwave digestion inner tank, to which 5–10 mL of concentrated nitric acid was then added, and digestion was conducted according to the standard operation procedure of the microwave digestion instrument. In the meantime, blank and reference experiments were conducted. The Cd concentration was detected by inductively coupled plasma mass spectrometry (ICP-MS, 350D, Perkin Elmer, Inc., Shelton, CT, USA). The sample solutions, standards and reference materials were spiked with 50 ng/mL of the internal standard. The limit of detection (LOD) refers to the corresponding three times the value of the instrument background signal is generated by the matrix blank. The limits of quantification (LOQ) are determined by a signal-to-noise ratio of 10:1 or are approximated by multiplying the LOD by 3.3. The LOD for Cd by ICP-MS was 0.002 mg/kg, and the LOQ was 0.005 mg/kg. The recovery rate was ≥90% and the correlation coefficient R2 ≥ 0.995.

2.3. Food Consumption Data

An urban and rural population-based survey of food consumption data was administered in Zhejiang Province between 2015 and 2016. A total of 18,913 people from 22 townships were surveyed, covering all age groups (≥2 years). All participant’s information was collected, and they also were asked to complete a 24 h dietary recall during three consecutive days as accurately as possible. All the food consumed during the investigation were collected. We applied a stratified random sampling method over three consecutive days, including two working days and one weekend and excluding holidays. In the meantime, all participants’ body weight data were collected. For the consumption data, freshwater fish, marine fish, and marine crustaceans were the most consumed foods, with 16.487, 15.199, and 9.233 g/day, respectively (Table 1). The Ethics Review Committee of Zhejiang Provincial Center for Disease Control and Prevention (CDC) approved this survey, and verbal consent was obtained. Zhejiang CDC is authorized by the Zhejiang Provincial Government to collect and utilize food consumption information. All the participants were informed that they have the right to decline or terminate the study at any time during the interview. In addition, China’s National Center for Food Safety Risk Assessment (CFSA) was responsible for organizing and summarizing the food consumption survey, and our use of the data was verbally approved by CFSA.

2.4. Exposure Assessment

The consumption data of a particular food were combined with the Cd concentration and then divided by body weight to obtain the daily dietary exposure for each individual food item [28]. The average dietary exposure was represented by the mean, and 97.5th percentile (P97.5) was applied to represent the high exposure level. The average daily doses of Cd dietary exposure per kg of body weight were calculated by using the following formula:
A D D = C I R B W 30
where ADD is the average daily dose of Cd intake per kg body weight (mg/kg BW/month), C is the determined level of Cd in aquatic products, IR is the daily consumption of every aquatic food type, and BW is the body weight of the individual (kg). The estimated average monthly exposure level was compared with the PTMI of 0.025 mg/kg BW/month.

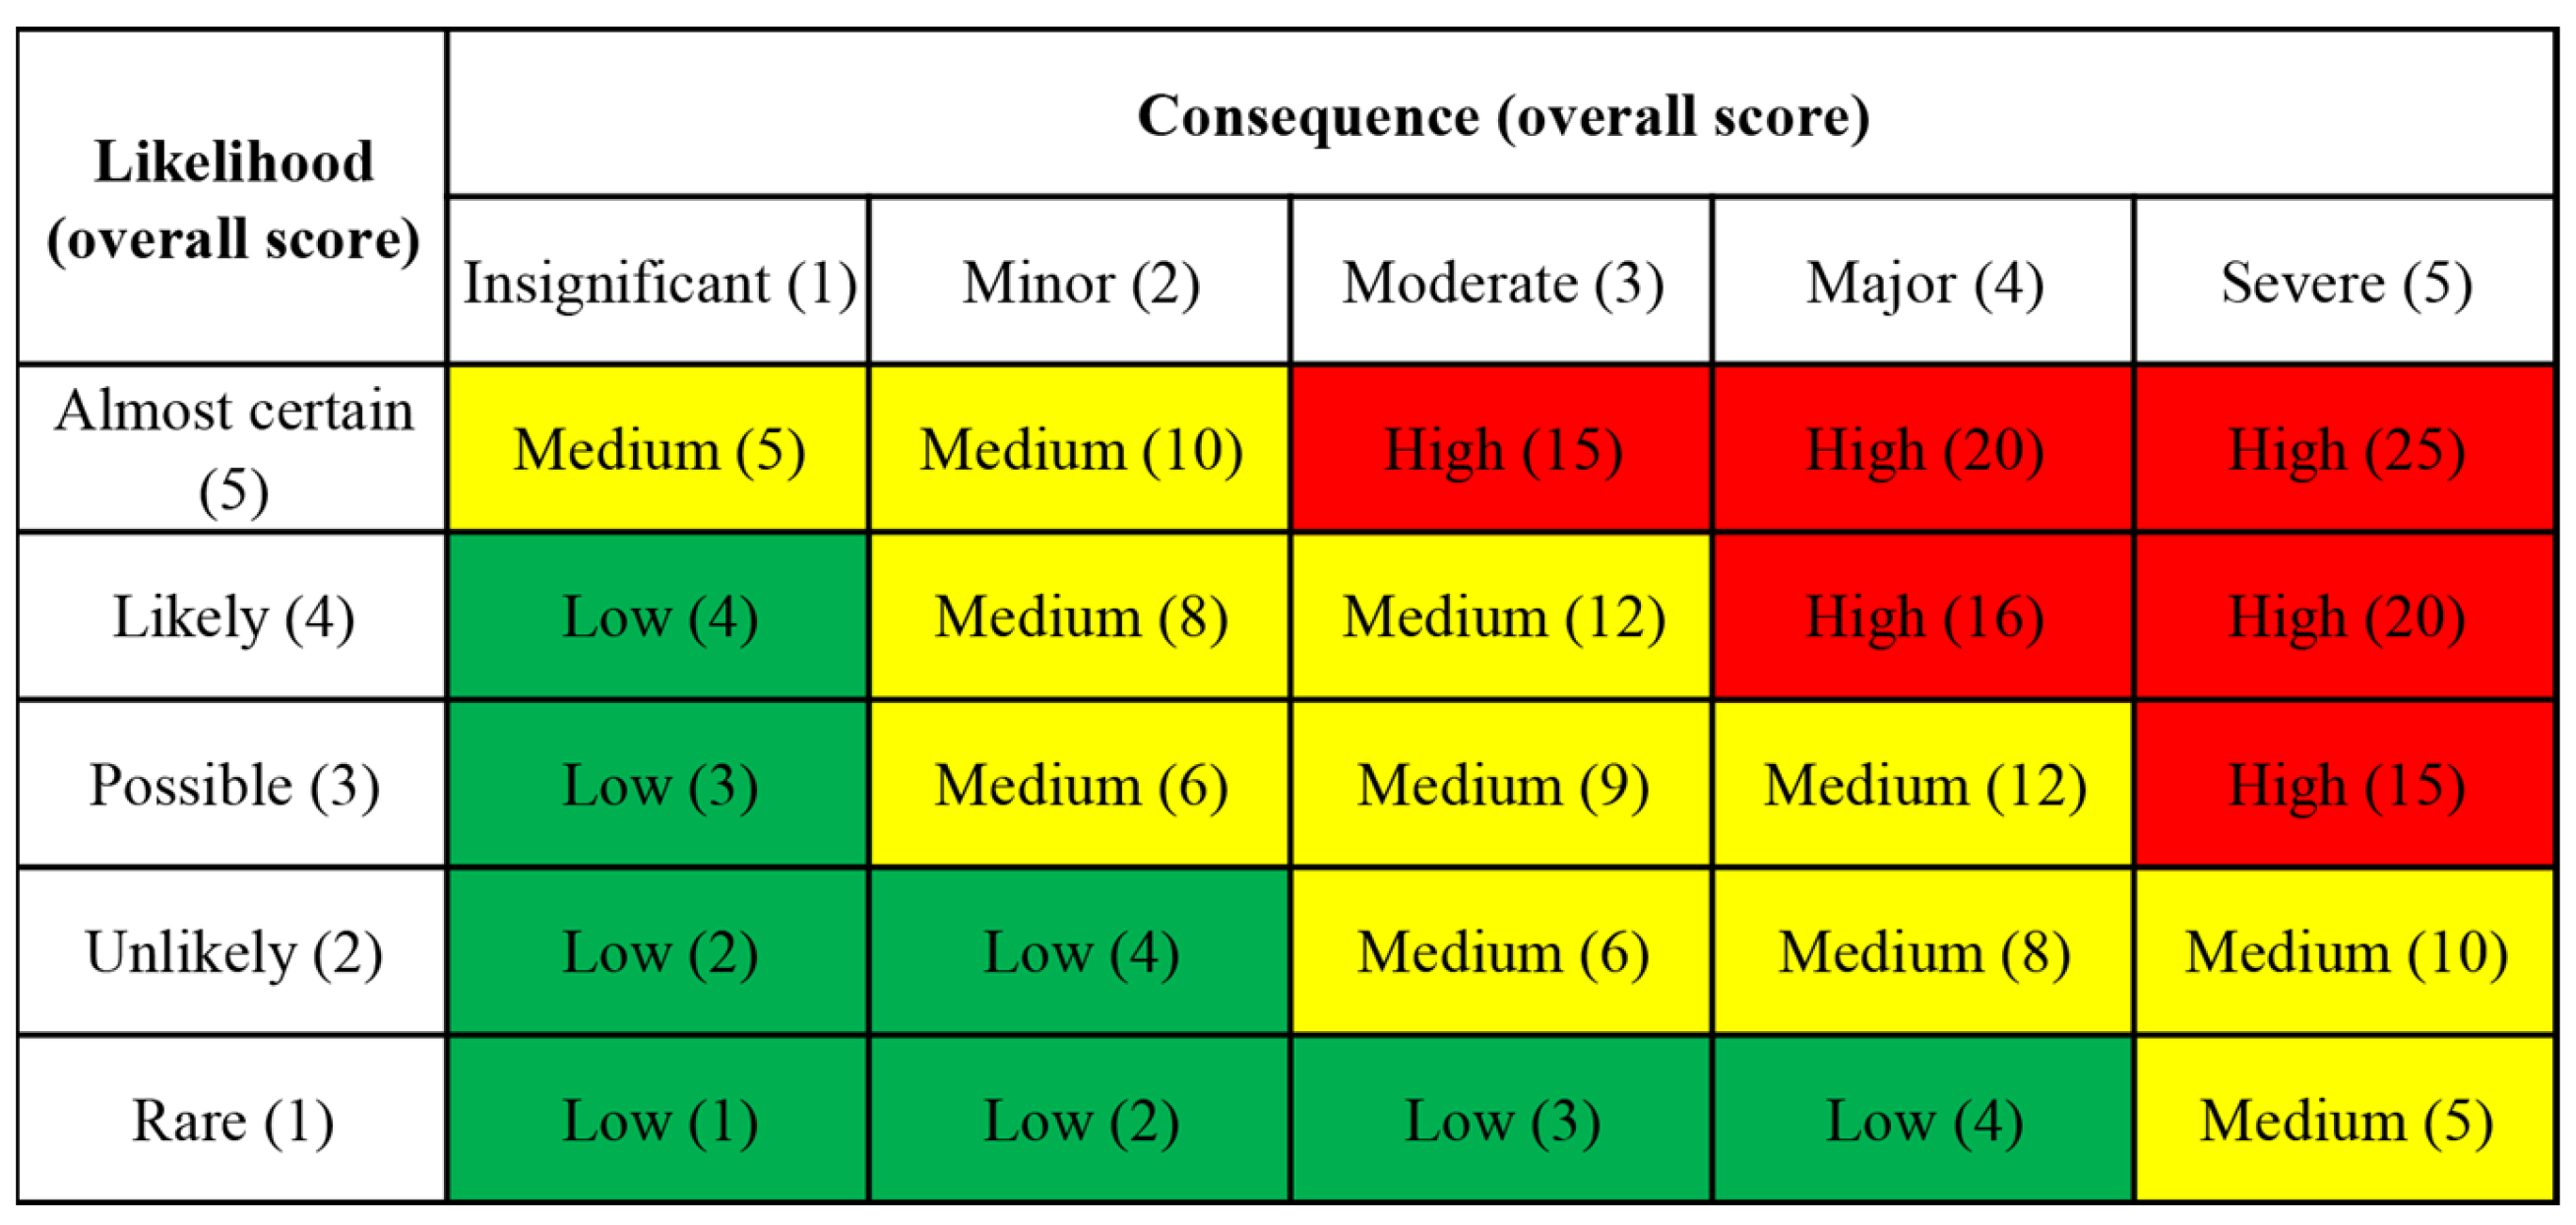
2.5. Health Risk Classification

A health risk classification method was used to accurately recognize the magnitude of health risks and provide scientific basis for the implementation of food safety risk management [29]. There were three stages. Firstly, the consequence severity was determined. Second, the possibility of adverse reactions when exposed to a poison was determined. Finally, the risk level was determined according to the risk matrix. Primarily, acute toxicity was expressed as “rat oral lethal Dose 50 (LD50)” (represented by “Ha”), and chronic toxicity was expressed by varied toxicity category points, including carcinogenicity, mutability, reproduction toxicity, developmental neurotoxicity, subchronic and chronic toxicity (represented by “Hb”), and the total point of consequence was the half the Ha and Hb. Next, the ratio average exposure to Cd in the target population (Pa) was used to ensure the “likelihood of adverse effects”, and the ratio of populations with individual exposure levels exceeding health guideline value was deemed as Pb to determine the likelihood caused by Cd, and the likelihood score was equal to half of the Pa and Pb scores combined. The final risk score combined the score of consequence with likelihood and shown in the risk matrix. The risk score was presented as three levels: low, medium, and high scores which were 1–4, 5–22, and 15–25, respectively. The different risk levels were colored green, yellow, and red.

2.6. Data Analysis

Based on the Reliable Evaluation of Low-Level Contaminations of Food report by Kulmbach in the GEMS/Food-EURO Second Workshop in 1995, he pointed out that the data sets (which had 60% or less data censored) using LOD1/2 for data reported as <LOD provided a reasonably effective estimate [30]. Therefore, the values of Cd concentration lower than LOD were deemed as LOD1/2 in the present study. All statistical analysis was conducted by IBM SPSS Statistics for Windows, version 25.0 (IBM Crop, Armonk, NY, USA). All of the results are expressed as the mean ± SD, and one-way analysis of variance (ANOVA) followed by Turkey’s test was used to evaluate the comparison between two groups. A value of p < 0.05 was considered statistically significant. Open source software QGIS (Quantum GIS version 3.22.9) was used to map the spatial distribution of Cd concentration in aquatic products among 11 cities from 2018 to 2022.

3. Results

3.1. Concentration of Cd in Aquatic Products

Cd concentrations were detected in 10,356 aquatic product samples from 2018 to 2022 and are summarized in Table 1. In total, 16.29% (1687 of 10,356) of the test samples were under the LOD. The mean Cd concentration in the six aquatic food groups was 0.699 mg/kg. Cd contents varied dramatically among food categories. The highest average concentration was 1.47 mg/kg for Cd in marine crustaceans. In addition, high Cd contents were found in mollusks (0.925 mg/kg) and others (0.180 mg/kg). Cd was present at low levels in freshwater fish, marine fish, and freshwater crustaceans, with means of 0.00988, 0.0417, and 0.0940 mg/kg, respectively.
In terms of temporal distribution, the highest Cd concentration was 0.869 mg/kg in 2020. Moreover, the average Cd concentrations showed a peak distribution from 2018 to 2022 (Figure 1a). The regional distribution of Cd concentration in aquatic products among 11 cities is shown in Figure 1b. The mean Cd concentrations in Zhoushan, Wenzhou, and Taizhou cities were the highest, with means of 1.157, 1.059, and 1.022 mg/kg, respectively. However, the cities of Shaoxing, Jinhua, and Huzhou had the lowest mean Cd concentrations of 0.230, 0.394, and 0.411 mg/kg, respectively.

3.2. Exposure Assessment

3.2.1. Dietary Cd Exposure by Different Food Groups

The above formula was applied to evaluate the Cd exposure level. Mean exposure, P97.5, and the Cd contribution of different foods to dietary exposure are given in Table 2. The Cd average exposure of the general population in aquatic foods was 0.00951 mg/kg BW/month, which was equivalent to 38.04% of PTMI. Cd exposure in the high consumer (P97.5) of the general population was 0.0589 mg/kg BW/month, which was approximately 2.355 times the PTMI. The results indicated that marine crustaceans are the major Cd contributor to the Zhejiang population by combining the concentration and food consumption data in these six aquatic food types, corresponding to 82.7%. Other aquatic food category contributors ranged from 0.648% to 10.1%.

3.2.2. Dietary Cd Exposure by Different Area

The regional Cd exposure distribution among 11 cities is shown in Table 3. In this study, the average Cd exposure levels of 11 cities in Zhejiang Province were 0.000254 to 0.0229 mg/kg BW/month. The cities of Zhoushan, Wenzhou, and Taizhou had the highest Cd exposure levels with 0.0229, 0.0182, and 0.0182 mg/kg BW/month, respectively. And all cities’ Cd exposure levels were below the PTMI.

3.2.3. Cd Exposure by Age Subgroups

The aquatic product Cd exposures for all participants and different age–sex subgroups of the individuals are shown in Table 4. For adults, the average Cd exposure level was 0.00840 mg/kg BW/month between males and females, accounting for approximately 33.60% of the PTMI. Children aged 2–3 years were significantly more exposed to Cd than adults and young people but the Cd exposure levels of all age groups was under the PTMI (Table 4). For the high consumer group (P97.5), the Cd exposure levels of all age–sex groups were greater than the PTMI, ranging from 0.0493 (male adult) to 0.152 (children 2–3 years) mg/kg BW/month.

3.3. Health Risk Classification Assessment

We carried out health risk classification assessment in accordance with the above method. According to the score definitions and classification, the acute toxicity of LD50 was 2330 mg/kg, so the Ha score was set to two. Cd has chronic toxicity (category 1), so the Hb score was 4. Therefore, the overall score of consequence is three, indicating that the consequence level was “moderate”. According to our results, the ratio of average exposure to Cd in target population (Pa) accounted for 38.04% of the PTMI. Accordingly, the overall score of Pa was set to two. The proportion of individuals whose exposure level exceeded the PTMI was 9.42%. Therefore, the score of Pb was two. Therefore, the overall score of likelihood of adverse effect was two, and the likelihood level was “unlikely” in the risk matrix. Combining the levels of consequence and likelihood in the risk matrix, the horizontal axis and the vertical axis intersect at a yellow block (Figure 2). The final risk score is six, and the health risk level of Cd exposure in aquatic products in the Zhejiang population is medium.

4. Discussion

Dietary Cd intake has been a vital public health concern worldwide, and many studies have focused on the intake and source of dietary Cd [31,32]. This is the first assessment of Cd exposure in aquatic products in Zhejiang Province. The mean Cd concentration in the six aquatic food groups was 0.699 mg/kg, and the mean Cd exposure of the target population was 0.00951 mg/kg BW/month, which was below the PTMI of 0.025 mg/kg BW/month. According to the dietary Cd exposure assessment among the Chinese population in 2017, the result was lower than 0.0153 mg/kg BW/month [17]. In the Sixth China Total Diet Studies (TDSs) during 2016–2019, the mean Cd intake for Chinese adult males was 0.00826 mg/kg BW/month (0.0026–0.03002 mg/kg BW/month), which indicated that the mean Cd exposure in aquatic products in Zhejiang Province is at the national average level [33]. According to some previous reports, the mean concentration of Cd was 0.0085 mg/kg in Jilin Province and 0.159 mg/kg in Guangdong Province [34,35]. The average dietary exposures to Cd were 0.0184 mg/kg BW/month in Jiangxi Province and 0.0099 mg/kg BW/month in Shenzhen adults [36,37].
Cd dietary exposure shows that the Cd contribution of meat and vegetables has gradually increased over time, and aquatic foods have become one of the main sources of Cd exposure [38]. A heavy metal health risk assessment of aquatic products in the Chinese population revealed that the highest mean level of Cd was 0.431 mg/kg in shellfish and the lowest level was 0.006 mg/kg in fish [39]. A previous study showed that the level of Cd in aquatic products was less than 0.1 mg/kg and the highest average concentration was found at 0.196 mg/kg in swimming crabs in Zhejiang Province [40]. The health risk assessment from Taihu lake in China showed that the level of measured Cd in Taihu fish was moderate–low and that the consumption of aquatic foods from the lake was generally safe [41]. The results from Northeast China also indicated that the level of Cd in freshwater products was generally in an acceptable range [42]. However, seafood can be a prominent source of Cd. The bays in eastern China have been seriously polluted with heavy metals for a long time due to intensive anthropic pressure. In these pollutions and sediments, Cd poses a considerable ecological risk due to its high enrichment [43]. In our study, marine crustacean was the main Cd source of aquatic foods and contributed 81.66%. In general, the Cd concentration increases with the age/size of most species and tissues [44]. Among aquatic organisms, crustaceans stand out in the assessment of heavy metals, especially crabs, compared with fish and mollusks [45]. The main reason for crustaceans’ effective accumulation of heavy metals is the close contact of these benthic animals with polluted sediments and issues, such as bioturbation [46,47]. Most heavy metals accumulate in the crustacean liver, pancreas, and gills because the liver and pancreas are the main bioaccumulating organs and gills capture and accumulate metals through water [48].
Regional differences in Cd exposure level were observed in our study. Zhoushan, Wenzhou, and Taizhou cities reported the highest Cd concentrations with means of 1.157, 1.059, and 1.022 mg/kg, respectively. The mean Cd exposure levels of 11 cities in Zhejiang Province ranged from 0.000254 to 0.0229 mg/kg BW/month, and all cities’ Cd exposure levels did not exceed the PTMI. The Cd exposure levels of coastal cities were higher than those of other cities. Because deep-seabed mining contains various minerals and metals, with the decrease in land resources, deep-sea mining has drawn more increasing attention [49]. In coastal and estuary regions, Cd can enter the ocean from anthropogenic activities such as refining, copper and nickel smelting, fossil fuel combustion, and municipal wastes [50]. In addition, mounting evidence has demonstrated that ocean acidification is associated with metal pollution on coasts and estuaries. Ocean acidification aggravates the Cd toxicity to an environmentally relevant concentration, and the increased accumulation and altered subcellular distribution of Cd could lead to an increase in toxicity in marine products [51]. Moreover, climate change-related effects on the structure and function of ocean product webs, with consequent changes in contaminant transport, fate, and effects, are likely to have significant repercussions to marine products [52].
Furthermore, Cd exposure in aquatic food tended to decrease with age. Children (2–3 years old) were exposed to more Cd than young people (12–17 years old) and adults (over 18 years old). There are some plausible explanations as to why Cd exposure levels tend to decrease with age. Primarily, body weight is a huge factor since food consumption (kg/BW) was greater in children than in other subgroup populations [17], as children have the lowest body weight. Our results are consistent with the exposure assessment in the adult population and preschool children in the Republic of Serbia [53]. A risk assessment of dietary Cd exposure to Cd in residents of Guangzhou demonstrated that young people had lower margin of exposure (MOE) values (0.92) and indicated a higher risk, while those for the other age groups were all above 1.0 [18]. Additionally, young children and infants may be exposed to more Cd because they eat more food than is needed to maintain their weight (to realize growth and development), and therefore, Cd is more absorbable for them than adults [54]. Due to incomplete development of infants and young children, the developing brain is particularly vulnerable to permanent damage by exposure to environmental substances during the fragile window time. Therefore, high attention should be given to child development, and child health can be better protected by more preventative management of dietary and environmental chemicals.
There are some strengths in our study. Primarily, we applied the simple distribution method, which assessed Cd exposure based on food consumption and concentration. In terms of the results of health risk classification assessment, we concluded that the final risk score was 6, and the health risk level of Cd was medium. Application of the method in an actual case provided useful insights and could quickly determine the risk level of importance. The risk classification model was proposed by the China National Center for Food Safety Risk Assessment (CFSA) [29]. In addition, this is the first systematic evaluation of Cd exposure through aquatic products in Zhejiang Province. The overall risk of Cd exposure is manageable, and we paid more attention to the types of aquatic food and age subgroups. However, there are still several shortcomings. First, the food consumption data in 2015–2016 were old, and the dietary pattern in China has since changed due to the rapid development of the economy. Second, 3-day dietary records did not represent the true dietary Cd exposure during a prolonged period. In addition, the level of Cd entering the body was lower than that which the data detected due to the impact of cleaning, processing, cooking methods, and removing of inedible parts not being taken into consideration [21,55].

5. Conclusions

In summary, we systematically assess that the health risk from Cd exposure of Zhejiang provincial residents in aquatic products was low for the general population. We conclude that the risk of Cd intake through aquatic products is low among the general population, but that we should pay attention to marine crustaceans and young groups. Since the heavy metal contamination of aquatic foods is a severe public health issue, we recommend that it is necessary to further focus on the causes including industrial pollution, and geological and environmental protection. Future efforts can be undertaken to realize comprehensive assessments of the combined exposure and interaction of multiple pollutants.

Author Contributions

Conceptualization, Y.H. and X.Q.; Data curation, Y.H. and H.F.; Investigation, H.Z. and B.Z.; Methodology, X.P. and H.F.; Project administration, X.Q. and H.Z.; Supervision, J.C. and J.W.; Validation, R.Z. and L.C.; Writing—original draft, Y.H.; Writing—review and editing, Y.H. and X.Q. All authors have read and agreed to the published version of the manuscript.

Funding

This research was sponsored by Medical and Health Science and Technology Project of Zhejiang Province (No. 2022KY712), Medical and Health Science and Technology Project of Zhejiang Province (No. 2022KY717), and Medical and Health Science and Technology Project of Zhejiang Province (No. 2021KY624). Health Commission of Zhejiang Province was the funder of three projects.

Institutional Review Board Statement

Not applicable.

Informed Consent Statement

Not applicable.

Data Availability Statement

The data used to support the findings of this study can be made available by the corresponding author upon request.

Acknowledgments

The authors thank the CDCs at all levels of Zhejiang Province for their efforts.

Conflicts of Interest

The authors declare no conflict of interest. The funders had no role in the design of the study; in the collection, analyses, or interpretation of data; in the writing of the manuscript; or in the decision to publish the results.

References

  1. Wang, M.; Chen, Z.; Song, W.; Hong, D.; Huang, L.; Li, Y. A review on Cadmium Exposure in the Population and Intervention Strategies Against Cadmium Toxicity. Bull. Environ. Contam. Toxicol. 2021, 106, 65–74. [Google Scholar] [CrossRef] [PubMed]
  2. Kubier, A.; Wilkin, R.T.; Pichler, T. Cadmium in soils and groundwater: A review. Appl. Geochem. J. Int. Assoc. Geochem. Cosmochem. 2019, 108, 104388. [Google Scholar] [CrossRef] [PubMed]
  3. Bhattacharya, S. The Role of Probiotics in the Amelioration of Cadmium Toxicity. Biol. Trace Elem. Res. 2020, 197, 440–444. [Google Scholar] [CrossRef]
  4. Genchi, G.; Sinicropi, M.S.; Lauria, G.; Carocci, A.; Catalano, A. The Effects of Cadmium Toxicity. Int. J. Environ. Res. Public Health 2020, 17, 3782. [Google Scholar] [CrossRef] [PubMed]
  5. Satarug, S.; Vesey, D.A.; Gobe, G.C. Kidney Cadmium Toxicity, Diabetes and High Blood Pressure: The Perfect Storm. Tohoku J. Exp. Med. 2017, 241, 65–87. [Google Scholar] [CrossRef]
  6. Ma, Y.; Su, Q.; Yue, C.; Zou, H.; Zhu, J.; Zhao, H.; Song, R.; Liu, Z. The Effect of Oxidative Stress-Induced Autophagy by Cadmium Exposure in Kidney, Liver, and Bone Damage, and Neurotoxicity. Int. J. Mol. Sci. 2022, 23, 13491. [Google Scholar] [CrossRef] [PubMed]
  7. Wang, Z.; Sun, Y.; Yao, W.; Ba, Q.; Wang, H. Effects of Cadmium Exposure on the Immune System and Immunoregulation. Front. Immunol. 2021, 12, 695484. [Google Scholar] [CrossRef]
  8. Mirkov, I.; Aleksandrov, A.P.; Ninkov, M.; Tucovic, D.; Kulas, J.; Zeljkovic, M.; Popovic, D.; Kataranovski, M. Immunotoxicology of cadmium: Cells of the immune system as targets and effectors of cadmium toxicity. Food Chem. Toxicol. Int. J. Publ. Br. Ind. Biol. Res. Assoc. 2021, 149, 112026. [Google Scholar] [CrossRef] [PubMed]
  9. Chen, X.; Bi, M.; Yang, J.; Cai, J.; Zhang, H.; Zhu, Y.; Zheng, Y.; Liu, Q.; Shi, G.; Zhang, Z. Cadmium exposure triggers oxidative stress, necroptosis, Th1/Th2 imbalance and promotes inflammation through the TNF-α/NF-κB pathway in swine small intestine. J. Hazard. Mater. 2022, 421, 126704. [Google Scholar] [CrossRef]
  10. Rani, A.; Kumar, A.; Lal, A.; Pant, M. Cellular mechanisms of cadmium-induced toxicity: A review. Int. J. Environ. Health Res. 2014, 24, 378–399. [Google Scholar] [CrossRef]
  11. Cullen, J.T.; Maldonado, M.T. Biogeochemistry of cadmium and its release to the environment. Met. Ions Life Sci. 2013, 11, 31–62. [Google Scholar] [PubMed]
  12. Evaluation of Certain Food Additive and Contaminants; World Health Organization Technical Report Series; Back Cover; World Health Organization: Geneva, Switzerland, 2011; pp. 1–226.
  13. European Food Safety Authority. Cadmium in food: Scientific opinion of the panel on contaminants in the food chain. EFSA J. 2009, 7, 980. [Google Scholar] [CrossRef]
  14. Kim, K.; Melough, M.M.; Vance, T.M.; Noh, H.; Koo, S.I.; Chun, O.K. Dietary Cadmium Intake and Sources in the US. Nutrients 2018, 11, 2. [Google Scholar] [CrossRef] [PubMed]
  15. Filippini, T.; Cilloni, S.; Malavolti, M.; Violi, F.; Malagoli, C.; Tesauro, M.; Bottecchi, I.; Ferrari, A.; Vescovi, L.; Vinceti, M. Dietary intake of cadmium, chromium, copper, manganese, selenium and zinc in a Northern Italy community. J. Trace Elem. Med. Biol. Organ Soc. Miner. Trace Elem. (GMS) 2018, 50, 508–517. [Google Scholar] [CrossRef] [PubMed]
  16. Wang, P.; Chen, H.; Kopittke, P.M.; Zhao, F.J. Cadmium contamination in agricultural soils of China and the impact on food safety. Environ. Pollut. 2019, 249, 1038–1048. [Google Scholar] [CrossRef]
  17. Song, Y.; Wang, Y.; Mao, W.; Sui, H.; Yong, L.; Yang, D.; Jiang, D.; Zhang, L.; Gong, Y. Dietary cadmium exposure assessment among the Chinese population. PLoS ONE 2017, 12, e0177978. [Google Scholar] [CrossRef]
  18. Mhungu, F.; Chen, K.; Wang, Y.; Liu, Y.; Zhang, Y.; Pan, X.; Cheng, Y.; Liu, Y.; Zhang, W. Probabilistic Risk Assessment of Dietary Exposure to Cadmium in Residents of Guangzhou, China-Young Children Potentially at a Health Risk. Int. J. Environ. Res. Public Health 2022, 19, 9572. [Google Scholar] [CrossRef]
  19. Qin, Y.; Tao, Y. Pollution status of heavy metals and metalloids in Chinese lakes: Distribution, bioaccumulation and risk assessment. Ecotoxicol. Environ. Saf. 2022, 248, 114293. [Google Scholar] [CrossRef] [PubMed]
  20. Li, H.; Gao, X.; Gu, Y.; Wang, R.; Xie, P.; Liang, M.; Ming, H.; Su, J. Comprehensive large-scale investigation and assessment of trace metal in the coastal sediments of Bohai Sea. Mar. Pollut. Bull. 2018, 129, 126–134. [Google Scholar] [CrossRef]
  21. Schmidt, L.; Novo, D.L.R.; Druzian, G.T.; Landero, J.A.; Caruso, J.; Mesko, M.F.; Flores, E.M.M. Influence of culinary treatment on the concentration and on the bioavailability of cadmium, chromium, copper, and lead in seafood. J. Trace Elem. Med. Biol. Organ Soc. Miner. Trace Elem. (GMS) 2021, 65, 126717. [Google Scholar] [CrossRef]
  22. Lao, Y.M.; Qu, C.L.; Zhang, B.; Jin, H. Development and validation of single-step microwave-assisted digestion method for determining heavy metals in aquatic products: Health risk assessment. Food Chem. 2023, 402, 134500. [Google Scholar] [CrossRef]
  23. Bonsignore, M.; Manta, D.S.; Mirto, S.; Quinci, E.M.; Ape, F.; Montalto, V.; Gristina, M.; Traina, A.; Sprovieri, M. Bioaccumulation of heavy metals in fish, crustaceans, molluscs and echinoderms from the Tuscany coast. Ecotoxicol. Environ. Saf. 2018, 162, 554–562. [Google Scholar] [CrossRef] [PubMed]
  24. Liu, B.; Lv, L.; An, M.; Wang, T.; Li, M.; Yu, Y. Heavy metals in marine food web from Laizhou Bay, China: Levels, trophic magnification, and health risk assessment. Sci. Total Environ. 2022, 841, 156818. [Google Scholar] [CrossRef] [PubMed]
  25. Wu, D.; Shi, Y.; Wang, M.; Ran, M.; Wang, Y.; Tian, L.; Ye, H.; Han, F. A baseline study on the distribution characteristics and health risk assessment of cadmium in edible tissues of the swimming crabs (Portunus trituberculatus) from Shanghai, China. Mar. Pollut. Bull. 2022, 185, 114253. [Google Scholar] [CrossRef]
  26. Zhejiang Provincial Bureau of Statistics. Available online: http://tjj.zj.gov.cn/ (accessed on 1 July 2023).
  27. GB 5009.268–2016; National Food Safety Standard. Determination of Multi-Elements in Food. China Standards Press: Beijing, China, 2016. (In Chinese)
  28. Wang, X.; Sato, T.; Xing, B.; Tao, S. Health risks of heavy metals to the general public in Tianjin, China via consumption of vegetables and fish. Sci. Total Environ. 2005, 350, 28–37. [Google Scholar] [CrossRef]
  29. Ping, Z.P.; Ping, L.Z.; Lei, Z.; Dong, L.A.; Yan, S.; Ling, Y.; Ning, L. Methodology and application for health risk classification of chemicals in foods based on risk matrix. Biomed. Environ. Sci. BES 2014, 27, 912–916. [Google Scholar] [CrossRef]
  30. GEMS/Food-EUROS. Reliable Evaluation of Low-Level Contamination of Food. In Proceedings of the Second Workshop GEM/Food-EUROS, Kulmbach, Germany, 26–27 May 1995. [Google Scholar]
  31. Satarug, S.; Vesey, D.A.; Gobe, G.C. Current health risk assessment practice for dietary cadmium: Data from different countries. Food Chem. Toxicol. Int. J. Publ. Br. Ind. Biol. Res. Assoc. 2017, 106 Pt A, 430–445. [Google Scholar] [CrossRef]
  32. Ferrari, P.; Arcella, D.; Heraud, F.; Cappé, S.; Fabiansson, S. Impact of refining the assessment of dietary exposure to cadmium in the European adult population. Food Addit. Contam. Part A Chem. Anal. Control. Expo. Risk Assess. 2013, 30, 687–697. [Google Scholar] [CrossRef]
  33. Zhao, X.; Shao, Y.; Ma, L.; Shang, X.; Zhao, Y.; Wu, Y. Exposure to Lead and Cadmium in the Sixth Total Diet Study—China, 2016–2019. China CDC Wkly. 2022, 4, 176–179. [Google Scholar] [CrossRef]
  34. Wang, B.; Liu, Y.; Wang, H.; Cui, L.; Zhang, Z.; Guo, J.; Liu, S.; Cui, W. Contamination and health risk assessment of lead, arsenic, cadmium, and aluminum from a total diet study of Jilin Province, China. Food Sci. Nutr. 2020, 8, 5631–5640. [Google Scholar] [CrossRef]
  35. Zhang, W.; Liu, Y.; Liu, Y.; Liang, B.; Zhou, H.; Li, Y.; Zhang, Y.; Huang, J.; Yu, C.; Chen, K. An Assessment of Dietary Exposure to Cadmium in Residents of Guangzhou, China. Int. J. Environ. Res. Public Health 2018, 15, 556. [Google Scholar] [CrossRef]
  36. Zeng, L.; Liu, C.; Zhou, H.; Tong, W.; Wang, Y. Dietary exposure assessment of cadmium of adults in Jiangxi Province in 2016. J. Hyg. Res. 2020, 49, 836–839. [Google Scholar] [CrossRef]
  37. Wang, Z.; Pan, L.; Liu, G.; Zhang, H.; Zhang, J.; Jiang, J.; Xiao, Y.; Bai, W.; Jiao, R.; Huang, W. Dietary exposure to cadmium of Shenzhen adult residents from a total diet study. Food Addit. Contam. Part A Chem. Anal. Control. Expo. Risk Assess. 2018, 35, 706–714. [Google Scholar] [CrossRef] [PubMed]
  38. Qing, Y.; Yang, J.; Zhu, Y.; Li, Y.; Ma, W.; Zhang, C.; Li, X.; Wu, M.; Wang, H.; Kauffman, A.E.; et al. Cancer risk and disease burden of dietary cadmium exposure changes in Shanghai residents from 1988 to 2018. Sci. Total Environ. 2020, 734, 139411. [Google Scholar] [CrossRef] [PubMed]
  39. Wang, X.; Wu, J.; Yu, B.; Dong, K.F.; Ma, D.; Xiao, G.; Zhang, C. Heavy metals in aquatic products and the health risk assessment to population in China. Environ. Sci. Pollut. Res. Int. 2020, 27, 22708–22719. [Google Scholar] [CrossRef]
  40. Tang, J.; Huang, Z.; Pan, X.D. Exposure assessment of heavy metals (Cd, Hg, and Pb) by the intake of local foods from Zhejiang, China. Environ. Geochem. Health 2014, 36, 765–771. [Google Scholar] [CrossRef]
  41. Tao, Y.; Yuan, Z.; Xiaona, H.; Wei, M. Distribution and bioaccumulation of heavy metals in aquatic organisms of different trophic levels and potential health risk assessment from Taihu lake, China. Ecotoxicol. Environ. Saf. 2012, 81, 55–64. [Google Scholar] [CrossRef]
  42. Fu, L.; Lu, X.; Niu, K.; Tan, J.; Chen, J. Bioaccumulation and human health implications of essential and toxic metals in freshwater products of Northeast China. Sci. Total Environ. 2019, 673, 768–776. [Google Scholar] [CrossRef]
  43. Deng, X.; Mao, L.; Wu, Y.; Tan, Z.; Feng, W.; Zhang, Y. Pollution, risks, and sources of heavy metals in sediments from the urban rivers flowing into Haizhou Bay, China. Environ. Sci. Pollut. Res. Int. 2022, 29, 38054–38065. [Google Scholar] [CrossRef]
  44. Dietz, R.; Riget, F.; Johansen, P. Lead, cadmium, mercury and selenium in Greenland marine animals. Sci. Total Environ. 1996, 186, 67–93. [Google Scholar] [CrossRef]
  45. de Almeida Rodrigues, P.; Ferrari, R.G.; Kato, L.S.; Hauser-Davis, R.A.; Conte-Junior, C.A. A Systematic Review on Metal Dynamics and Marine Toxicity Risk Assessment Using Crustaceans as Bioindicators. Biol. Trace Elem. Res. 2022, 200, 881–903. [Google Scholar] [CrossRef] [PubMed]
  46. de Almeida Rodrigues, P.; Ferrari, R.G.; Hauser-Davis, R.A.; Dos Santos, L.N.; Conte-Junior, C.A. Seasonal influences on swimming crab mercury levels in an eutrophic estuary located in southeastern Brazil. Environ. Sci. Pollut. Res. Int. 2020, 27, 3473–3482. [Google Scholar] [CrossRef] [PubMed]
  47. Raknuzzaman, M.; Ahmed, K.; Islam, S.; Mamun, H.A.; Tokumura, M.; Sekine, M.; Masunaga, S. Trace metal contamination in commercial fish and crustaceans collected from coastal area of Bangladesh and health risk assessment. Environ. Sci. Pollut. Res. Int. 2016, 23, 17298–17310. [Google Scholar] [CrossRef] [PubMed]
  48. Das, S.; Tseng, L.C.; Chou, C.; Wang, L.; Souissi, S.; Hwang, J.S. Effects of cadmium exposure on antioxidant enzymes and histological changes in the mud shrimp Austinogebia edulis (Crustacea: Decapoda). Environ. Sci. Pollut. Res. Int. 2019, 26, 7752–7762. [Google Scholar] [CrossRef]
  49. Zhou, L.; Li, M.; Zhong, Z.; Chen, H.; Wang, X.; Wang, M.; Xu, Z.; Cao, L.; Lian, C.; Zhang, H.; et al. Biochemical and Metabolic Responses of the Deep-Sea Mussel Bathymodiolus Platifrons to Cadmium and Copper Exposure; Aquatic Toxicology: Amsterdam, The Netherlands, 2021; Volume 236, p. 105845. [Google Scholar] [CrossRef]
  50. Satarug, S.; Baker, J.R.; Urbenjapol, S.; Haswell-Elkins, M.; Reilly, P.E.; Williams, D.J.; Moore, M.R. A global perspective on cadmium pollution and toxicity in non-occupationally exposed population. Toxicol. Lett. 2003, 137, 65–83. [Google Scholar] [CrossRef]
  51. Cao, R.; Liu, Y.; Wang, Q.; Dong, Z.; Yang, D.; Liu, H.; Ran, W.; Qu, Y.; Zhao, J. Seawater acidification aggravated cadmium toxicity in the oyster Crassostrea gigas: Metal bioaccumulation, subcellular distribution and multiple physiological responses. Sci. Total Environ. 2018, 642, 809–823. [Google Scholar] [CrossRef]
  52. Alava, J.J.; Cheung, W.W.L.; Ross, P.S.; Sumaila, U.R. Climate change-contaminant interactions in marine food webs: Toward a conceptual framework. Glob. Chang. Biol. 2017, 23, 3984–4001. [Google Scholar] [CrossRef]
  53. Janković, S.; Stošić, M.; Miljaković, E.A.; Ćurčić, M.; Ćosić, D.; Đorđević, A.B.; Bulat, Z.; Antonijević, B. Cadmium dietary exposure assessment in the adult population and pre-school children in the Republic of Serbia. Food Addit. Contam. Part A Chem. Anal. Control. Expo. Risk Assess. 2023, 40, 67–80. [Google Scholar] [CrossRef]
  54. Stein, J.; Schettler, T.; Wallinga, D.; Valenti, M. In harm’s way: Toxic threats to child development. J. Dev. Behav. Pediatr. JDBP 2002, 23, S13–S22. [Google Scholar] [CrossRef]
  55. Perugini, M.; Visciano, P.; Manera, M.; Abete, M.C.; Tarasco, R.; Amorena, M. Lead, cadmium and chromium in raw and boiled portions of Norway lobster. Food Addit. Contam. Part B Surveill. 2014, 7, 267–272. [Google Scholar] [CrossRef] [PubMed]
Figure 1. Cd concentration levels in aquatic products in 11 cities in Zhejiang Province, China, from 2018 to 2022. (a) Temporal distribution from 2018 to 2022; (b) temporal distribution in 11 cities.
Foods 12 03094 g001
Figure 2. The consequence of health risk classification assessment.
Foods 12 03094 g002
Table 1. Cd concentrations in the six aquatic food groups in Zhejiang Province, China.
Food TypeNCd Concentration (mg/kg)Food Consumption (g/day)
<LODMean ± SDMedianP97.5
Freshwater fish11136770.00988 ± 0.03250.001500.093716.5 ± 26.3
Marine fish8322270.0417 ± 0.2360.006360.25815.2 ± 29.7
Freshwater crustaceans22555440.0940 ± 0.3940.01300.5503.91 ± 11.8
Marine crustaceans32471161.47 ± 2.410.6048.2909.23 ± 18.8
Mollush2249600.925 ± 1.560.3905.3301.83 ± 6.76
Others660630.180 ± 0.9570.02301.2000.588 ± 4.59
Total10,35616870.699 ± 1.6810.05825.20047.3 ± 51.6
Table 2. Cd exposure levels in aquatic foods and their contributions to dietary exposure level (%) in Zhejiang Province, China.
Food TypeCd Exposure (mg/kg BW/month)
Mean ± SDMedianP97.5Contribution (%)
Freshwater fish0.0000891 ± 0.00014300.0004700.937
Marine fish0.000360 ± 0.00067200.002103.79
Freshwater crustaceans0.000214 ± 0.00073500.002002.25
Marine crustaceans0.00786 ± 0.017600.053882.7
Mollush0.000960 ± 0.0037300.011310.1
Others0.0000616 ± 0.00049500.0007660.648
Total0.00951 ± 0.01890.0009010.0589100
Table 3. Cd exposure levels in aquatic products in 11 cities in Zhejiang Province, China.
AreaNExposure (mg/kg BW/month)
Mean ± SDMedianP97.5
Hangzhou17150.00216 ± 0.006320.0001710.0201
Ningbo27180.0148 ± 0.01930.008000.0662
Wenzhou26720.0182 ± 0.02200.012200.0753
Jiaxing18900.00618 ± 0.01520.0005620.0457
Huzhou9320.00441 ± 0.01050.0004970.0295
Shaoxing8890.00567 ± 0.01110.0005590.0352
Jinhua27590.00213 ± 0.008280.00005340.0236
Quzhou8630.000254 ± 0.001560.000000.000933
Zhoushan8890.0229 ± 0.02500.01700.0852
Taizhou18250.0182 ± 0.02750.01030.0827
Lishui17610.0039 ± 0.01850.0001300.0345
Total18,9130.00951 ± 0.01890.0009000.0589
Table 4. Cd exposure levels in aquatic foods by age–sex groups of the population in Zhejiang Province, China.
Population GroupsNCd Exposure (mg/kg BW/month)
Mean ± SDMedianP97.5
2–3 yr3070.0239 ± 0.0504 c,d,e,f0.003120.152
4–11 yr18160.0161 ± 0.0315 c,e,f0.001410.0958
12–17 yr,male5040.0105 ± 0.0205 a,b0.0006980.0730
12–17 yr,female5250.0107 ± 0.0198 a0.0007570.0660
≥18 yr,male78680.00816 ± 0.0143 a,b0.0008240.0493
≥18 yr,female78930.00864 ± 0.0158 a,b0.0009010.0546
General population18,9130.00951 ± 0.01890.0009010.0589
a statistically significant difference between 2–3 yr and any other age–sex group at p < 0.01. b statistically significant difference between 4–11 yr and any other age–sex group at p < 0.01. c statistically significant difference between 12–17 yr(male) and any other age–sex group at p < 0.01. d statistically significant difference between 12–17 yr(female) and any other age–sex group at p < 0.01. e statistically significant difference between ≥18 yr(male) and any other age–sex group at p < 0.01. f statistically significant difference between ≥18 yr(female) and any other age–sex group at p < 0.01.
Disclaimer/Publisher’s Note: The statements, opinions and data contained in all publications are solely those of the individual author(s) and contributor(s) and not of MDPI and/or the editor(s). MDPI and/or the editor(s) disclaim responsibility for any injury to people or property resulting from any ideas, methods, instructions or products referred to in the content.

