
Optimization of the Processing Conditions for the Production of a Gluten-Free Bread from Sour Cassava Starch (Manihot esculenta) and Some Legumes (Arachis hypogaea, Vigna unguiculata, and Glycine max)
 , and
, and
Abstract
:
1. Introduction
2. Materials and Methods
2.1. Materials
2.2. Sampling
2.3. Characterization of the Starch and the Different Flours
2.3.1. Proximate Composition
2.3.2. Mineral Profile Using Inductively Coupled Plasma Optical Emission Spectrometry (ICP-OES)
2.3.3. Determination of Anti-Nutrient Content
2.4. Mixture Design
2.5. Model Validation
2.6. Bread Production and Evaluation of the Responses
2.6.1. Bread Production
2.6.2. Overall Acceptability
2.6.3. Specific Volume
2.6.4. Protein Content
2.7. Multiple Optimizations of the Responses
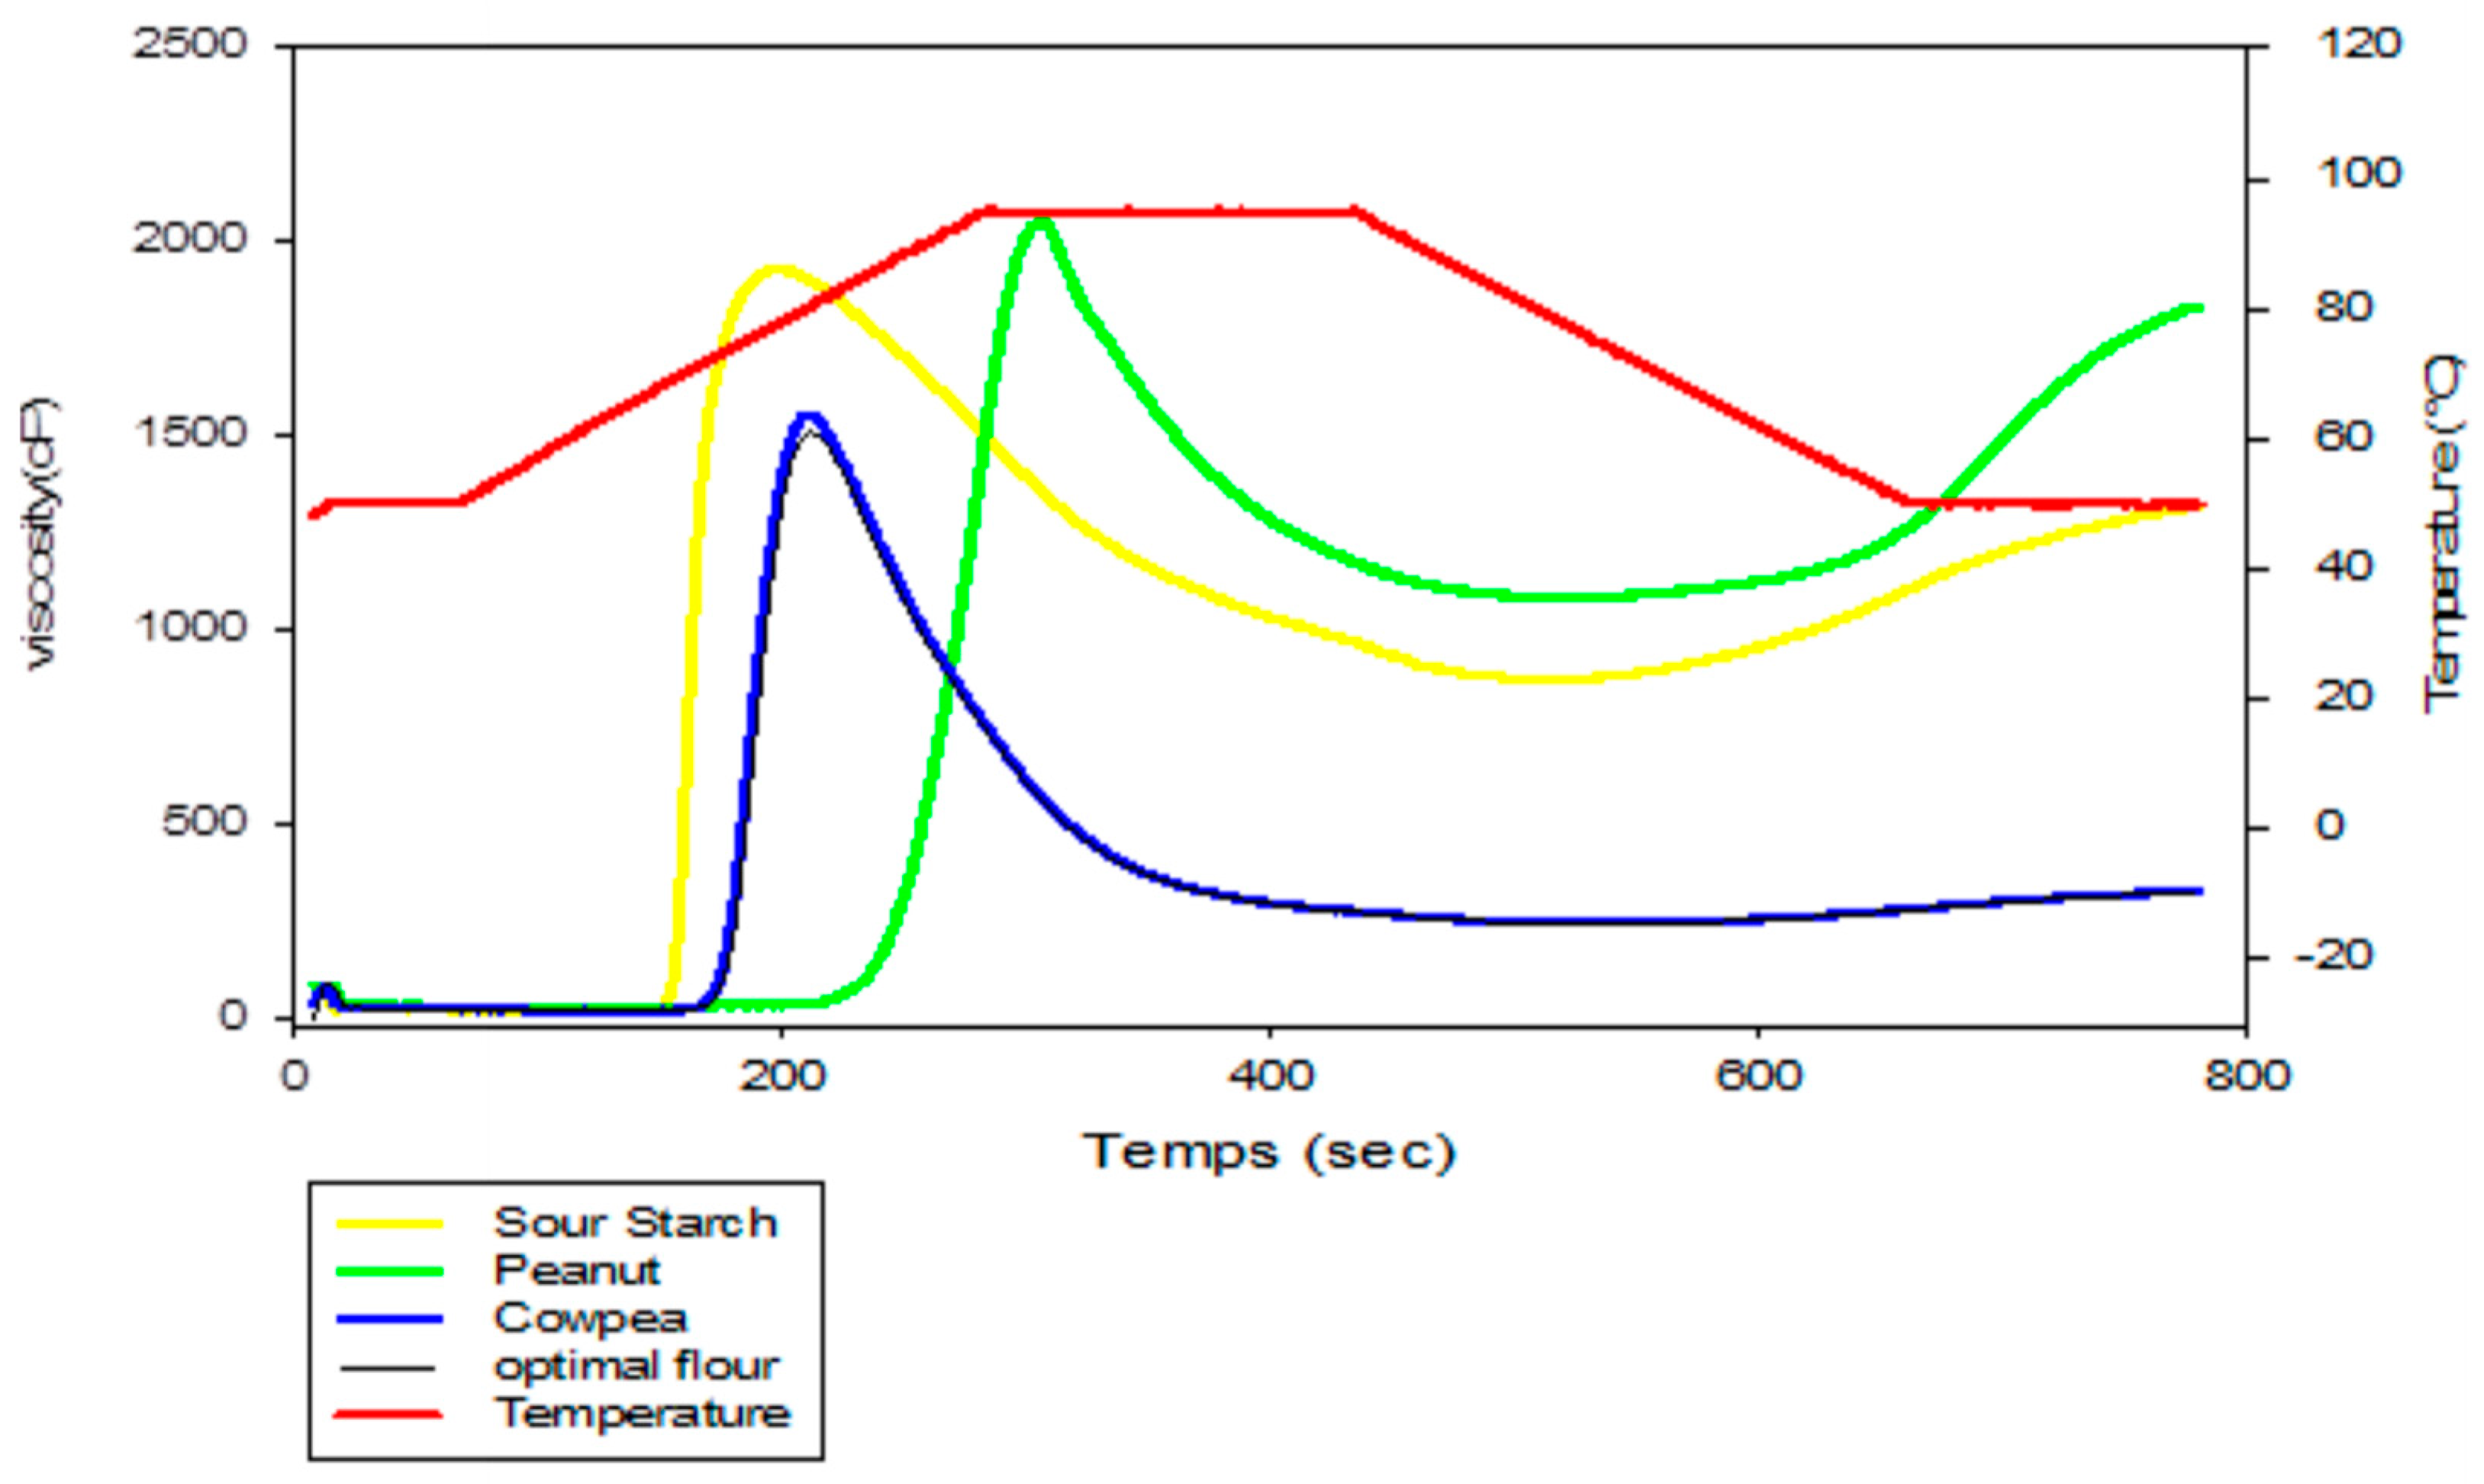
2.8. Evaluation of the Pasting Properties of Sour Cassava Starch, Cowpea Flour, Peanut Powder and Optimum Flour
2.9. Comparative Study of the Optimal Bread with Cheese Bread
2.9.1. Evaluation of the Proximate Composition
2.9.2. Evaluation of the Sensory Parameters
2.9.3. Evaluation of the Textural Properties
2.10. Statistical Analysis
3. Results and Discussion
3.1. Proximate Composition of the Different Flours
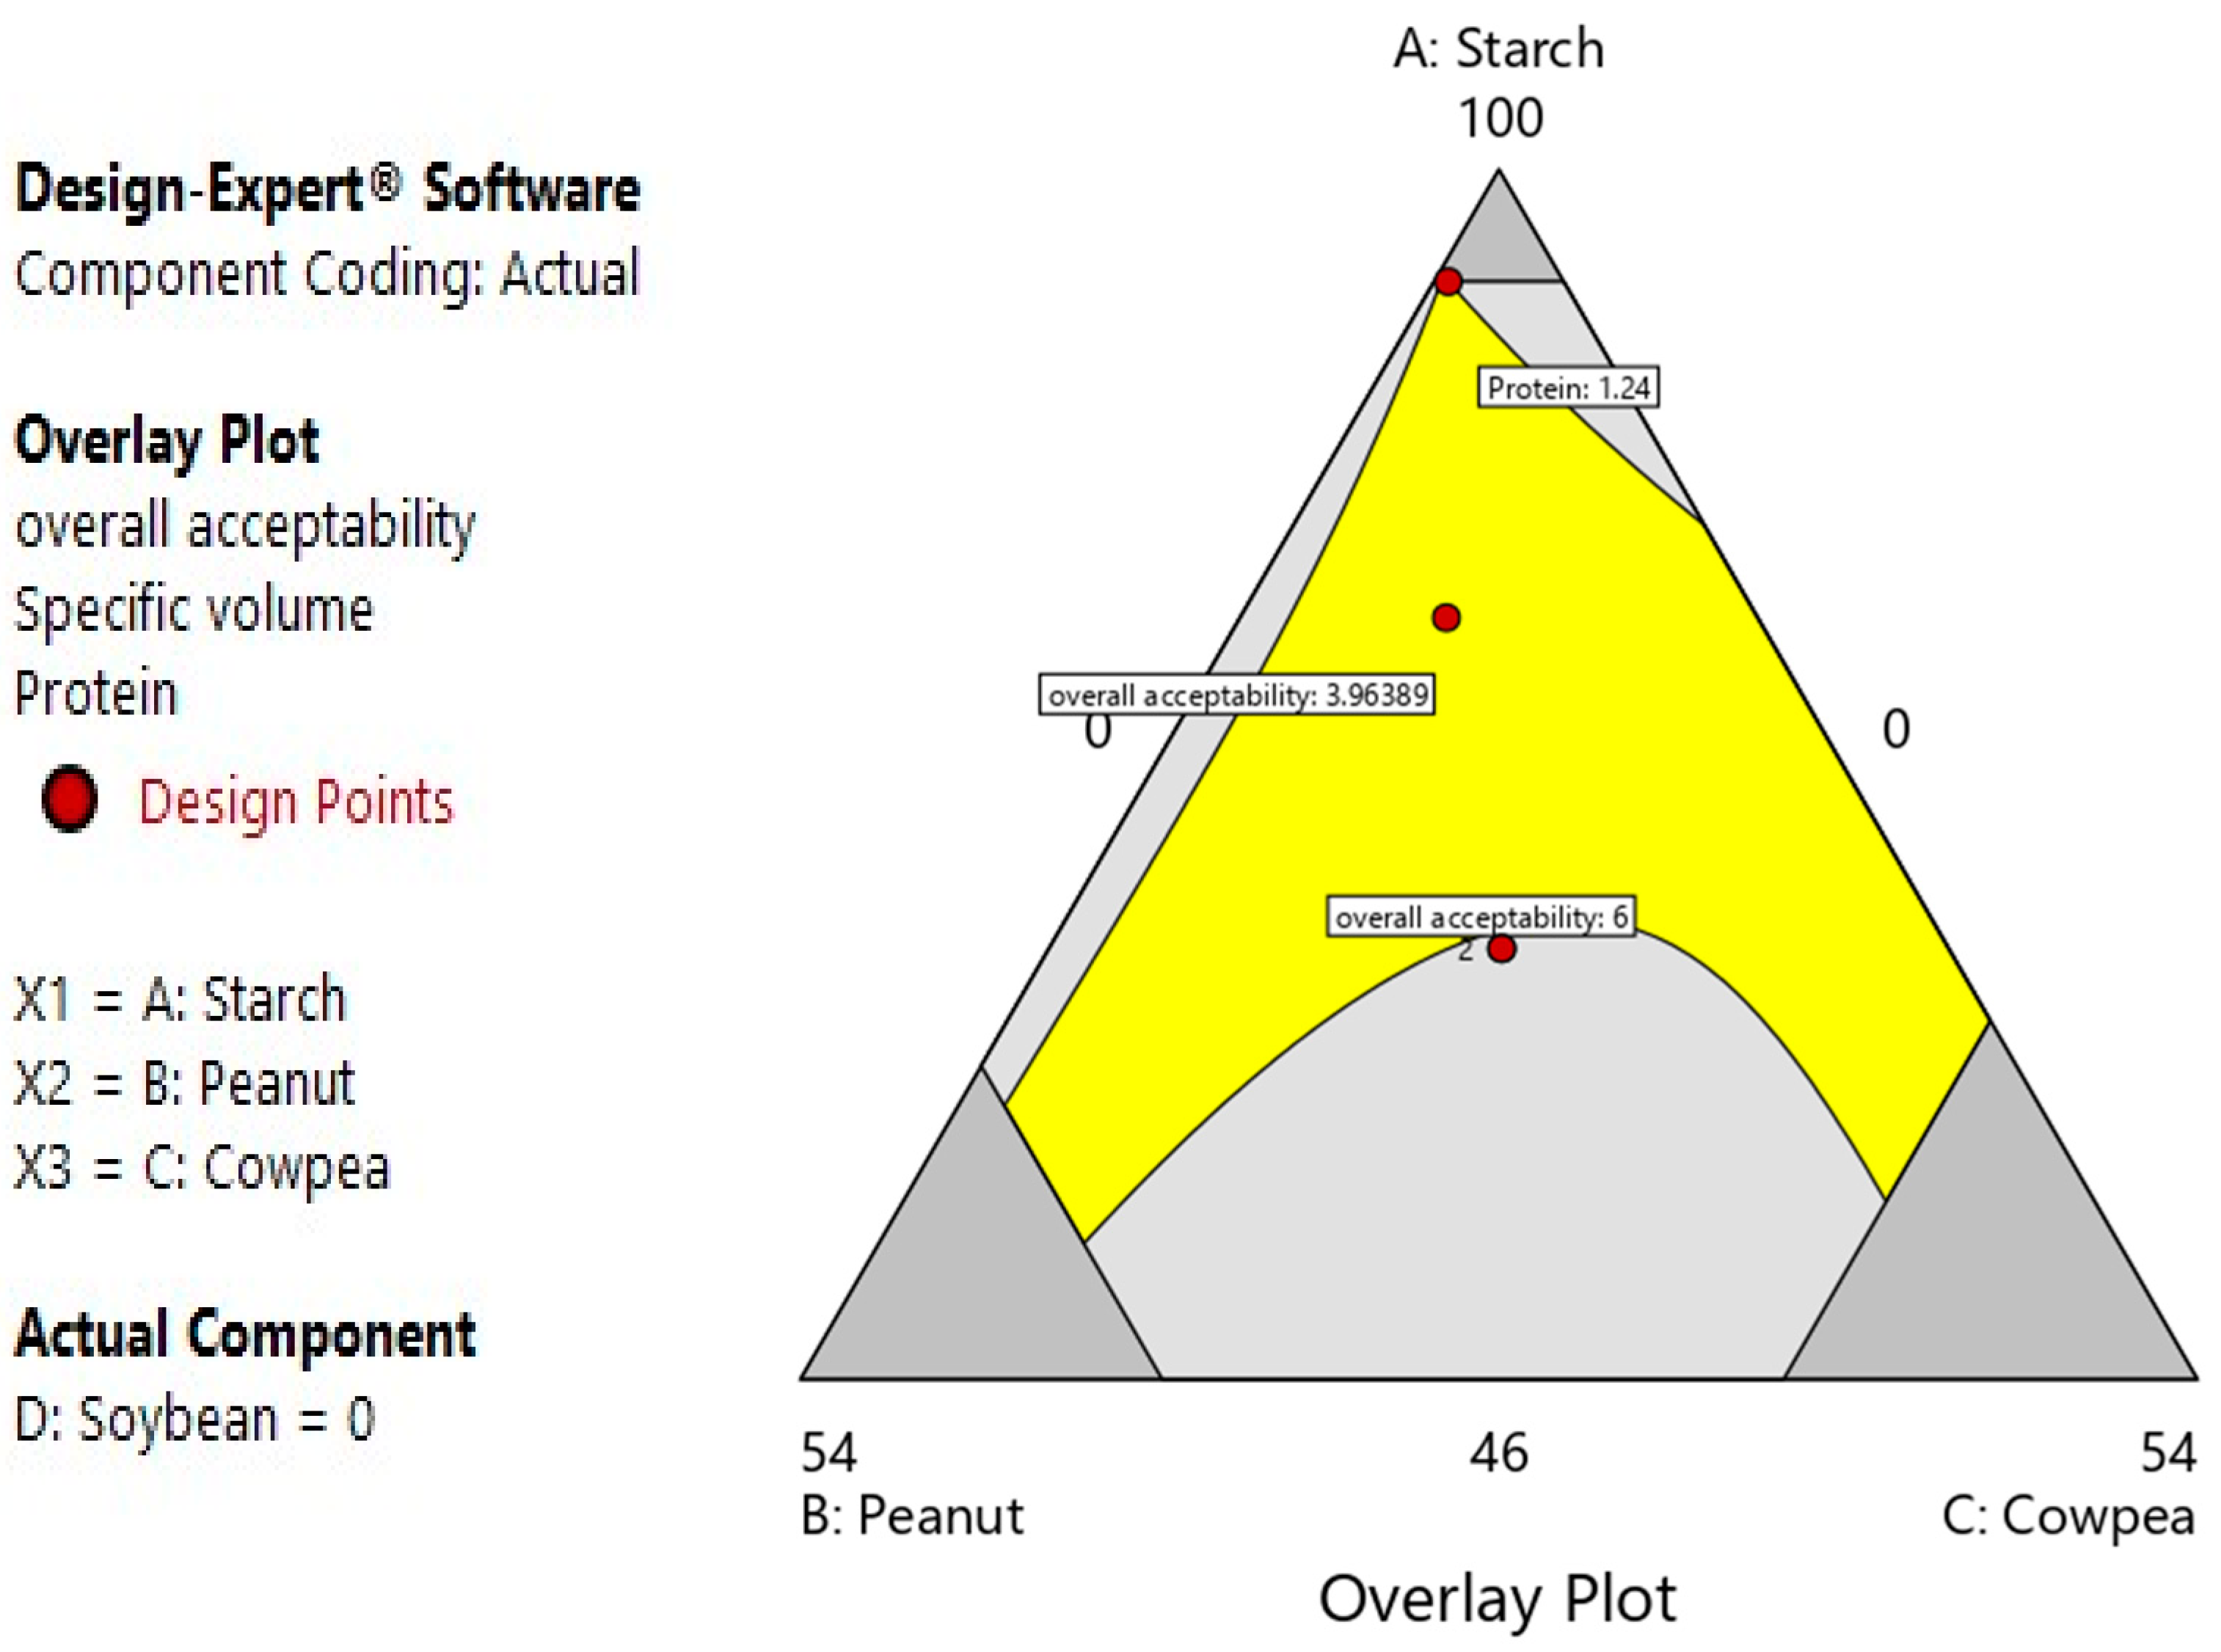
3.2. Mixture Design
3.2.1. Presentation of Different Factors and Responses
3.2.2. Mathematical Model
3.2.3. Effect of Components, Model Fitness, Model Testing and Responses Surface Analysis of the Overall Acceptability
3.2.4. Effect of Components, Model Fitness, Model Testing and Responses Surface Analysis of Bread’s Specific Volume
3.2.5. Effect of Components, Model Fitness, Model Testing and Responses Surface Analysis of Bread’s Protein Content
3.2.6. Multiple Optimizations for Bread Formulation
3.3. Pasting Properties of Sour Cassava Starch, Cowpea Flour, Peanut Powder and Optimum Flour
3.4. Comparative Study of the Optimal Bread with Cheese Bread
3.4.1. Approximate Chemical Composition
3.4.2. Sensory Profile
3.4.3. Textural Profile
4. Conclusions
Author Contributions
Funding
Informed Consent Statement
Data Availability Statement
Acknowledgments
Conflicts of Interest
References
- Cock, J.H.; Connor, D.J. Cassava. In Crop Physiology Case Histories for Major Crops; Elsevier: Amsterdam, The Netherlands, 2021; pp. 588–633. ISBN 978-0-12-819194-1. [Google Scholar]
- Chisenga, S.M.; Workneh, T.S.; Bultosa, G.; Alimi, B.A. Progress in Research and Applications of Cassava Flour and Starch: A Review. J. Food Sci. Technol. 2019, 56, 2799–2813. [Google Scholar] [CrossRef] [PubMed]
- FAO. Moving Forward on Food Loss and Waste Reduction; The state of food and agriculture; Food and Agriculture Organization of the United Nations: Rome, Italy, 2019; ISBN 978-92-5-131789-1. [Google Scholar]
- Alvarado, P.M.; Grosmaire, L.; Dufour, D.; Toro, A.G.; Sánchez, T.; Calle, F.; Santander, M.A.M.; Ceballos, H.; Delarbre, J.L.; Tran, T. Combined Effect of Fermentation, Sun-Drying and Genotype on Breadmaking Ability of Sour Cassava Starch. Carbohydr. Polym. 2013, 98, 1137–1146. [Google Scholar] [CrossRef] [PubMed]
- Oliveira, D.I.D.; Demogalski, L.; Dias, A.H.; Pereira, L.A.A.; Alberti, A.; Los, P.R.; Demiate, I.M. Traditional Sour Cassava Starch Obtained with Alterations in the Solar Drying Stage. Food Sci. Technol. 2021, 41, 319–327. [Google Scholar] [CrossRef]
- Rattan, S.I.S.; Kaur, G. (Eds.) Nutrition, Food and Diet in Ageing and Longevity; Healthy Ageing and Longevity; Springer International Publishing: Cham, Switzerland, 2021; Volume 14, ISBN 978-3-030-83016-8. [Google Scholar]
- Gharibzahedi, S.M.T.; Jafari, S.M. The Importance of Minerals in Human Nutrition: Bioavailability, Food Fortification, Processing Effects and Nanoencapsulation. Trends Food Sci. Technol. 2017, 62, 119–132. [Google Scholar] [CrossRef]
- Singh, S.; Singh, G.; Arya, S.K. Mannans: An Overview of Properties and Application in Food Products. Int. J. Biol. Macromol. 2018, 119, 79–95. [Google Scholar] [CrossRef]
- Clareto, S.S.; Nelson, D.L.; Pereira, A.J.G. Influence of a Protein Concentrate Used as a Fat Substitute on the Quality of Cheese Bread. Braz. Arch. Biol. Technol. 2006, 49, 1019–1025. [Google Scholar] [CrossRef]
- Taverna, L.G.; Leonel, M.; Mischan, M.M. Changes in physical properties of extruded sour cassava starch and quinoa flour blend snacks. Food Sci. Technol. 2012, 32, 826–834. [Google Scholar] [CrossRef]
- Mesquita, C.D.B.; Leonel, M.; Mischan, M.M. Effects of Processing on Physical Properties of Extruded Snacks with Blends of Sour Cassava Starch and Flaxseed Flour. Food Sci. Technol. 2013, 33, 404–410. [Google Scholar] [CrossRef]
- Cavalcante, R.B.M.; Morgano, M.A.; Glória, M.B.A.; Rocha, M.d.M.; Araújo, M.A.d.M.; Moreira-Araújo, R.S.d.R. Mineral Content, Phenolic Compounds and Bioactive Amines of Cheese Bread Enriched with Cowpea. Food Sci. Technol. 2019, 39, 843–849. [Google Scholar] [CrossRef]
- Aleem Zaker, M.D.; Genitha, T.R.; Hashmi, S.I. Effects of Defatted Soy Flour Incorporation on Physical, Sensorial and Nutritional Properties of Biscuits. J. Food Process Technol. 2012, 3, 4. [Google Scholar] [CrossRef]
- Salve, A.R.; Arya, S.S. Bioactive Constituents, Microstructural and Nutritional Quality Characterisation of Peanut Flat Bread. Food Meas. 2020, 14, 1582–1594. [Google Scholar] [CrossRef]
- AACC International. Method 44-15A, Approved Methods of Analysis, 10th ed.; The American Association of Cereal Chemists: St. Paul, MN, USA, 2010. [Google Scholar]
- Kavanagh, F. Official Methods of Analysis of the AOAC, 13th Ed. Edited by WILLIAM HORWITZ. The Association of Official Analytical Chemists, 1111 N. 19th St., Arlington, VA 22209. 1980. 1038pp. 22 × 28cm. 2.4kg. Price $78.00. J. Pharm. Sci. 1981, 70, 468. [Google Scholar] [CrossRef]
- AOAC. Official Methods of Analysis, 15th ed.; Sec.985.29; Association of Official Analytical Chemist: Arlington, VA, USA, 1990; Volume II. [Google Scholar]
- Bourely, J. Observation Sur Le Dosage de l’huile Des Graines de Cotonnier. Coton Fibres Trop. 1982, 37, 183–196. [Google Scholar]
- AACC. Crude Protein: Improved Kjeldahl Method for Nitrate-Free Samples, Method 46-11. In Approved Methods of the AACC, 8th ed.; Association of American Cereal Chemists Inc.: St. Paul, MN, USA, 1983. [Google Scholar]
- AOAC. Official Method of Analysis of the Association of Official Analytical Chemists, 15th ed.; AOAC International: Arlington, TX, USA, 2000. [Google Scholar]
- Biata, N.R.; Dimpe, K.M.; Ramontja, J.; Mketo, N.; Nomngongo, P.N. Determination of Thallium in Water Samples Using Inductively Coupled Plasma Optical Emission Spectrometry (ICP-OES) after Ultrasonic Assisted-Dispersive Solid Phase Microextraction. Microchem. J. 2018, 137, 214–222. [Google Scholar] [CrossRef]
- Erratta and Emendations Emendations, Official Methods of Analysis, AOAC. J. Assoc. Off. Anal. Chem. 1971, 54, 497.
- Bainbridge, Z.; Tomlins, K.; Wellings, K.; Westby, K. Methods for Assessing Quality Characteristics of Non-Grain Starch Staples. (Part 3). Laboratory Methods. Nat. Resour. Inst. 1996. [Google Scholar]
- AOAC. Official Methods of Analysis, 15th ed.; Association of Official Analytical Chemist: Washington, DC, USA, 1990. [Google Scholar]
- Becerra, M.; Goos, P. Bayesian I-Optimal Designs for Choice Experiments with Mixtures. Chemom. Intell. Lab. Syst. 2021, 217, 104395. [Google Scholar] [CrossRef]
- Mohamad Zen, N.I.; Abd Gani, S.S.; Shamsudin, R.; Fard Masoumi, H.R. The Use of D-Optimal Mixture Design in Optimizing Development of Okara Tablet Formulation as a Dietary Supplement. Sci. World J. 2015, 2015, 684319. [Google Scholar] [CrossRef]
- Koppel, K. Sensory Analysis of Pet Foods: Sensory Analysis of Pet Foods. J. Sci. Food Agric. 2014, 94, 2148–2153. [Google Scholar] [CrossRef]
- AACC International. Approved Methods of Analysis, Method 10-05.01. Guidelines for Measurement of Volume by Rapeseed Dis-Placement, 11th ed.; The American Association of Cereal Chemists: St. Paul, MN, USA, 2001. [Google Scholar]
- Sánchez, T.; Salcedo, E.; Ceballos, H.; Dufour, D.; Mafla, G.; Morante, N.; Calle, F.; Pérez, J.C.; Debouck, D.; Jaramillo, G.; et al. Screening of Starch Quality Traits in Cassava (Manihot Esculenta Crantz). Starch—Stärke 2009, 61, 12–19. [Google Scholar] [CrossRef]
- Shobharani, P.; Prakash, M.; Halami, P.M. Probiotic Bacillus spp. in Soy-Curd: Nutritional, Rheological, Sensory, and Antioxidant Properties. J. Food Sci. 2015, 80, M2247–M2256. [Google Scholar] [CrossRef] [PubMed]
- Lemos, A.d.R.; Capriles, V.D.; Pinto e Silva, M.E.M.; Arêas, J.A.G. Effect of Incorporation of Amaranth on the Physical Properties and Nutritional Value of Cheese Bread. Food Sci. Technol. 2012, 32, 427–431. [Google Scholar] [CrossRef]
- Mahapatra, A.K.; Melton, S.L.; Isang, E.M. Effect of Moisture Content on Thermal Properties of Cowpea Flours. Agric. Eng. Int. 2013, 15, 251–255. [Google Scholar]
- Solayman, M.; Islam, M.A.; Paul, S.; Ali, Y.; Khalil, M.I.; Alam, N.; Gan, S.H. Physicochemical Properties, Minerals, Trace Elements, and Heavy Metals in Honey of Different Origins: A Comprehensive Review: Minerals and Trace Elements in Honey. Compr. Rev. Food Sci. Food Saf. 2016, 15, 219–233. [Google Scholar] [CrossRef] [PubMed]
- Abbas, Y.; Ahmad, A. Impact of Processing on Nutritional and Antinutritional Factors of Legumes: A Review. Ann. Food Sci. Technol. 2018, 19, 199–215. [Google Scholar]
- Ahmed, M.I.; Xu, X.; Sulieman, A.A.; Na, Y.; Mahdi, A.A. The Effect of Fermentation Time on in Vitro Bioavailability of Iron, Zinc, and Calcium of Kisra Bread Produced from Koreeb (Dactyloctenium Aegyptium) Seeds Flour. Microchem. J. 2020, 154, 104644. [Google Scholar] [CrossRef]
- Gan, H.E.; Karim, R.; Muhammad, S.K.S.; Bakar, J.A.; Hashim, D.M.; Rahman, R.A. Optimization of the Basic Formulation of a Traditional Baked Cassava Cake Using Response Surface Methodology. LWT—Food Sci. Technol. 2007, 40, 611–618. [Google Scholar] [CrossRef]
- Lawless, H.T.; Heymann, H. Sensory Evaluation of Food: Principles and Practices; Food Science Text Series; Springer New York: New York, NY, USA, 2010; ISBN 978-1-4419-6487-8. [Google Scholar]
- Palczak, J.; Blumenthal, D.; Rogeaux, M.; Delarue, J. Sensory Complexity and Its Influence on Hedonic Responses: A Systematic Review of Applications in Food and Beverages. Food Qual. Prefer. 2019, 71, 66–75. [Google Scholar] [CrossRef]
- Olojede, A.O.; Sanni, A.I.; Banwo, K. Effect of Legume Addition on the Physiochemical and Sensorial Attributes of Sorghum-Based Sourdough Bread. LWT 2020, 118, 108769. [Google Scholar] [CrossRef]
- Belton, P.S. 13—The Molecular Basis of Dough Rheology. In Breadmaking, 2nd ed.; Cauvain, S.P., Ed.; Woodhead Publishing Series in Food Science, Technology and Nutrition; Woodhead Publishing: Sawston, UK, 2012; pp. 337–351. ISBN 978-0-85709-060-7. [Google Scholar]
- Bird, L.G.; Pilkington, C.L.; Saputra, A.; Serventi, L. Products of Chickpea Processing as Texture Improvers in Gluten-Free Bread. Food Sci. Technol. Int. 2017, 23, 690–698. [Google Scholar] [CrossRef]
- Starowicz, M.; Zieliński, H. How Maillard Reaction Influences Sensorial Properties (Color, Flavor and Texture) of Food Products? Food Rev. Int. 2019, 35, 707–725. [Google Scholar] [CrossRef]
- Paravisini, L.; Guichard, E. Interactions between Aroma Compounds and Food Matrix. In Flavour; Guichard, E., Salles, C., Morzel, M., Le Bon, A.-M., Eds.; John Wiley & Sons, Ltd.: Chichester, UK, 2016; pp. 208–234. ISBN 978-1-118-92938-4. [Google Scholar]
- Mefleh, M.; Conte, P.; Fadda, C.; Giunta, F.; Piga, A.; Hassoun, G.; Motzo, R. From Ancient to Old and Modern Durum Wheat Varieties: Interaction among Cultivar Traits, Management, and Technological Quality. J. Sci. Food Agric. 2018, 99, 2059–2067. [Google Scholar] [CrossRef] [PubMed]
- Dankwa, R.; Aisala, H.; Kayitesi, E.; de Kock, H.L. The Sensory Profiles of Flatbreads Made from Sorghum, Cassava, and Cowpea Flour Used as Wheat Flour Alternatives. Foods 2021, 10, 3095. [Google Scholar] [CrossRef] [PubMed]
- Hernández-Aguirre, M.A.; Islas-Hernández, J.J.; Sánchez-Pardo, M.E.; Rodríguez-Ambriz, S.L.; Osorio-Díaz, P. Response Surface Methodology for Optimization of Gluten-Free Bread Made with Unripe Banana Flour. Food Meas. 2019, 13, 1652–1660. [Google Scholar] [CrossRef]
- Miñarro, B.; Albanell, E.; Aguilar, N.; Guamis, B.; Capellas, M. Effect of Legume Flours on Baking Characteristics of Gluten-Free Bread. J. Cereal Sci. 2012, 56, 476–481. [Google Scholar] [CrossRef]
- Bojňanská, T.; Musilová, J.; Vollmannová, A. Effects of adding legume flours on the rheological and breadmaking properties of dough. Foods 2021, 10, 1087. [Google Scholar] [CrossRef]
- Cavalcante, R.B.M.; Morgano, M.A.; Silva, K.J.D.; Rocha, M.D.M.; Araújo, M.A.D.M.; Moreira-Araújo, R.S.D.R. Cheese Bread Enriched with Biofortified Cowpea Flour. Ciênc. Agrotec. 2016, 40, 97–103. [Google Scholar] [CrossRef]
- Bonku, R.; Yu, J. Health Aspects of Peanuts as an Outcome of Its Chemical Composition. Food Sci. Hum. Wellness 2020, 9, 21–30. [Google Scholar] [CrossRef]
- Wang, K.; Lu, F.; Li, Z.; Zhao, L.; Han, C. Recent Developments in Gluten-Free Bread Baking Approaches: A Review. Food Sci. Technol. 2017, 37, 1–9. [Google Scholar] [CrossRef]
- Gebrelibanos, M.; Tesfaye, D.; Raghavendra, Y.; Sintayeyu, B. Nutritional and Health Implications of Legumes. Int. J. Pharm. Sci. Res. 2013, 4, 12. [Google Scholar]
- Singh, S.; Singh, N.; Ezekiel, R.; Kaur, A. Effects of Gamma-Irradiation on the Morphological, Structural, Thermal and Rheological Properties of Potato Starches. Carbohydr. Polym. 2011, 83, 1521–1528. [Google Scholar] [CrossRef]
- Mohammed, I.; Ahmed, A.R.; Senge, B. Effects of Chickpea Flour on Wheat Pasting Properties and Bread Making Quality. J. Food Sci. Technol. 2014, 51, 1902–1910. [Google Scholar] [CrossRef] [PubMed]
- Yao, Y.; He, W.; Cai, X.; Bekhit, A.E.A.; Xu, B. Sensory, Physicochemical and Rheological Properties of Plant-based Milk Alternatives Made from Soybean, Peanut, Adlay, Adzuki Bean, Oat and Buckwheat. Int. J. Food Sci. Tech. 2022, 57, 4868–4878. [Google Scholar] [CrossRef]
- Zarguili, I.; Maache-Rezzoug, Z.; Loisel, C.; Doublier, J.-L. Influence of DIC Hydrothermal Process Conditions on the Gelatinization Properties of Standard Maize Starch. J. Food Eng. 2006, 77, 454–461. [Google Scholar] [CrossRef]
- Ho, T.H.; Lim, N.; Camerer, C.F. Modeling the Psychology of Consumer and Firm Behavior with Behavioral Economics. J. Mark. Res. 2006, 43, 307–331. [Google Scholar] [CrossRef]
- Hoover, R.; Ratnayake, W.S. Starch Characteristics of Black Bean, Chick Pea, Lentil, Navy Bean and Pinto Bean Cultivars Grown in Canada. Food Chem. 2002, 78, 489–498. [Google Scholar] [CrossRef]
- Balasubramanian, S.; Sharma, R.; Kaur, J.; Bhardwaj, N. Characterization of Modified Pearl Millet (Pennisetum Typhoides) Starch. J. Food Sci. Technol. 2014, 51, 294–300. [Google Scholar] [CrossRef] [PubMed]
- Olapade, A.A.; Oluwole, O.B. Bread Making Potential of Composite Flour of Wheat-Acha (Digitaria Exilis Staph) Enriched with Cowpea (Vigna Unguiculata L. Walp) Flour. Niger. Food J. 2013, 31, 6–12. [Google Scholar] [CrossRef]
- Moneim, E.; Sulieman, A.; Mohamed Ali, R.A.; Abdel Razig, K. Production and Effect of Storage in the Chemical Composition of Mozzarella Cheese. Food 2012, 2, 21–26. [Google Scholar] [CrossRef]
- Klupšaitė, D.; Juodeikienė, G. Legume: Composition, Protein Extraction and Functional Properties. A Review. ChemTech 2015, 66, 5–12. [Google Scholar] [CrossRef]


| Sample | Starch | Peanut | Cowpea | Soybean |
|---|---|---|---|---|
| Protein (g/100 g) | 00 ± 00 e | 28.8 ± 0.14 b | 26.87 ± 0.14 c | 36.02 ± 0.24 c |
| Lipid (g/100 g) | 00 ± 00 e | 48.82 ± 0.005 a | 3.09 ± 0.60 d | 20.02 ± 0.06 d |
| Carbohydrate (g/100 g) | 84.8 ± 1.57 a | 23.2 ± 0.09 e | 59.05 ± 0.49 c | 23.01 ± 0.04 c |
| Water (g/100 g) | 15.2 ± 0.03 a | 13.36 ± 0.04 a | 12.4 ± 0.035 b | 12.01 ± 0.35 b |
| Fiber (g/100 g) | 0.10 ± 0.05 a | 5.84 ± 0.04 b | 6.16 ± 0.02 a | 5.04 ± 0.08 a |
| Ash (g/100 g) | 0.70 ± 0.70 e | 2.65 ± 0.07 a | 0.75 ± 0.07 e | 4.09 ± 0.007 e |
| Sample | Starch | Cowpea | Peanut | Soybean |
|---|---|---|---|---|
| P (mg/100 g) | 16.59 ± 1.55 d | 352.32 ± 2.6 b | 330.70 ± 1.6 c | 695.20 ± 10.1 a |
| Si (mg/100 g) | 27.23 ± 025 a | 24.32 ± 0.2 c | 24.80 ± 00.19 b | 24.2 ± 0.2 d |
| Mg (mg/100 g) | 8.08 ± 2.7 d | 150.27 ± 1.7 c | 196.91 ± 1.3 b | 258.24 ± 2.6 a |
| K (mg/100 g) | 66.38 ± 1.82 a | 909.31 ± 51.83 a | 820.36 ± 43.63 b | 1797 ± 18.9 a |
| Ca (mg/100 g) | 12.55 ± 2.04 d | 55.07 ± 5.78 b | 46.22 ± 7.48 c | 300.36 ± 1.6 a |
| B (mg/100 g) | 0.02 ± 0.00 e | 0.33 ± 0.001 b | 0.59 ± 0.003 a | 0.29 ± 0.001 c |
| Na (mg/100 g) | 1.45 ± 0.03 d | 4.08 ± 0.7 b | 2.60 ± 0.5 c | 3.0 ± 1.0 a |
| Mg (mg/100 g) | 7.95 ± 0.9 d | 141.04 ± 1.6 c | 182.47 ± 1.1 a | 152.05 ± 1.6 b |
| Al (mg/100 g) | 4.19 ± 0.05 b | 0.48 ± 0.09 d | 1.25 ± 0.02 c | 17.5 ± 1.2 a |
| Ti (mg/100 g) | 0.12 ± 0.003 | 0.06 ± 0.00 | 0.097 ± 0.01 | |
| Cr (mg/100 g) | - | - | 0.014 ± 0.00 | 0.125 ± 0.09 a |
| Mn | 0.10 ± 0.001 d | 1.62 ± 0.3 c | 1.47 ± 0.04 b | 25.0 ± 0.2 a |
| Fe (mg/100 g) | 2.83 ± 1.1 c | 8.43 ± 0.9 b | 2.12 ± 1.00 d | 16.4 ± 1.3 a |
| Ni (mg/100 g) | - | 0.15 ± 0.07 a | 0.09 ± 0.001 c | 0.1 ± 0.001 b |
| Cu (mg/100 g) | 0.038 ± 0.0005 c | 0.56 ± 0.00 c | 1.16 ± 0.08 b | 14.1 ± 0.2 a |
| Zn (mg/100 g) | 0.10 ± 0.00 d | 4.23 ± 0.9 a | 3.03 ± 0.5 b | 2.7 ± 0.6 c |
| Mo (mg/100 g) | - | 0.34 ± 0.012 a | 0.23 ± 0.06 c | 0.24 ± 0.012 b |
| Ba (mg/100 g) | 0.042 ± 0.001 d | 0.60 ± 0.00 c | 0.63 ± 0.0005 a | 0.61 ± 0.00 b |
| Sample | Phytate | Oxalates | Tannins |
|---|---|---|---|
| Peanut (mg/100 g) | 58.67 ± 0.02 a | 54.07 ± 1.59 a | 15.28 ± 2.93 a |
| Cowpea (mg/100 g) | 45.76 ± 0.08 b | 43.58 ± 4.77 b | 13.65 ± 3.54 b |
| Soybean (mg/100 g) | 40.66 ± 0.07 c | 39.67 ± 4.08 c | 12.78 ± 2.84 c |
| Tests Component for a 100 g Mixture | Responses | ||||||
|---|---|---|---|---|---|---|---|
| No | X1 (g) | X2 (g) | X3 (g) | X4 (g) | Overall Acceptability (/9) | Specific Volume (cm3/g) | Protein Content (% g/g) |
| 1 | 72.0408 | 0 | 16.3447 | 11.6146 | 5.28611 | 1.11105 | 7.35 |
| 2 | 65.2364 | 17.2673 | 17.4963 | 0 | 6.13611 | 1.26671 | 8.82 |
| 3 | 65.2364 | 17.2673 | 17.4963 | 0 | 6.03333 | 1.22783 | 8.92 |
| 4 | 46 | 20.0392 | 24.3225 | 9.63828 | 5.60278 | 0.9446 | 14.67 |
| 5 | 72.0408 | 0 | 16.3447 | 11.6146 | 5.62222 | 1.10165 | 8.3 |
| 6 | 52.5438 | 40 | 7.26479 | 0.191413 | 5.63278 | 0.74947 | 11.92 |
| 7 | 55.4307 | 9.86142 | 9.54213 | 25.1657 | 5.79444 | 0.434035 | 13.83 |
| 8 | 56.8757 | 3.77427 | 38 | 1.35 | 4.98889 | 1.07176 | 10.76 |
| 9 | 51.8986 | 26.8735 | 9.26763 | 11.9602 | 5.15278 | 0.92716 | 13.35 |
| 10 | 84.2554 | 1.26363 | 0 | 14.481 | 5.08333 | 1.31816 | 5.44 |
| 11 | 66.8888 | 22.4261 | 0 | 10.6851 | 5.34722 | 1.02632 | 9.4 |
| 12 | 66.8888 | 22.4261 | 0 | 10.6851 | 5.42778 | 0.82256 | 9.5 |
| 13 | 46 | 0 | 26.3752 | 27.6248 | 5.91667 | 1.08333 | 16.56 |
| 14 | 58.0867 | 0.795395 | 26.4669 | 14.651 | 5.30278 | 0.51182 | 12.42 |
| 15 | 52.5438 | 40 | 7.26479 | 0.191413 | 5.925 | 0.74947 | 11.94 |
| 16 | 95 | 4.45294 | 0.547063 | 0 | 3.96389 | 2.64045 | 1.24 |
| 17 | 46 | 20.0392 | 24.3225 | 9.63828 | 5.73333 | 0.95646 | 14.67 |
| 18 | 79.9959 | 12.0299 | 7.97417 | 0 | 4.75 | 2.1401 | 5.05 |
| 19 | 46 | 27.35 | 0 | 26.65 | 5.81111 | 0.307615 | 16.31 |
| 20 | 71.9847 | 0.015275 | 0 | 28 | 5.91389 | 1.27975 | 9.84 |
| Responses | Model | p-Value | Lack of Fit p-Value | R2 | R2 Adj | R2 Pred | PRESS | Remark |
|---|---|---|---|---|---|---|---|---|
| Acceptability | linear | 0.0304 | 0.0079 | 0.4182 | 0.3091 | 0.0470 | 4.83 | Suggested |
| quadratic | 0.0395 | 0.0247 | 0.8121 | 0.6431 | −1.0006 | 10.14 | Suggested | |
| Special cubic | 0.0100 | 0.4174 | 0.9735 | 0.9161 | −4.1082 | 25.90 | ||
| cubic | 0.4174 | 0.9771 | 0.9129 | Aliased | ||||
| Specific volume | linear | 0.0004 | 0.0005 | 0.6729 | 0.6116 | 0.4315 | 3.07 | |
| Quadratic | 0.0272 | 0.0018 | 0.9031 | 0.8160 | 0.4451 | 2.99 | Suggested | |
| Special cubic | 0.0978 | 0.0022 | 0.9692 | 0.9025 | −36.5607 | 202.63 | ||
| Cubic | 0.0022 | 0.9960 | 0.9848 | Aliased | ||||
| Protein content | linear | <0.0001 | 0.8237 | 0.9966 | 0.9960 | 0.9953 | 1.40 | Suggested |
| Quadratic | 0.8257 | 0.6475 | 0.9974 | 0.9950 | 0.9861 | 4.10 | ||
| Special cubic | 0.4553 | 0.9713 | 0.9984 | 0.9951 | 0.9932 | 2.02 | ||
| cubic | 0.9713 | 0.9984 | 0.9941 | Aliased |
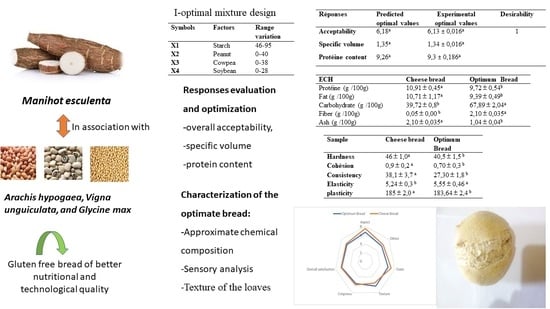
| Responses | Predicted Optimal Values | Experimental Optimal Values | Desirability |
|---|---|---|---|
| Acceptability | 6.18 a | 6.13 ± 0.016 a | 1 |
| Specific volume | 1.35 a | 1.34 ± 0.016 a | |
| Protein content | 9.26 a | 9.3 ± 0.186 a |
| Parameters | Starch | Peanut | Cowpea | Optimum |
|---|---|---|---|---|
| PV (Cp) | 1930 ± 15.48 b | 2049 ± 72.53 a | 1552 ± 8.48 c | 1509 ± 7.46 d |
| MV (Cp) | 972 ± 28.44 b | 1180 ± 82.02 a | 275.5 ± 4.94 c | 273 ± 4.74 d |
| BD (Cp) | 958 ± 44.24 c | 869 ± 40.50 d | 1276.5 ± 13.43 a | 1236 ± 9.43 b |
| FV (Cp) | 1315.5 ± 36.88 b | 1830 ± 45.66 a | 324.5 ± 4.95 c | 321 ± 2.94 d |
| SB (Cp) | 614.5 ± 52 c | 219 ± 26.87 d | 1227.5 ± 13.45 a | 1188 ± 12.43 b |
| PT (S) | 780 ± 0.00 a | 780 ± 0.04 a | 780 ± 2.82 a | 780 ± 0.00 a |
| PT °C (Cp) | 49. 3 ± 0.00 b | 50.45 ± 0.00 a | 50.04 ± 0.007 a | 50.4 ± 0.00 a |
| Sample | Cheese Bread | Optimum Bread |
|---|---|---|
| Protein (g/100 g) | 10.91 ± 0.45 a | 9.72 ± 0.54 b |
| Fat (g/100 g) | 10.71 ± 1.17 a | 9.39 ± 0.49 b |
| Carbohydrate (g/100 g) | 39.72 ± 0.8 b | 67.89 ± 2.04 a |
| Fibber (g/100 g) | 0.05 ± 0.00 b | 2.10 ± 0.035 a |
| Ash (g/100 g) | 2.10 ± 0.035 a | 1.04 ± 0.04 b |
| Sample | Cheese Bread | Optimum Bread |
|---|---|---|
| P | 395± 3.77 a | 131.05 ± 0.50 b |
| Si | 26.15 ± 5.59 a | 26.61 ± 0.09 a |
| Mg | 27.31 ± 0.39 b | 69.22 ± 1.3 a |
| K | 103.06 ± 8.32 b | 384.95 ± 9.69 a |
| Ca | 676.28 ± 80.44 a | 42.21 ± 1.82 b |
| B | 0.02 ± 0.21 a | 0.19 ± 0.007 a |
| Na | 159.36 ± 0.46 b | 216.10 ± 0.08 a |
| Mg | 26.80 ± 0.33 b | 66 ± 1.77 a |
| Al | 3.99 ± 0.32 a | 3.18 ± 0.37 b |
| K | 93.93 ± 0.87 b | 364.29 ± 12 a |
| Ti | 0.26 ± 0.04 a | 0.17 ± 5.6 b |
| Cr | 0.027 ± 0.00 b | 0.03 ± 0.02 b |
| Mn | 0.06 ± 0.00 b | 0.66 ± 0.005 a |
| Fe | 2.50 ± 0.25 b | 4.43 ± 0.403 a |
| Ni | - b | 0.74 ± 0.007 a |
| Cu | 0.04 ± 0.048 b | 0.3 ± 0.006 |
| Zn | 2.52 ± 0.0025 a | 1.75 ± 0.19 b |
| Mo | - b | 0.11 ± 0.001 a |
| Ba | 0.04 ± 0.00 b | 0.27 ± 0.014 a |
| Sample | Cheese Bread | Optimum Bread |
|---|---|---|
| Hardness | 46 ± 1.0 a | 40.5 ± 1.5 b |
| Cohesiveness | 0.9 ± 0.2 a | 0.70 ± 0.3 b |
| Consistency | 38.1 ± 3.7 a | 27.30 ± 1.8 b |
| Elasticity | 5.24 ± 0.3 b | 5.55 ± 0.46 a |
| Plasticity | 185 ± 2.0 a | 183.64 ± 2.4 b |
Disclaimer/Publisher’s Note: The statements, opinions and data contained in all publications are solely those of the individual author(s) and contributor(s) and not of MDPI and/or the editor(s). MDPI and/or the editor(s) disclaim responsibility for any injury to people or property resulting from any ideas, methods, instructions or products referred to in the content. |
© 2023 by the authors. Licensee MDPI, Basel, Switzerland. This article is an open access article distributed under the terms and conditions of the Creative Commons Attribution (CC BY) license (https://creativecommons.org/licenses/by/4.0/).
Share and Cite
Ndjang, M.M.N.; Klang, J.M.; Njapndounke, B.; Foko, M.E.K.; Dongmo, J.R.; Kamdem, M.H.K.; Tonga, J.L.; Mmutlane, E.M.; Ndinteh, D.T.; Kayitesi, E.; et al. Optimization of the Processing Conditions for the Production of a Gluten-Free Bread from Sour Cassava Starch (Manihot esculenta) and Some Legumes (Arachis hypogaea, Vigna unguiculata, and Glycine max). Foods 2023, 12, 3180. https://doi.org/10.3390/foods12173180
Ndjang MMN, Klang JM, Njapndounke B, Foko MEK, Dongmo JR, Kamdem MHK, Tonga JL, Mmutlane EM, Ndinteh DT, Kayitesi E, et al. Optimization of the Processing Conditions for the Production of a Gluten-Free Bread from Sour Cassava Starch (Manihot esculenta) and Some Legumes (Arachis hypogaea, Vigna unguiculata, and Glycine max). Foods. 2023; 12(17):3180. https://doi.org/10.3390/foods12173180
Chicago/Turabian StyleNdjang, Marie Madeleine Nanga, Julie Mathilde Klang, Bilkissou Njapndounke, Marius Edith Kouam Foko, Jean Roger Dongmo, Michael Hermann Kengne Kamdem, Jordan Lembe Tonga, Edwin Mpho Mmutlane, Derek Tantoh Ndinteh, Eugenie Kayitesi, and et al. 2023. "Optimization of the Processing Conditions for the Production of a Gluten-Free Bread from Sour Cassava Starch (Manihot esculenta) and Some Legumes (Arachis hypogaea, Vigna unguiculata, and Glycine max)" Foods 12, no. 17: 3180. https://doi.org/10.3390/foods12173180