
Emissions Reduction Strategies for the Orange and Cherry Industries in New South Wales
 , ,
, ,
Abstract
:1. Introduction
2. Materials and Methods
2.1. Boundaries
2.2. System Descriptions
2.2.1. Lapin Cherries
2.2.2. Navel Oranges
2.3. Climate Change Mitigation Strategies
2.3.1. Avoided Emissions
Nitrification Inhibition
Renewable Energy
Green N
2.3.2. Carbon Sequestration
Pyrolysis
Revegetation
2.4. Data Sources
2.5. GHG Emissions and Sequestration Calculations
3. Results
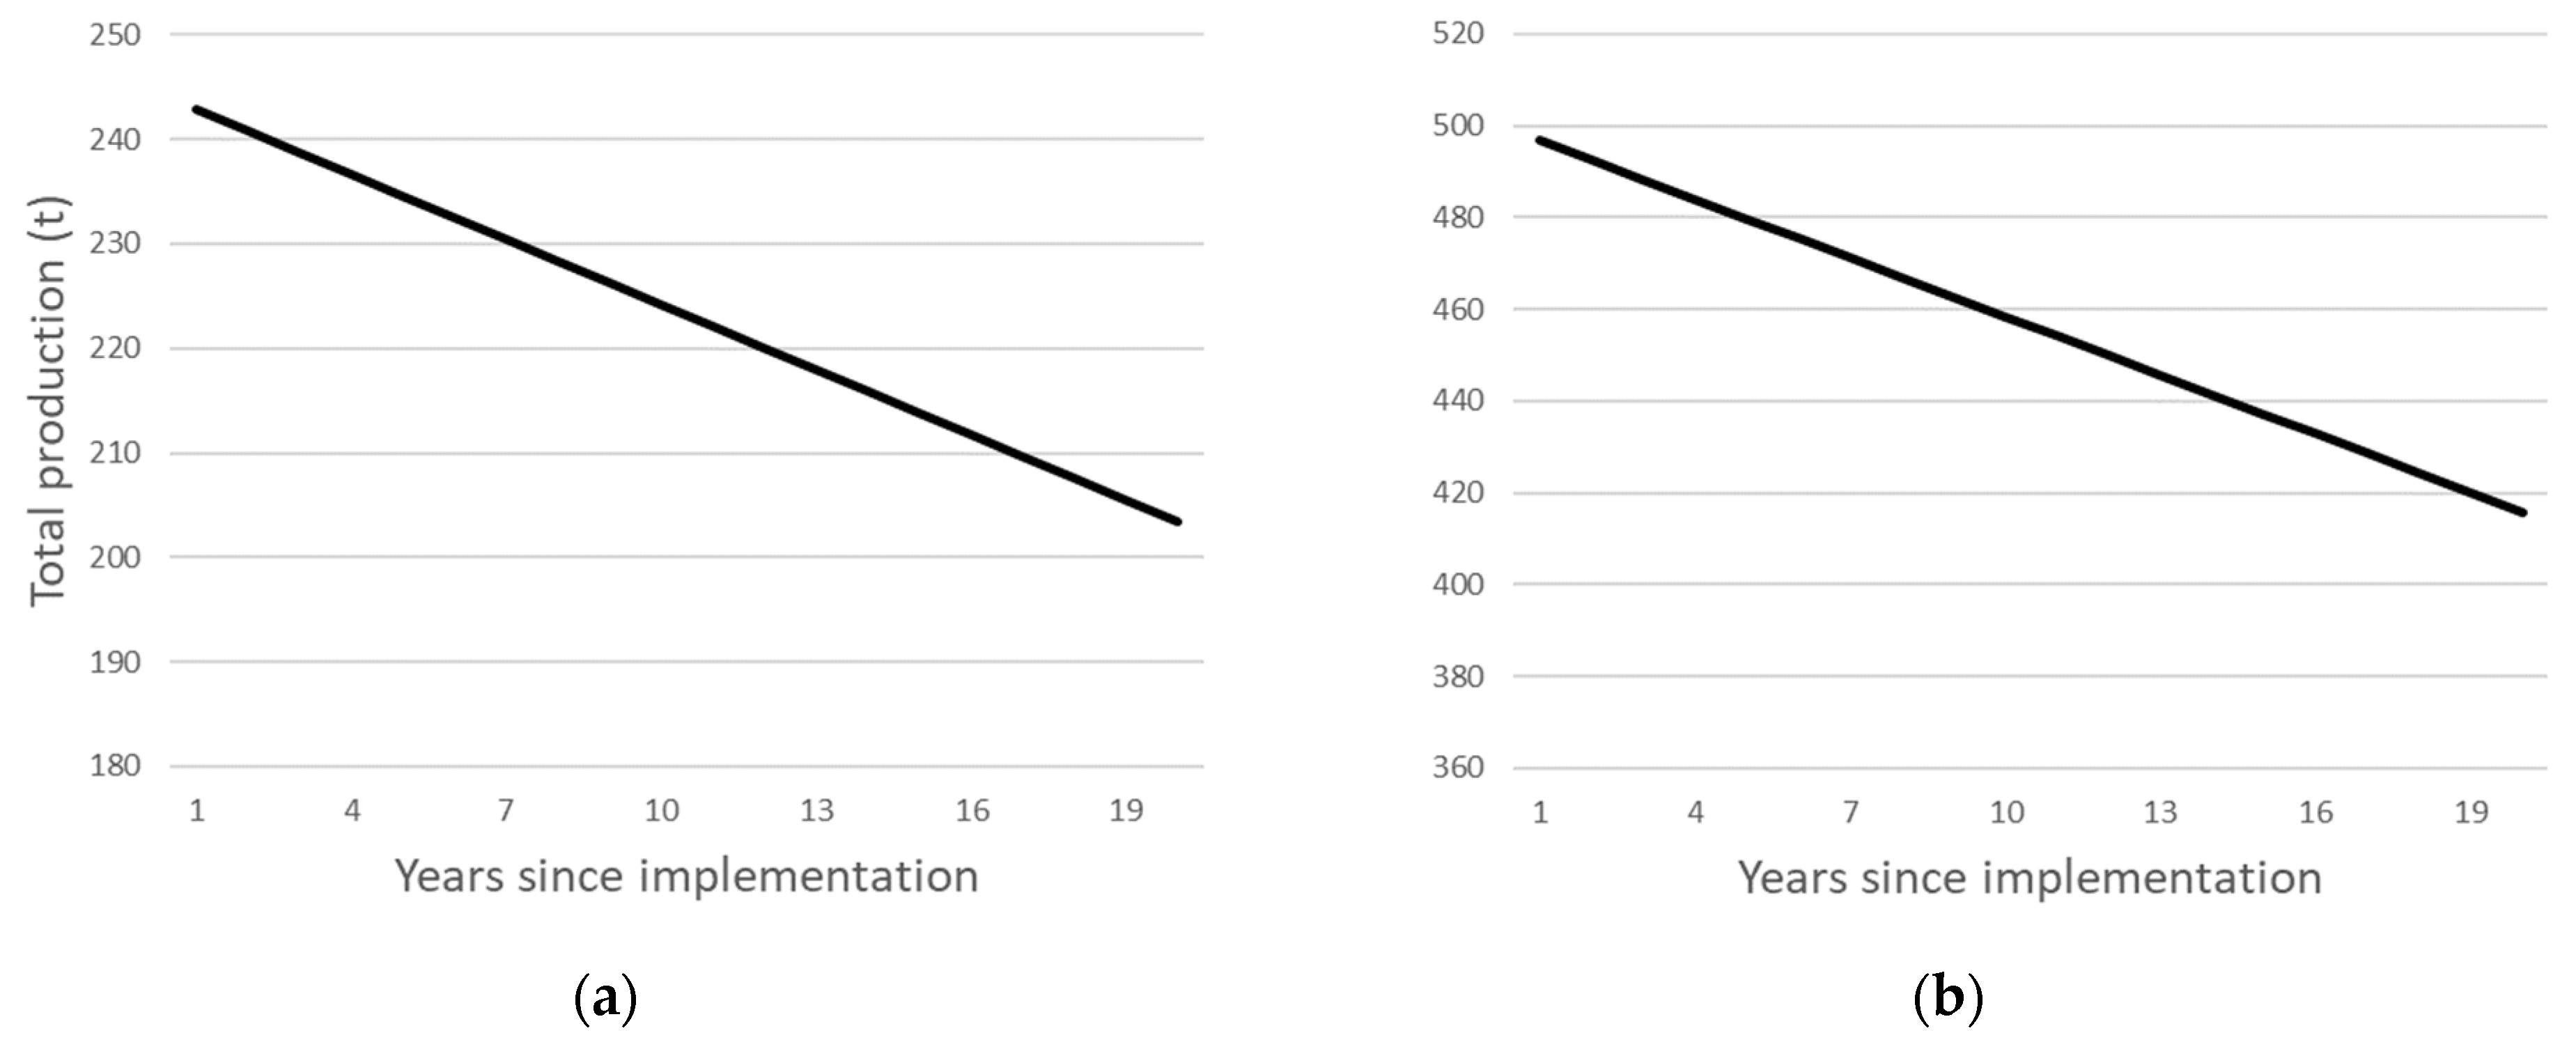
3.1. Yield
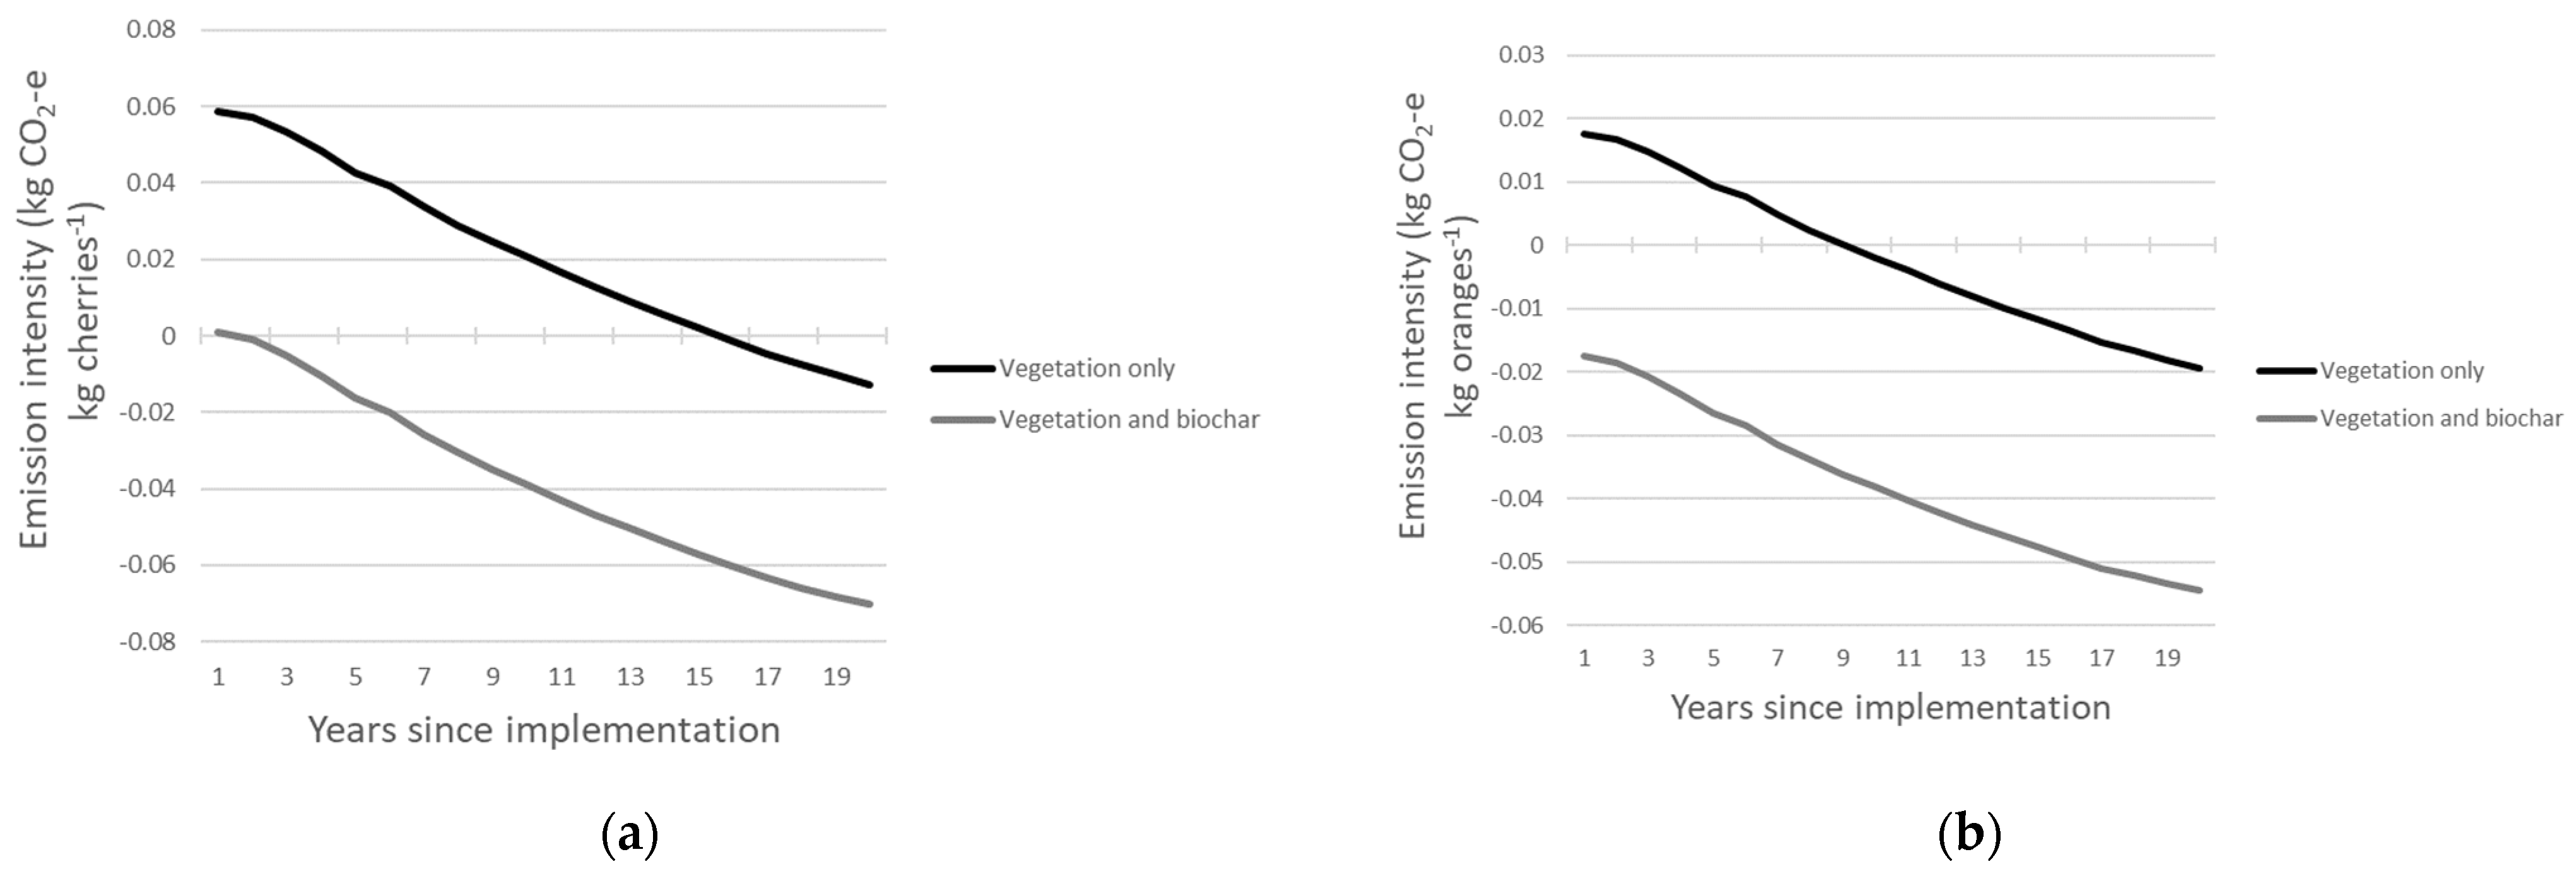
3.2. Emissions Intensity
3.3. Emissions Reductions Strategies
3.4. Carbon Sequestration
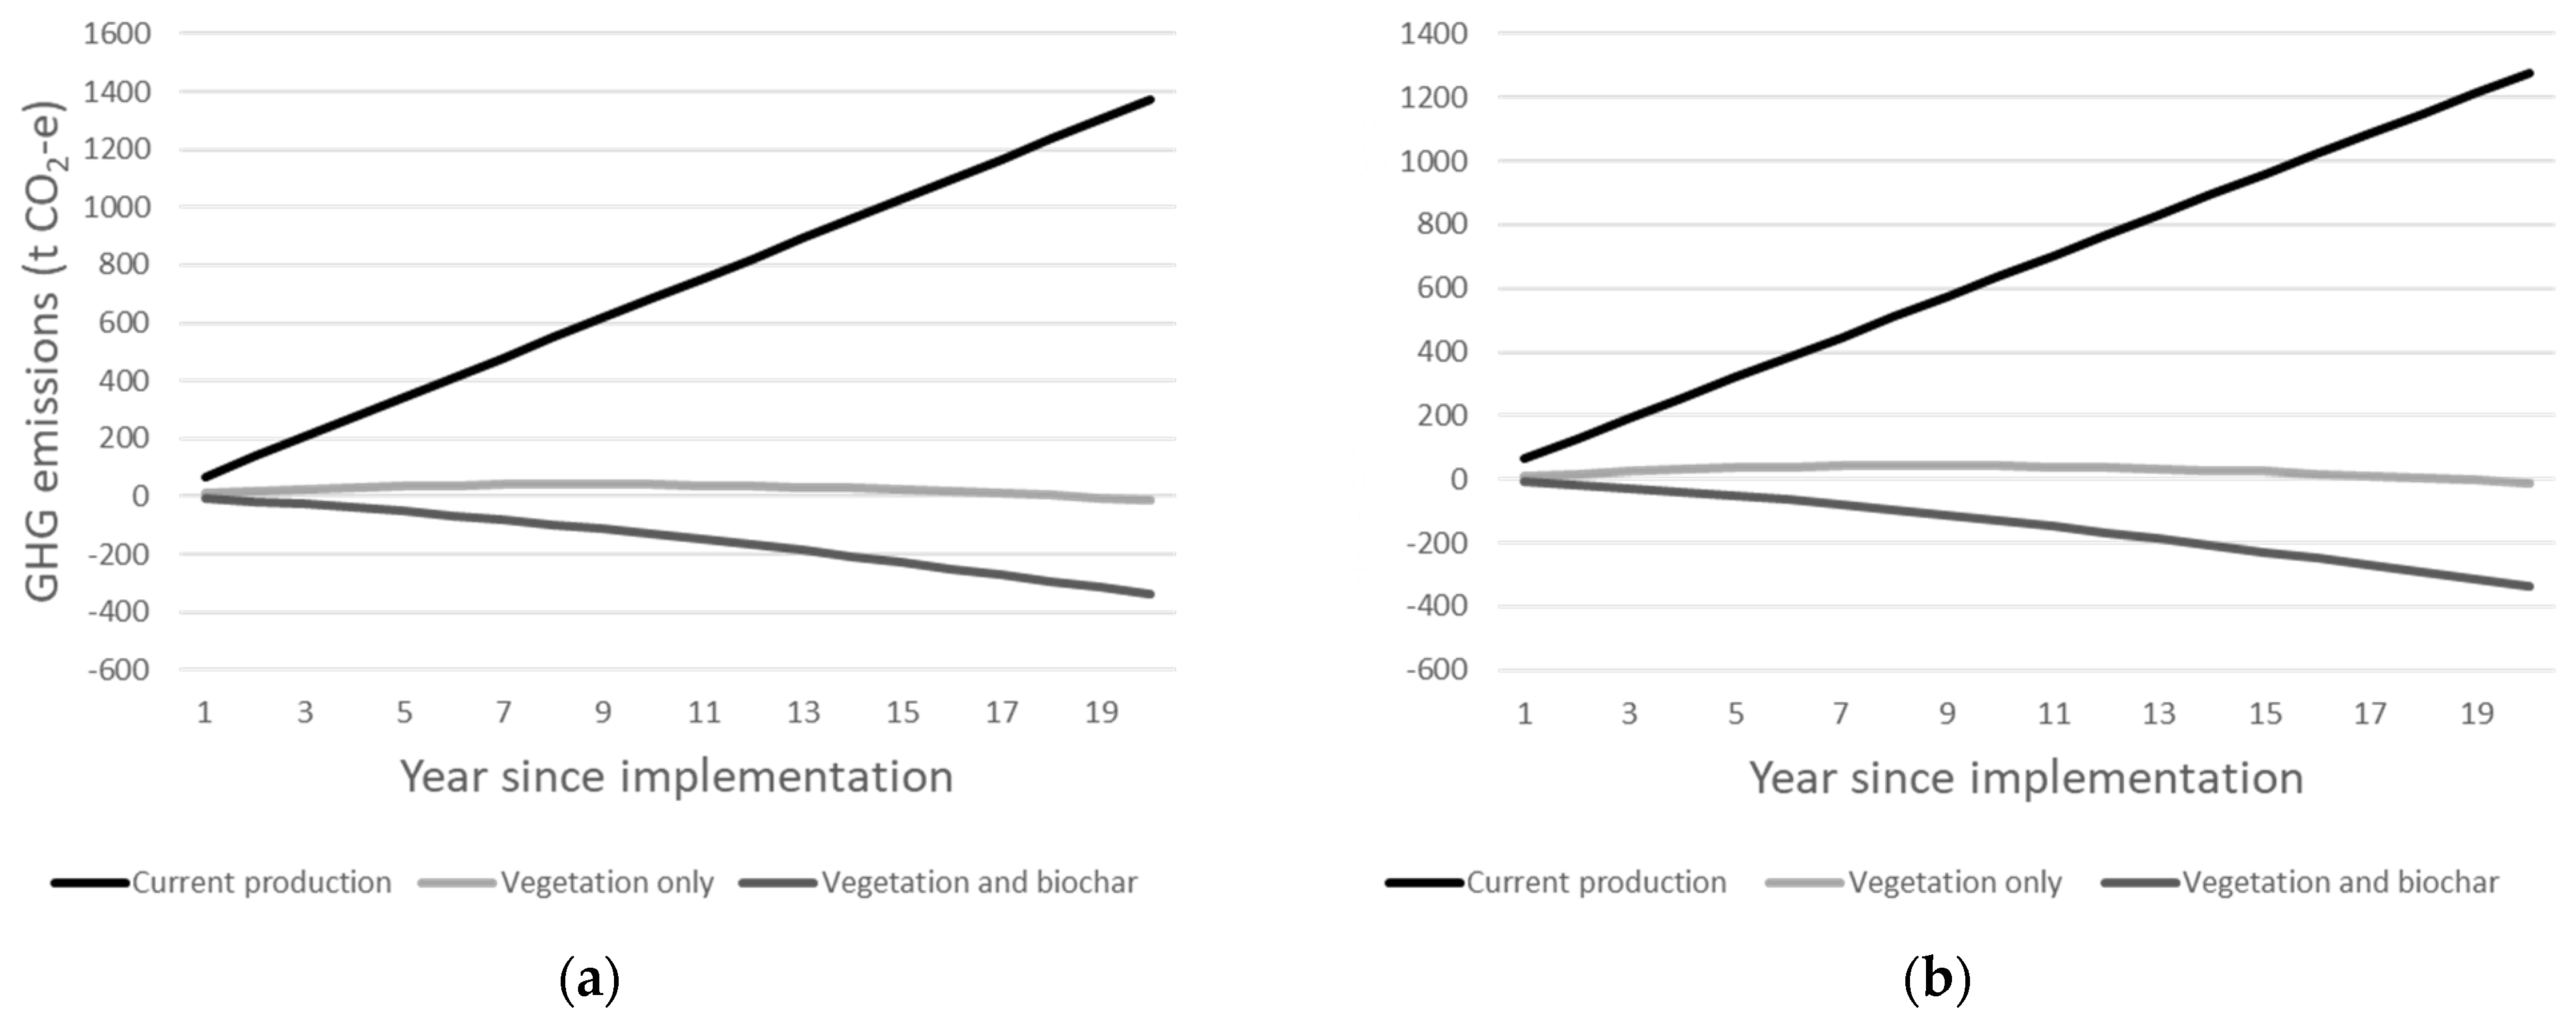
3.5. Total Emissions
4. Discussion
5. Conclusions
Supplementary Materials
Author Contributions
Funding
Data Availability Statement
Conflicts of Interest
References
- FAOSTAT. FAO Statistical Databases; FAO: Rome, Italy, 2023. [Google Scholar]
- Hort Innovation. Australian Horticulture Statistics Handbook; Hort Innovation: Sydney, Australia, 2023. [Google Scholar]
- Maraseni, T.N.; Cockfield, G.; Maroulis, J.; Chen, G. An assessment of greenhouse gas emissions from the Australian vegetables industry. J. Environ. Sci. Health 2010, 45, 578–588. [Google Scholar] [CrossRef] [PubMed]
- FAO. The Future of Food and Agriculture: Alternative Pathways to 2050; Food and Agriculture Organization of the United Nations: Rome, Italy, 2018. [Google Scholar]
- Thøgersen, J.; Nielsen, K.S. A better carbon footprint label. J. Clean. Prod. 2016, 125, 86–94. [Google Scholar] [CrossRef]
- Ma, H.; Jia, X.; Yang, J.; Liu, J.; Shangguan, Z.; Yan, W. Inhibitors mitigate N2O emissions more effectively than biochar: A global perspective. Sci. Total Environ. 2023, 859, 160416. [Google Scholar] [CrossRef] [PubMed]
- Gu, J.; Nie, H.; Guo, H.; Xu, H.; Gunnathorn, T. Nitrous oxide emissions from fruit orchards: A review. Atmos. Environ. 2019, 201, 166–172. [Google Scholar] [CrossRef]
- de Coninck, H.; Revi, A.; Babiker, M.; Bertoldi, P.; Buckeridge, M.; Cartwright, A.; Dong, W.; Ford, J.; Fuss, S.; Hourcade, J.-C.; et al. Strengthening and Implementing the Global Response. In Global Warming of 1.5 °C. An IPCC Special Report on the Impacts of Global Warming of 1.5 °C above Pre-Industrial Levels and Related Global Greenhouse Gas Emission Pathways, in the Context of Strengthening the Global Response to the Threat of Climate Change, Sustainable Development, and Efforts to Eradicate Poverty; Masson-Delmotte, V., Zhai, P., Pörtner, H.-O., Roberts, D., Skea, J., Shukla, P.R., Pirani, A., Moufouma-Okia, W., Péan, C., Pidcock, R., et al., Eds.; Cambridge University Press: Cambridge, UK; New York, NY, USA, 2018; pp. 313–444. [Google Scholar]
- Di, H.J.; Cameron, K.C. Inhibition of ammonium oxidation by a liquid formulation of 3, 4-Dimethylpyrazole phosphate (DMPP) compared with a dicyandiamide (DCD) solution in six new Zealand grazed grassland soils. J. Soils Sediments 2011, 11, 1032–1039. [Google Scholar] [CrossRef]
- Maris, S.C.; Teira-Esmatges, M.R.; Arbonés, A.; Rufat, J. Effect of irrigation, nitrogen application, and a nitrification inhibitor on nitrous oxide, carbon dioxide and methane emissions from an olive (Olea europaea L.) orchard. Sci. Total Environ. 2015, 538, 966–978. [Google Scholar] [CrossRef] [PubMed]
- Wang, F.; Ge, S.; Lyu, M.; Liu, J.; Li, M.; Jiang, Y.; Xu, X.; Xing, Y.; Cao, H.; Zhu, Z.; et al. DMPP reduces nitrogen fertilizer application rate, improves fruit quality, and reduces environmental cost of intensive apple production in China. Sci. Total Environ. 2022, 802, 149813. [Google Scholar] [CrossRef] [PubMed]
- Vilarrasa-Nogué, M.; Teira-Esmatges, M.R.; Pascual, M.; Villar, J.M.; Rufat, J. Effect of N dose, fertilisation duration and application of a nitrification inhibitor on GHG emissions from a peach orchard. Sci. Total Environ. 2020, 699, 134042. [Google Scholar] [CrossRef] [PubMed]
- Guo, Y.; Ji, Y.; Zhang, J.; Liu, Q.; Han, J.; Zhang, L. Effects of water and nitrogen management on N2O emissions and NH3 volatilization from a vineyard in North China. Agric. Water Manag. 2022, 266, 107601. [Google Scholar] [CrossRef]
- Abalos, D.; Jeffery, S.; Sanz-Cobena, A.; Guardia, G.; Vallejo, A. Meta-analysis of the effect of urease and nitrification inhibitors on crop productivity and nitrogen use efficiency. Agric. Ecosyst. Environ. 2014, 189, 136–144. [Google Scholar] [CrossRef]
- Babiker, M.; Berndes, G.; Blok, K.; Cohen, B.; Cowie, A.; Geden, O.; Ginzburg, V.; Leip, A.; Smith, P.; Sugiyama, M. Cross-Sectoral Perspectives; Cambridge University Press: Cambridge, UK, 2022. [Google Scholar]
- Owen-Turner, J.; Hardy, S.; Australia, C. Windbreaks for Citrus. Citrus Fact Sheet, Compiled by Cittgroups Australia. 2006. Available online: https://www.dpi.nsw.gov.au/agriculture/horticulture/citrus/content/orchard-development/windbreaks.pdf (accessed on 18 July 2023).
- Gorjian, S.; Ebadi, H.; Trommsdorff, M.; Sharon, H.; Demant, M.; Schindele, S. The advent of modern solar-powered electric agricultural machinery: A solution for sustainable farm operations. J. Clean. Prod. 2021, 292, 126030. [Google Scholar] [CrossRef]
- Guno, C.S.; Agaton, C.B. Socio-Economic and Environmental Analyses of Solar Irrigation Systems for Sustainable Agricultural Production. Sustainability 2022, 14, 6834. [Google Scholar] [CrossRef]
- Grace, P.R. Revised Emission Factors for Estimating Direct Nitrous Oxide Emissions from Nitrogen Inputs in Australia’s Agricultural Production Systems: A meta-analysis. 2023; in press. [Google Scholar]
- Grant, T.; Eady, S.; Cruypenninck, H.; Simmons, A. AusLCI Methodology for Developing Life Cycle Inventory for Australian Agriculture; Lifecycle Strategies Pty Ltd.: Melbourne, Australia, 2017. [Google Scholar]
- Smith, C.; Hill, A.K.; Torrente-Murciano, L. Current and future role of Haber–Bosch ammonia in a carbon-free energy landscape. Energy Environ. Sci. 2020, 13, 331–344. [Google Scholar] [CrossRef]
- Woolf, D.; Lehmann, J.; Ogle, S.; Kishimoto-Mo, A.W.; McConkey, B.; Baldock, J. Greenhouse Gas Inventory Model for Biochar Additions to Soil. Environ. Sci. Technol. 2021, 55, 14795–14805. [Google Scholar] [CrossRef] [PubMed]
- Tozzini, L.; Lakso, A.; Flore, J. Estimating the carbon footprint of Michigan apple and cherry trees-lifetime dry matter accumulation. In Proceedings of the IX International Symposium on Modelling in Fruit Research and Orchard Management, Saint-Jean-sur-Richelieu, QC, Canada, 19–23 June 2011; Volume 1068, pp. 85–90. [Google Scholar]
- Liguori, G.; Gugliuzza, G.; Inglese, P. Evaluating carbon fluxes in orange orchards in relation to planting density. J. Agric. Sci. 2009, 147, 637–645. [Google Scholar] [CrossRef]
- Australian Government. Carbon Credits (Carbon Farming Initiative-Reforestation by Environmental or Mallee Plantings-FullCAM) Methodology Determination 2014. F2018C00118 2014. Available online: https://www.legislation.gov.au/Details/F2018C00118 (accessed on 28 August 2023).
- Falivene, S.; Creek, A. NSW Citrus Farm Budget Handbook; NSW DPI: Orange, NSW, Australia, 2018. [Google Scholar]
- Fearnley, J.; Falivene, S. Gross margins for cherry production in NSW. 2023. [Google Scholar]
- Australian Government. Australian National Greenhouse Accounts National Inventory Report 2020; Department of Industry, Science, Energy and Resources: Canberra, Australia, 2022.
- Australian Government. Australian National Greenhouse Accounts Factors 2020; Department of Industry, Science, Energy and Resources: Canberra, Australia, 2022.
- Wernet, G.; Bauer, C.; Steubing, B.; Reinhard, J.; Moreno-Ruiz, E.; Weidema, B. The ecoinvent database version 3 (part I): Overview and methodology. Int. J. Life Cycle Assess. 2016, 21, 1218–1230. [Google Scholar] [CrossRef]
- Cintas, O.; Berndes, G.; Cowie, A.L.; Egnell, G.; Holmström, H.; Marland, G.; Ågren, G.I. Carbon balances of bioenergy systems using biomass from forests managed with long rotations: Bridging the gap between stand and landscape assessments. GCB Bioenergy 2017, 9, 1238–1251. [Google Scholar] [CrossRef]
- Myhre, G.; Shindell, D.; Bréon, F.-M.; Collins, W.; Fuglestvedt, J.; Huang, J.; Koch, D.; Lamarque, J.-F.; Lee, D.; Mendoza, B.; et al. Anthropogenic and Natural Radiative Forcing. In Climate Change 2013: The Physical Science Basis. Contribution of Working Group I to the Fifth Assessment Report of the Intergovernmental Panel on Climate Change; Stocker, T.F., Qin, D., Plattner, G.-K., Tignor, M., Allen, S.K., Boschung, J., Nauels, A., Xia, Y., Bex, V., Midgley, P.M., Eds.; Cambridge University Press: Cambridge, UK; New York, NY, USA,, 2013; pp. 659–740. [Google Scholar]
- Zhao, H.; Dong, Z.; Liu, B.; Xiong, H.; Guo, C.; Lakshmanan, P.; Wang, X.; Chen, X.; Shi, X.; Zhang, F.; et al. Can citrus production in China become carbon-neutral? A historical retrospect and prospect. Agric. Ecosyst. Environ. 2023, 348, 108412. [Google Scholar] [CrossRef]
- Etter, H.; Vera, A.; Aggarwal, C.; Delaney, M.; Manley, S. Methodology for Biochar Utilization in Soil and Non-Soil Applications. 2021. Available online: https://verra.org/wp-content/uploads/2021/08/210803_VCS-Biochar-Methodology-v1.0-.pdf (accessed on 28 August 2023).
- CNH Industrial. CNH Industrial Presents First Electric Tractor Prototype with Autonomous Features; CNH Industrial: London, UK, 2022. [Google Scholar]
- Manfredi, S.; Allacker, K.; Pelletier, N.; Chomkhamsri, K.; de Souza, D.M. Product Environmental Footprint (PEF) Guide. 2012. Available online: https://scholar.google.com/citations?view_op=view_citation&hl=en&user=97Myh60AAAAJ&citation_for_view=97Myh60AAAAJ:eQOLeE2rZwMC (accessed on 28 August 2023).
- Meat and Livestock Australia. The Australian Red Meat Industry’s Carbon Neutral by 2030 Roadmap; Meat and Livestock Australia: North Sydney, Australia, 2020. [Google Scholar]

| Cherry cv. ‘Lapin’ | Orange cv. ‘Washington Navel’ | ||||||
|---|---|---|---|---|---|---|---|
| Emissions Source Category | BAU (g CO2-e/kg) | Mitigation (g CO2-e/kg) | Reduction | BAU (g CO2-e/kg) | Mitigation (g CO2-e/kg) | Reduction | |
| Pre-farm | Diesel production | 1.1 | 0.5 | 59% | 0.8 | 0.4 | 48% |
| Fertiliser production | 72.4 | 18.9 | 74% | 14.5 | 5.2 | 64% | |
| Irrigation system | 0.3 | 0.3 | 0% | 0.3 | 0.3 | 0% | |
| Transport | 0.7 | 0.7 | 0% | 0.4 | 0.4 | 0% | |
| Plant protection products | 3.2 | 3.2 | 0% | 5.1 | 5.1 | 0% | |
| Irrigation electricity | 5.2 | 0.3 | 94% | 85.5 | 0.9 | 99% | |
| Total pre-farm | 82.8 | 23.8 | 71% | 106.5 | 12.2 | 89% | |
| On-farm | Fertiliser emissions | 26.1 | 4.4 | 83% | 5.6 | 3.3 | 42% |
| Tractor operations | 28.0 | 6.5 | 77% | 15.5 | 6.0 | 61% | |
| Total on-farm | 54.1 | 10.9 | 80% | 21.1 | 9.3 | 56% | |
Disclaimer/Publisher’s Note: The statements, opinions and data contained in all publications are solely those of the individual author(s) and contributor(s) and not of MDPI and/or the editor(s). MDPI and/or the editor(s) disclaim responsibility for any injury to people or property resulting from any ideas, methods, instructions or products referred to in the content. |
© 2023 by the authors. Licensee MDPI, Basel, Switzerland. This article is an open access article distributed under the terms and conditions of the Creative Commons Attribution (CC BY) license (https://creativecommons.org/licenses/by/4.0/).
Share and Cite
Simmons, A.T.; Simpson, M.; Bontinck, P.-A.; Golding, J.; Grant, T.; Fearnley, J.; Falivene, S. Emissions Reduction Strategies for the Orange and Cherry Industries in New South Wales. Foods 2023, 12, 3328. https://doi.org/10.3390/foods12183328
Simmons AT, Simpson M, Bontinck P-A, Golding J, Grant T, Fearnley J, Falivene S. Emissions Reduction Strategies for the Orange and Cherry Industries in New South Wales. Foods. 2023; 12(18):3328. https://doi.org/10.3390/foods12183328
Chicago/Turabian StyleSimmons, Aaron T., Marja Simpson, Paul-Antoine Bontinck, John Golding, Tim Grant, Jess Fearnley, and Steven Falivene. 2023. "Emissions Reduction Strategies for the Orange and Cherry Industries in New South Wales" Foods 12, no. 18: 3328. https://doi.org/10.3390/foods12183328