
The Effect of High Pressure Homogenization on the Structure of Dual-Protein and Its Emulsion Functional Properties
 ,
,
Abstract
:1. Introduction
2. Materials and Methods
2.1. Materials
2.2. Preparation of Protein Solution and HPH Treatment
2.3. Dual-Protein Structure Measurement
2.3.1. Particle Size and Zeta Potential Measurement
2.3.2. Solubility Measurement
2.3.3. Sodium Dodecyl Sulfate-Polyacrylamide Gel Electrophoresis (SDS-PAGE)
2.3.4. Fourier Transform Infrared Spectroscopy (FTIR)
2.3.5. Intrinsic Fluorescence Spectroscopy
2.3.6. Surface Hydrophobicity
2.3.7. Microstructure
2.4. Dual-Protein Emulsion Properties Measurement
2.4.1. Emulsifying Activity Index (EAI) and Emulsifying Stability Index (ESI)
2.4.2. Surface Tension
2.4.3. Emulsion Preparation
2.4.4. Droplet Size and Zeta Potential of Emulsion
2.4.5. Physical Stability of Emulsion
2.4.6. Micro-Rheological of Emulsion
2.5. Statistical Analysis
3. Results and Discussion
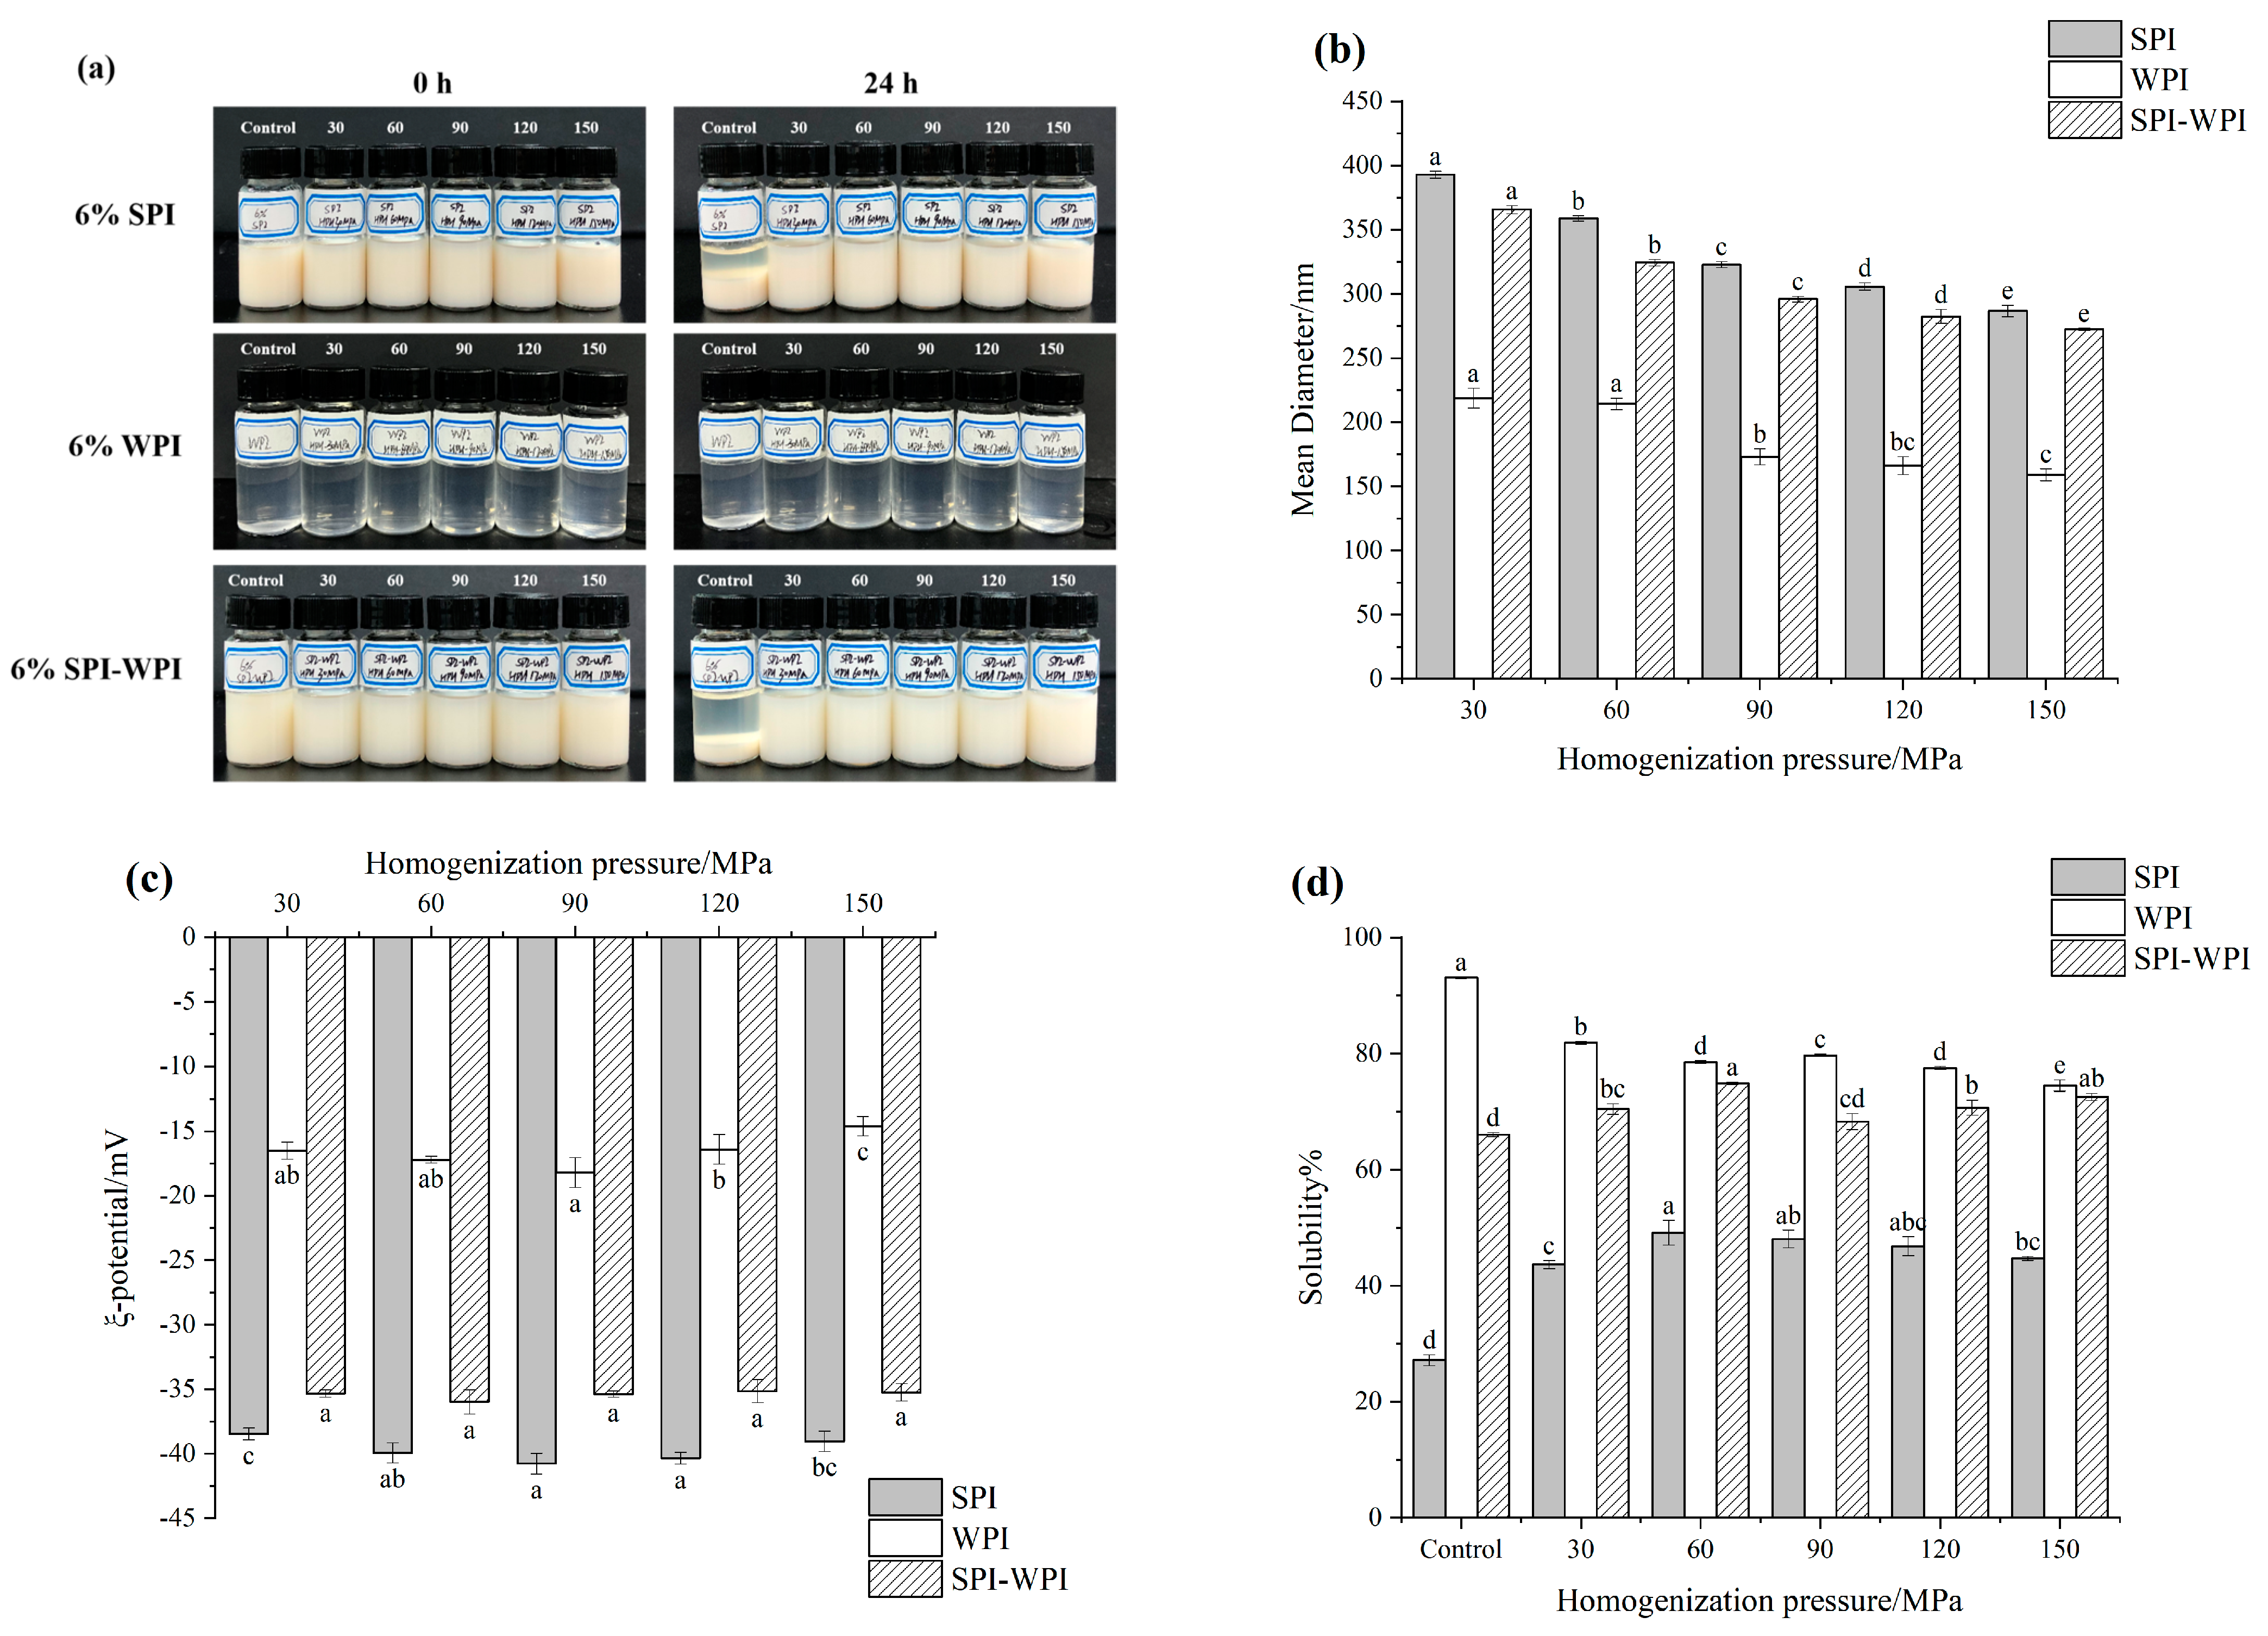
3.1. Particle Size and Zeta Potential
3.2. Solubility
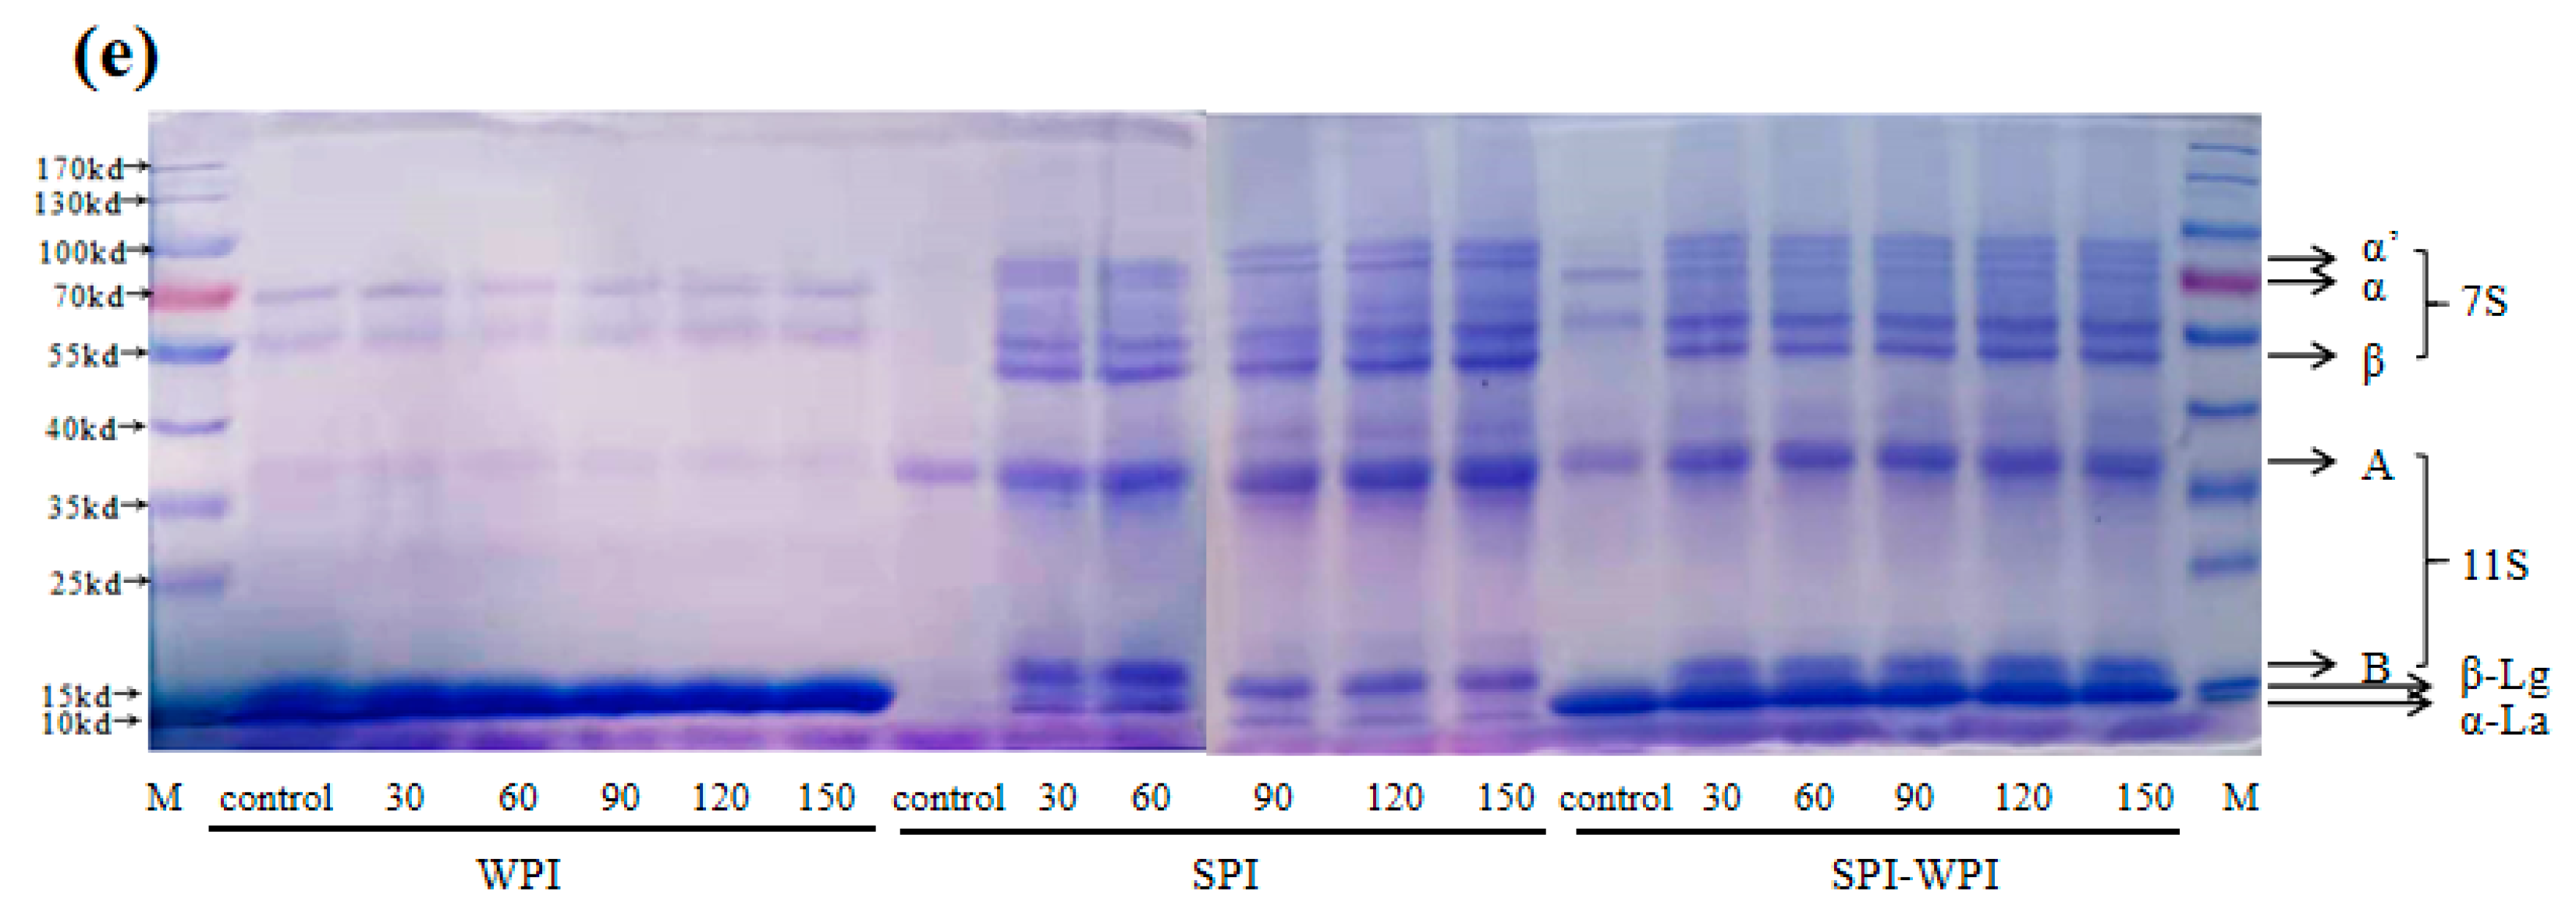
3.3. SDS-PAGE
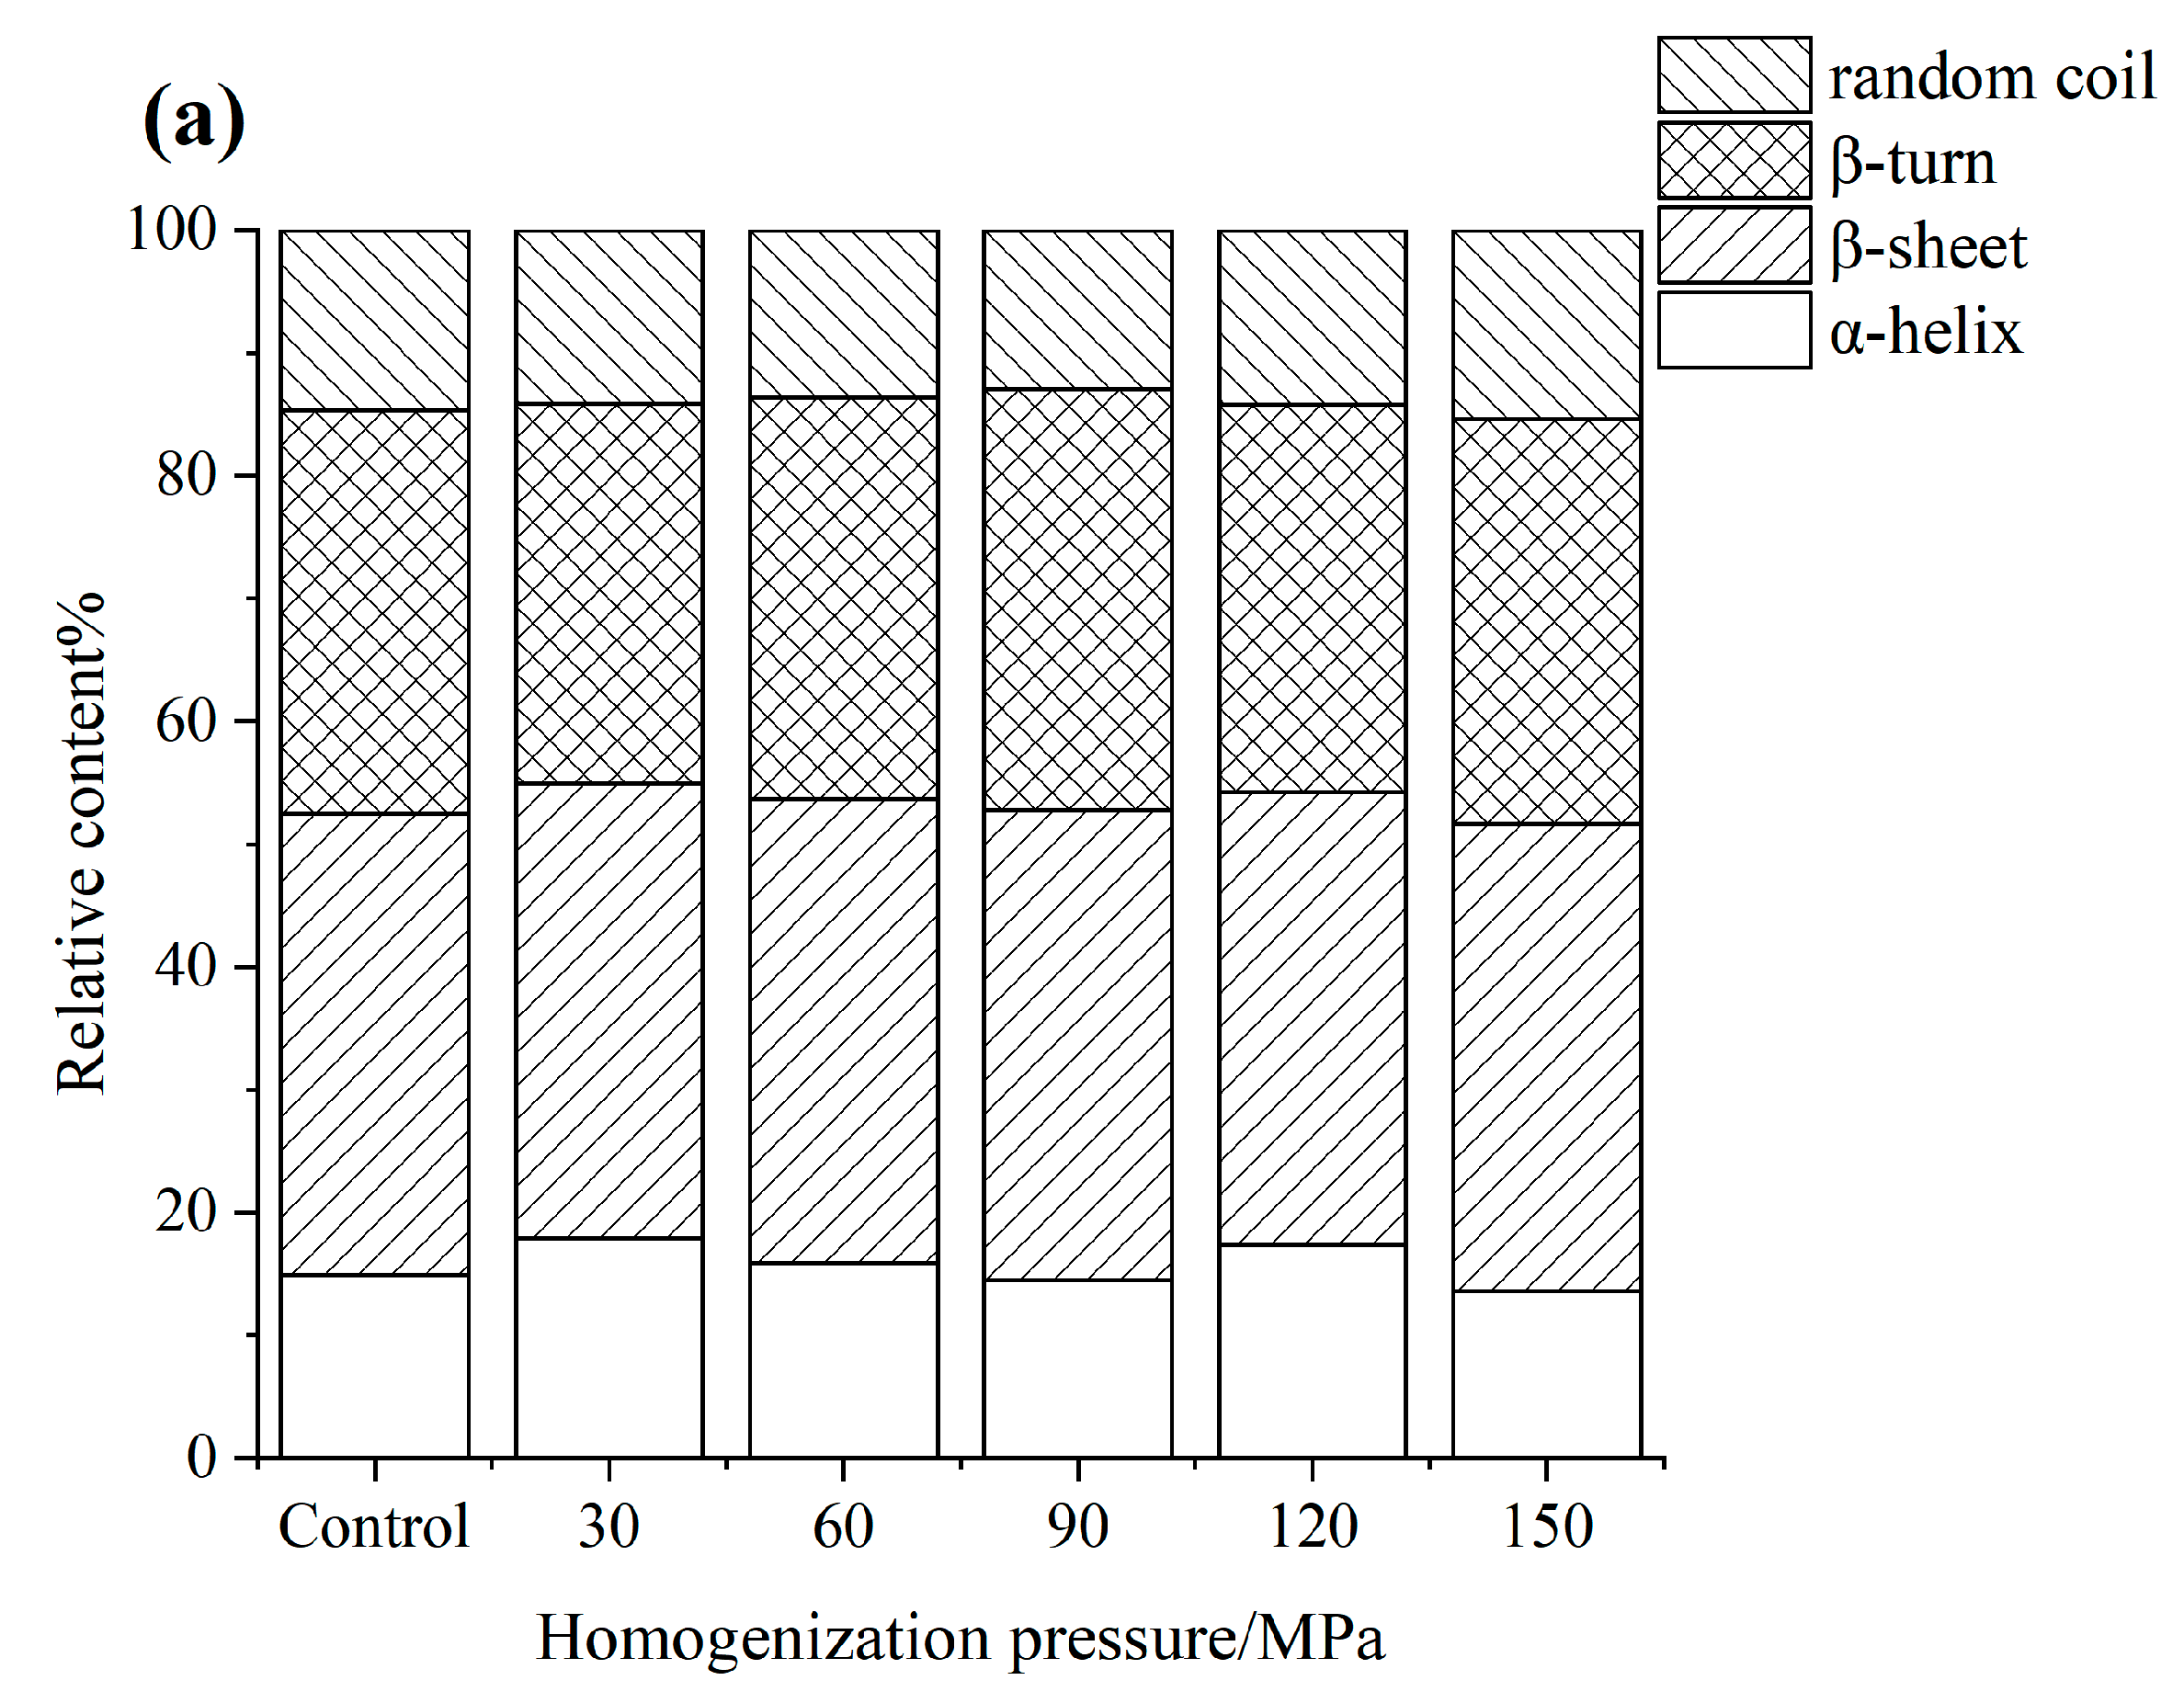
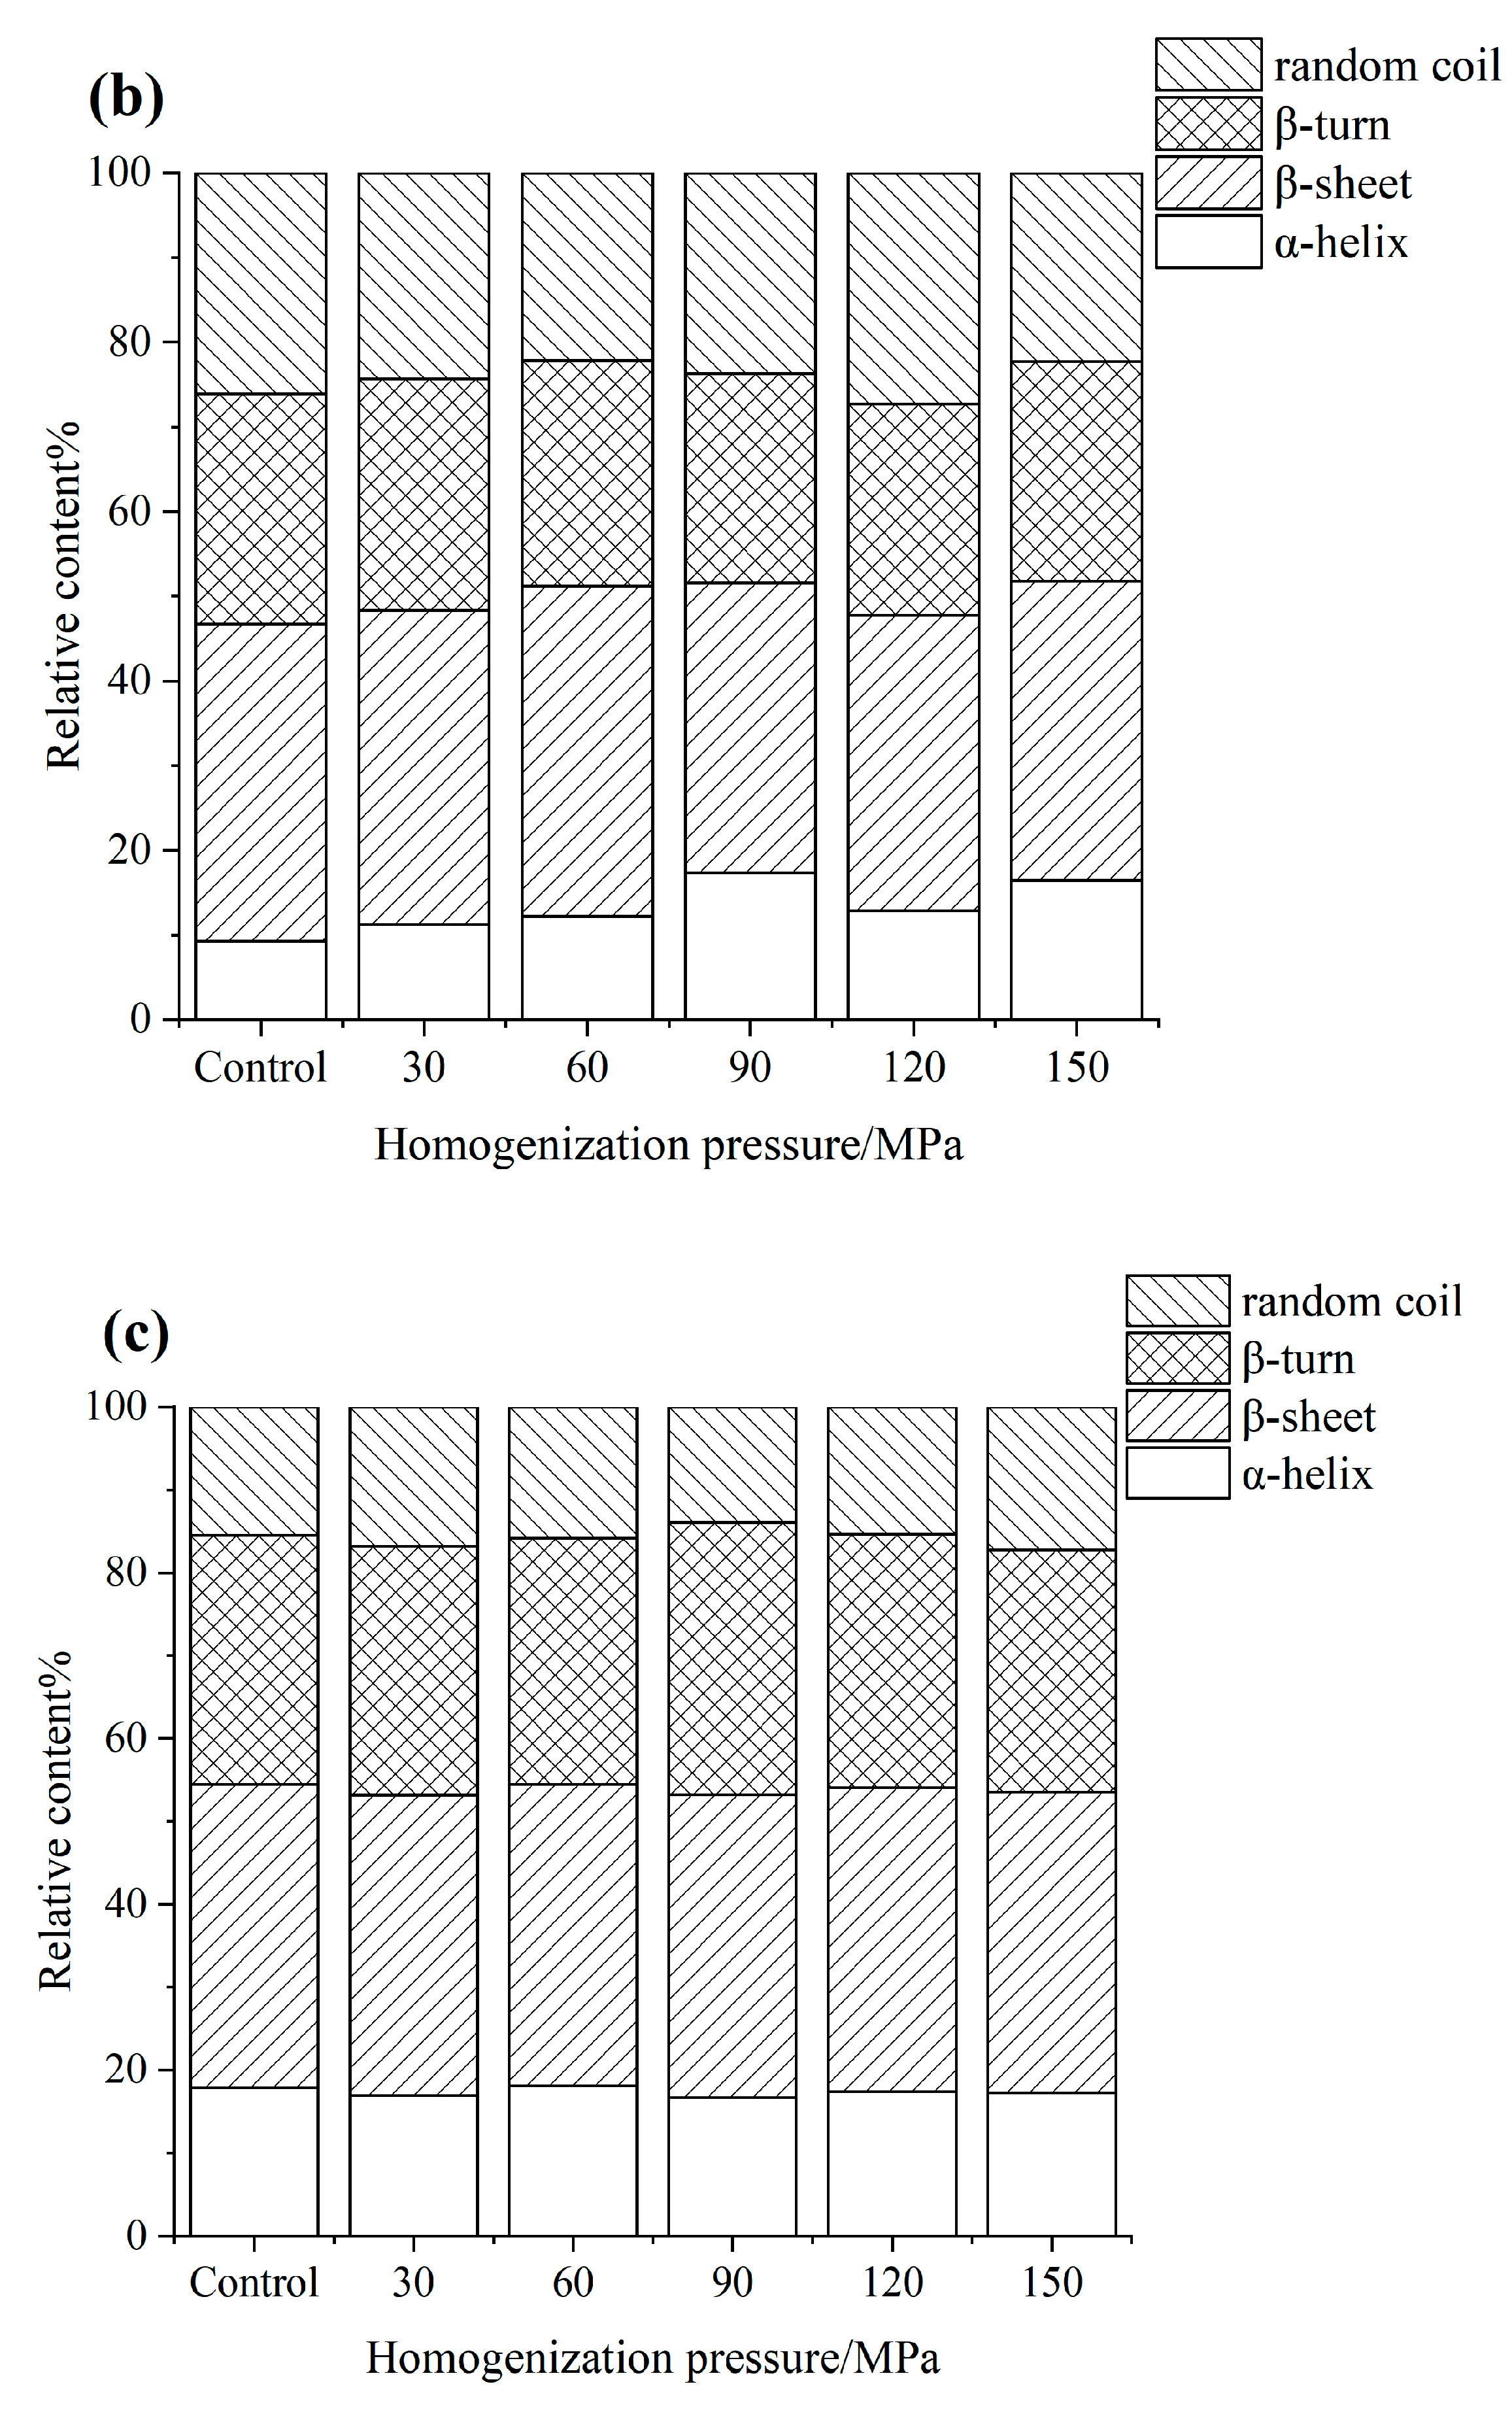
3.4. FTIR
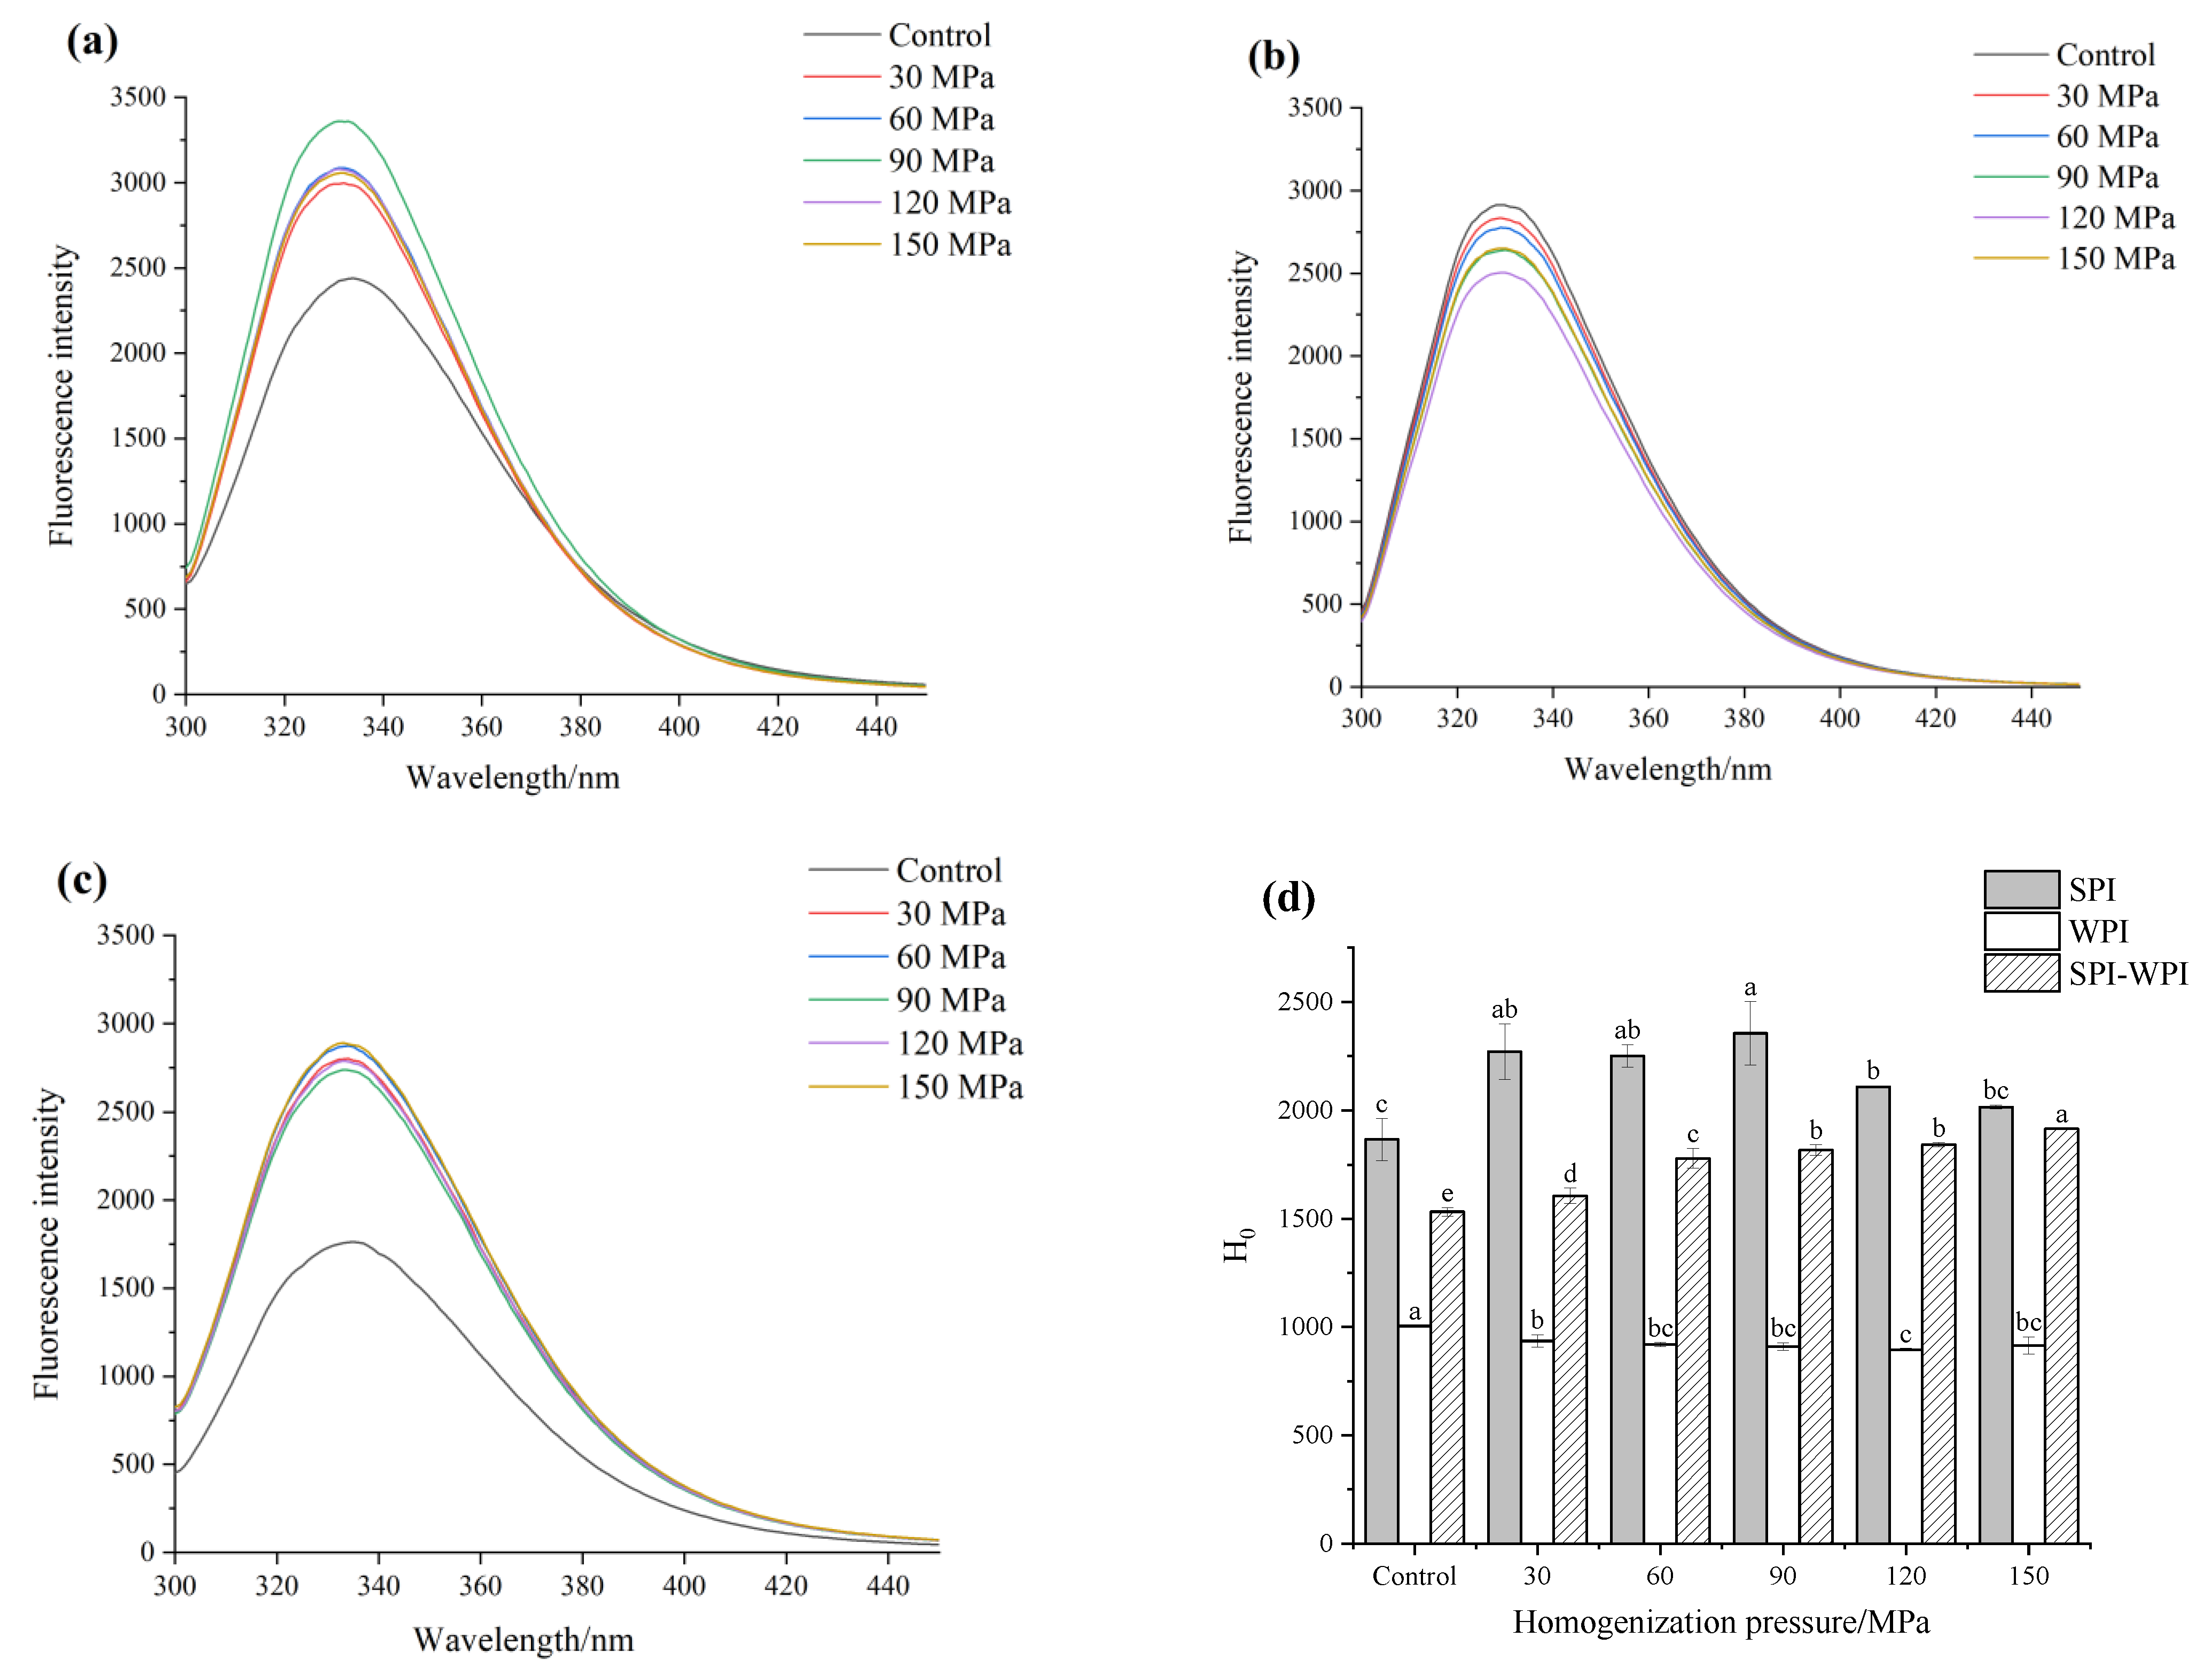
3.5. Intrinsic Fluorescence Analysis
3.6. Surface Hydrophobicity Analysis
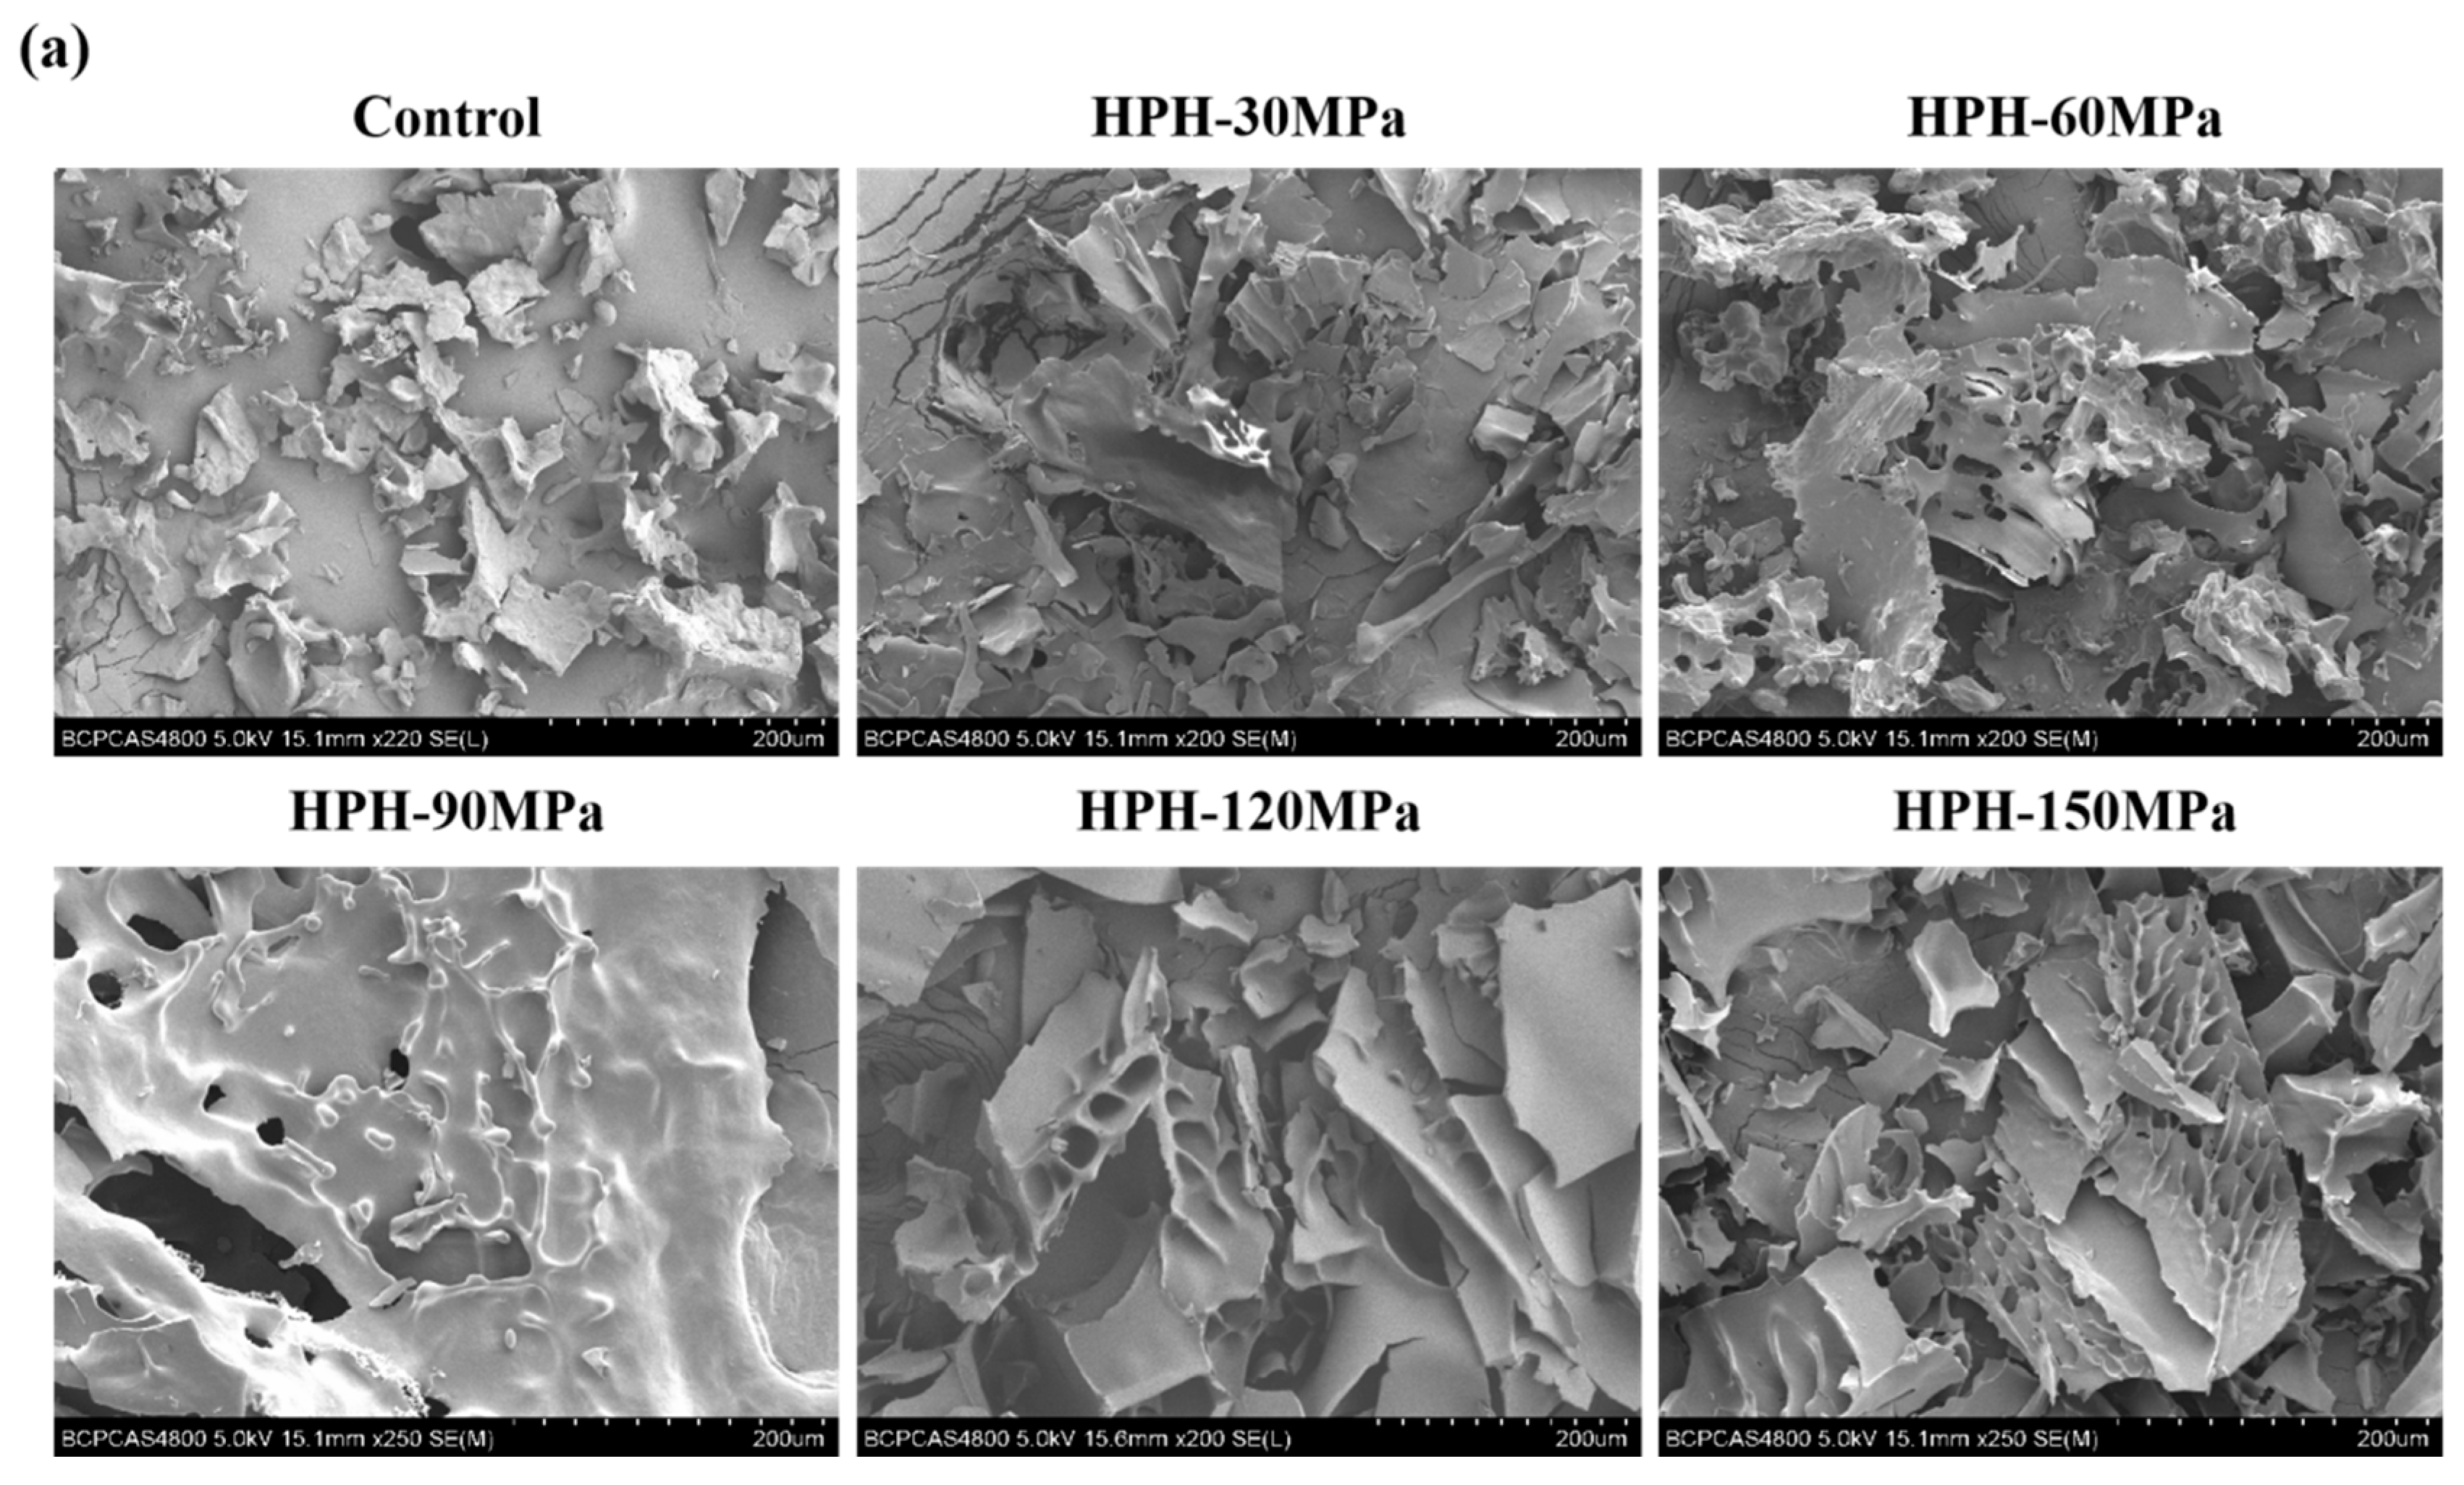
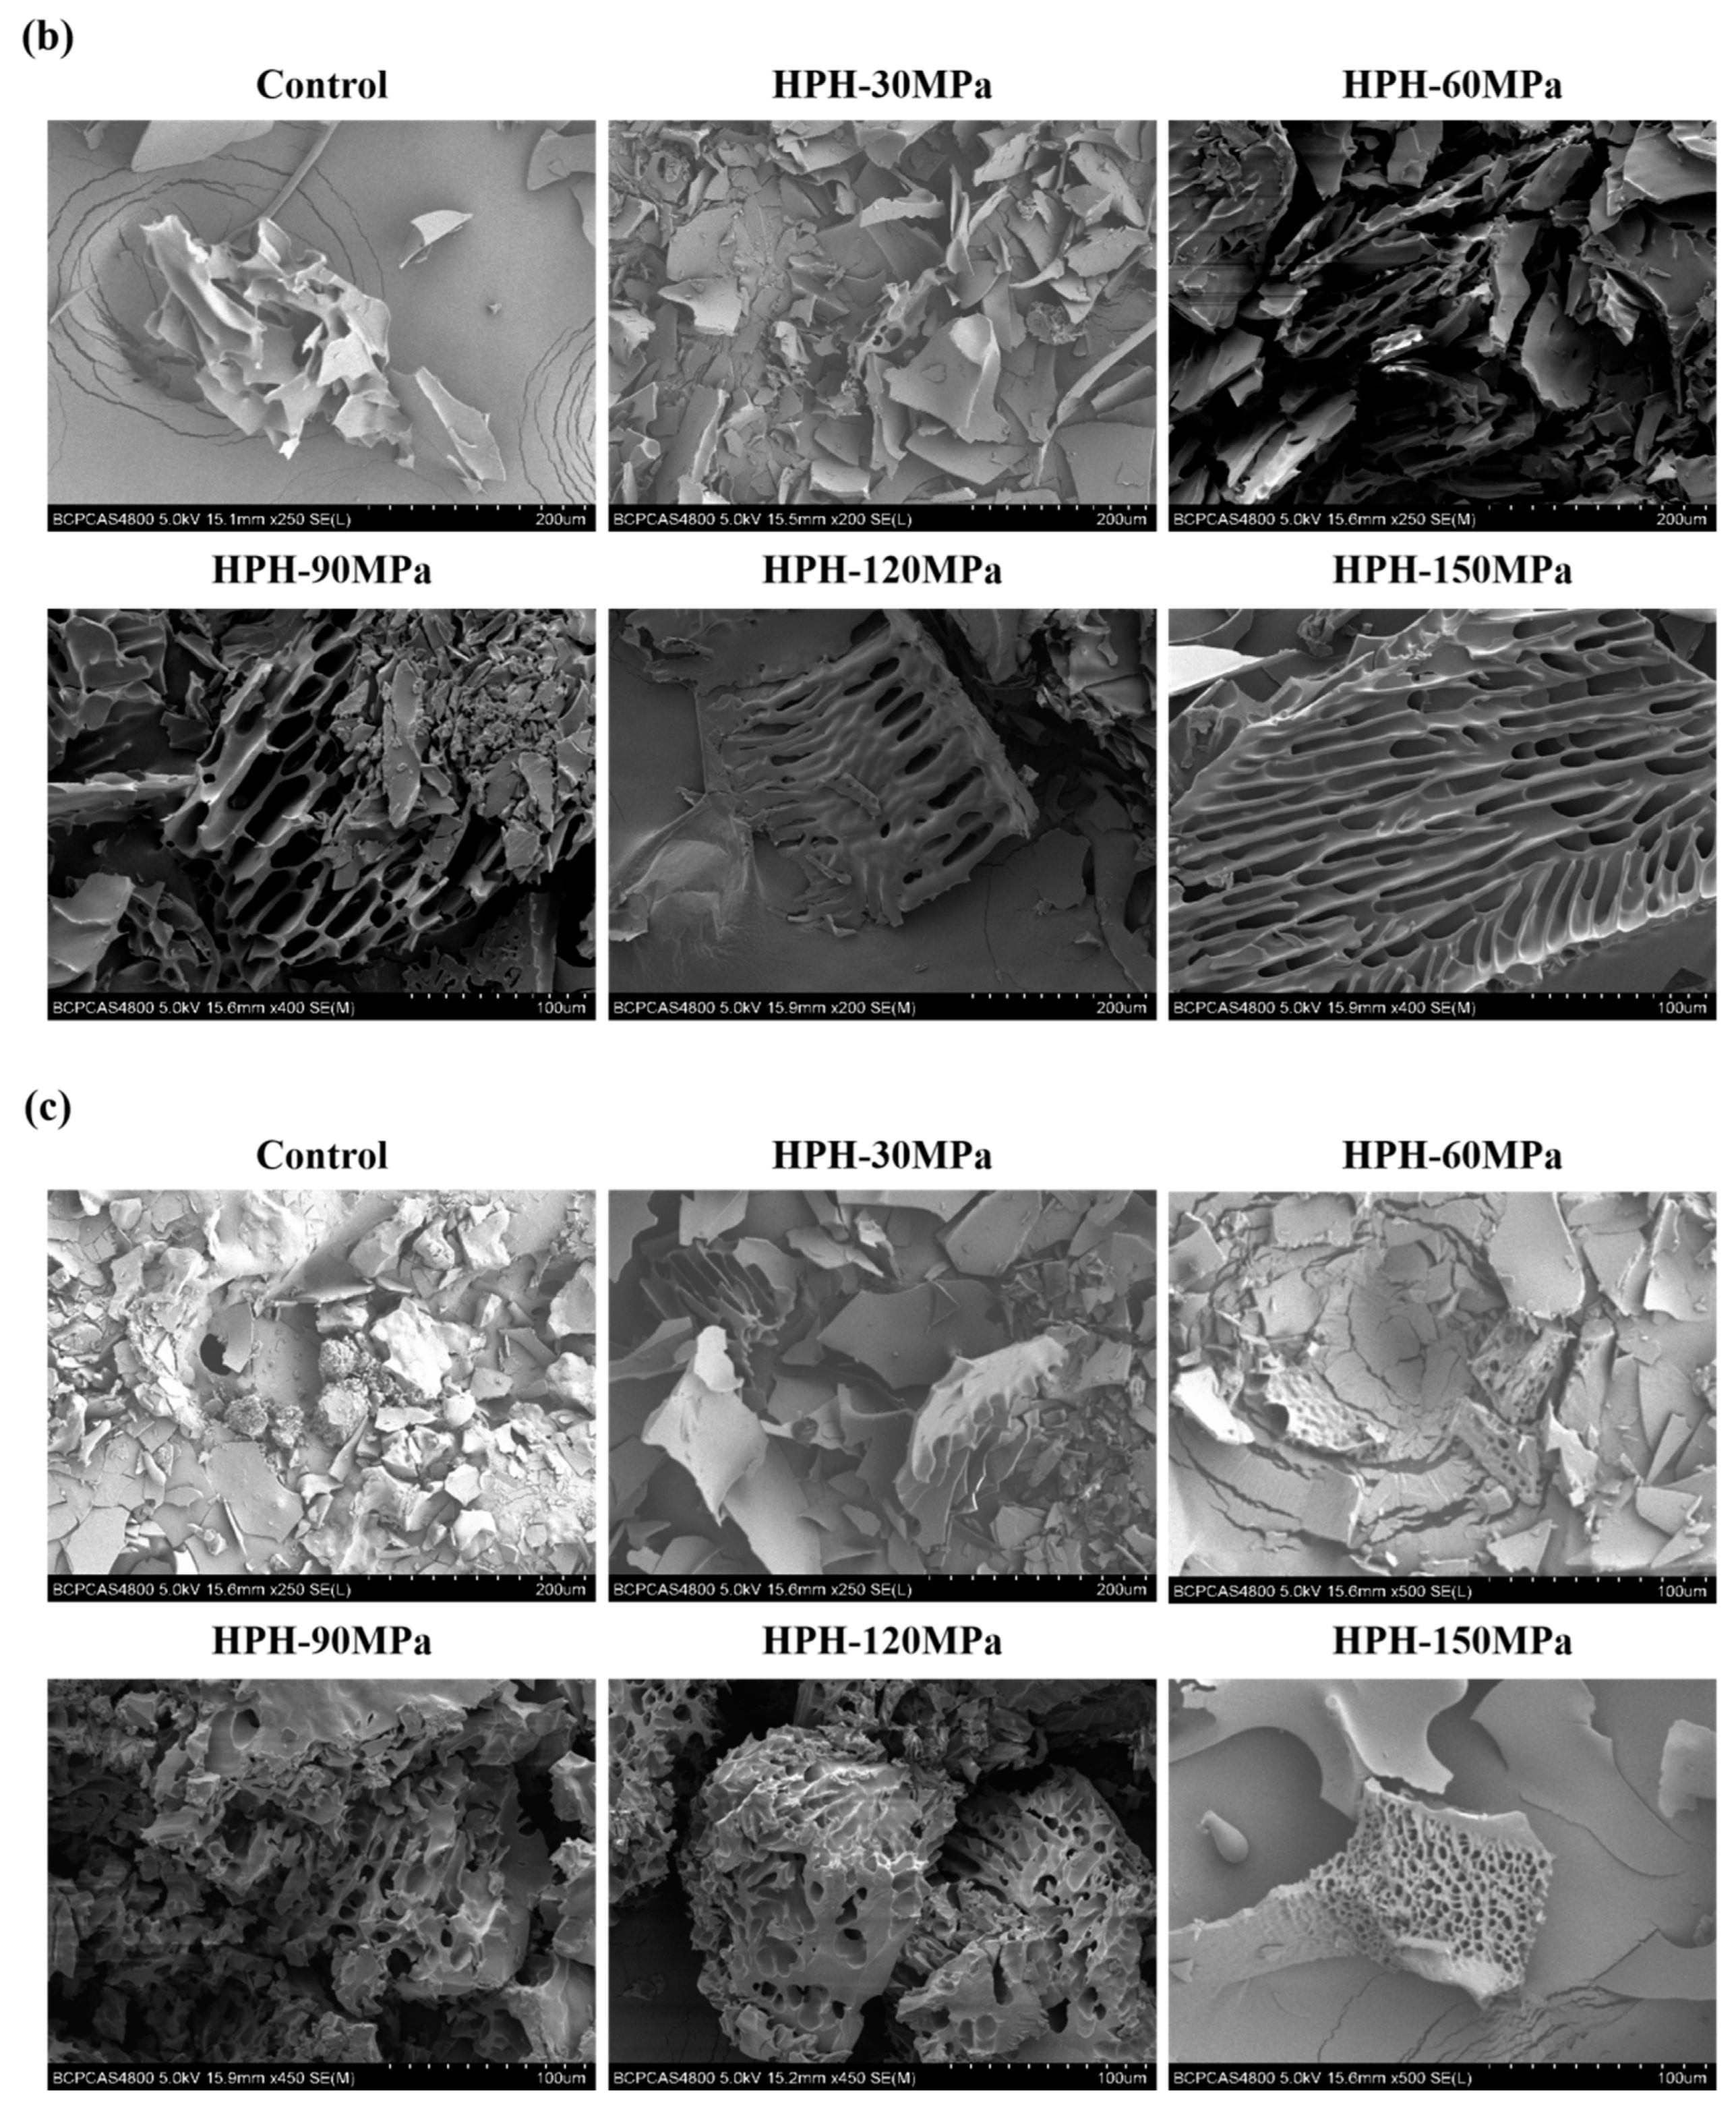
3.7. Microstructure
3.8. Emulsion Properties
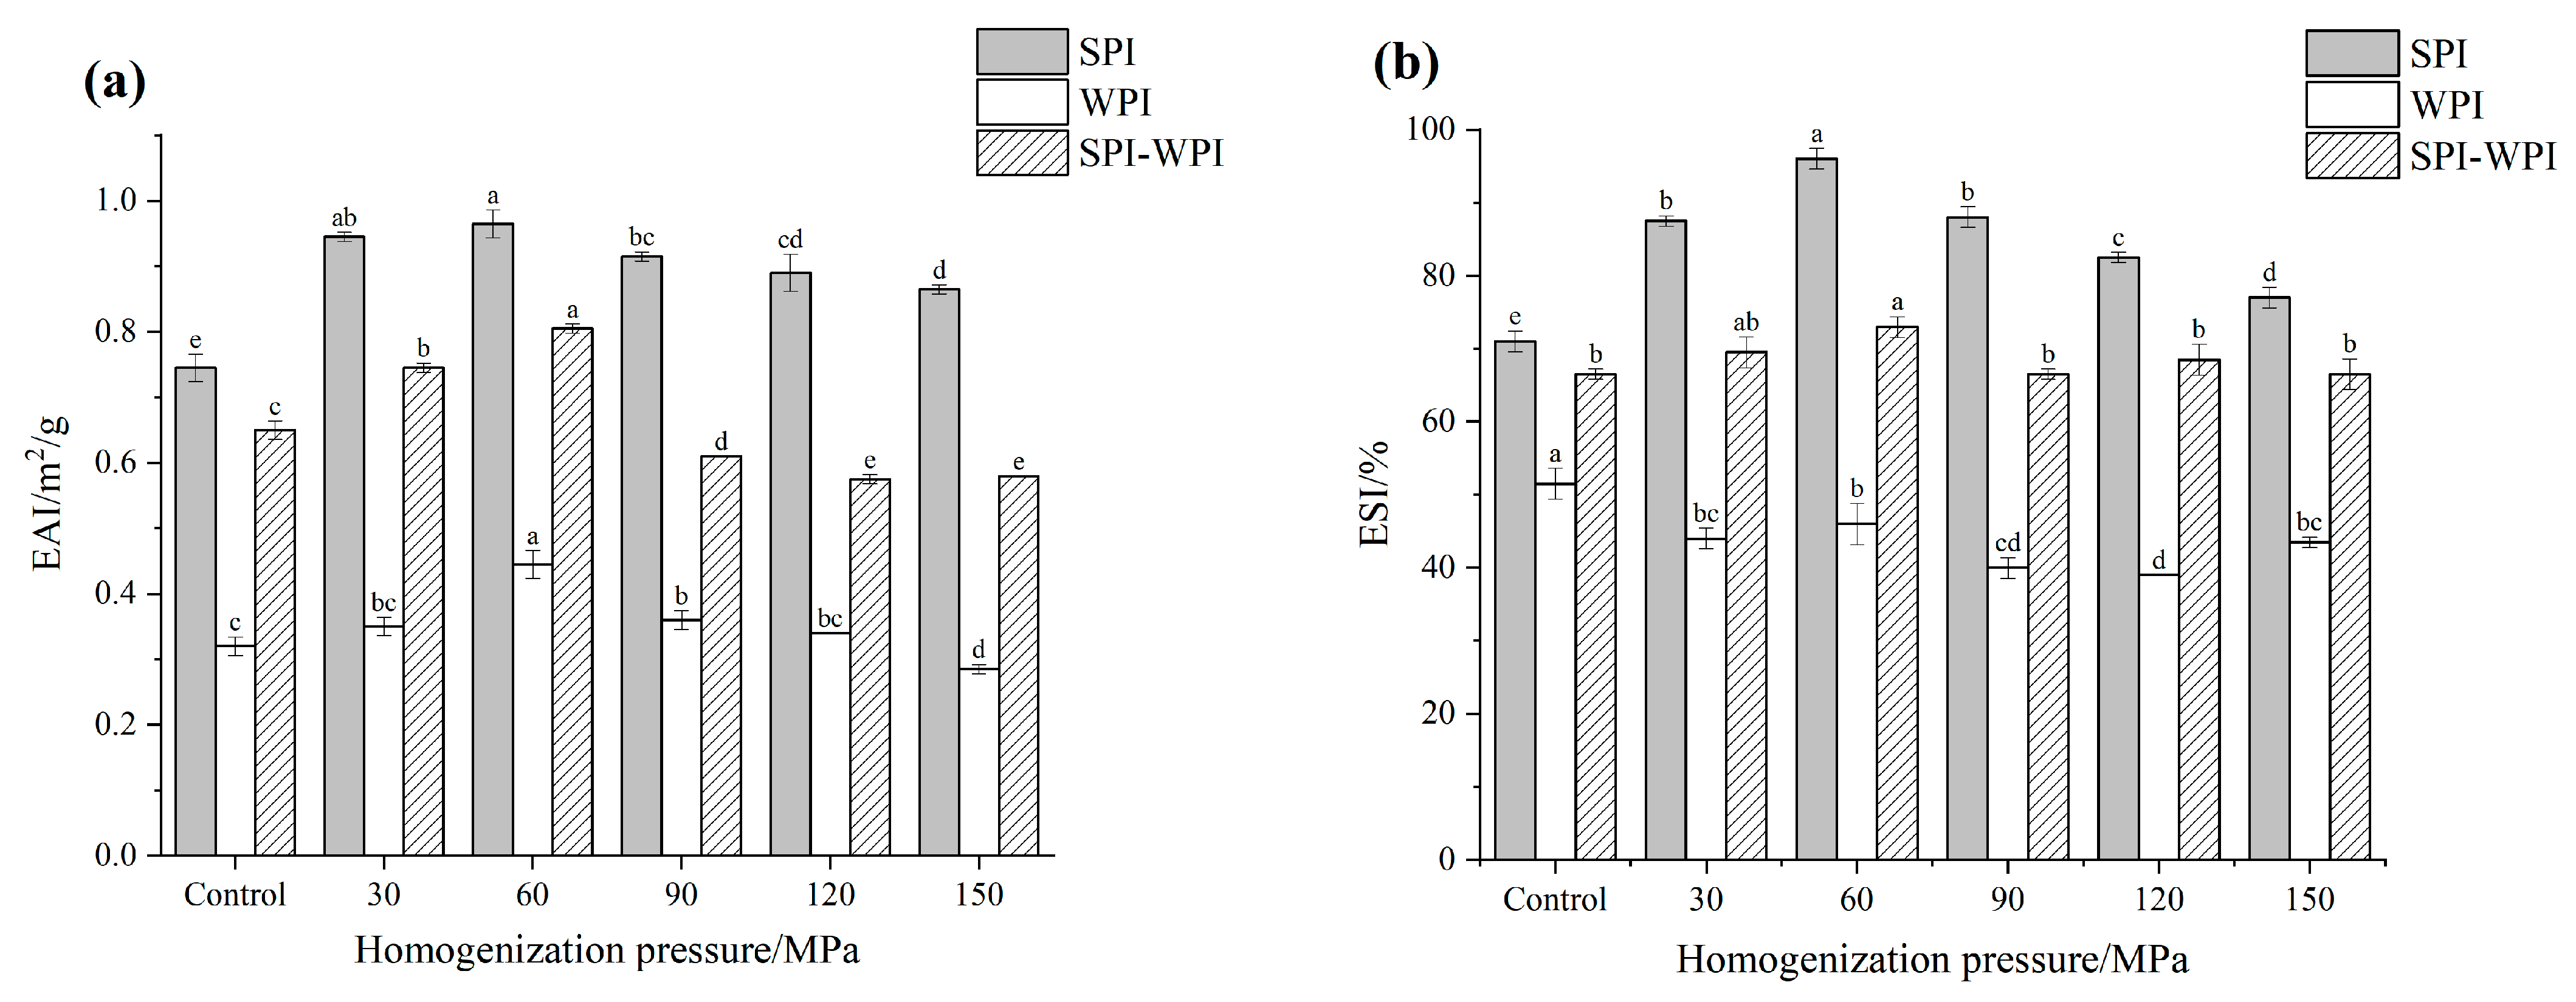
3.8.1. Emulsifying Activity Index (EAI) and Emulsifying Stability Index (ESI)
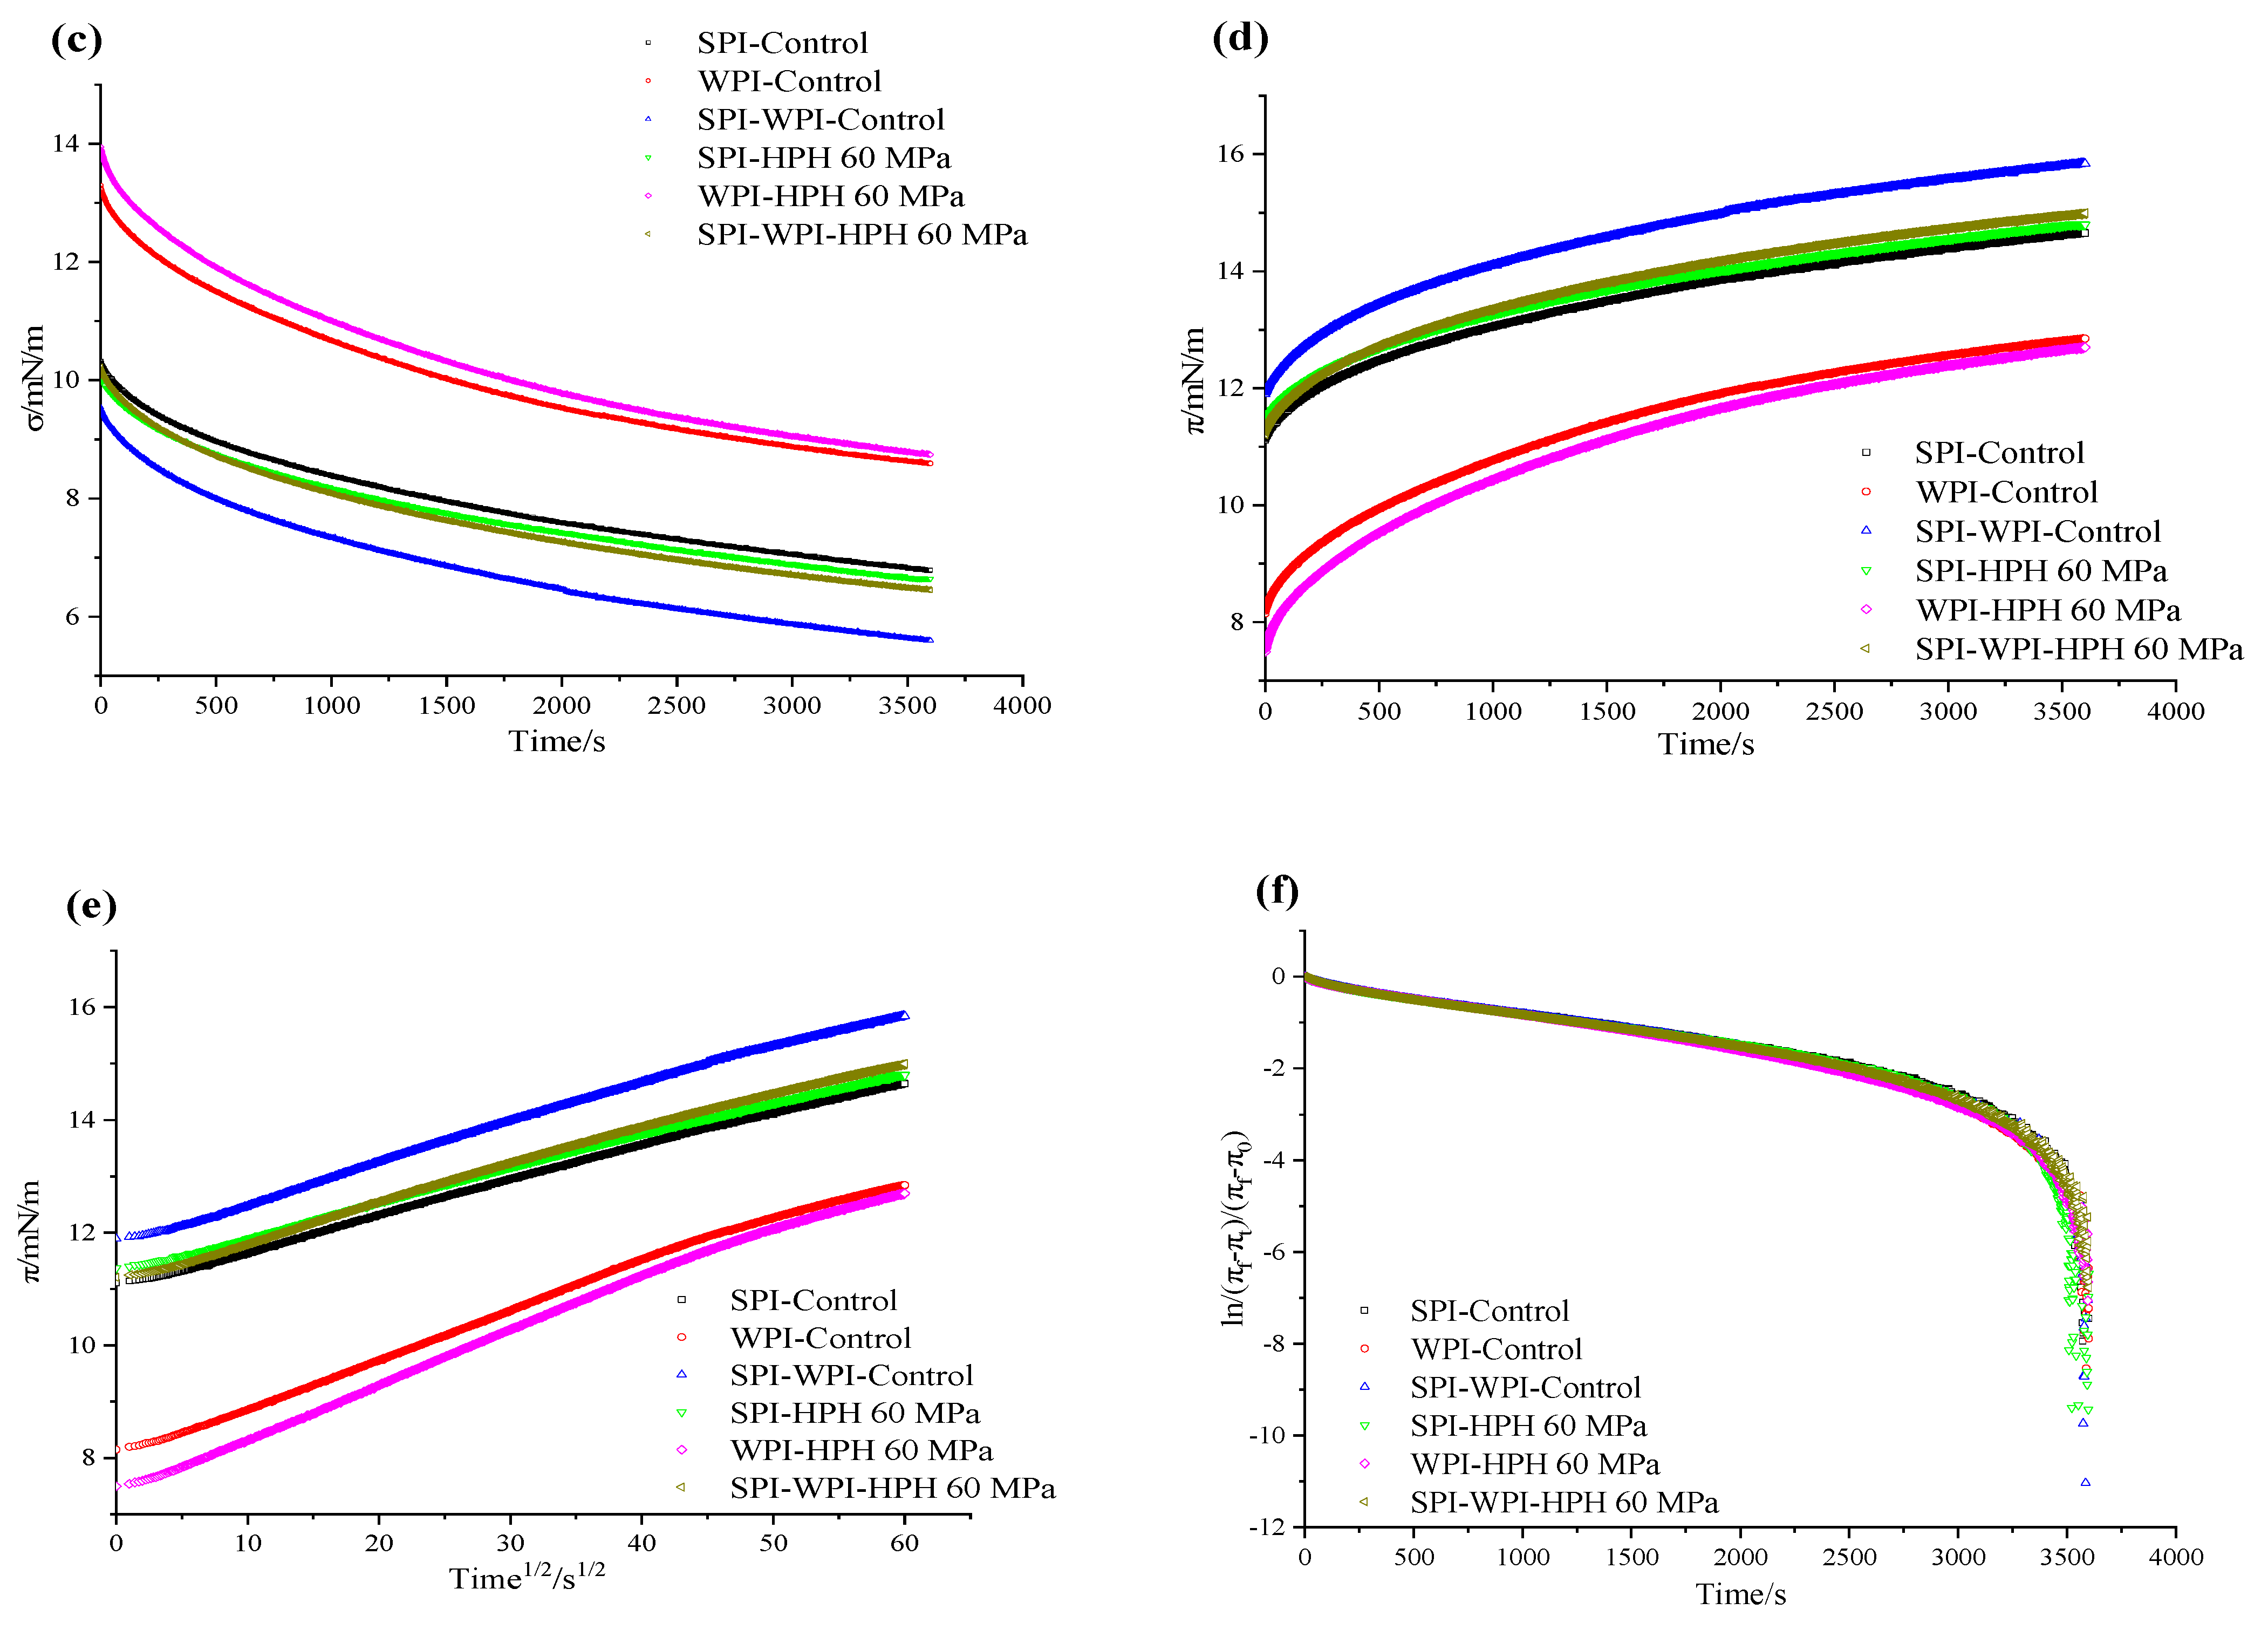
3.8.2. Surface Tension and Interface Adsorption Kinetics
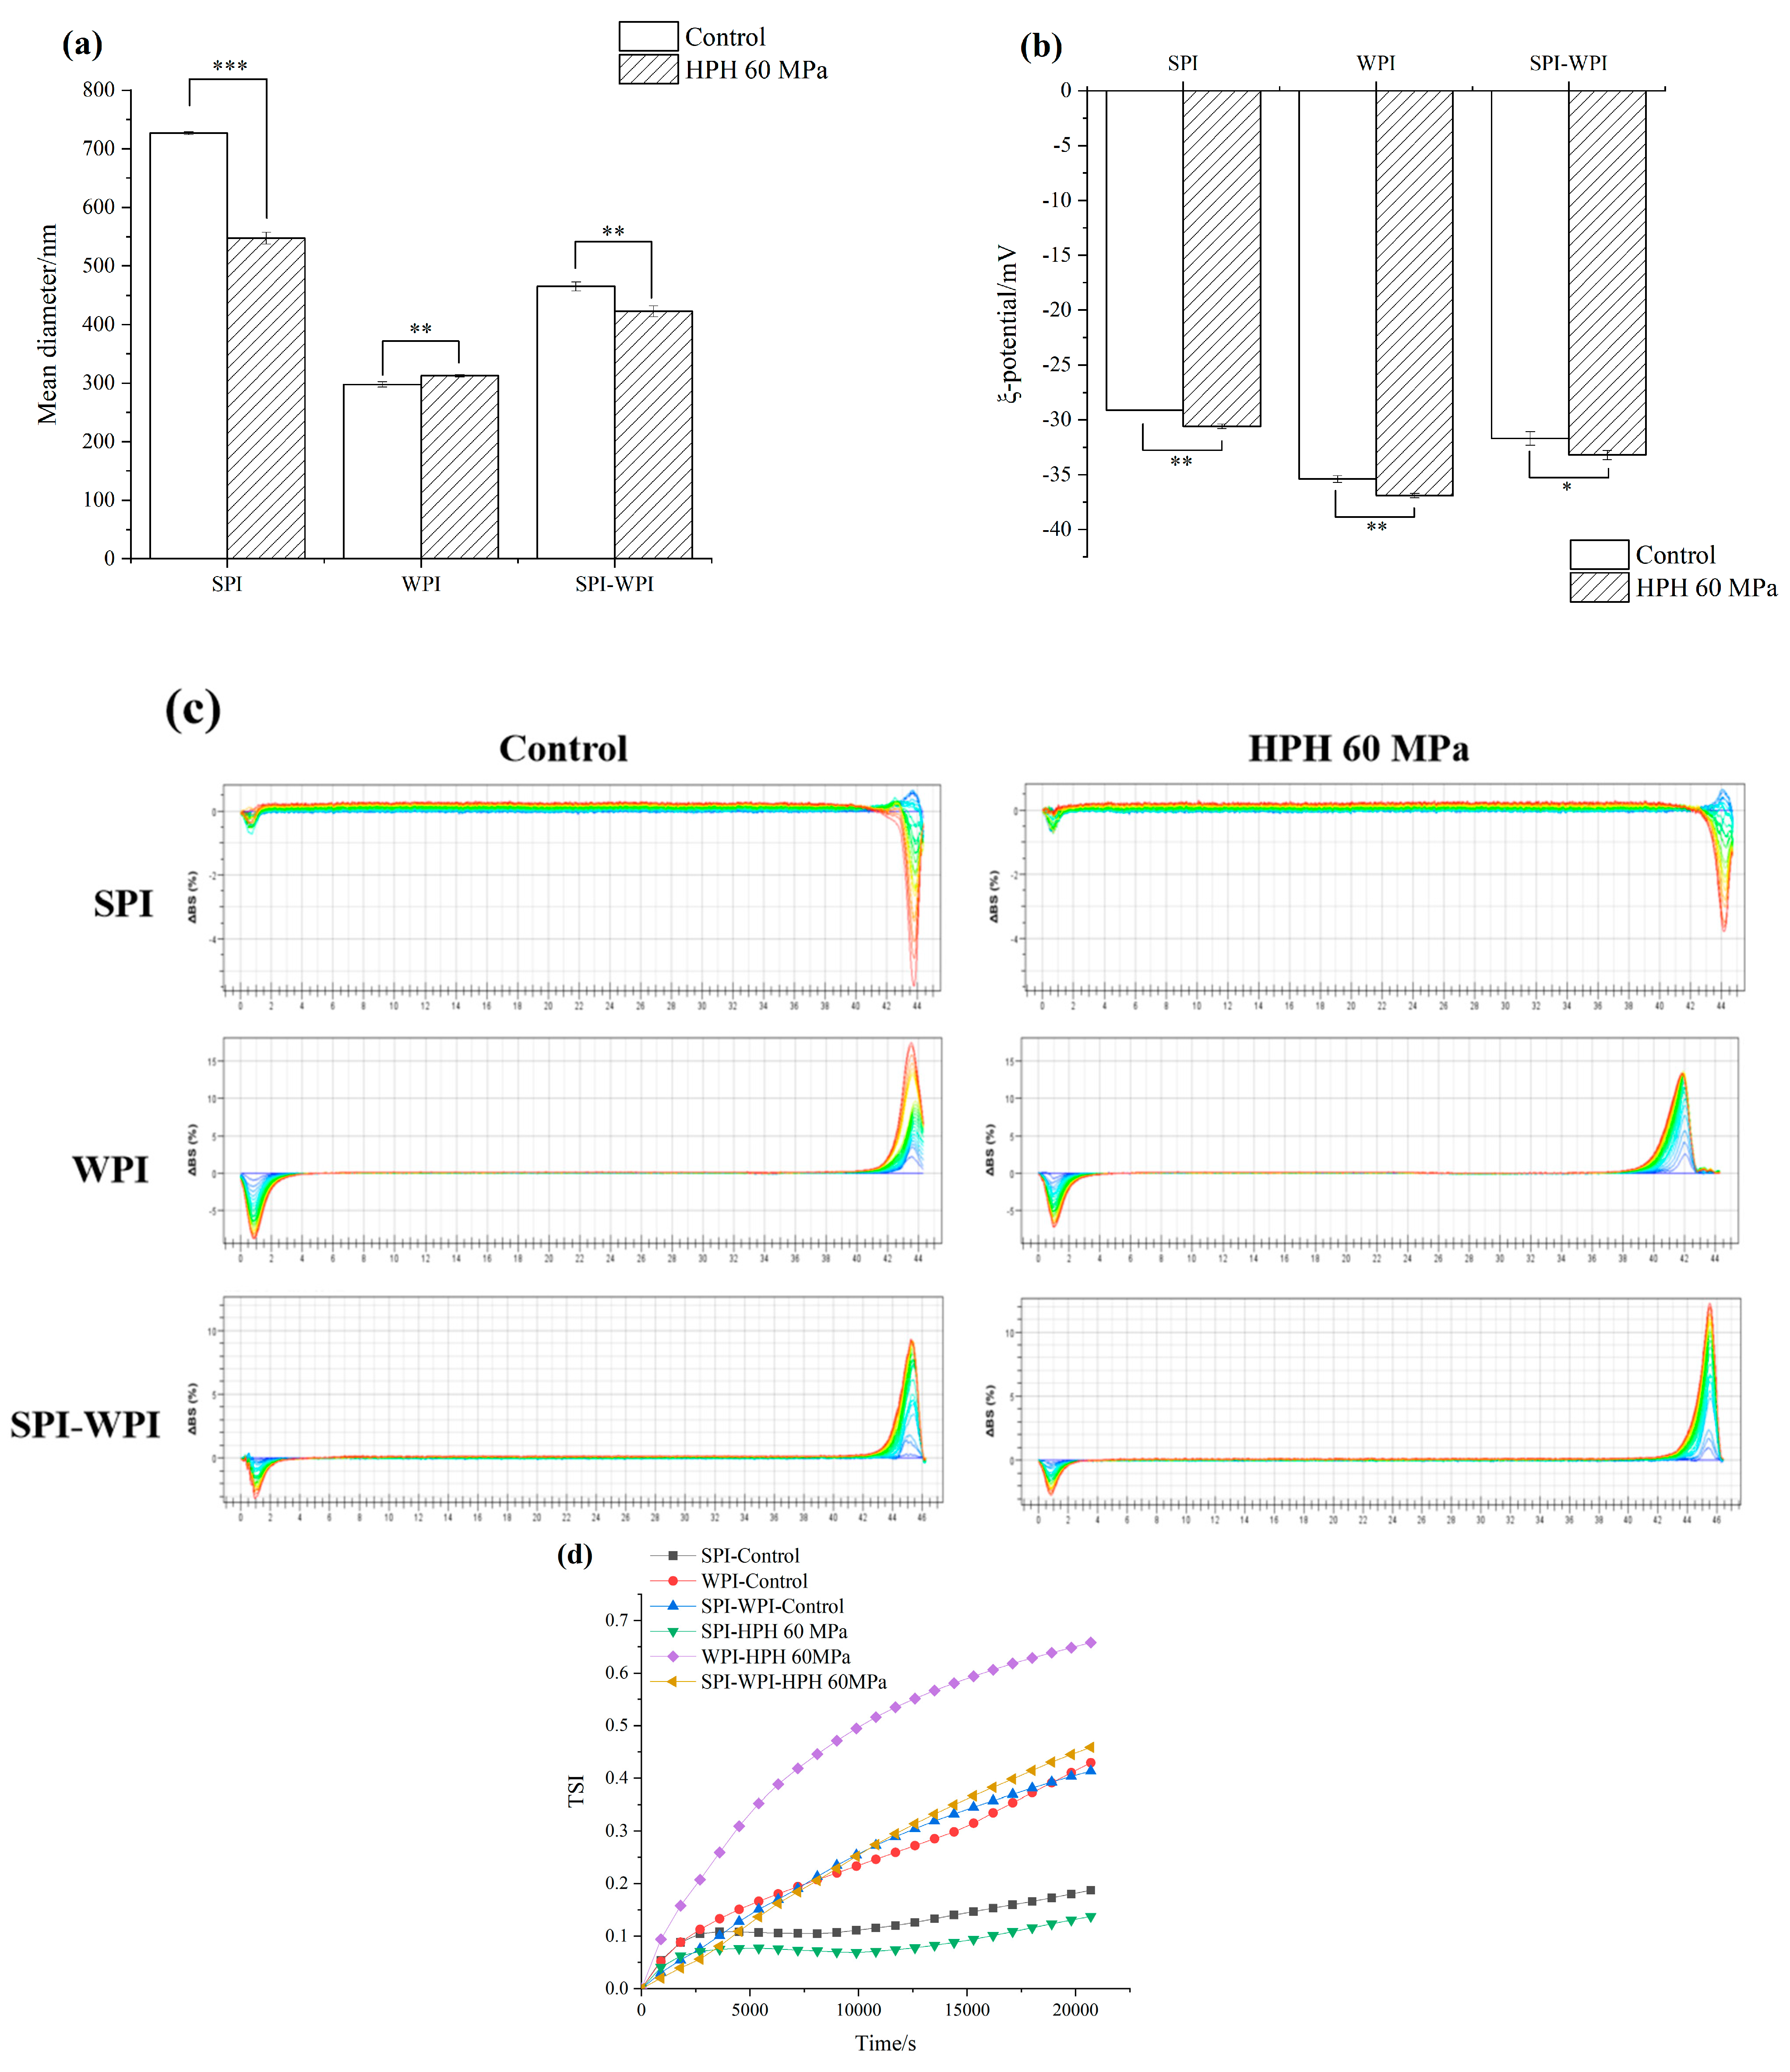
3.8.3. Emulsion Droplet Size and Zeta Potential
3.8.4. Physical Stability Properties
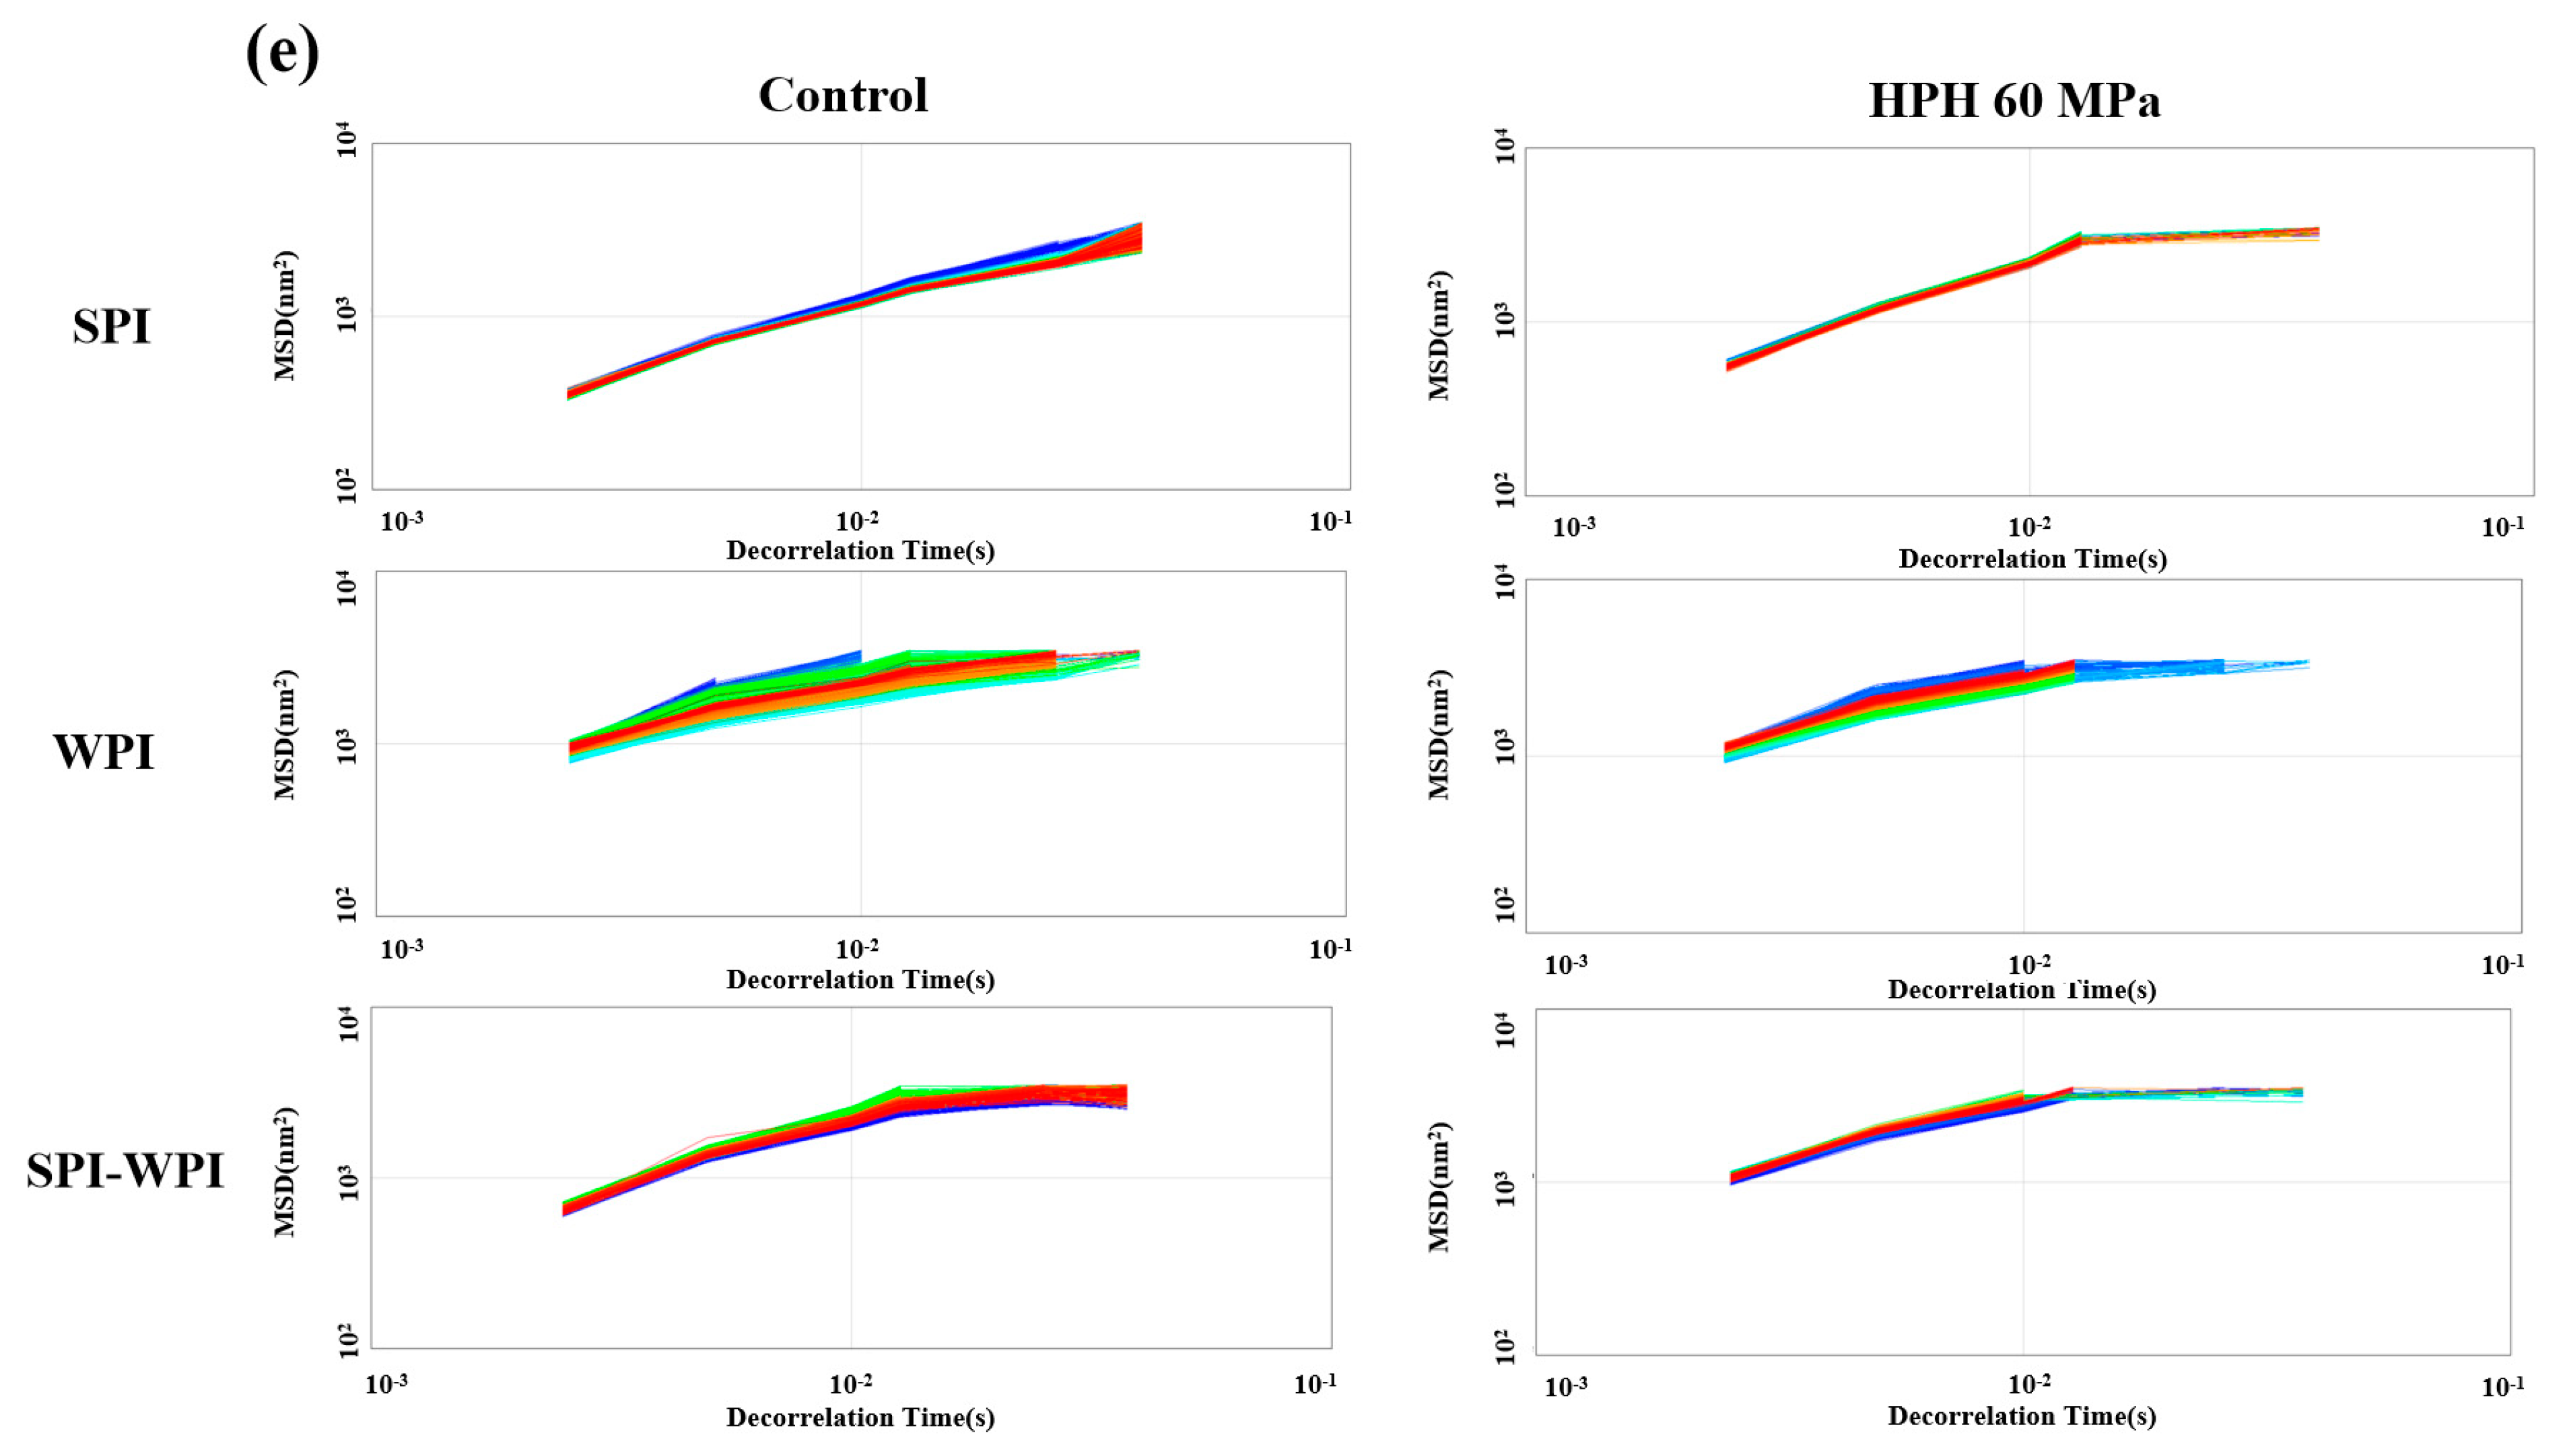
3.8.5. Microrheology of Protein Emulsion
4. Conclusions
Supplementary Materials
Author Contributions
Funding
Data Availability Statement
Conflicts of Interest
Abbreviations
References
- Nishinari, K.; Fang, Y.; Guo, S.; Phillips, G.O. Soy proteins: A review on composition, aggregation and emulsification. Food Hydrocoll. 2014, 39, 301–318. [Google Scholar] [CrossRef]
- Zheng, L.; Regenstein, J.M.; Zhou, L.Y.; Wang, Z.J. Soy protein isolates: A review of their composition, aggregation, and gelation. Compr. Rev. Food Sci. Food Saf. 2022, 21, 1940–1957. [Google Scholar] [CrossRef] [PubMed]
- Hua, Y.F.; Cui, S.W.; Wang, Q.; Mine, Y.; Poysa, V. Heat induced gelling properties of soy protein isolates prepared from different defatted soybean flours. Food Res. Int. 2005, 38, 377–385. [Google Scholar] [CrossRef]
- Sha, L.; Liu, S.S.; Liu, D.Y. Effects of soybean protein isolate on protein structure, batter rheology, and water migration in emulsified sausage. J. Food Process. Preserv. 2020, 44, e14711. [Google Scholar] [CrossRef]
- Morr, C.V.; Ha, E.Y.W. Whey protein concentrates and isolates: Processing and functional properties. Crit. Rev. Food Sci. Nutr. 1993, 33, 431–476. [Google Scholar] [CrossRef]
- Price, D.; Jackson, K.G.; Lovegrove, J.A.; Givens, D.I. The effects of whey proteins, their peptides and amino acids on vascular function. Nutr. Bull. 2022, 47, 9–26. [Google Scholar] [CrossRef]
- West, C.; Gallagher, D. Whey protein-a source of digestible nutrients but palatability issues remain. Food Sci. Technol. 2007, 21, 28–30. [Google Scholar]
- Ren, G.X.; Zhang, J.P.; Li, M.H.; Yi, S.Q.; Wang, J. Protein blend ingestion before allogeneic stem cell transplantation improves protein-energy malnutrition in patients with leukemia. Nutr. Res. 2017, 46, 68–77. [Google Scholar] [CrossRef]
- Zhang, J.J.; Zhang, Q.W.; Liu, H.; Liu, X.Y.; Yu, Y.H.; Han, D.; He, X.Y.; Zeng, P.; Wang, J. Soy-whey dual-protein alleviates osteoporosis of ovariectomized rats via regulating bone fat metabolism through gut-liver-bone axis. Nutrition 2022, 103–104, 111723. [Google Scholar] [CrossRef]
- Huang, Y.C.; Zhang, K.; Zhang, L.; Qiu, J.H.; Fu, L.; Ying, T.Y.; Wang, J.; Qin, R.; Zhang, J.J.; Dong, X.W.; et al. Dosage of dual-protein nutrition differentially impacts the formation of atherosclerosis in apoE-/-mice. Nutrients 2022, 14, 855. [Google Scholar] [CrossRef]
- Li, X.L.; Zhang, Z.H.; Qi, X.H.; Li, L.; Zhu, J.; Brennan, C.S.; Yan, J.K. Application of nonthermal processing technologies in extracting and modifying polysaccharides: A critical review. Compr. Rev. Food Sci. Food Saf. 2020, 20, 4367–4389. [Google Scholar] [CrossRef]
- Szczepanska, J.; Skapska, S.; Polaska, M.; Marszalek, K. High pressure homogenization with a cooling circulating system: The effect on physiochemical and rheological properties, enzymes, and carotenoid profile of carrot juice. Food Chem. 2022, 370, 131023. [Google Scholar] [CrossRef]
- Kruszewski, B.; Domian, E.; Nowacka, M. Influence of high-pressure homogenization on the physicochemical properties and betalain pigments of red beetroot (Beta vulgaris L.) juice. Molecules 2023, 28, 2018. [Google Scholar] [CrossRef]
- Sahil; Madhunita, M.; Prabhakar, P.K.; Kumar, N. Dynamic high pressure treatments: Current advances on mechanistic-cum-transport phenomena approaches and plant protein functionalization. Crit. Rev. Food Sci. Nutr. 2022, 1–26. [Google Scholar] [CrossRef] [PubMed]
- Suarez-Jacobo, A.; Gervilla, R.; Guamis, B.; Roig-Sagues, A.X.; Saldo, J. Effect of UHPH on indigenous microbiota of apple juice. a preliminary study of microbial shelf-life. Int. J. Food Microbiol. 2010, 136, 261–267. [Google Scholar] [CrossRef]
- Song, X.Z.; Zhou, C.J.; Fu, F.; Chen, Z.L.; Wu, Q.L. Effect of high-pressure homogenization on particle size and film properties of soy protein isolate. Ind. Crops Prod. 2013, 43, 538–544. [Google Scholar] [CrossRef]
- Zhao, F.; Zhang, D.F.; Li, X.Y.; Dong, H.Z. High-pressure homogenization pretreatment before enzymolysis of soy protein isolate: The effect of pressure level on aggregation and structural conformations of the protein. Molecules 2018, 23, 1775. [Google Scholar] [CrossRef]
- Melchior, S.; Moretton, M.; Calligaris, S.; Manzocco, L.; Nicoli, M.C. High pressure homogenization shapes the techno-functionalities and digestibility of pea proteins. Food Bioprod. Process. 2022, 131, 77–85. [Google Scholar] [CrossRef]
- Ma, W.C.; Wang, J.M.; Wu, D.; Xu, X.B.; Wu, C.; Du, M. Physicochemical properties and oil/water interfacial adsorption behavior of cod proteins as affected by high-pressure homogenization. Food Hydrocoll. 2019, 100, 105429. [Google Scholar] [CrossRef]
- Chen, Y.; Zhang, R.J.; Xie, B.J.; Sun, Z.D.; McClements, D.J. Lotus seedpod proanthocyanidin-whey protein complexes: Impact on physical and chemical stability of β-carotene-nanoemulsions. Food Res. Int. 2020, 127, 108738. [Google Scholar] [CrossRef]
- Laemmli, U.K. Cleavage of structure proteins during the assembly of head of bacteriophage T4. Nature 1970, 227, 680–685. [Google Scholar] [CrossRef] [PubMed]
- Han, T.L.; Wang, M.Y.; Wang, Y.; Tang, L. Effects of high-pressure homogenization and ultrasonic treatment on the structure and characteristics of casein. LWT-Food Sci. Technol. 2020, 130, 109560. [Google Scholar] [CrossRef]
- Kato, A.; Nakai, S. Hydrophobicity determined by a fluorescence probe method and its correlation with surface properties of proteins. Biochim. Biophys. Acta (BBA)-Protein Struct. 1980, 624, 13–20. [Google Scholar] [CrossRef]
- Cui, Q.; Wang, G.R.; Gao, D.; Wang, L.; Zhang, A.Q.; Wang, X.B.; Xu, N.; Jiang, L.Z. Improving the gel properties of transgenic microbial transglutaminase cross-linked soybean-whey mixed protein by ultrasonic pretreatment. Process Biochem. 2020, 91, 104–112. [Google Scholar] [CrossRef]
- Pearce, K.N.; Kinsella, J.E. Emulsifying properties of proteins: Evaluation of a turbidimetric technique. J. Agric. Food Chem. 1978, 26, 716–723. [Google Scholar] [CrossRef]
- Essam, H.; Victoria, F.; Anabel, B.; Antonio-jose, T. Impact of oil phase concentration on physical and oxidative stability of oil-in-water emulsions stabilized by sodium caseinate and ultra-high pressure homogenization. J. Dispers. Sci. Technol. 2019, 42, 46–57. [Google Scholar] [CrossRef]
- Zhu, Q.; Qiu, S.; Zhang, H.; Cheng, Y.; Yin, L. Physical stability, microstructure and micro-rheological properties of water-in-oil-in-water (W/O/W) emulsions stabilized by porcine gelatin. Food Chem. 2018, 253, 63–70. [Google Scholar] [CrossRef]
- Wu, F.; Shi, X.J.; Zou, H.N.; Zhang, T.Y.; Dong, X.R.; Zhu, R.; Yu, C.P. Effects of high-pressure homogenization on physicochemical, rheological and emulsifying properties of myofibrillar protein. J. Food Eng. 2019, 263, 272–279. [Google Scholar] [CrossRef]
- Sui, X.N.; Bi, S.; Qi, B.K.; Wang, Z.J.; Zhang, M.; Li, Y.; Jiang, L.Z. Impact of ultrasonic treatment on an emulsion system stabilized with soybean protein isolate and lecithin: Its emulsifying property and emulsion stability. Food Hydrocoll. 2016, 63, 727–734. [Google Scholar] [CrossRef]
- Yu, C.P.; Wu, F.; Cha, Y.; Zou, H.N.; Bao, J.; Xu, R.N.; Du, M. Effects of high-pressure homogenization on functional properties and structure of mussel (Mytilus edulis) myofibrillar proteins. Int. J. Biol. Macromol. 2018, 118, 741–746. [Google Scholar] [CrossRef]
- Liu, H.H.; Kuo, M.I. Ultra high pressure homogenization effect on the proteins in soy flour. Food Hydrocoll. 2016, 52, 741–748. [Google Scholar] [CrossRef]
- Julia, A.G.; Rene, M.; Munoz, M.C.; Picart, L.; Pedemonte, T.L.; Chevalier, D.; Dumay, E. Effect of dynamic high pressure on whey protein aggregation: A comparison with the effect of ontinuous short-time thermal treatments. Food Hydrocoll. 2008, 22, 1014–1032. [Google Scholar] [CrossRef]
- Chen, X.; Zhou, R.Y.; Xu, X.L.; Zhou, G.H.; Liu, D.M. Structural modification by high-pressure homogenization for improved functional properties of freeze-dried myofibrillar proteins powder. Food Res. Int. 2017, 100, 193–200. [Google Scholar] [CrossRef] [PubMed]
- Zhang, Y.P.; Yang, R.J.; Zhang, W.N.; Hu, Z.X.; Zhao, W. Structural characterization and physicochemical properties of protein extracted from soybean meal assisted by steam flash-explosion with dilute acid soaking. Food Chem. 2017, 219, 48–53. [Google Scholar] [CrossRef] [PubMed]
- Mohammed, M.S. Recent advances in the use of intrinsic fluorescence for bacterial identification and characterization. J. Fluoresc. 2007, 17, 455–459. [Google Scholar] [CrossRef]
- Shi, R.J.; Liu, Y.; Hu, J.L.; Gao, H.; Qayum, A.; Bilawal, A.; Munkh-Amgalan, G.; Jiang, Z.M.; Hou, J.C. Combination of high-pressure homogenization and ultrasound improves physiochemical, interfacial and gelation properties of whey protein isolate. Innov. Food Sci. Emerg. Technol. 2021, 65, 102450. [Google Scholar] [CrossRef]
- Laligant, A.; Dumay, E.; Valencia, C.C.; Cuq, J.L.; Cheftel, J.C. Surface hydrophobicity and aggregation of. beta-lactoglobulin heated near neutral pH. J. Agric. Food Chem. 1991, 39, 2147–2155. [Google Scholar] [CrossRef]
- Kang, Z.L.; Bai, R.; Lu, F.; Zhang, T.; Gao, Z.S.; Zhao, M.X.; Zhu, M.M.; Ma, H.J. Effects of high pressure homogenization on the solubility, foaming, and gel properties of soy 11S globulin. Food Hydrocoll. 2022, 124, 107261. [Google Scholar] [CrossRef]
- Bos, M.A.; Van Vliet, T. Interfacial rheological properties of adsorbed protein layers and surfactants: A review. Adv. Colloid Interface Sci. 2001, 91, 437–471. [Google Scholar] [CrossRef] [PubMed]
- Yang, J.Q.; Liu, G.Y.; Zeng, H.B.; Chen, L.Y. Effects of high pressure homogenization on faba bean protein aggregation in relation to solubility and interfacial properties. Food Hydrocoll. 2018, 83, 275–286. [Google Scholar] [CrossRef]
- Dickinson, E. Mixed biopolymers at interfaces: Competitive adsorption and multilayer structures. Food Hydrocoll. 2011, 25, 1966–1983. [Google Scholar] [CrossRef]
- Li, M.T.; Mcclements, D.J.; Liu, X.B.; Liu, F.G. Design principles of oil-in-water emulsions with functionalized interfaces: Mixed, multilayer, and covalent complex structures. Compr. Rev. Food Sci. Food Saf. 2020, 19, 3159–3190. [Google Scholar] [CrossRef] [PubMed]
- Ward, A.F.H.; Tordai, L. Time-dependence of boundary tensions of solutions I. the role of diffusion in time-effects. J. Chem. Phys. 1946, 14, 453–461. [Google Scholar] [CrossRef]
- Liu, L.; Zhao, Q.; Liu, T.; Zhao, M. Dynamic surface pressure and dilatational viscoelasticity of sodium caseinate/xanthan gum mixtures at the oil-water interface. Food Hydrocoll. 2011, 25, 921–927. [Google Scholar] [CrossRef]
- Graham, D.E.; Phillips, M.C. Proteins at liquid interfaces: III. molecular structures of adsorbed films. J. Colloid Interface Sci. 1979, 70, 427–439. [Google Scholar] [CrossRef]
- Hu, M.; Xie, F.Y.; Zhang, S.; Li, Y.; Qi, B.K. Homogenization pressure and soybean protein concentration impact the stability of perilla oil nanoemulsions. Food Hydrocoll. 2020, 101, 105575. [Google Scholar] [CrossRef]
- Christian, C.; Elena, T.; Donato, C.; Donatella, P.; Massimo, F. Turbiscan Lab® expert analysis of the stability of ethosomes® and ultradeformable liposomes containing a bilayer fluidizing agent. Colloids Surf. B Biointerfaces 2019, 72, 155–160. [Google Scholar] [CrossRef]
- Michael, M.; Rhett, L.M.; Maneesh, K.G.; Jin, K.M. Particle-based microrheology as a tool for characterizing protein based materials. ACS Biomater. Sci. Eng. 2022, 08, 2747–2763. [Google Scholar] [CrossRef]
- Tisserand, C.; Fleury, M.; Brunel, L.; Bru, P.; Meunier, G. Analytical series soft matter analysis by means of microrheology. Jct Coatingstech 2012, 9, 46–51. [Google Scholar]

| Control | HPH 60 MPa | |||||
|---|---|---|---|---|---|---|
| SPI | WPI | SPI-WPI | SPI | WPI | SPI-WPI | |
| Kdiff | 5.89 × 10⁻² ± 0.003 a | 7.83 × 10⁻² ± 0.002 b | 6.57 × 10⁻² ± 0.002 a | 5.71 × 10⁻² ± 0.001 b | 8.67 × 10⁻² ± 0.001 a | 6.30 × 10⁻² ± 0.004 a |
| Kp | 1.19 × 10⁻³ ± 0.001 a | 1.26 × 10⁻³ ± 0.000 b | 1.21 × 10⁻³ ± 0.002 a | 1.25 × 10⁻³ ± 0.001 a | 1.72 × 10⁻³ ± 0.001 a | 1.22 × 10⁻³ ± 0.002 a |
| Kr | 1.23 × 10⁻² ± 0.001 b | 1.28 × 10⁻² ± 0.001 a | 2.30 × 10⁻² ± 0.002 a | 1.75 × 10⁻² ± 0.001 a | 1.08 × 10⁻² ± 0.002 b | 9.90 × 10⁻³ ± 0.001 b |
| Control | HPH 60 MPa | |||||
|---|---|---|---|---|---|---|
| SPI | WPI | SPI-WPI | SPI | WPI | SPI-WPI | |
| EI | 6.99 × 10⁻⁴ ± 0.000 a | 4.60 × 10⁻⁴ ± 0.001 a | 4.73 × 10⁻⁴ ± 0.000 b | 6.86 × 10⁻⁴ ± 0.001 b | 3.74 × 10⁻⁴ ± 0.002 b | 5.09 × 10⁻⁴ ± 0.000 a |
| MVI | 1.26 × 10⁻⁵ ± 0.000 a | 1.61 × 10⁻⁵ ± 0.000 b | 1.54 × 10⁻⁵ ± 0.001 a | 4.22 × 10⁻⁶ ± 0.000 b | 2.06 × 10⁻⁵ ± 0.000 a | 4.47 × 10⁻⁶ ± 0.001 b |
| SLB | 7.87 × 10⁻¹ ± 0.002 b | 5.16 × 10⁻¹ ± 0.001 a | 6.00 × 10⁻¹ ± 0.001 b | 1.02 ± 0.001 a | 3.58 × 10⁻¹ ± 0.001 b | 7.30 × 10⁻¹ ± 0.001 a |
Disclaimer/Publisher’s Note: The statements, opinions and data contained in all publications are solely those of the individual author(s) and contributor(s) and not of MDPI and/or the editor(s). MDPI and/or the editor(s) disclaim responsibility for any injury to people or property resulting from any ideas, methods, instructions or products referred to in the content. |
© 2023 by the authors. Licensee MDPI, Basel, Switzerland. This article is an open access article distributed under the terms and conditions of the Creative Commons Attribution (CC BY) license (https://creativecommons.org/licenses/by/4.0/).
Share and Cite
Wu, M.; He, X.; Feng, D.; Li, H.; Han, D.; Li, Q.; Zhao, B.; Li, N.; Liu, T.; Wang, J. The Effect of High Pressure Homogenization on the Structure of Dual-Protein and Its Emulsion Functional Properties. Foods 2023, 12, 3358. https://doi.org/10.3390/foods12183358
Wu M, He X, Feng D, Li H, Han D, Li Q, Zhao B, Li N, Liu T, Wang J. The Effect of High Pressure Homogenization on the Structure of Dual-Protein and Its Emulsion Functional Properties. Foods. 2023; 12(18):3358. https://doi.org/10.3390/foods12183358
Chicago/Turabian StyleWu, Meishan, Xiaoye He, Duo Feng, Hu Li, Di Han, Qingye Li, Boya Zhao, Na Li, Tianxin Liu, and Jing Wang. 2023. "The Effect of High Pressure Homogenization on the Structure of Dual-Protein and Its Emulsion Functional Properties" Foods 12, no. 18: 3358. https://doi.org/10.3390/foods12183358
APA StyleWu, M., He, X., Feng, D., Li, H., Han, D., Li, Q., Zhao, B., Li, N., Liu, T., & Wang, J. (2023). The Effect of High Pressure Homogenization on the Structure of Dual-Protein and Its Emulsion Functional Properties. Foods, 12(18), 3358. https://doi.org/10.3390/foods12183358