Article

Influence of Variety, Enzyme Addition and Destemming on Yield and Bioactive Compounds of Juices from Selected Hybrid Grape Varieties Cultivated in Poland

by
Muhamad Alfiyan Zubaidi
1,
Marta Czaplicka
2,
Joanna Kolniak-Ostek
1 and
Agnieszka Nawirska-Olszańska
1,*
1
Department of Fruit, Vegetable and Plant Nutraceutical Technology, Wrocław University of Environmental and Life Sciences, 51-630 Wrocław, Poland
2
Department of Horticulture, Wroclaw University of Environmental and Life Sciences, 50-375 Wrocław, Poland
*
Author to whom correspondence should be addressed.
Foods 2023, 12(18), 3475; https://doi.org/10.3390/foods12183475
Submission received: 28 August 2023 / Revised: 10 September 2023 / Accepted: 18 September 2023 / Published: 19 September 2023
(This article belongs to the Section Plant Foods)

Abstract

:
In this study, five varieties of hybrid grapes were processed into juice to assess the influence of variety, destemming process and enzyme addition on juice quality, including yield, physicochemical properties and bioactive compounds. The results highlighted that while the processing methods had some impact on juice quality, the inherent grape variety remained the most significant factor. Although similar treatments were applied to all varieties, there were differences in the quality attributes of the juice. In general, red grape juice had a higher polyphenol content and antioxidant capacity than white grape juice. Four phenolic acids, eleven flavonols, five flavan-3-ols and five anthocyanins were identified. While the polyphenolic profile of each sample depended on the treatment and the variety, regardless of the variety, destemming was found to increase the yield by around 10–15%, while the addition of enzyme improved the yield by around 20–30%. Although the addition of enzymes led to a higher polyphenol content, it changed the color profile of the juice as a result of the pigment’s skin extraction. In contrast, the destemming process did not influence the color of the juice, but at the same time, it reduced the health benefits due to the removal of potential bioactive compounds from the stems.

1. Introduction

Grapes are good sources of antioxidants and bioactive flavonoids and offer numerous health-promoting properties with a rich taste and aroma. The antioxidant activity of the polyphenols present in grapes is believed to be much higher than that of essential vitamins and contributes to the dietary benefits of grapes [1].
Grapes have a high polyphenol content, including flavonoids (anthocyanins, flavonols and flavan-3-ols), phenolic acids, triterpenes and minerals that benefit the human body. These bioactive compounds possess free radical scavenger properties that protect the circulatory, nervous and immune systems and maintain significant health functions [2,3].
Nowadays, viticulture is mainly associated with countries with warm climates and long, hot summers. However, vineyards have also settled in countries with less favorable and cold climates such as Poland. According to Council Regulation (EC) 2165/2005, Poland is included in Zone A, the coldest zone of the winegrowing region [4].
Climate is undoubtedly one of the most critical factors influencing grape cultivation quality and productivity. With respect to the viticulture theory, two types of climate are most often distinguished: warm and cold [5]. Cold climate refers to regions where the average month’s temperature preceding the grape harvest season is less than 15 °C. The temperature usually drops quickly in the cold climate region before harvest, making the grapes have different tastes and flavors. Low temperatures preserve acidity in grapes, which can result in grapes with higher acidity levels. However, excessive acidity may not be preferable to consumers. In a cold climate like Poland, viticulture is more challenging than in warm regions. Grapes are susceptible to winter frost and fungal disease. Due to weather conditions, the berries may not reach their complete maturation composition [6]. The conventional variety of grape (Vitis vinifera L.) is poorly adaptive to fungal infection and winter frost, making it unsuitable to grow in cold climates. Therefore, a hybrid grape, a cross-species variety, is introduced to improve its resistance to fungal disease and low temperatures [7,8]. However, hybrid grape varieties are characterized by thick skin and have a high polyphenol content [3,9]. This character makes the hybrid grape less preferable for direct consumption. Consequently, over 80% of grapes grown worldwide are used for wine or juice manufacturing [10].
Several previous studies on hybrid grapes grown in Poland investigated mainly wine [9,11,12,13], but no research was found investigating juice processing using hybrid grapes grown in Poland as raw materials. Therefore, the investigation of hybrid-grape juice processing will provide significant knowledge that can be contributed by this study.
In industrial grape juice processing, enzymes play a crucial role in enhancing both the yield and quality of the juice. The addition of enzymes catalyzes the degradation of cell walls, thereby facilitating juice extraction and resulting in a higher yield. Furthermore, the introduction of enzymes aids in the extraction of phenolic compounds, color pigments, aromas and other soluble constituents [14].
Souquet et al. reported that grape stems contain a significant amount of bioactive compounds [15]. The incorporation of grape stems into the maceration process is expected to produce juice with a higher polyphenol content. This study aims to investigate the impact of grape variety, enzyme addition and destemming processes on yield, physicochemical properties, total phenolic content, antioxidant capacity and individual phenolic compounds in grape juice.

2. Materials and Methods

2.1. Grapes

Three white grape varieties (Johanniter (J), Muscaris (M) and Aurora (A)) and two red grape varieties (Golubok (G) and Regent (R)) were obtained from the Research and Teaching Station of the Department of Horticulture of the Wroclaw University of Environmental and Life Sciences in the village of Samotwór, Wroclaw, Lower Silesia Province, Poland. The characteristics of each cultivar are represented in Table 1.

2.2. Reagents, Enzymes and Standards

The standards caffeic acid, caftaric acid, coutaric acid, fertaric acid, kaempferol-3-O-rutinoside, quercetin-3-rutinoside, kaempferol 3-O-galactoside, quercetin-3-glucuronide, quercetin-3-galactoside, quercetin-3-glucoside, quercetin-3-rhamnoside, kaempferol-3-O-glucoside, isorhamnetin 3-glucoside, dihydroquercetin-3,5-rhamnoside, dihydrokaempferol-3-glucoside, procyanidin trimer, procyanidin B2, procyanidin tetramer, (−)-epicatechin, (−)-epicatechin 3-gallate, petunidyn-3-O-glucoside, malvidyn-3-O-glucoside, delphinidyn-3-O-(6′-acetyl)-glucoside, petunidyn-3-O-(6″-p-coumaroyl)-glucoside and malvidyn-3-O-(6″-caffeoyl)-glucoside were purchased from Extrasynthese (Lyon Nord, France). 2,2′-Azino-bis (3-ethylbenzothiazoline-6-sulfonic acid, ABTS), gallic acid, FeCl3, Trolox and all solvents were purchased from Sigma-Aldrich (Steinheim, Germany). Pectinex® Ultra SP-L was obtained from Novozymes (Bagsvaerd, Denmark).

2.3. Juice Processing

The grapes were kept in chilling conditions at 4 °C until juice processing. The grapes were processed into juice within a maximum of five days after harvesting. The grapes were washed and destemmed if necessary.
Before macerating at 40 °C for 90 min, the grapes were crushed and 0.05% (w/w) of Pectinex® Ultra SP-L enzyme was added. The must was then pressed using a hydraulic press (type TPZ 7, Bucher-Guyer, Niederweningen, Switzerland) and filtered to obtain juice. The juices were immediately frozen at −20 °C until analysis. The samples according to the varieties and treatments are shown in Table 2.

2.4. Dry Matter, Total Soluble Solid, Titratable Acidity and Pectin

The determination of the dry matter content (dm) of the juices was carried out in a vacuum dryer (SPT-200, ZEAMiL Horyzont, Kraków, Poland) at 80 °C for 24 h at a pressure of 1 kPa. The measurement was carried out in duplicate.
The total soluble solid was measured using a Refractometer PAL-1 (Atago, WA, USA). The measurement was taken in duplicate and expressed as °Brix.
The titratable acidity (TA) was determined according to titration aliquots using a titrator (Orion Star T910, Thermo Fisher Scientific, Beijing, China) and following the Polish standard (PN-90/A-75101/04, 1999) [16]. NaOH (0.1 N) was slowly added to the whole fresh grapes and homogenized until the endpoint (pH 8.1), and this process was controlled using an automatic pH titration system. The measurement was carried out in triplicate and expressed as g of tartaric acid per 100 mL. The analysis of pectin content was performed according to Pijanowski et al. [17].

2.5. Color (L*a*b)

The color of the grape juices was measured with a Color Quest XE Hunter Lab colorimeter (Reston, VA, USA) using CIE standard Illuminant D65 at 10° observer. The measurement was performed in triplicate. The results of the color measurements were expressed as L*a*b values (L (lightness), a (red–green) and b (yellow–blue) [18].

2.6. Turbidity and Viscosity

Juice turbidity was measured with a turbidimeter (Turbiquant 3000 T; Merck; Dramstad, Germany). Turbidity was measured in duplicate and expressed as NTU. The viscosity was determined using a viscometer (DV-II+ PRO VISCOMETER; Brookfield, Harlow, UK) at ambient temperature. The viscosity measurement was performed in triplicate and expressed as mPa·s.

2.7. Antioxidant Capacity

The extraction of the sample for antioxidant capacity and polyphenol content was carried out according to Kolniak-Ostek [19]. The antioxidant capacity of the grape juice was determined by ABTS and FRAP using a Synergy H1 spectrophotometer (BioTek Instruments Inc., Winooski, VT, USA) as previously described by Re et al. [20] and Benzie and Strain [21], respectively. The measurements were carried out in quadruplicate, and the results were expressed as mmol of Trolox equivalent (TxE) per liter of juice.

2.8. Total Phenolic Content

The total polyphenolic content was determined in 70% methanol extract (v/v) using the Folin–Ciocalteu method and measured using a Synergy H1 spectrophotometer (BioTek Instruments Inc., Winooski, VT, USA). The measurement was carried out in quadruples, and the result was expressed as g of gallic acid equivalent (GAE) per 100 mL of juice.

2.9. Identification and Quantification of Polyphenols

The polyphenols in the samples were identified and quantified using UPLC-PDA-FL (Waters Corp., Milford, MA, USA). The preparation and analysis of the sample were carried out as described by Nawirska-Olszańska et al. [22]. A sample of 5 μL was taken by an autosampler (BEH C18 column, 2.1 × 100 mm, 1.7 µm; Waters Corp.; Dublin, Ireland) at 30 °C and gradient elution (0–12 min 98–65% A, 12.1–13.5 0% A, 13.6–15 min 98%) with the mobile phase of solvent A (0.1% formic acid in water) and solvent B (0.1% formic acid in acetonitrile). The separation parameter of the mass spectrometer followed Kolniak-Ostek and Oszmiański [23]. The identification of polyphenols was determined by the retention time (Rt) of the standards. The polyphenol content was quantified using calibration curves of selected pure compounds.

2.10. Statistical Analysis

Statistical analyses were carried out using Statistica 14 (Statsoft, Tulsa, OK, USA). The factorial analysis of variance (ANOVA) with the HSD Tukey post hoc test (p < 0.05), cluster analysis and correlation matrix were performed to compare the results.

3. Results

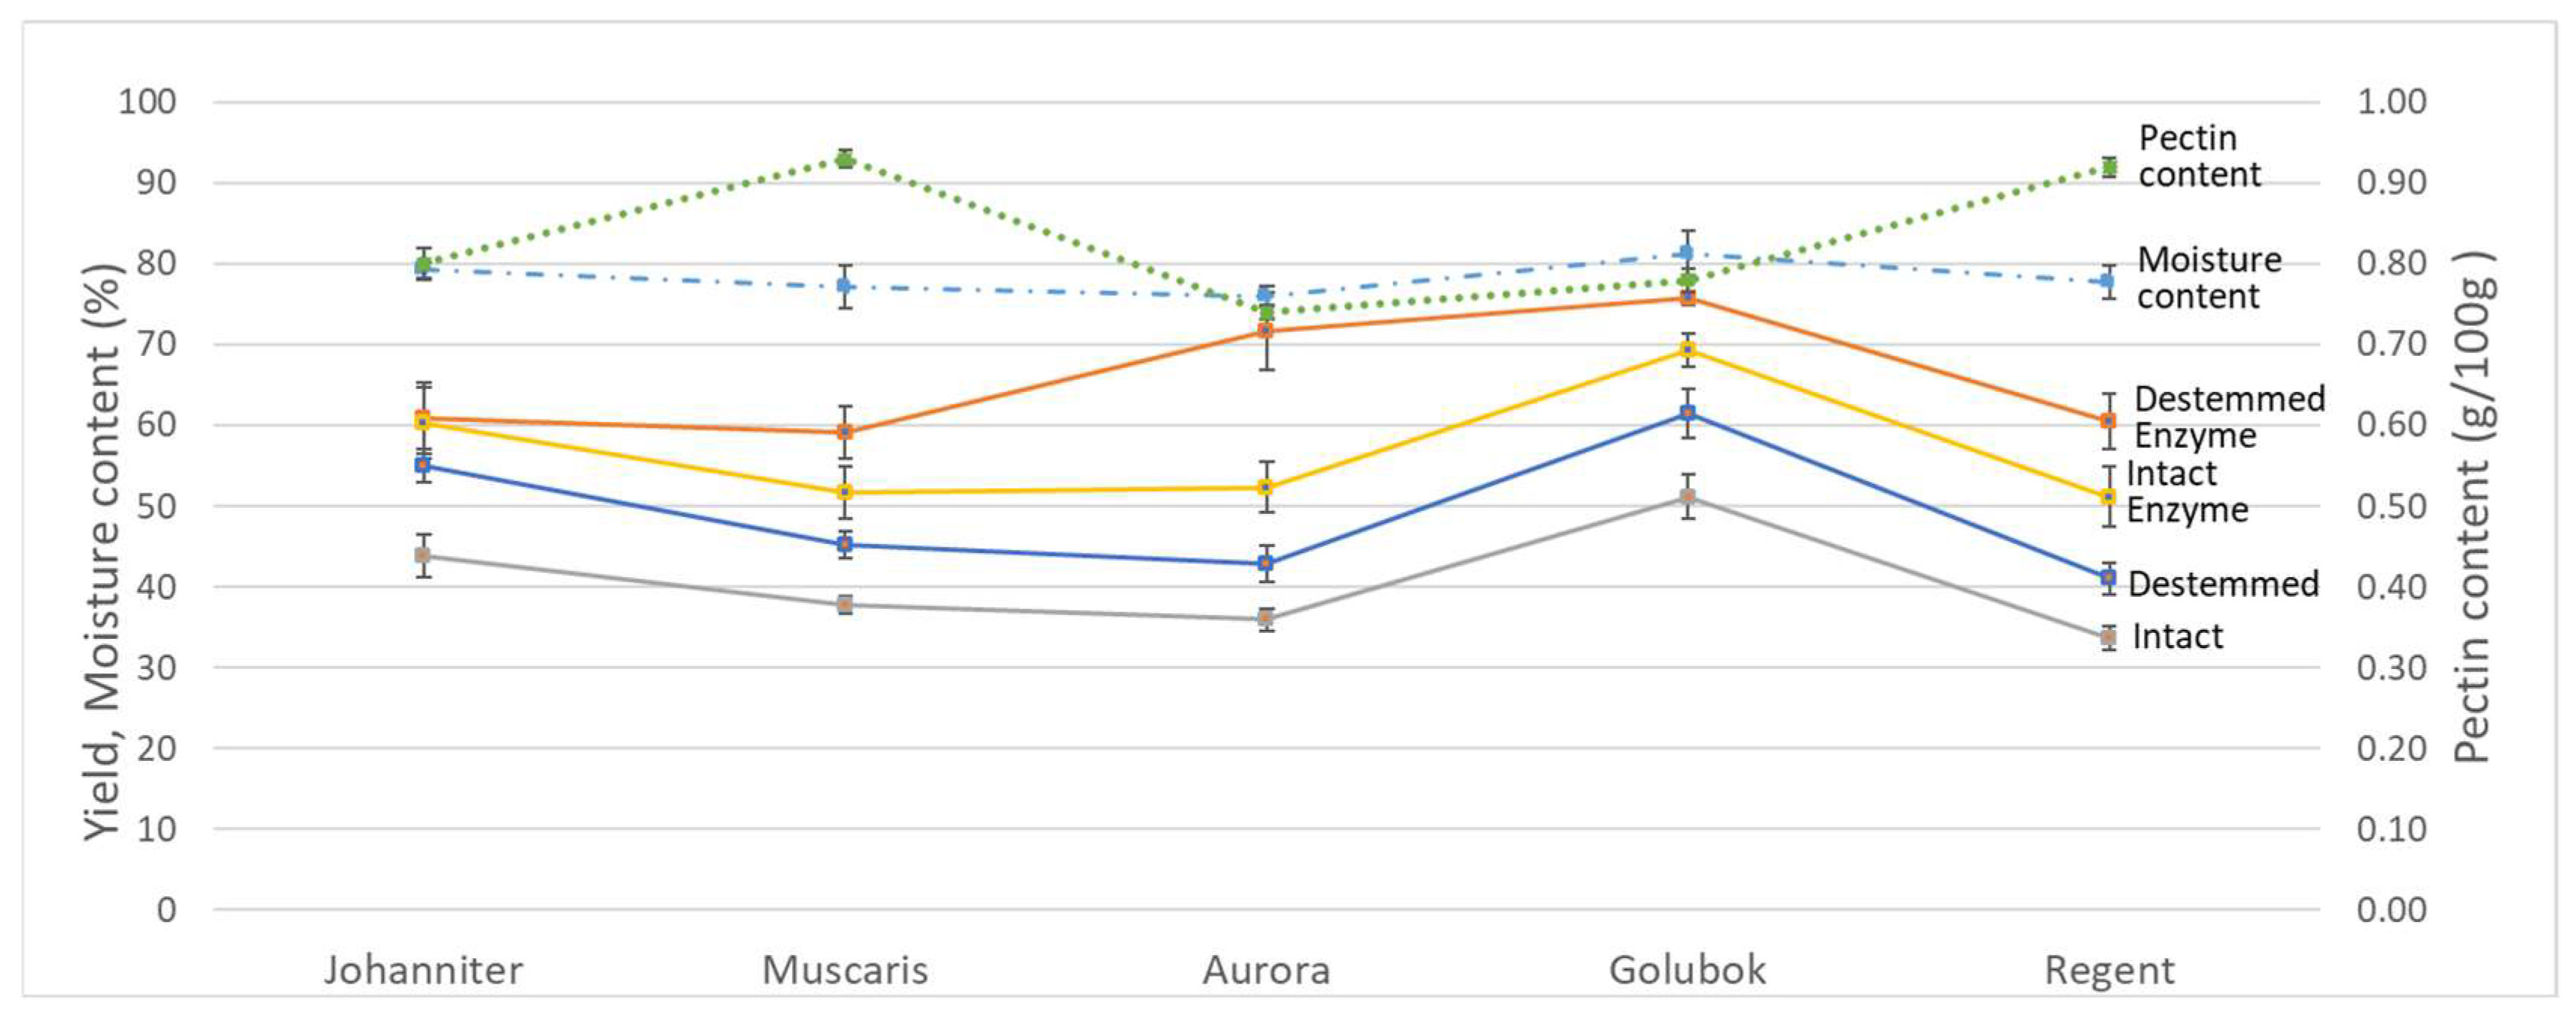
3.1. Yield, Initial Moisture Content and Pectin Content

A statistical analysis indicated that both processing technology and variety have a significant impact on the juice yield. Figure 1 illustrates the yield of each variety under different treatments, along with the initial moisture and pectin content.
The enzyme addition and destemming processes significantly enhanced the processing efficiency. In most cases, both treatments led to an increase in yield of around 20–30% and 10–15%, respectively. The enzymes effectively degraded pectin, facilitating the easy release of juice from the fruit, resulting in a higher yield [24]. As highlighted in a previous study conducted by Guerrini et al. [25], the destemming process reduced the required pressure for juice extraction, particularly when the grapes had already been crushed. Subsequently, it led to the extraction of a greater amount of juice under comparable working pressures.
Despite employing similar procedures, there was a notable disparity in yields among different varieties. This indicated that the characteristics of the raw material had a key influence on the juice yield. The moisture and pectin content of the raw materials were significant factors influencing the juice yield. A correlation analysis revealed a positive correlation between yield and moisture content, while a negative correlation existed between yield and pectin content. Pectin is crucial to determining the firmness of the fruit and the ease of juice release. Consequently, fruits with a higher pectin content may experience a reduction in juice yield [26]. In addition, it was foreseen that the pectin content had a stronger impact on the yield than the moisture content. For instance, although Muscaris and Regent did not have the lowest moisture content compared to other varieties, they produced the least juice, ranging from 40% to 60%, due to their elevated pectin content (>0.9%). Conversely, Aurora and Golubok, characterized by having the lowest pectin content (<0.8%), yielded the highest juice production, reaching up to 70% and 75%, respectively.

3.2. Physicochemical Properties

The basic physicochemical properties of the 20 grape juices are expressed in Table 3. Physicochemical analysis offers valuable insights into the distinct characteristics of grape juice derived from various grape varieties and treatments. Based on a statistical analysis (p < 0.05), notable distinctions were observed between the samples. In general, Aurora exhibited the highest dry mass content, exceeding 21.5% in all treatments. Conversely, Golubok showed the lowest dry mass content, ranging from 18.9% to 19.5%. Similarly, Bendaali et al. [26] reported that the dry mass content of grape juice was around 20%.
Furthermore, the dry mass content values were correlated with the initial moisture content. A higher initial moisture content corresponded to a lower dry mass content in the juice. For instance, Aurora, with the lowest moisture content, showed the highest dry mass, whereas Golubok, with the highest moisture content, exhibited the lowest dry mass.
Moreover, the total soluble solids of the grape juice samples ranged from 17.45 °Brix to 21.14 °Brix. The sample with the lowest total soluble solids was MDE, whereas the highest was AIY. As expected, there was a robust correlation between total soluble solids and dry mass, with an R square value of 0.9551. This observation suggested that the processing methods did not significantly affect the total soluble solid content or dry mass. On the contrary, both of these characteristics were influenced by the initial moisture content of the raw materials.
Additionally, turbidity and viscosity are pivotal characteristics that reflect the quality of grape juice [27]. Among the grape juice samples, GIE exhibited the highest turbidity at 992 NTU, while RD exhibited the lowest at 152 NTU. Additionally, the viscosity of the grape juice samples varied from 1.93 mPa·s (GD sample) to 6.9 mPa·s (GIE sample). Interestingly, in the present study, neither the destemming process nor the addition of enzymes influenced turbidity. However, the viscosity showed a significant positive correlation with the destemming process (R2 = 0.4516). This phenomenon was due to the fact that the destemmed grapes were more susceptible to releasing herbaceous odors and bitter compounds during pressing [28].
The color parameters of the juice are represented in Figure 2. These samples can be categorized into two clusters: the upper cluster comprises white grape varieties, while the lower cluster comprises red grape varieties. The white grape juices showed a significantly high lightness (L), ranging from 40.8 to 73.5, while the L-values of red grape juice ranged from 2.0 to 17.8.
Although the correlation test (p < 0.05) indicated no significant influence of the destemming process and enzyme addition on color changes, it is noteworthy that the grape juices of the Regent variety without enzyme addition (RD and RI) were closely aligned with the white grape juice cluster. This phenomenon can be attributed to the fact that the pulp color of Regent grapes is white. However, the addition of enzymes triggered color extraction from the skin, subsequently elevating the a-value (redness) of the obtained juices, specifically RDE and RIE, which increased from 5.7 to 25.3 and 9.9 to 32.4, respectively.
However, this scenario differed in the case of samples derived from the Golubok variety, which possessed red pulp and dark skin. Surprisingly, the addition of enzymes decreased the a-value of the juices by 12.3 and 14.2 for destemmed (GD) and intact (GI) samples, respectively. This phenomenon can be attributed to the enzymatic breakdown of the skin, resulting in the extraction of the dark color, which subsequently imparted a darker hue to the juice. Simultaneously, this process reduced the b-value (yellowness), producing a distinctive dark purple color in the juice. In essence, the color of the grape juice was influenced by the addition of enzymes; however, the fundamental determinant remained the color of the raw material itself. As highlighted by Guler [29], the color of the juice was mainly shaped by the grape used as the raw material.

3.3. Total Polyphenol and Antioxidant Capacity

The experimental analysis revealed the significant effects of the type of grape variety, the destemming process and enzyme addition on the total polyphenol content and antioxidant capacity of the juices (as indicated in Table 4). Among the samples, the highest total polyphenol content was observed in GI (16.12 g of gallic acid equivalent (GAE)/100 mL juice), while the lowest was found in AD (5.84 g of GAE/100 mL). Additionally, the greatest antioxidant potential, determined by the ABTS assay, was recorded in RIE (20.83 mmol of Trolox equivalent (TxE)/L juice), while the lowest value was observed in AD (4.05 mmol of TxE/L). Similar trends emerged from the FRAP method, with the highest values observed in RIE (5.30 mmol of TxE/L) and RDE (5.42 mmol of TxE/L) and the lowest value in AD (1.29 mmol of TxE/L).
Moreno-Montoro et al. [30] observed a similar result, indicating that red grape varieties generally possess higher polyphenol content and antioxidant capacity than white grape varieties. Furthermore, enzyme addition exhibited the potential to enhance the total polyphenol content and antioxidant activity, while the destemming process appeared to be inversely proportional to the bioactive properties of the juices. As previously mentioned by Anastasiadi et al. [31], bioactive compounds were present in the stem. Consequently, the destemming process could eliminate these bioactive compounds from the stems.
Furthermore, a correlation matrix between the total polyphenol content determined by the Folin–Ciocalteu method and UPLC, along with the antioxidant activities (ABTS and FRAP), is visualized in Figure 3. In particular, significant positive correlations were observed among almost all analyses, except for the relationship between ABTS and TPC-UPLC (0.2223). The highest correlation (0.7569) was observed for TPC-FC and FRAP, which was expected since both methods rely on the same mechanism [32]. Conversely, TPC-UPLC exhibited the lowest correlation among all methods. This divergence could be attributed to TPC-UPLC relying on chromatography, which inherently employs a somewhat distinct mechanism compared to the other analysis methods.

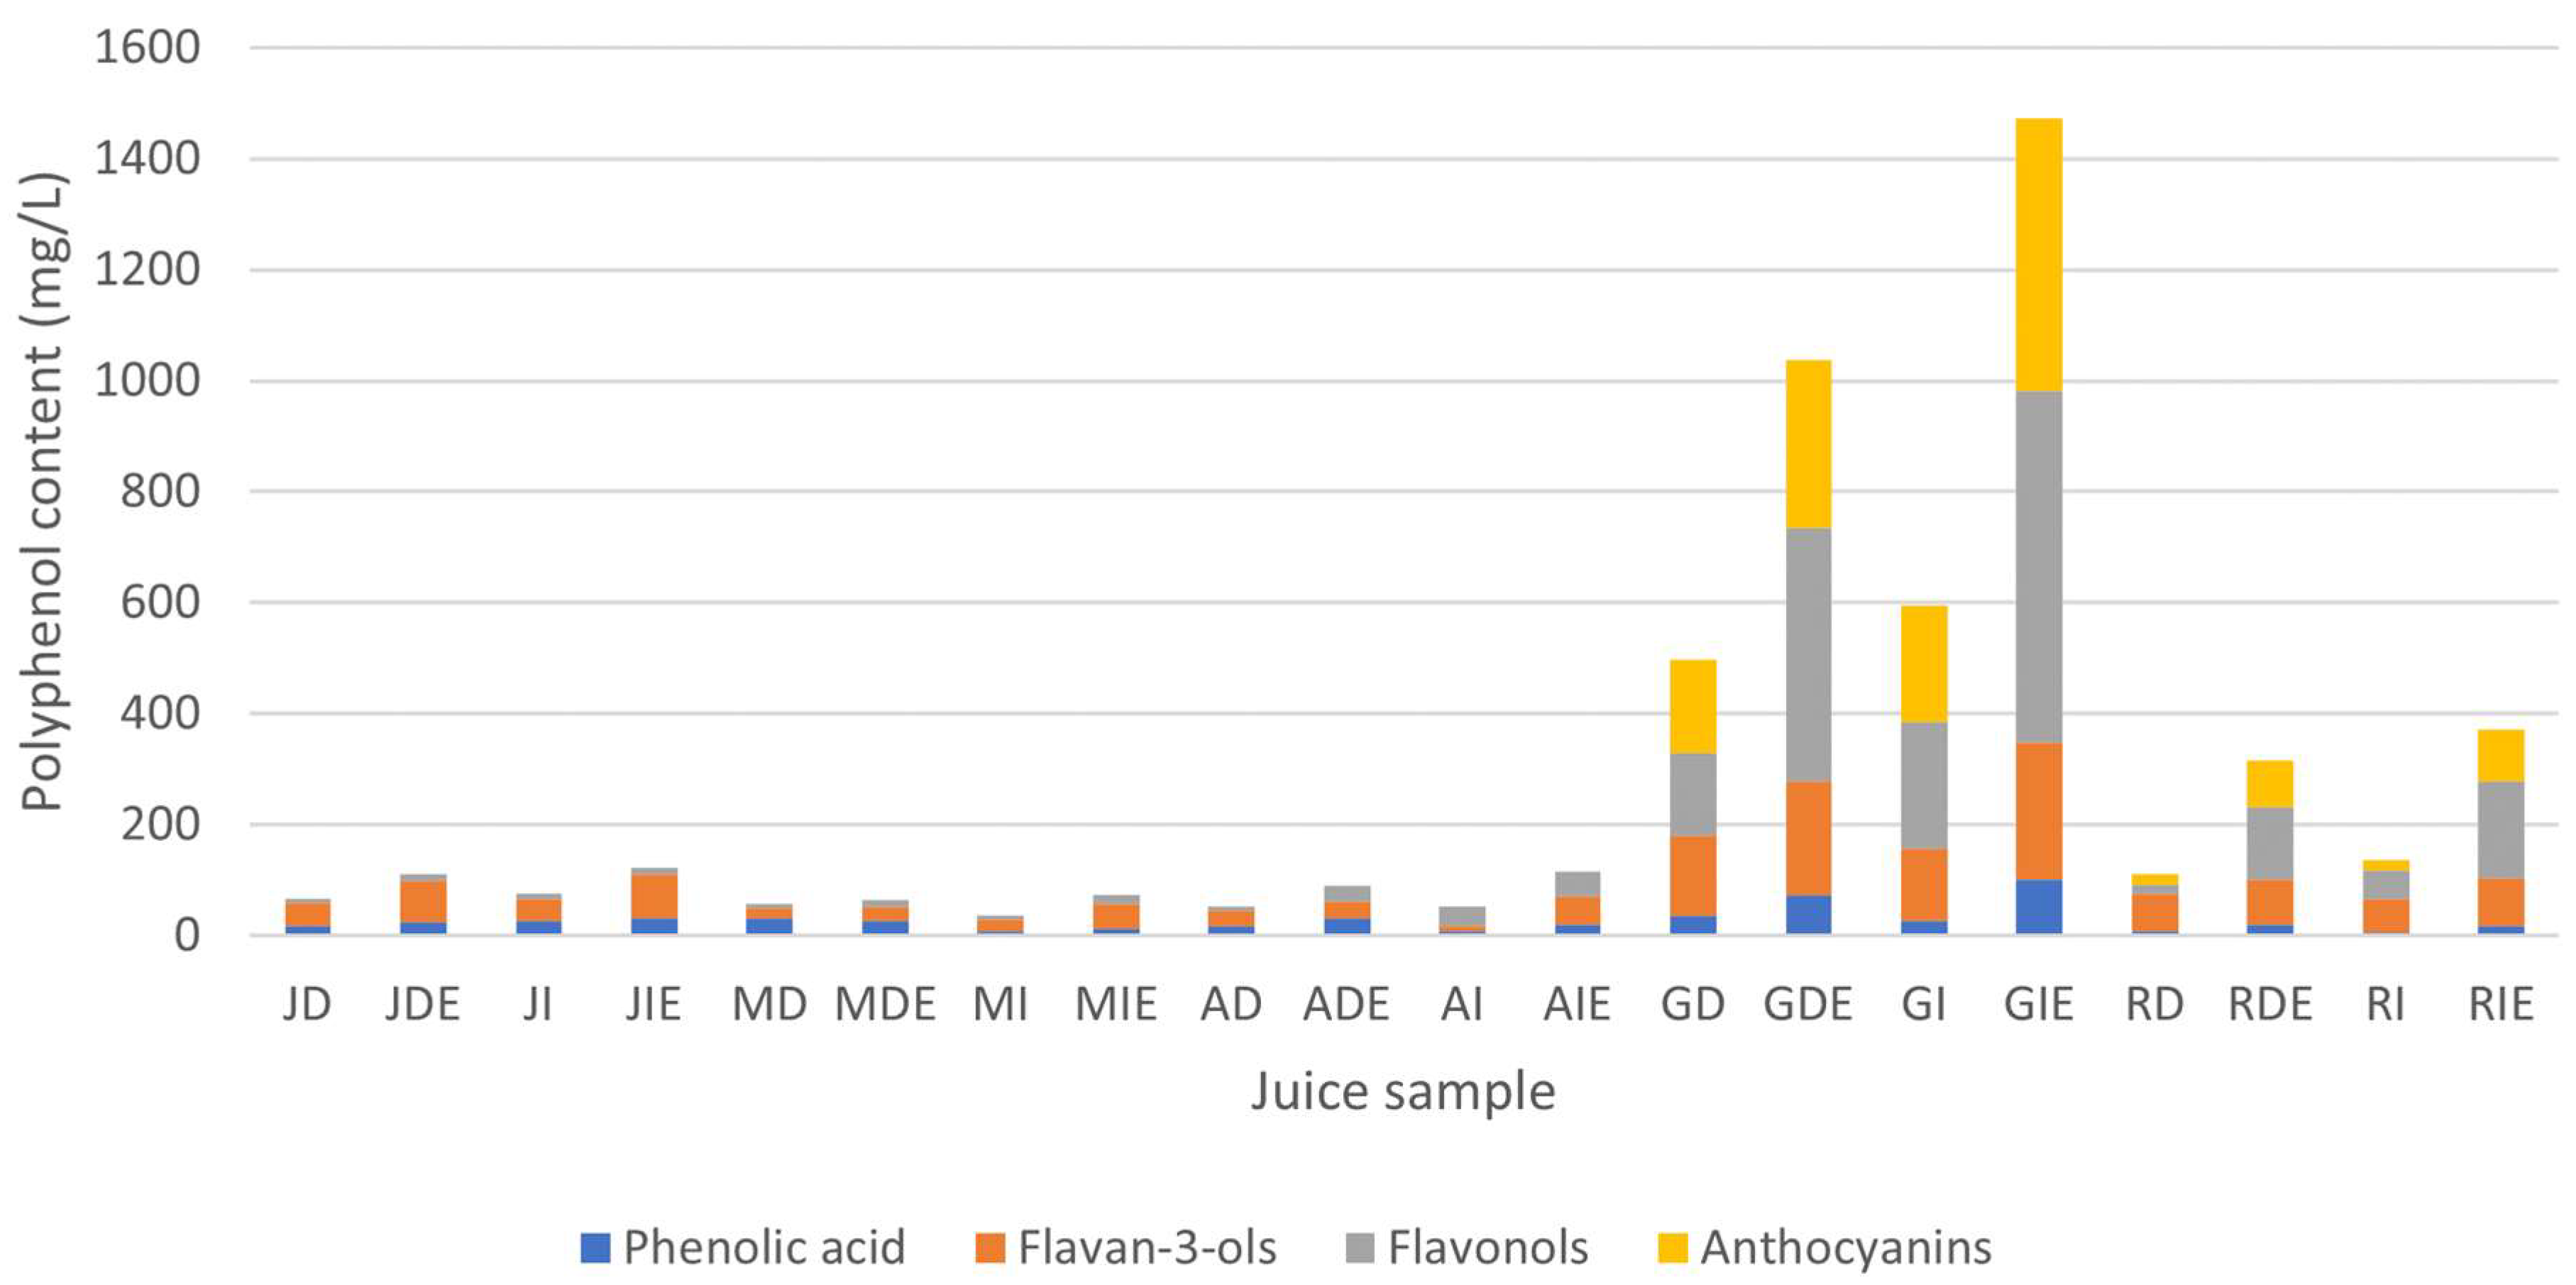
3.4. Individual Polyphenol Content

The polyphenolic compounds in all grape juice samples were identified by UPLC/ESI-Q-TOF-MS analysis; their details are outlined in Table 5. These polyphenols have been provisionally identified, featuring information such as retention time, maximum wavelength, m/z values and MS/MS fragments. Based on the UPLC-MS analysis and the literature references, 25 phenolic compounds have been tentatively identified, encompassing 4 phenolic acids, 11 flavonols, 5 flavan-3-ols and 5 anthocyanins.
Phenolic acids were detected at 320 nm, flavonols at 360 nm, flavan-3-ols at 280 nm and anthocyanins at 520 nm. This comprehensive profile provides valuable information on the polyphenolic composition of grape juices, facilitating a better understanding of their potential health-promoting properties and flavor attributes.
Figure 4 shows the polyphenol profile of the juice samples. Generally, the polyphenol content of red grape juices exceeded that of white grape juices, ranging from 136 mg/L to 1437.57 mg/L and from 36.26 mg/L to 116.35 mg/L, respectively. This observation was consistent with the findings of Moreno-Montoro et al. [30], who reported similar levels of polyphenolic compounds in red and white grape juices.
Enzyme addition enhanced polyphenol extraction, a phenomenon supported by the findings of Dal Magro et al. [14]. Their study demonstrated that the addition of pectinase during grape juice processing increased the polyphenol content due to the improved skin extraction efficiency. The samples were further characterized by their darker color with enzyme addition. Additionally, it should be noted that polyphenol content is generally higher in grape skin compared to the pulp [31]. The destemming process reduced the polyphenol content due to stem removal, which may have a high polyphenol content, as suggested by Anastasiadi et al. [31].
Furthermore, in white grape juice, the predominant polyphenols were flavan-3-ols, followed by phenolic acids. In contrast, red grape juices were richer in flavonols and anthocyanins. This aligned with the report by Toaldo et al. [33], who found no anthocyanins in any of the white grape juices.
The individual polyphenol content of the grape juice samples is presented in Table 6 for anthocyanins, Table 7 for phenolic acids and flavan-3-ols and Table 8 for flavonols. As expected, the anthocyanin content was absent in the white grape juices, whereas it constituted one of the most abundant polyphenol groups in the red grape juices.
The anthocyanin content exhibited significant variations between samples, reflecting its role in imparting color to red grape juice. The anthocyanin profile demonstrated notable diversity across the grape juices. Delphinidin-3-O-(6′-acetyl)-glucoside (D3O6aGlu), Malvidin-3-O-(6″-caffeoyl)-glucoside (M3O6cGlu), Malvidin-3-O-glucoside (M3OGlu), Petunidin-3-O-(6″-p-coumaroyl)-glucoside (P3O6cGlu) and Petunidin-3-O-glucoside (P3OGlu) exhibited contents ranging from 18.12 to 183.01 mg/L, 11.21 to 24.04 mg/L, 2.15 to 2.49 mg/L, 0.56 to 13.10 mg/L and 41.48 to 269.24 mg/L, respectively.
As indicated in Table 6, the anthocyanin content was primarily influenced by grape variety. The Golubok variety showed higher amounts of each anthocyanin in all treatments. Although enzyme addition was shown to increase anthocyanin content, its impact was not as pronounced as the inherent characteristics of the raw materials.
Furthermore, enzyme addition facilitated the extraction of specific anthocyanins that were not present in samples without enzyme addition. In particular, Malvidin-3-O-glucoside (M3OGlu) was only detected in samples with enzyme addition for both grape varieties. Moreover, in the case of the Regent variety, the anthocyanins Petunidin-3-O-(6″-p-coumaroyl)-glucoside (P3O6cGlu) and Petunidin-3-O-glucoside (P3OGlu) were exclusively detected by enzyme-assisted extraction. This underscores the role of enzymes in enhancing the extraction of specific anthocyanins, which further contributes to the diversity and complexity of the polyphenol profile.
The analysis of the grape juice samples revealed the presence of four phenolic acids (as shown in Table 7). The phenolic acid content exhibited statistically significant differences among the samples. Caffeic acid (CafA) was identified in all treatments of the Johanniter and Golubok varieties, with concentrations ranging from 5.24 to 8.89 mg/L. Interestingly, the destemming process and enzyme addition did not influence the concentration of CafA.
Caftaric acid (CftA) was detected in almost all samples except Johanniter, with concentrations ranging from 0.55 mg/L (AI) to 47.93 mg/L (GDE). In the context of white grape juice, the treatments did not affect CftA content. However, enzyme addition contributed to the improvement in CftA concentration in red grape juices. This emphasizes the role of enzyme addition in selectively influencing the content of specific phenolic compounds in specific varieties.
Coutaric acid (CtA) was not detected in the Golubok variety. Among the samples, the highest concentration of CtA was found in MD (29.41 mg/L), while the lowest concentration was observed in RI (3.08 mg/L). Generally, CtA content was higher in white grape juice.
Fertaric acid (FrtA) was identified in all treatments of the Johanniter variety. In contrast, it was only detected in the Aurora and Golubok varieties when enzyme addition was used. Notably, although it was released through enzyme assistance in the Golubok variety, it exhibited the highest concentration among all samples containing FrtA. Specifically, GIE displayed the highest FrtA content (44.80 mg/L) within the Golubok variety, exceeding the concentrations in the highest FrtA-containing samples of Aurora (ADE, 12.97 mg/L) and Johanniter (JDE, 10.26 mg/L). These observations underline the various responses of different grape varieties to enzyme addition and their corresponding impact on phenolic acid composition.
Furthermore, five flavan-3-ols were identified in the grape juice samples: epicatechin (Ep), (−)-epicatechin 3-gallate (Ep3Gll), Procyanidin B2 (PB2), Procyanidin tetramer (PTt) and Procyanidin trimer (PTm). The latter three flavan-3-ols were present in all samples, while epicatechin was absent in Muscaris and Aurora. Similarly, epicatechin 3-gallate was exclusively detected in Muscaris and Golubok.
Regardless of the variety, flavan-3-ol content increased due to enzyme addition. In particular, there were generally no significant changes observed due to the destemming process in most cases. For instance, PTm content in samples JD, JDE, JI and JDI was found to be 3.73 mg/L, 11.27 mg/L, 4.24 mg/L and 13.05 mg/L, respectively. This emphasizes the role of enzyme addition in enhancing the content of flavan-3-ols in various grape varieties and treatment conditions.
In the current study, 11 flavonols were identified in all samples. However, only dHK3Glu, IR3Glu and dHQ35rha were consistently present in all juice samples, with concentrations ranging from 0.14 mg/L (sample RI) to 2.78 mg/L (sample JDE), 0.33 mg/L (sample RI) to 73.17 mg/L (sample GIE) and 0.29 mg/L (sample RI) to 194.75 mg/L (sample GIE), respectively.
In contrast, Q3Glu and Q3Glcr were exclusively detected in Muscaris and Aurora, with mean values of 3.73 mg/L and 1.17 mg/L, respectively. Additionally, K3OGal was observed exclusively in the red grape juice samples, varying from 13.78 mg/L (sample RD) to 142.75 mg/L (sample GDE). Meanwhile, K3OGlu appeared to be derived from the stem, with only samples MI, MIE, AI, AIE, GI and GIE containing it. Similarly, only samples without the destemming process contained Q3rha (MI, MIE, GI, GIE, RI and RIE), with concentrations ranging from 0.43 mg/L to 61.56 mg/L. Similarly, Q3Gal was found exclusively in samples with enzyme addition (MDE, MIE, GDE, GIE, RDE and RIE). This comprehensive analysis underscores the intricate variations in flavonol composition based on grape variety, treatment, and enzyme addition.
As these findings elucidate, the polyphenol profile within grape juices is notably influenced by grape variety and the processing methods used. This indicates that processing can enhance the extraction of polyphenols from existing compounds but does not generate entirely new polyphenols. The intricate relationship between variety, processing, and the resulting polyphenol content is a crucial aspect to consider in understanding the composition and potential health benefits of grape juice.

4. Conclusions

The addition of enzymes and the destemming process potentially improved some quality attributes of grape juice. However, at the same time, they decreased some other attributes. Based on the results obtained from the present study, conclusions can be drawn as follows:
(1)
Regardless of the variety, enzyme addition and the destemming process improved the yield by 20–30% and 10–15%, respectively.
(2)
The addition of enzymes increased polyphenol content but, at the same time, altered the color of the juice. Meanwhile, the destemming process eliminated the potential health benefits present in the stems.
(3)
Although similar treatments were applied, the total polyphenol content and antioxidant capacity of red grape juice were higher than those of white grape juice. This indicates that the characteristics of each variety play an important role in determining the health properties of the juice.
(4)
A total of 25 polyphenolic compounds were identified in the grape juices. However, the polyphenolic profile was dependent on variety and processing.
(5)
In summary, this study contributes significantly to understanding how specific grape varieties and processing techniques collectively influence the quality of grape juice. These insights can potentially guide and advance the production of grape juice, leading to improved quality and health-enhancing benefits, especially relevant in challenging climatic conditions similar to those encountered in Poland.

Author Contributions

Conceptualization, A.N.-O., M.C. and M.A.Z.; methodology, J.K.-O. and A.N.-O.; software, J.K.-O. and A.N.-O.; validation, J.K.-O. and A.N.-O.; formal analysis, M.A.Z. and J.K.-O.; investigation, A.N.-O., M.C. and M.A.Z.; resources, A.N.-O. and M.C.; data curation, A.N.-O. and M.C.; writing—original draft preparation, M.A.Z.; writing—review and editing, A.N.-O., M.C. and M.A.Z.; visualization, M.A.Z.; supervision, A.N.-O. and M.C.; project administration, A.N.-O.; funding acquisition, A.N.-O. and M.C. All authors have read and agreed to the published version of the manuscript.

Funding

The APC is financed by Wrocław University of Environmental and Life Sciences in the publication.

Data Availability Statement

Data is contained within the article.

Conflicts of Interest

The authors declare no conflict of interest.

References

  1. de Freitas Laiber Pascoal, G.; de Almeida Sousa Cruz, M.A.; Pimentel de Abreu, J.; Santos, M.C.B.; Bernardes Fanaro, G.; Júnior, M.R.M.; Freitas Silva, O.; Moreira, R.F.A.; Cameron, L.C.; Simões Larraz Ferreira, M.; et al. Evaluation of the Antioxidant Capacity, Volatile Composition and Phenolic Content of Hybrid Vitis vinifera L. Varieties Sweet Sapphire and Sweet Surprise. Food Chem. 2022, 366, 130644. [Google Scholar] [CrossRef]
  2. Czech, A.; Malik, A.; Pitucha, I.; Woznica, A. Comparison of Bioactive Compound Contents in Red Wines from Different European Countries. Zywn. Nauk. Technol. Jakosc 2009, 4, 142–148. [Google Scholar]
  3. Samoticha, J.; Wojdyło, A.; Golis, T. Phenolic Composition, Physicochemical Properties and Antioxidant Activity of Interspecific Hybrids of Grapes Growing in Poland. Food Chem. 2017, 215, 263–273. [Google Scholar] [CrossRef]
  4. Council Regulation (EC) 2165/2005 of 20 December 2005 Amending Regulation (EC) No 1493/1999 on the Common Organisation of the Market in Wine. 2005. Available online: https://eur-lex.europa.eu/legal-content/EN/ALL/?uri=CELEX%3A32005R2165 (accessed on 3 May 2023).
  5. Jackson, D.; Schuster, D. The Production of Grapes & Wine in Cool Climates; Dunmore Press Ltd.: Auckland, New Zealand, 2001. [Google Scholar]
  6. Czaplicka, M.; Parypa, K.; Szewczuk, A.; Gudarowska, E.; Rowińska, M.; Zubaidi, M.A.; Nawirska-Olszańska, A. Assessment of Selected Parameters for Determining the Internal Quality of White Grape Cultivars Grown in Cold Climates. Appl. Sci. 2022, 12, 5534. [Google Scholar] [CrossRef]
  7. Leis, D.; Renner, W.; Leitner, E. Characterisation of Wines Produced from Fungus Resistant Grape Varieties. In BT-Flavour Science; Verlag der Technischen Universität Graz: Graz, Austria, 2018; pp. 511–514. [Google Scholar]
  8. Porro, D.; Wolf, M.; Pedò, S. Evaluation of Mechanical Properties of Berries on Resistant or Tolerant Varieties of Grapevine. Bio Web Conf. 2019, 13, 01005. [Google Scholar] [CrossRef]
  9. Socha, R.; Gałkowska, D.; Robak, J.; Fortuna, T.; Buksa, K. Characterization of Polish Wines Produced from the Multispecies Hybrid and Vitis vinifera L. Grapes. Int. J. Food Prop. 2015, 18, 699–713. [Google Scholar] [CrossRef]
  10. Iora, S.R.F.; Maciel, G.M.; Zielinski, A.A.F.; da Silva, M.V.; Pontes, P.V.d.A.; Haminiuk, C.W.I.; Granato, D. Evaluation of the Bioactive Compounds and the Antioxidant Capacity of Grape Pomace. Int. J. Food Sci. Technol. 2015, 50, 62–69. [Google Scholar] [CrossRef]
  11. Kapusta, I.; Cebulak, T.; Oszmiański, J. Characterization of Polish Wines Produced from the Interspecific Hybrid Grapes Grown in South-East Poland. Eur. Food Res. Technol. 2018, 244, 441–455. [Google Scholar] [CrossRef]
  12. Kowalczyk, B.; Bieniasz, M.; Kostecka-Gugała, A. The Content of Selected Bioactive Compounds in Wines Produced from Dehydrated Grapes of the Hybrid Variety ‘Hibernal’as a Factor Determining the Method of Producing Straw Wines. Foods 2022, 11, 1027. [Google Scholar] [CrossRef]
  13. Stój, A.; Kapusta, I.; Domagała, D. Classification of Red Wines Produced from Zweigelt and Rondo Grape Varieties Based on the Analysis of Phenolic Compounds by UPLC-PDA-MS/MS. Molecules 2020, 25, 1342. [Google Scholar] [CrossRef]
  14. Dal Magro, L.; Goetze, D.; Ribeiro, C.T.; Paludo, N.; Rodrigues, E.; Hertz, P.F.; Klein, M.P.; Rodrigues, R.C. Identification of Bioactive Compounds from Vitis labrusca L. Variety Concord Grape Juice Treated with Commercial Enzymes: Improved Yield and Quality Parameters. Food Bioprocess Technol. 2016, 9, 365–377. [Google Scholar] [CrossRef]
  15. Souquet, J.; Moutounet, M. Phenolic Composition of Grape Stems. J. Agric. Food Chem. 2000, 48, 1076–1080. [Google Scholar] [CrossRef]
  16. PN-90/A-75101/04; Fruit and Vegetable Products. Preparation of Samples and Test Methods. Determination of Total Acidity. Polski Komitet Normalizacyjny: Warsaw, Poland; p. 1990.
  17. Pijanowski, E.; Mrożewski, S.; Horubała, A.; Jarczyk, A. Technologia Produktów Owocowych i Warzywnych; Państwowe Wydawnictwa Rolnicze i Leśne: Warsaw, Poland, 1973; Volume 1. [Google Scholar]
  18. Chettri, S.; Sharma, N.; Mohite, A.M. Utilization of Lima Bean Starch as an Edible Coating Base Material for Sapota Fruit Shelf-Life Enhancement. J. Agric. Food Res. 2023, 12, 100615. [Google Scholar] [CrossRef]
  19. Kolniak-Ostek, J. Chemical Composition and Antioxidant Capacity of Different Anatomical Parts of Pear (Pyrus communis L.). Food Chem. 2016, 203, 491–497. [Google Scholar] [CrossRef]
  20. Re, R.; Pellegrini, N.; Proteggente, A.; Pannala, A.; Yang, M.; Rice-Evans, C. Antioxidant Activity Applying an Improved ABTS Radical Cation Decolorization Assay. Free Radic. Biol. Med. 1999, 26, 1231–1237. [Google Scholar] [CrossRef]
  21. Benzie, I.F.F.; Strain, J.J. The Ferric Reducing Ability of Plasma (FRAP) as a Measure of “Antioxidant Power”: The FRAP Assay. Anal. Biochem. 1996, 239, 70–76. [Google Scholar] [CrossRef]
  22. Nawirska-Olszańska, A.; Pasławska, M.; Stępień, B.; Oziembłowski, M.; Sala, K.; Smorowska, A. Effect of Vacuum Impregnation with Apple-Pear Juice on Content of Bioactive Compounds and Antioxidant Activity of Dried Chokeberry Fruit. Foods 2020, 9, 108. [Google Scholar] [CrossRef]
  23. Kolniak-Ostek, J.; Oszmiański, J. Characterization of Phenolic Compounds in Different Anatomical Pear (Pyrus communis L.) Parts by Ultra-Performance Liquid Chromatography Photodiode Detector-Quadrupole/Time of Flight-Mass Spectrometry (UPLC-PDA-Q/TOF-MS). Int. J. Mass Spectrom. 2015, 392, 154–163. [Google Scholar] [CrossRef]
  24. Ramadan, M.F. Enzymes in Fruit Juice Processing; Elsevier Inc.: Amsterdam, The Netherlands, 2018; ISBN 9780128132807. [Google Scholar]
  25. Guerrini, L.; Corti, F.; Angeloni, G.; Masella, P.; Spadi, A.; Calamai, L.; Parenti, A. The Effects of Destemming/Crushing and Pressing Conditions in Rosé Wine Production. Aust. J. Grape Wine Res. 2022, 2022, 1–14. [Google Scholar] [CrossRef]
  26. Bendaali, Y.; Vaquero, C.; González, C.; Morata, A. Elaboration of an Organic Beverage Based on Grape Juice with Positive Nutritional Properties. Food Sci. Nutr. 2022, 10, 1768–1779. [Google Scholar] [CrossRef]
  27. Oszmiański, J.; Wojdyło, A.; Kolniak, J. Effect of Pectinase Treatment on Extraction of Antioxidant Phenols from Pomace, for the Production of Puree-Enriched Cloudy Apple Juices. Food Chem. 2011, 127, 623–631. [Google Scholar] [CrossRef]
  28. Ribéreau-Gayon, P.; Dubourdieu, D.; Donèche, B.; Lonvaud, A. Handbook of Enology, Volume 1: The Microbiology of Wine and Vinifications; John Wiley & Sons: Hoboken, NJ, USA, 2006; Volume 1, ISBN 0470010355. [Google Scholar]
  29. Guler, A. Effects of Different Maceration Techniques on the Colour, Polyphenols and Antioxidant Capacity of Grape Juice. Food Chem. 2023, 404, 134603. [Google Scholar] [CrossRef] [PubMed]
  30. Moreno-Montoro, M.; Olalla-Herrera, M.; Gimenez-Martinez, R.; Navarro-Alarcon, M.; Rufián-Henares, J.A. Phenolic Compounds and Antioxidant Activity of Spanish Commercial Grape Juices. J. Food Compos. Anal. 2015, 38, 19–26. [Google Scholar] [CrossRef]
  31. Anastasiadi, M.; Pratsinis, H.; Kletsas, D.; Skaltsounis, A.L.; Haroutounian, S.A. Grape Stem Extracts: Polyphenolic Content and Assessment of Their in Vitro Antioxidant Properties. LWT 2012, 48, 316–322. [Google Scholar] [CrossRef]
  32. Rumpf, J.; Burger, R.; Schulze, M. Statistical Evaluation of DPPH, ABTS, FRAP, and Folin-Ciocalteu Assays to Assess the Antioxidant Capacity of Lignins. Int. J. Biol. Macromol. 2023, 233, 123470. [Google Scholar] [CrossRef] [PubMed]
  33. Toaldo, I.M.; Cruz, F.A.; Alves, T.D.L.; De Gois, J.S.; Borges, D.L.G.; Cunha, H.P.; Da Silva, E.L.; Bordignon-Luiz, M.T. Bioactive Potential of Vitis labrusca L. Grape Juices from the Southern Region of Brazil: Phenolic and Elemental Composition and Effect on Lipid Peroxidation in Healthy Subjects. Food Chem. 2015, 173, 527–535. [Google Scholar] [CrossRef]
Figure 1. Yield, moisture and pectin content of the grape juice samples. The error bars represent the standard deviation.
Foods 12 03475 g001
Figure 2. Cluster analysis (a) and 3D plot color parameters (b) of grape juice samples.
Foods 12 03475 g002
Figure 3. The correlation matrices of the four assays (TPC-FC, ABTS, FRAP and TPC-UPLC), colored green, indicate a significant correlation at p < 0.05.
Foods 12 03475 g003
Figure 4. Total polyphenol content of grape juice samples according to the phenolic group.
Foods 12 03475 g004
Table 1. Characteristics of the hybrid cultivars used in this study.
CultivarsParentsSkin ColorPulp Color
JohanniterRiesling and Seyve-Villard × Ruländer × GutedelYellowish greenWhite
MuscarisMuskateller × SolarisGreenWhite
AuroraSeibel 788 × Seibel 29GreenWhite
GolubokSevernyy × pollen from different varieties: 40 Let Okyabrya, Odesskiy Ranniy and No. 1-17-54 (Alicante Bouschet and Cabernet Sauvignon)DarkDark
RegentDiana × ChambourcinDarkWhite
Table 2. Grape juice samples.
SampleJDJDEJIJIEMDMDEMIMIEADADEAIAIEGDGDEGIGIERDRDERIRIE
VarietyJohanniterMuscarisAuroraGoIubokRegent
Grape TypeWhiteWhiteWhiteRedRed
DestemmedYesYesNoNoYesYesNoNoYesYesNoNoYesYesNoNoYesYesNoNo
EnzymeNoYesNoYesNoYesNoYesNoYesNoYesNoYesNoYesNoYesNoYes
Table 3. Physicochemical properties of grape juices .
SampleDry MassTA TSS TurbidityViscosity
JD19.63 ± 0.01 efg0.73 ± 0.05 a18.92 ± 0.32 c297 ± 31 abcd5.95 ± 0.44 gh
JDE19.22 ± 0.15 cdef0.87 ± 0.07 a18.60 ± 0.25 bc366 ± 49 cd3.90 ± 0.31 cde
JI19.71 ± 0.00 fg0.65 ± 0.05 a19.05 ± 0.30 c197 ± 14 ab5.24 ± 0.36 efg
JIE21.32 ± 0.06 h0.79 ± 0.07 a20.21 ± 0.33 d214 ± 12 abc3.11 ± 0.28 abcd
MD19.10 ± 0.02 cde0.58 ± 0.04 a18.53 ± 0.22 bc179 ± 11 ab5.97 ± 0.54 gh
MDE17.86 ± 0.08 a0.75 ± 0.07 a17.45 ± 0.21 a233 ± 28 abcd4.21 ± 0.21 de
MI19.71 ± 0.24 fg0.53 ± 0.04 a19.07 ± 0.28 c190 ± 15 ab5.65 ± 0.39 gh
MIE19.37 ± 0.05 cdef0.69 ± 0.05 a18.74 ± 0.30 c231 ± 16 abcd3.04 ± 0.24 abcd
AD21.58 ± 0.14 hi0.63 ± 0.05 a20.82 ± 0.33 de855 ± 63 f6.30 ± 1.10 gh
ADE21.18 ± 0.15 h0.63 ± 0.05 a20.35 ± 0.30 de658 ± 73 e3.34 ± 0.15 bcd
AI21.47 ± 0.13 h0.49 ± 0.04 a20.78 ± 0.28 de317 ± 28 bcd1.96 ± 0.22 ab
AIE21.95 ± 0.01 i0.63 ± 0.05 a21.14 ± 0.30 e393 ± 30 g3.96 ± 0.26 cde
GD19.03 ± 0.04 cd0.73 ± 0.07 a18.72 ± 0.24 bc905 ± 85 f1.93 ± 0.30 a
GDE18.92 ± 0.05 bc0.69 ± 0.06 a18.74 ± 0.30 c915 ± 73 f6.90 ± 0.47 i
GI18.92 ± 0.00 bc0.71 ± 0.05 a18.48 ± 0.26 bc874 ± 68 f2.97 ± 0.44 abcd
GIE19.46 ± 0.02 cdef0.65 ± 0.05 a19.09 ± 0.27 c992 ± 11 f4.32 ± 0.10 def
RD18.47 ± 0.10 b0.69 ± 0.06 a17.83 ± 0.22 ab152 ± 16 a5.83 ± 0.92 gh
RDE19.50 ± 0.23 def0.67 ± 0.05 a19.00 ± 0.26 c896 ± 89 f5.10 ± 0.41 efg
RI20.08 ± 0.37 g0.71 ± 0.06 a19.15 ± 0.30 c221 ± 33 abc2.75 ± 0.22 abc
RIE19.24 ± 0.07 cdef0.71 ± 0.07 a18.68 ± 0.27 bc865 ± 11 f2.55 ± 0.35 abc
value ± SD are means of three repetitions; mean values followed by different letters are statistically different at p < 0.05 according to the Tukey post hoc test. Dry mass (%); TA (titratable acidity, g of tartaric acid/100 mL); TSS (total soluble solid, Brix); turbidity (NTU); viscosity (mPa·s).
Table 4. Physicochemical properties of the grape juices .
SampleTPC
(g GAE/100 mL)
TEAC ABTS
(mmol TxE/L)
FRAP
(mmol TxE/L)
JD13.17 ± 1.04 efg12.30 ± 1.52 ef4.63 ± 0.33 defg
JDE11.38 ± 0.98 cdef10.08 ± 1.26 cde2.59 ± 0.33 bc
JI15.32 ± 0.95 g17.42 ± 1.30 hi4.95 ± 0.39 efg
JIE11.53 ± 0.75 cdef10.76 ± 1.28 def3.83 ± 0.53 cdef
MD6.95 ± 0.48 ab6.18 ± 0.68 abc2.57 ± 0.32 bc
MDE8.67 ± 1.17 abcd5.47 ± 0.40 ab3.79 ± 0.27 cde
MI8.15 ± 0.85 abc5.72 ± 0.51 ab2.45 ± 0.17 ab
MIE6.68 ± 0.44 ab8.08 ± 1.10 bcd2.40 ± 0.15 ab
AD5.84 ± 0.61 a4.05 ± 0.30 a1.29 ± 0.09 a
ADE12.93 ± 1.88 efg11.12 ± 0.63 def3.52 ± 0.25 cde
AI9.24 ± 1.29 abcd12.73 ± 0.89 efg4.11 ± 0.28 defg
AIE12.81 ± 1.07 efg11.18 ± 1.43 def4.31 ± 0.37 defg
GD11.70 ± 1.45 def14.12 ± 1.93 fgh4.79 ± 0.65 defg
GDE15.33 ± 1.02 g12.89 ± 1.82 efg4.82 ± 0.59 efg
GI16.12 ± 1.00 g12.72 ± 1.65 eg4.26 ± 0.37 defg
GIE14.47 ± 1.66 fg11.38 ± 1.19 def5.08 ± 0.32 fgh
RD10.15 ± 1.30 bcde12.80 ± 1.19 efg3.82 ± 0.34 cdef
RDE13.21 ± 0.92 efg12.21 ± 0.88 ef5.42 ± 0.39 h
RI13.64 ± 1.63 efg16.43 ± 2.37 gh4.95 ± 0.58 efg
RIE13.11 ± 1.05 efg20.84 ± 1.45 i5.30 ± 0.80 g
value ± SD are means of three repetitions; mean values followed by different letters are statistically different at p < 0.05 according to the Tukey post hoc test.
Table 5. Identification of polyphenols in grape juice samples by UPLC/ESI-Q-TOF-MS.
Tentative IdentificationRt (min)UV Max (nm)[M-H]- (m/z)MS/MS (m/z)Group
Caffeic acid0.94327/241179.0506-Phenolic acid
Caftaric acid3.26327/241311.0339179.0277Phenolic acid
Coutaric acid4.15326/218295.0368163.0318Phenolic acid
Fertaric acid4.62326/241325.0469193.0431/149.0014Phenolic acid
Kaempferol-3-O-rutinoside2.99343/240593.1319285.0628Flavonols
Quercetin-3-rutinoside6.66350/251609.1573301.0521Flavonols
Kaempferol 3-O-galactoside6.79351/255447.2055285.1445Flavonols
Quercetin-3-glucuronide6.90350/241477.065301.0311Flavonols
Quercetin-3-galactoside7.04352/255463.0869301.0279Flavonols
Quercetin-3-glucoside7.35348/252463.2199301.0455Flavonols
Quercetin-3-rhamnoside7.64342/241447.0904301.0325Flavonols
Kaempferol-3-O-glucoside7.71347/241447.0914285.0387Flavonols
Isorhamnetin 3-glucoside8.12352477.1172315.1055Flavonols
Dihydroquercetin-3,5-rhamnoside8.32346/242449.1120303.0239Flavonols
Dihydrokaempferol-3-glucoside8.75346/242285.0774257.2076Flavonols
Procyanidin trimer2.90278865.2130575.1028/289.1090Flavan-3-ols
Procyanidin B24.00279577.1296289.0646Flavan-3-ols
Procyanidin tetramer4.562801153.2663865.2170/577.1296/289.0458Flavan-3-ols
(−)-epicatechin5.21280289.0646-Flavan-3-ols
(−)-epicatechin 3-gallate5.93280441.1541289.0646Flavan-3-ols
Petunidyn-3-O-glucoside4.00525/245479.0999317.0625Anthocyanins
Malvidyn-3-O-glucoside4.48521/277493.1141331.0829Anthocyanins
Delphinidyn-3-O-(6′-acetyl)-glucoside5.17525/277507.1306303.0517Anthocyanins
Petunidyn-3-O-(6″-p-coumaroyl)-glucoside7.83529/280625.1394317.0465Anthocyanins
Malvidyn-3-O-(6″-caffeoyl)-glucoside8.40531/283655.1709331.0641Anthocyanins
Table 6. Anthocyanin content of the grape juice samples (mg/L of juice) .
SampleAnthocyanins
D3O6aGluM3O6cGluM3OGluP3O6cGluP3OGlu
GD50.52 ± 6.26 andnd6.36 ± 0.81 b112.00 ± 0.77 b
GDE94.75 ± 7.55 dnd2.49 ± 0.20 a13.24 ± 2.19 c191.20 ± 10.69 c
GI69.46 ± 5.39 cndnd8.66 ± 0.54 b131.22 ± 11.54 b
GIE183.01 ± 11.78 e24.04 ± 1.70 b2.47 ± 0.37 a13.10 ± 0.96 c269.24 ± 16.84 d
RD18.23 ± 2.87 bndndndnd
RDE37.64 ± 4.18 and2.15 ± 0.30 a1.19 ± 0.07 a41.48 ± 4.92 a
RI18.12 ± 3.11 bndndndnd
RIE36.99 ± 5.42 a11.21 ± 0.24 a2.30 ± 0.33 a0.56 ± 0.05 a43.40 ± 6.06 a
value ± SD are means of three repetitions; mean values followed by different letters are statistically different at p < 0.05 according to the Tukey post hoc test; Abbreviations: D3O6aGlu—Delphinidyn-3-O-(6′-acetyl)-glucoside; M3O6cGlu—Malvidyn-3-O-(6″-caffeoyl)-glucoside; M3OGlu—Malvidyn-3-O-glucoside; P3O6cGlu—Petunidyn-3-O-(6″-p-coumaroyl)-glucoside; P3OGlu—Petunidyn-3-O-glucoside; nd—not detected.
Table 7. Phenolic acid and flavan-3-ol content of the grape juice samples (mg/L of juice) .
SamplePhenolic AcidsFlavan-3-ols
CafACftACotAFrtAEpEp3GllPB2PTtPTm
JD5.24 ± 0.05 bnd7.93 ± 0.76 b3.71 ± 0.29 c14.87 ± 2.17 abnd4.43 ± 0.64 ab19.05 ± 1.38 c3.73 ± 0.08 ab
JDE6.80 ± 0.26 cdnd8.02 ± 1.36 b10.32 ± 0.93 a10.05 ± 0.38 and10.19 ± 1.48 bc42.97 ± 5.97 d11.27 ± 0.21 bcd
JI6.00 ± 0.82 bcnd16.83 ± 0.13 c3.78 ± 0.28 c21.10 ± 1.80 bcnd3.85 ± 0.34 ab11.05 ± 1.40 abc4.24 ± 0.57 abc
JIE5.83 ± 0.35 bcnd15.29 ± 1.21 c10.26 ± 1.60 a11.71 ± 0.86 and9.26 ± 0.86 abc44.44 ± 7.16 d13.05 ± 1.16 cde
MDnd1.12 ± 0.09 a29.41 ± 1.57 dndnd0.80 ± 0.07 a12.83 ± 0.19 cde3.95 ± 0.16 a3.17 ± 0.05 ab
MDEnd1.95 ± 0.1 a25.68 ± 3.82 dndnd1.27 ± 0.1 a12.93 ± 0.90 dce4.54 ± 0.29 a5.22 ± 0.42 ab
MInd0.92 ± 0.01 a7.81 ± 0.57 bndnd0.53 ± 0.06 a14.41 ± 1.31 cde3.25 ± 0.21 a3.26 ± 0.34 ab
MIEnd1.35 ± 0.12 a12.23 ± 1.34 bcndnd0.97 ± 0.01 a29.54 ± 2.57 i4.79 ± 0.50 a8.41 ± 0.54 abc
ADnd0.94 ± 0.02 a17.71 ± 1.82 cndndnd20.37 ± 1.51 fgh2.84 ± 0.21 a3.96 ± 0.37 ab
ADEnd0.81 ± 0.13 a16.6 ± 2.55 c12.97 ± 2.25 abnd1.08 ± 0.07 a17.74 ± 1.1 efg7.14 ± 0.59 ab5.09 ± 0.70 abc
AInd0.55 ± 0.03 a7.57 ± 0.12 bndndnd3.02 ± 0.23 a4.84 ± 0.34 a1.92 ± 0.10 a
AIEnd0.89 ± 0.06 a6.42 ± 0.50 ab12.83 ± 1.07 ab28.71 ± 2.82 cdnd8.62 ± 1.07 abc7.78 ± 1.17 abc5.46 ± 0.4 abc
GD8.27 ± 0.55 a28.6 ± 2.77 dndnd31.11 ± 3.38 d39.36 ± 3.47 b25.58 ± 4.16 hi12.62 ± 1.09 abc35.44 ± 3.23 f
GDE8.89 ± 0.56 a47.93 ± 2.8 end16.64 ± 1.95 b13.57 ± 2.00 ab40.29 ± 6.80 b15.11 ± 0.32 def70.13 ± 6.45 e66.48 ± 2.89 g
GI7.72 ± 0.61 ad18.05 ± 1.4 cndnd28.90 ± 5.21 cd31.51 ± 2.10 b26.03 ± 3.92 hi13.06 ± 1.72 abc31.28 ± 2.43 f
GIE8.81 ± 0.50 a46.69 ± 3.17 end44.8 ± 3.44 d14.11 ± 2.24 ab39.25 ± 6.73 b12.93 ± 1.98 abc82.78 ± 11.32 b99.64 ± 11.74 h
RDnd2.91 ± 0.21 a5.09 ± 0.06 and32.08 ± 2.36 dnd24.87 ± 2.11 hi7.16 ± 0.57 ab4.14 ± 0.31 ab
RDEnd15.14 ± 1.4 bc4.87 ± 0.59 and17.81 ± 3.41 abnd25.87 ± 4.37 hi18.24 ± 1.68 bc18.59 ± 2.23 e
RInd2.19 ± 0.17 a3.08 ± 0.15 and36.02 ± 4.45 dnd23.19 ± 1.75ɡhi1.70 ± 0.15 a0.81 ± 0.01 a
RIEnd11.96 ± 0.87 b4.91 ± 0.65 and33.56 ± 5.05 dnd27.29 ± 2.76 i9.16 ± 0.67 ab16.21 ± 0.18 de
value ± SD are means of three repetitions; mean values followed by different letters are statistically different at p < 0.05 according to the Tukey post hoc test; Abbreviations: CafA—Caffeic acid; CftA—Caftaric acid; CotA—Coutaric acid; FrtA—Fertaric acid; Ep—(−)-epicatechin; Ep3Gll—(−)-epicatechin 3-gallate; PB2—Procyanidin B2; PTt—Procyanidin tetramer; PTm—Procyanidin trimer; nd—not detected.
Table 8. Flavonol content of the grape juice samples (mg/L of juice) .
SampleFlavonols
dHK3GluIR3GluK3OGalK3OGluK3OrutQ3GalQ3GluQ3rutQ3GlcrQ3rhadHQ35rha
JD2.13 ± 0.15 fg2.92 ± 0.27 andndndndndndndnd1.84 ± 0.27 a
JDE2.78 ± 0.25 h2.13 ± 0.14 andndndndndndndnd6.36 ± 0.40 a
JI0.45 ± 0.04 ab3.4 ± 0.50 andndndndndndndnd3.91 ± 0.31 a
JIE2.74 ± 0.39 h3.34 ± 0.47 andndndndndndndnd5.52 ± 0.44 a
MD0.22 ± 0.03 ab0.65 ± 0.11 andnd0.51 ± 0.05 and3.08 ± 0.28 andndnd0.74 ± 0.10 a
MDE0.98 ± 0.06 cd0.69 ± 0.09 andnd2.24 ± 0.02 a1.11 ± 0.20 b4.30 ± 0.23 bndndnd2.21 ± 0.23 a
MI0.32 ± 0.02 ab0.61 ± 0.05 and0.05 ± 0.00 a0.53 ± 0.08 and3.20 ± 0.45 andnd0.43 ± 0.03 a0.95 ± 0.07 a
MIE1.69 ± 0.13 ef0.7 ± 0.12 and0.95 ± 0.05 a2.38 ± 0.29 a1.17 ± 0.02 b4.34 ± 0.54 bndnd0.71 ± 0.07 a3.15 ± 0.39 a
AD0.38 ± 0.03 ab0.87 ± 0.09 andnd3.88 ± 0.58 andndnd1.24 ± 0.15 and0.38 ± 0.02 a
ADE0.71 ± 0.04 bc2.01 ± 0.06 andnd24.28 ± 3.29 dndndnd1.12 ± 0.14 and1.22 ± 0.10 a
AI0.41 ± 0.07 ab0.71 ± 0.04 and0.46 ± 0.06 a9.88 ± 1.62 bndnd19.56 ± 2.34 a1.22 ± 0.03 and1.26 ± 0.17 a
AIE0.69 ± 0.10 bc1.64 ± 0.16 and1.03 ± 0.14 a36.85 ± 0.56 endndnd1.11 ± 0.07 and4.33 ± 0.26 a
GD2.05 ± 0.05 fg12.92 ± 1.11 b103.62 ± 13.87 bnd17.98 ± 1.02 cndndndndnd1.83 ± 0.13 a
GDE2.30 ± 0.29 fh69.33 ± 6.77 d142.75 ± 4.01 cnd26.45 ± 1.87 d70.52 ± 9.45 andndndnd143.40 ± 17.09 b
GI1.37 ± 0.08 de1.22 ± 0.08 a107.75 ± 1.11 b43.2 ± 3.52 b24.22 ± 3.20 dndnd16.94 ± 1.29 and31.22 ± 1.01 b3.53 ± 0.32 a
GIE1.93 ± 0.25 fg73.17 ± 5.73 d131.74 ± 8.93 c66.42 ± 5.20 c34.23 ± 2.68 e68.91 ± 3.90 andndnd61.56 ± 4.34 d194.75 ± 14.23 c
RD0.43 ± 0.06 ab0.33 ± 0.02 a13.78 ± 1.93 and0.45 ± 0.06 andndndndnd0.30 ± 0.02 a
RDE1.39 ± 0.10 de26.49 ± 1.50 c16.74 ± 1.93 and10.57 ± 0.80 b72.63 ± 9.24 andndndnd3.95 ± 0.26 a
RI0.14 ± 0.01 a0.33 ± 0.04 a13.80 ± 1.62 and0.45 ± 0.02 andnd29.36 ± 2.95 bnd6.98 ± 0.64 c0.29 ± 0.02 a
RIE1.89 ± 0.26 fg24.10 ± 3.32 c19.26 ± 2.57 and18.11 ± 2.80 c76.20 ± 9.63 andndnd33.60 ± 2.42 b1.79 ± 0.13 a
value ± SD are means of three repetitions; mean values followed by different letters are statistically different at p < 0.05 according to the Tukey post hoc test; Abbreviations: dHK3Glu—Dihydrokaempferol-3-glucoside; IR3Glu—Isorhamnetin 3-glucoside; K3OGal—Kaempferol-3-O-galactoside; K3OGlu—Kaempferol-3-O-glucoside; K3Orut—Kaempferol-3-O-rutinoside; Q3Gal—Quercetin-3-galactoside; Q3Glu—Quercetin-3-glucoside; Q3rut—Quercetin-3-rutinoside; Q3Glcr—Quercetin-3-glucuronide; Q3rha—Quercetin-3-rhamnoside; dHQ35rha—Dihydroquercetin-3,5-rhamnoside; nd—not detected.
Disclaimer/Publisher’s Note: The statements, opinions and data contained in all publications are solely those of the individual author(s) and contributor(s) and not of MDPI and/or the editor(s). MDPI and/or the editor(s) disclaim responsibility for any injury to people or property resulting from any ideas, methods, instructions or products referred to in the content.

