
Comparison of Check-All-That-Apply (CATA), Rate-All-That-Apply (RATA), Flash Profile, Free Listing, and Conventional Descriptive Analysis for the Sensory Profiling of Sweet Pumpkin Porridge

Abstract
:1. Introduction
2. Materials and Methods
2.1. Samples and Preparations for Sensory Evaluation
2.2. Descriptive Analysis (DA)
2.2.1. Panel Training
2.2.2. Descriptive Analysis Evaluation
2.3. Consumer-Based Sensory Evaluation
2.3.1. Consumers
2.3.2. Check-All-That-Apply
2.3.3. Rate-All-That-Apply
2.3.4. Flash Profile
2.3.5. Free Listing
2.4. Feedback Questionnaire
2.5. Data Analysis
3. Results and Discussion
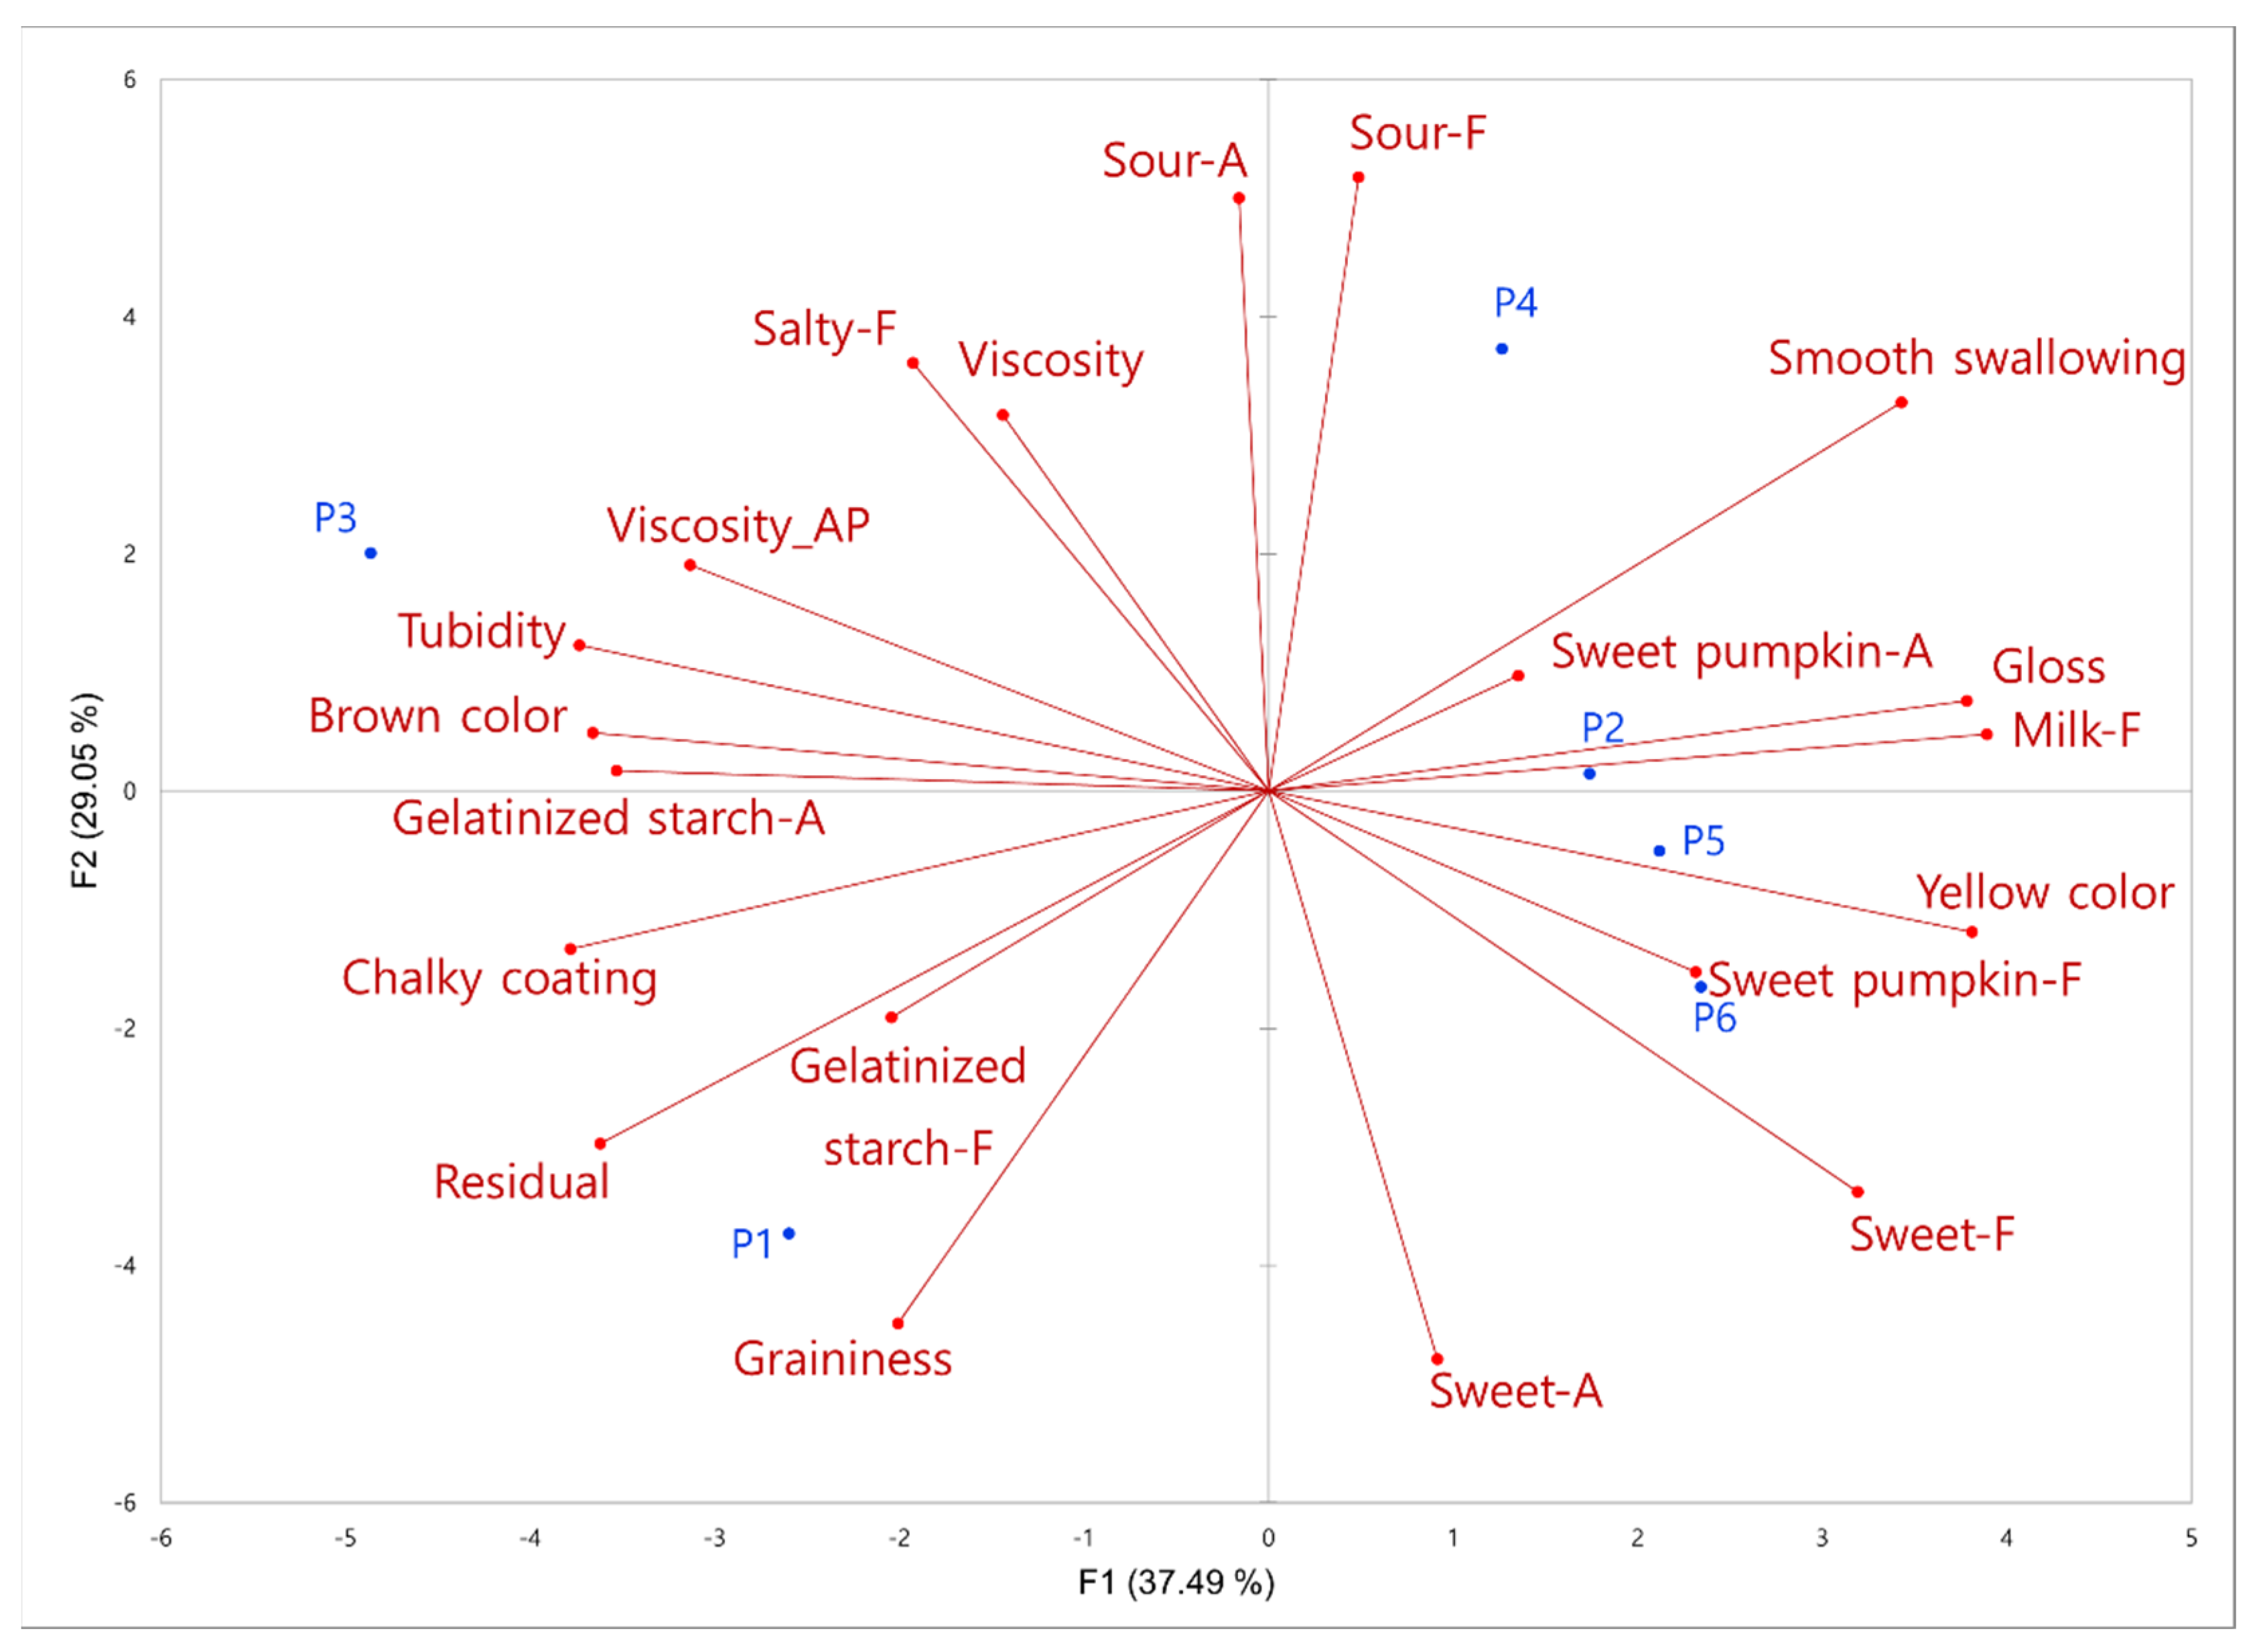
3.1. Descriptive Analysis
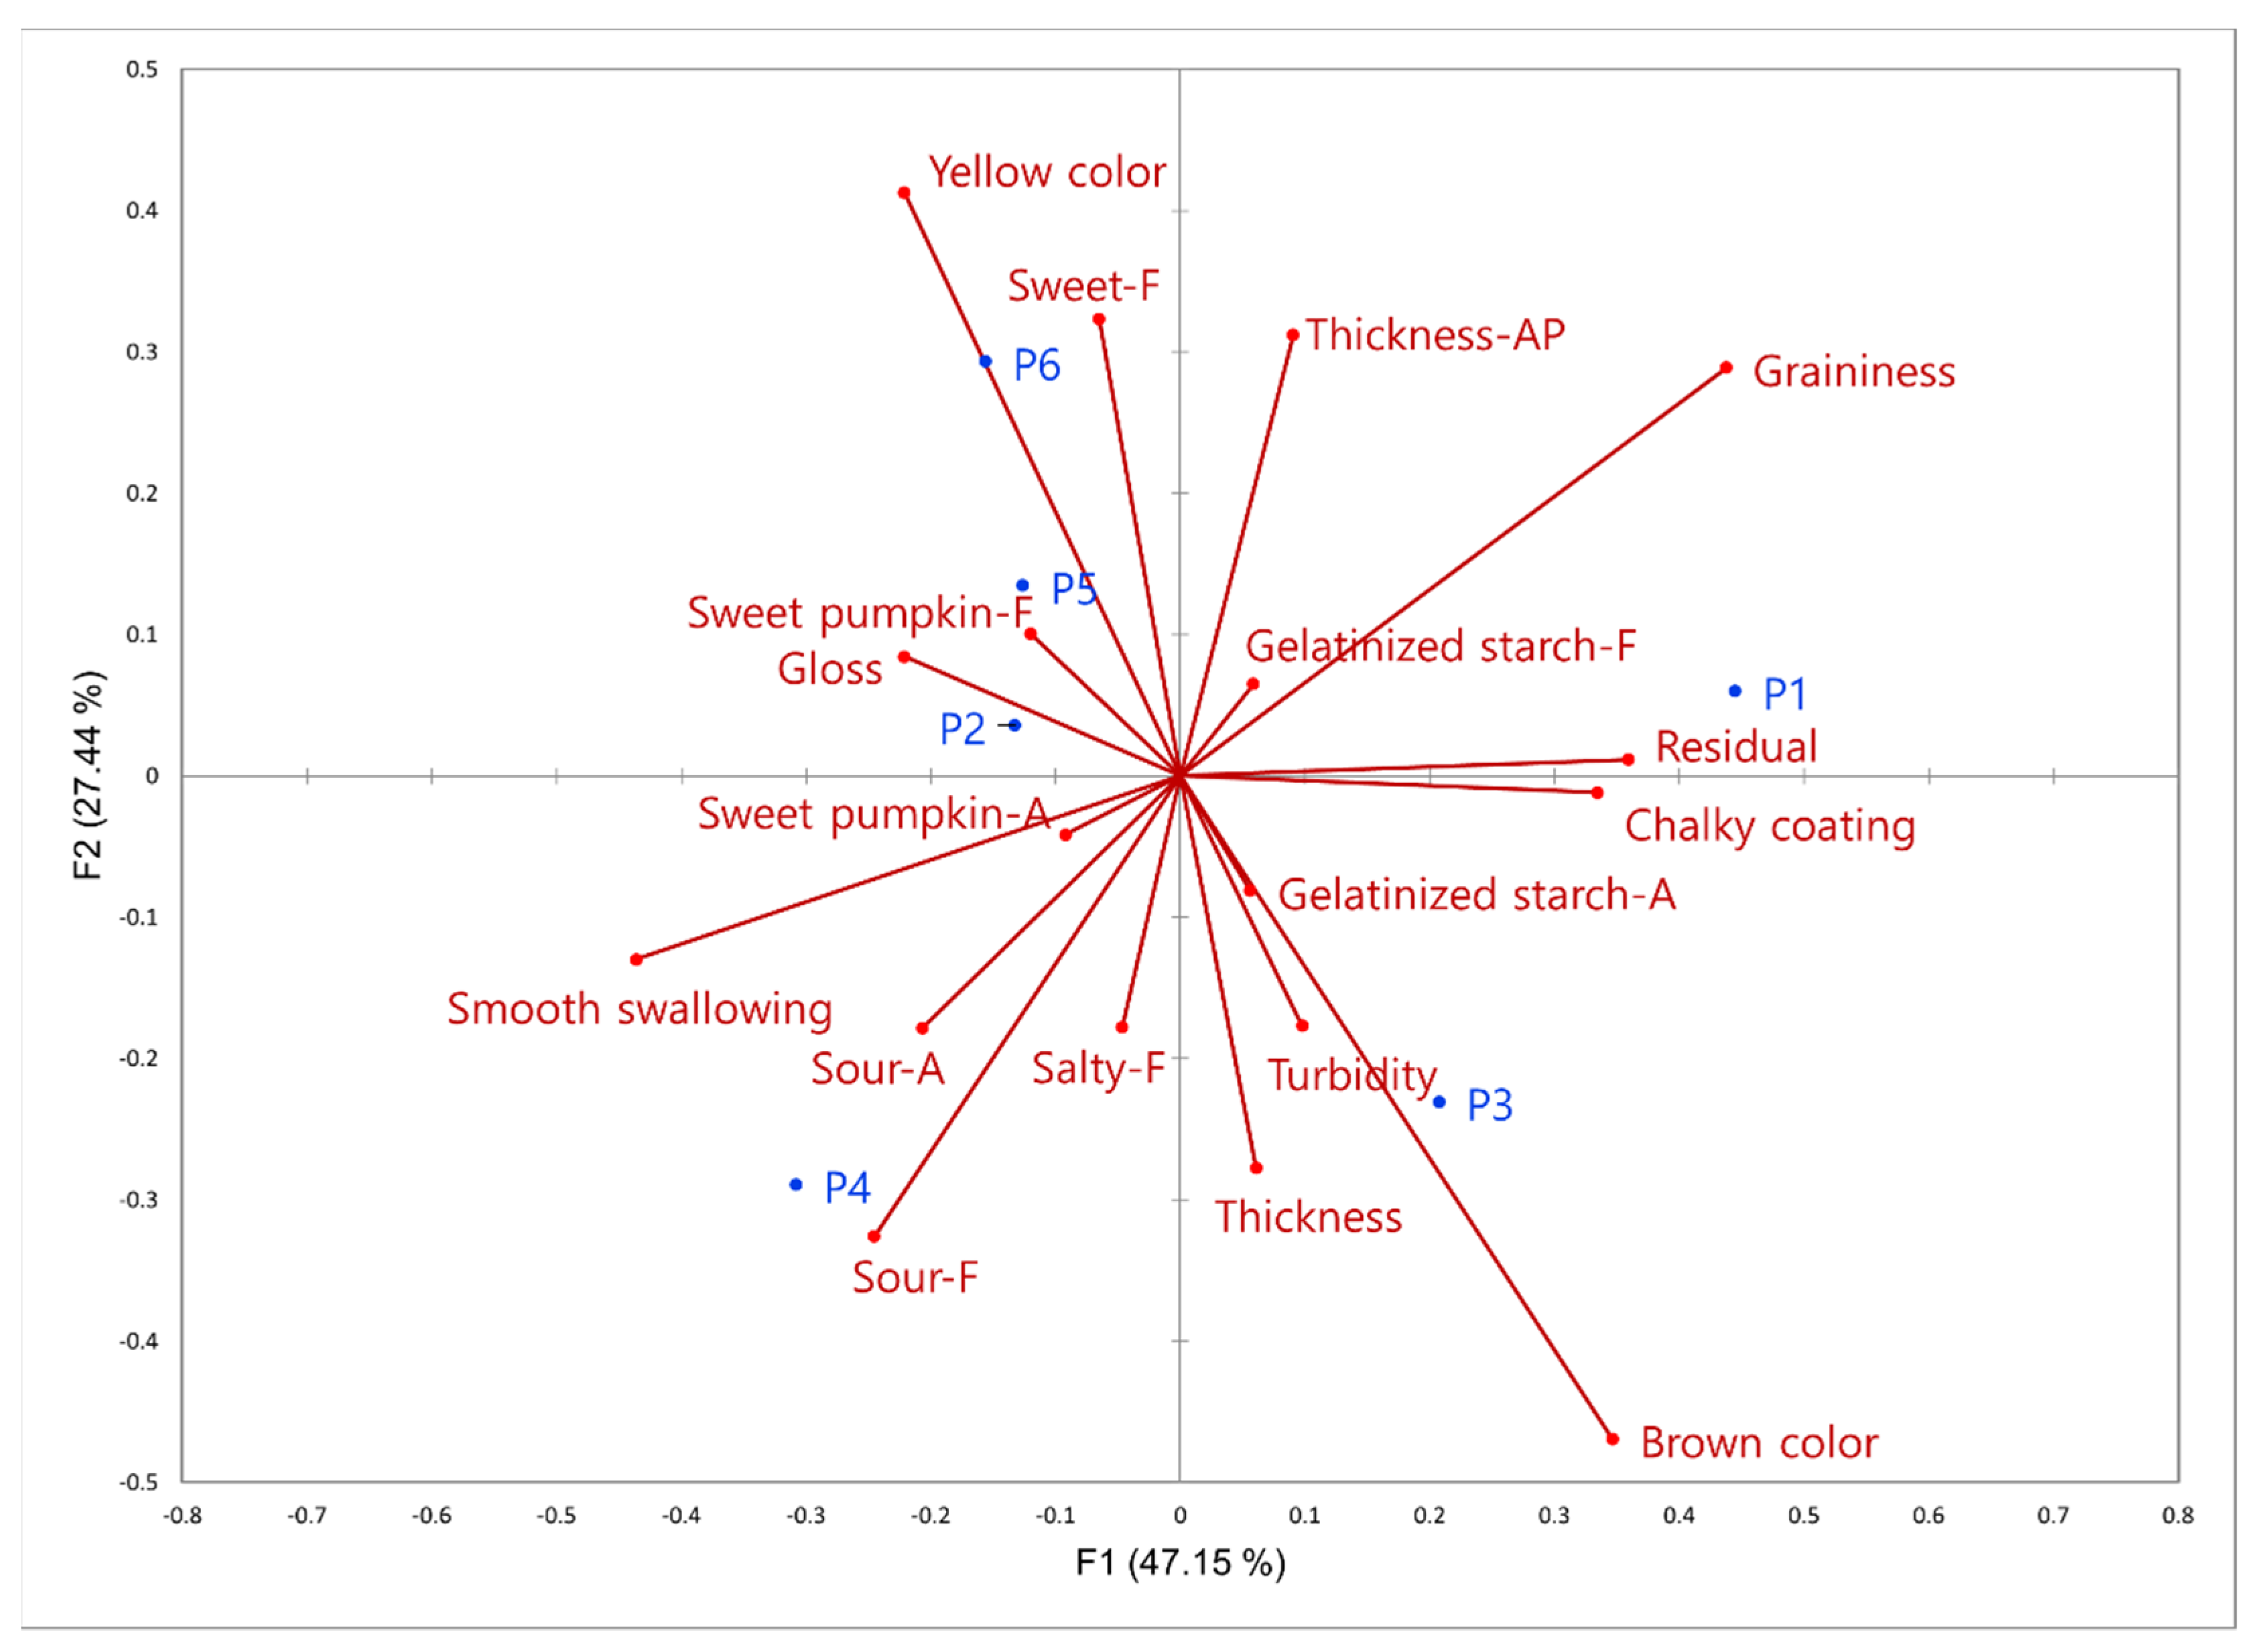
3.2. Check-All-That-Apply
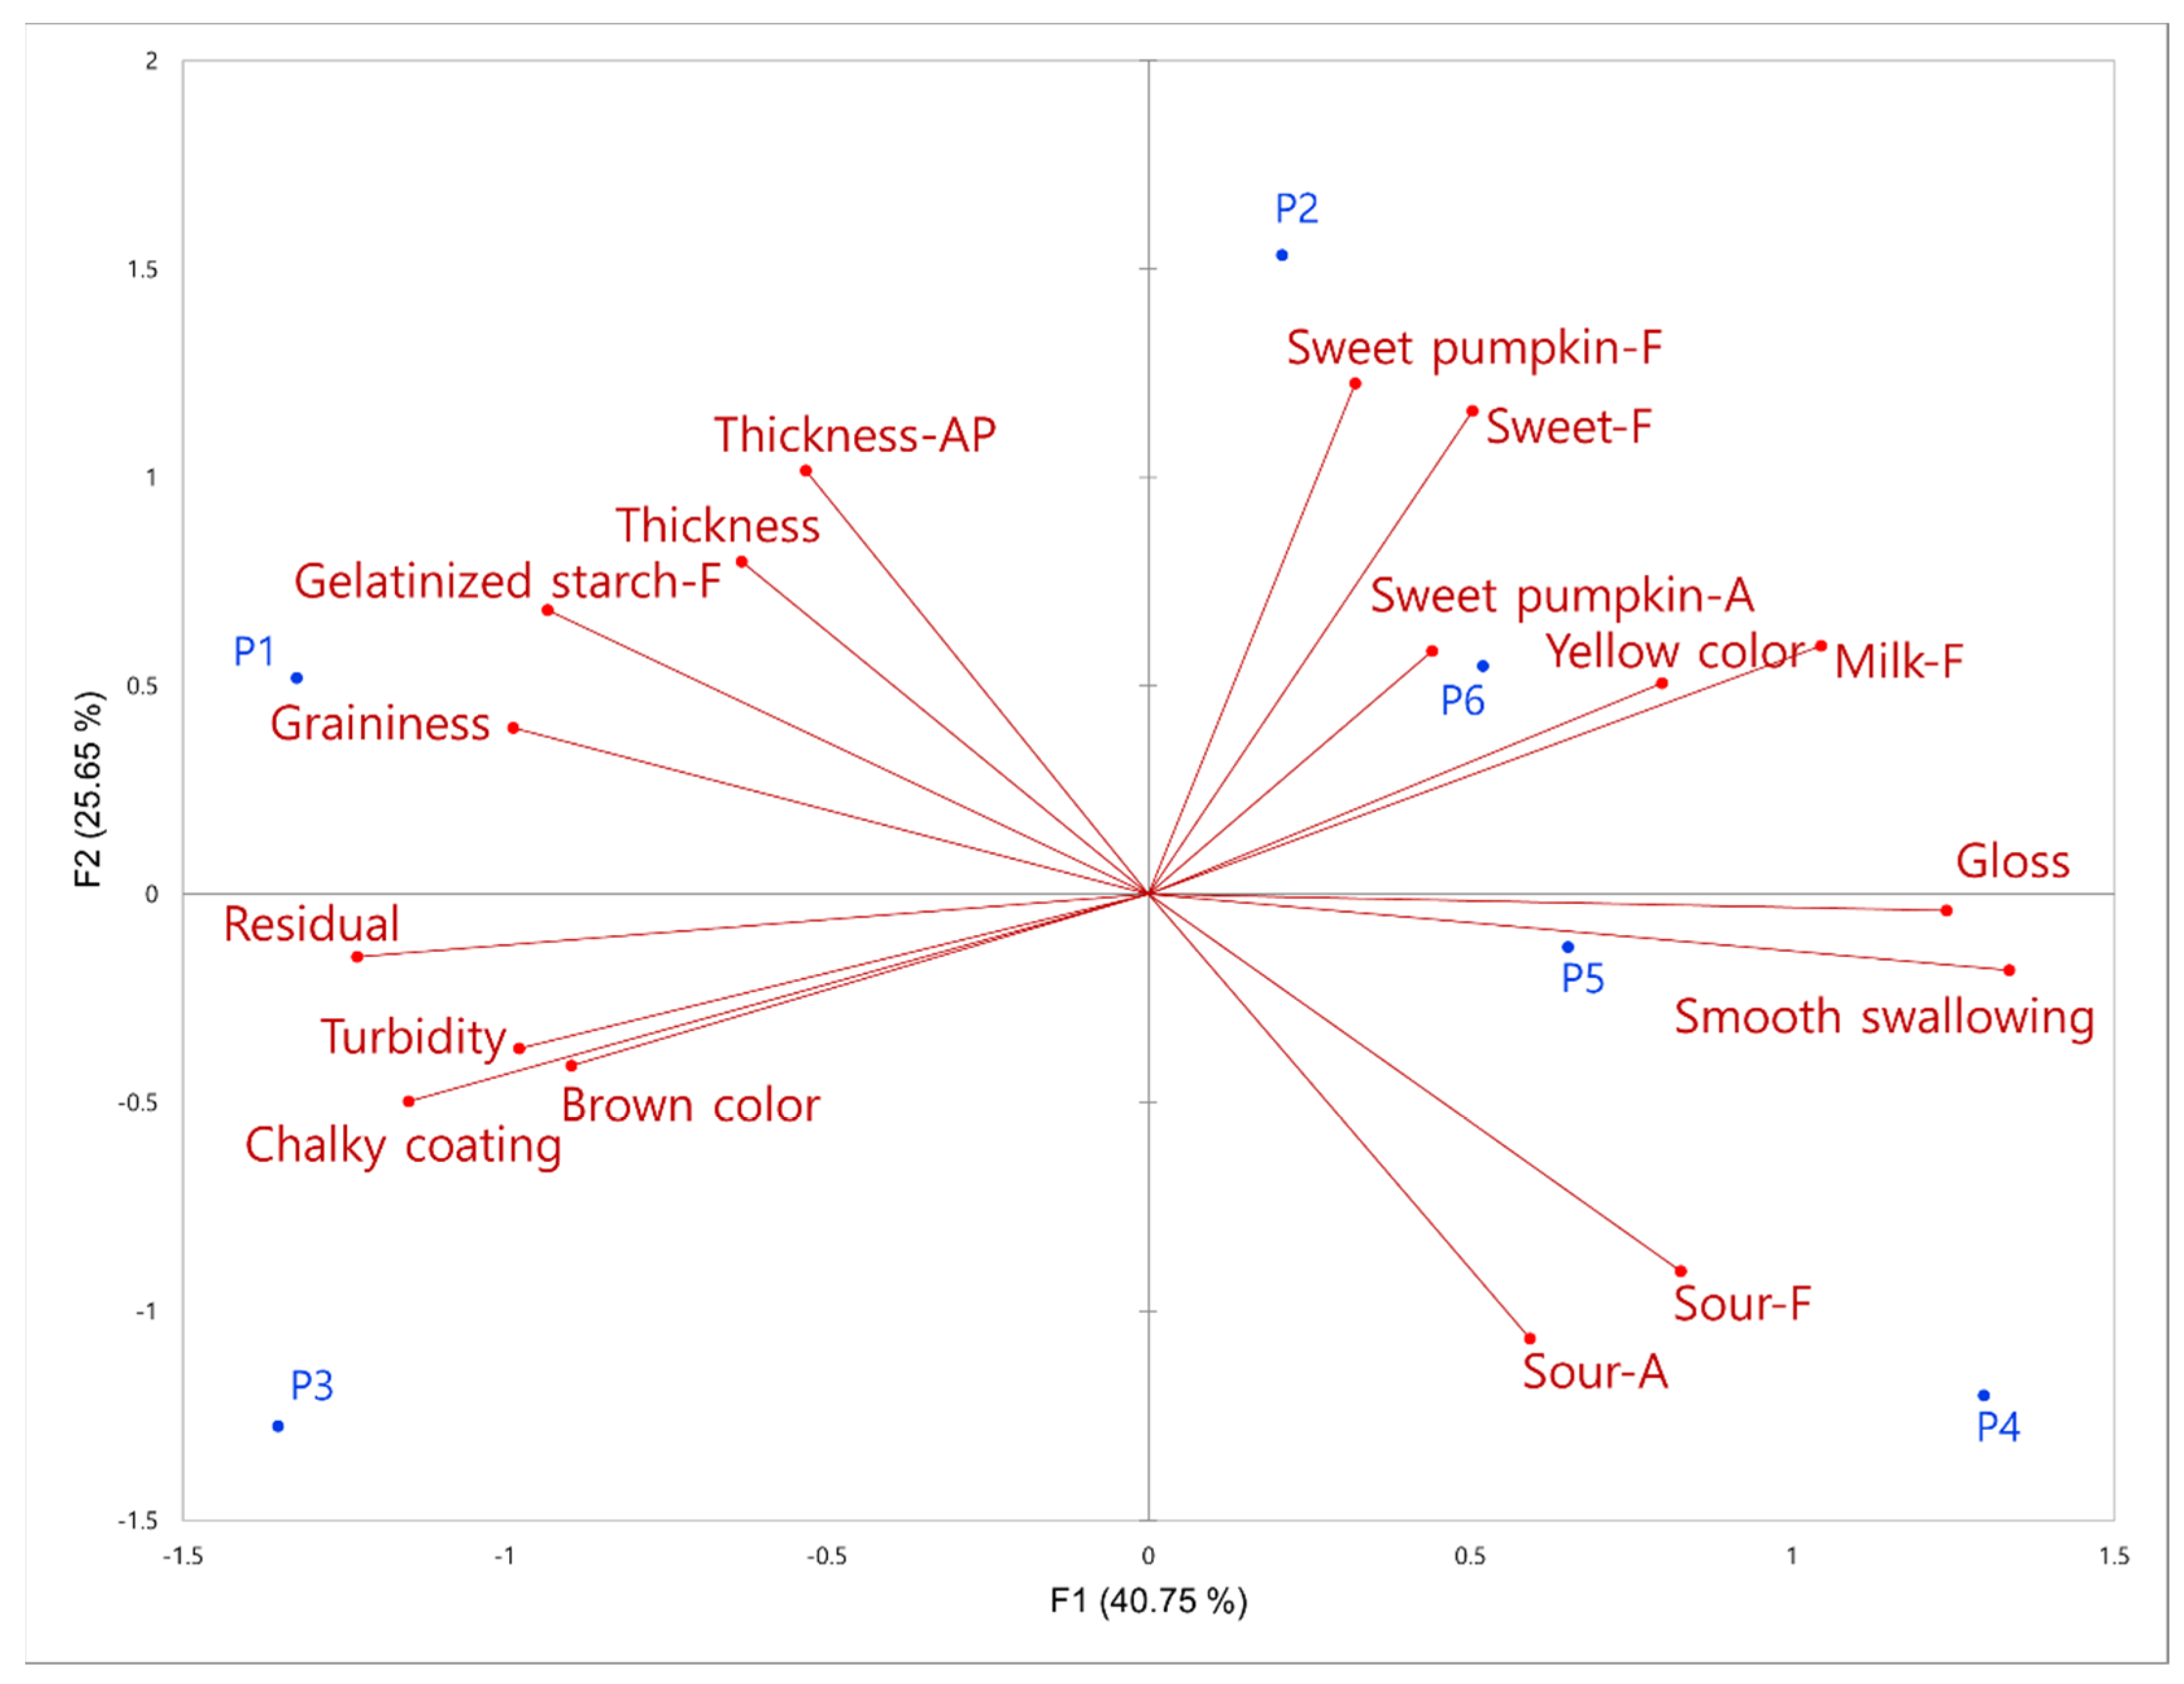
3.3. Rate-All-That-Apply
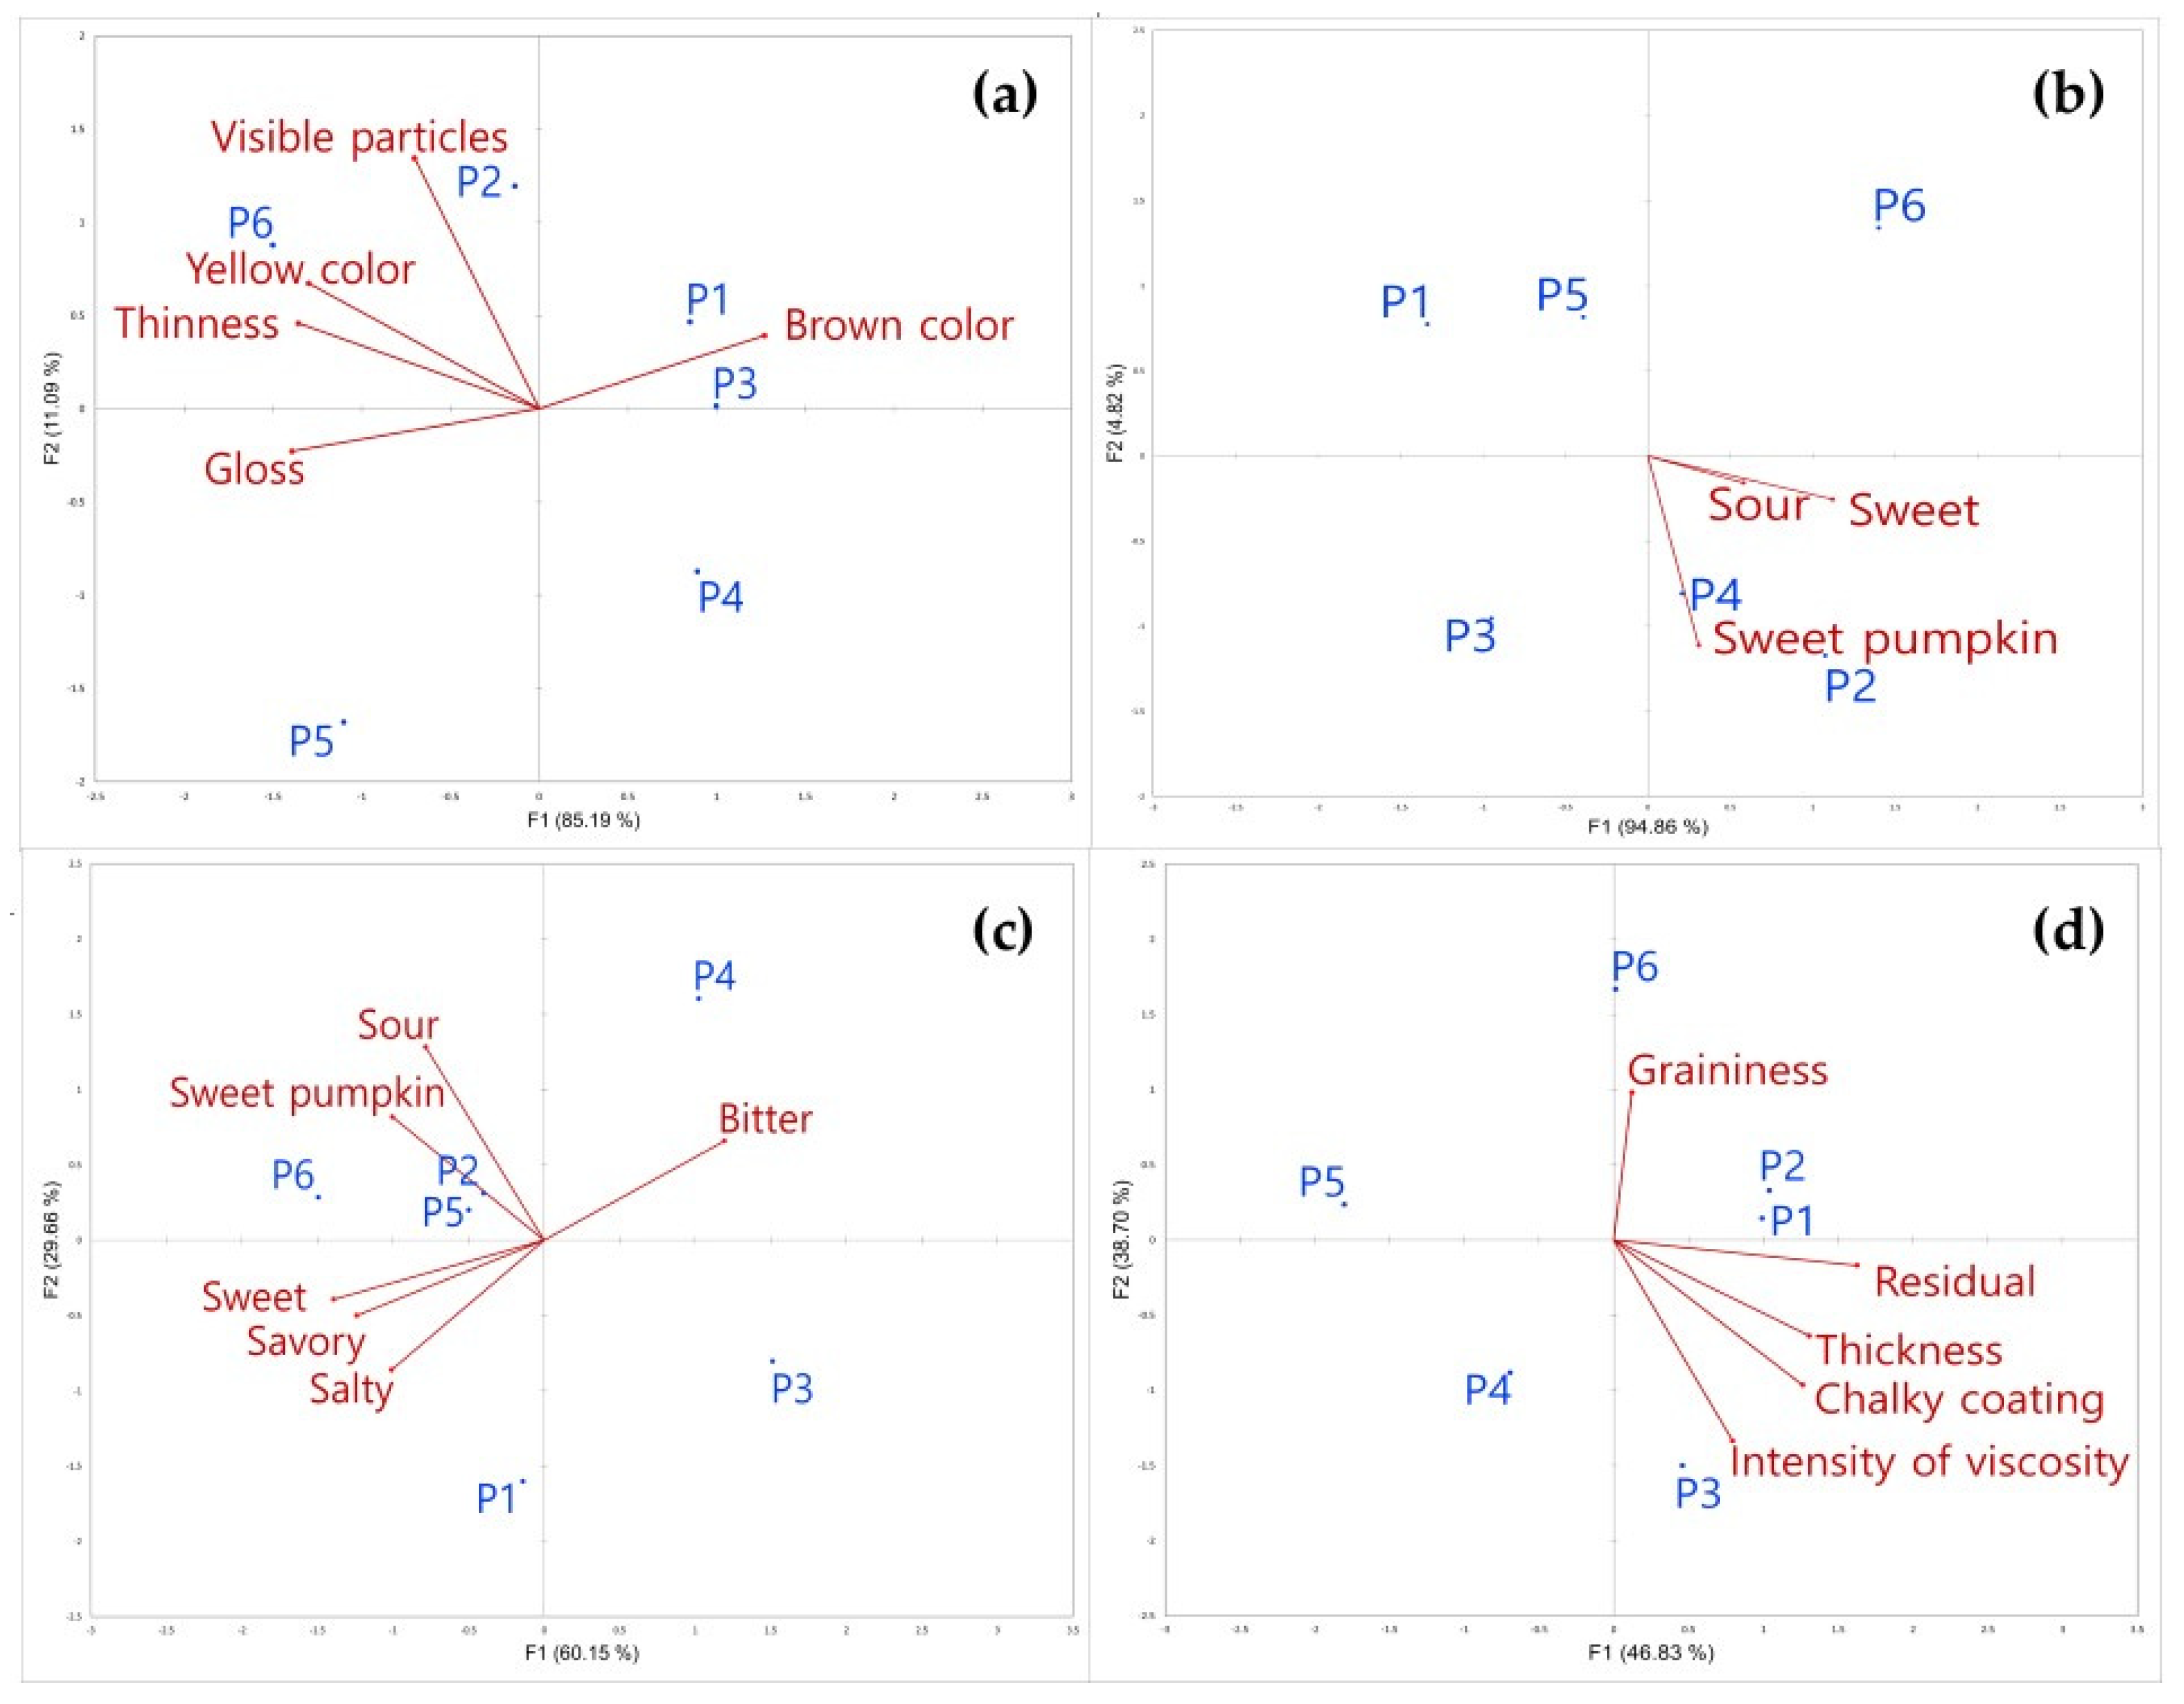
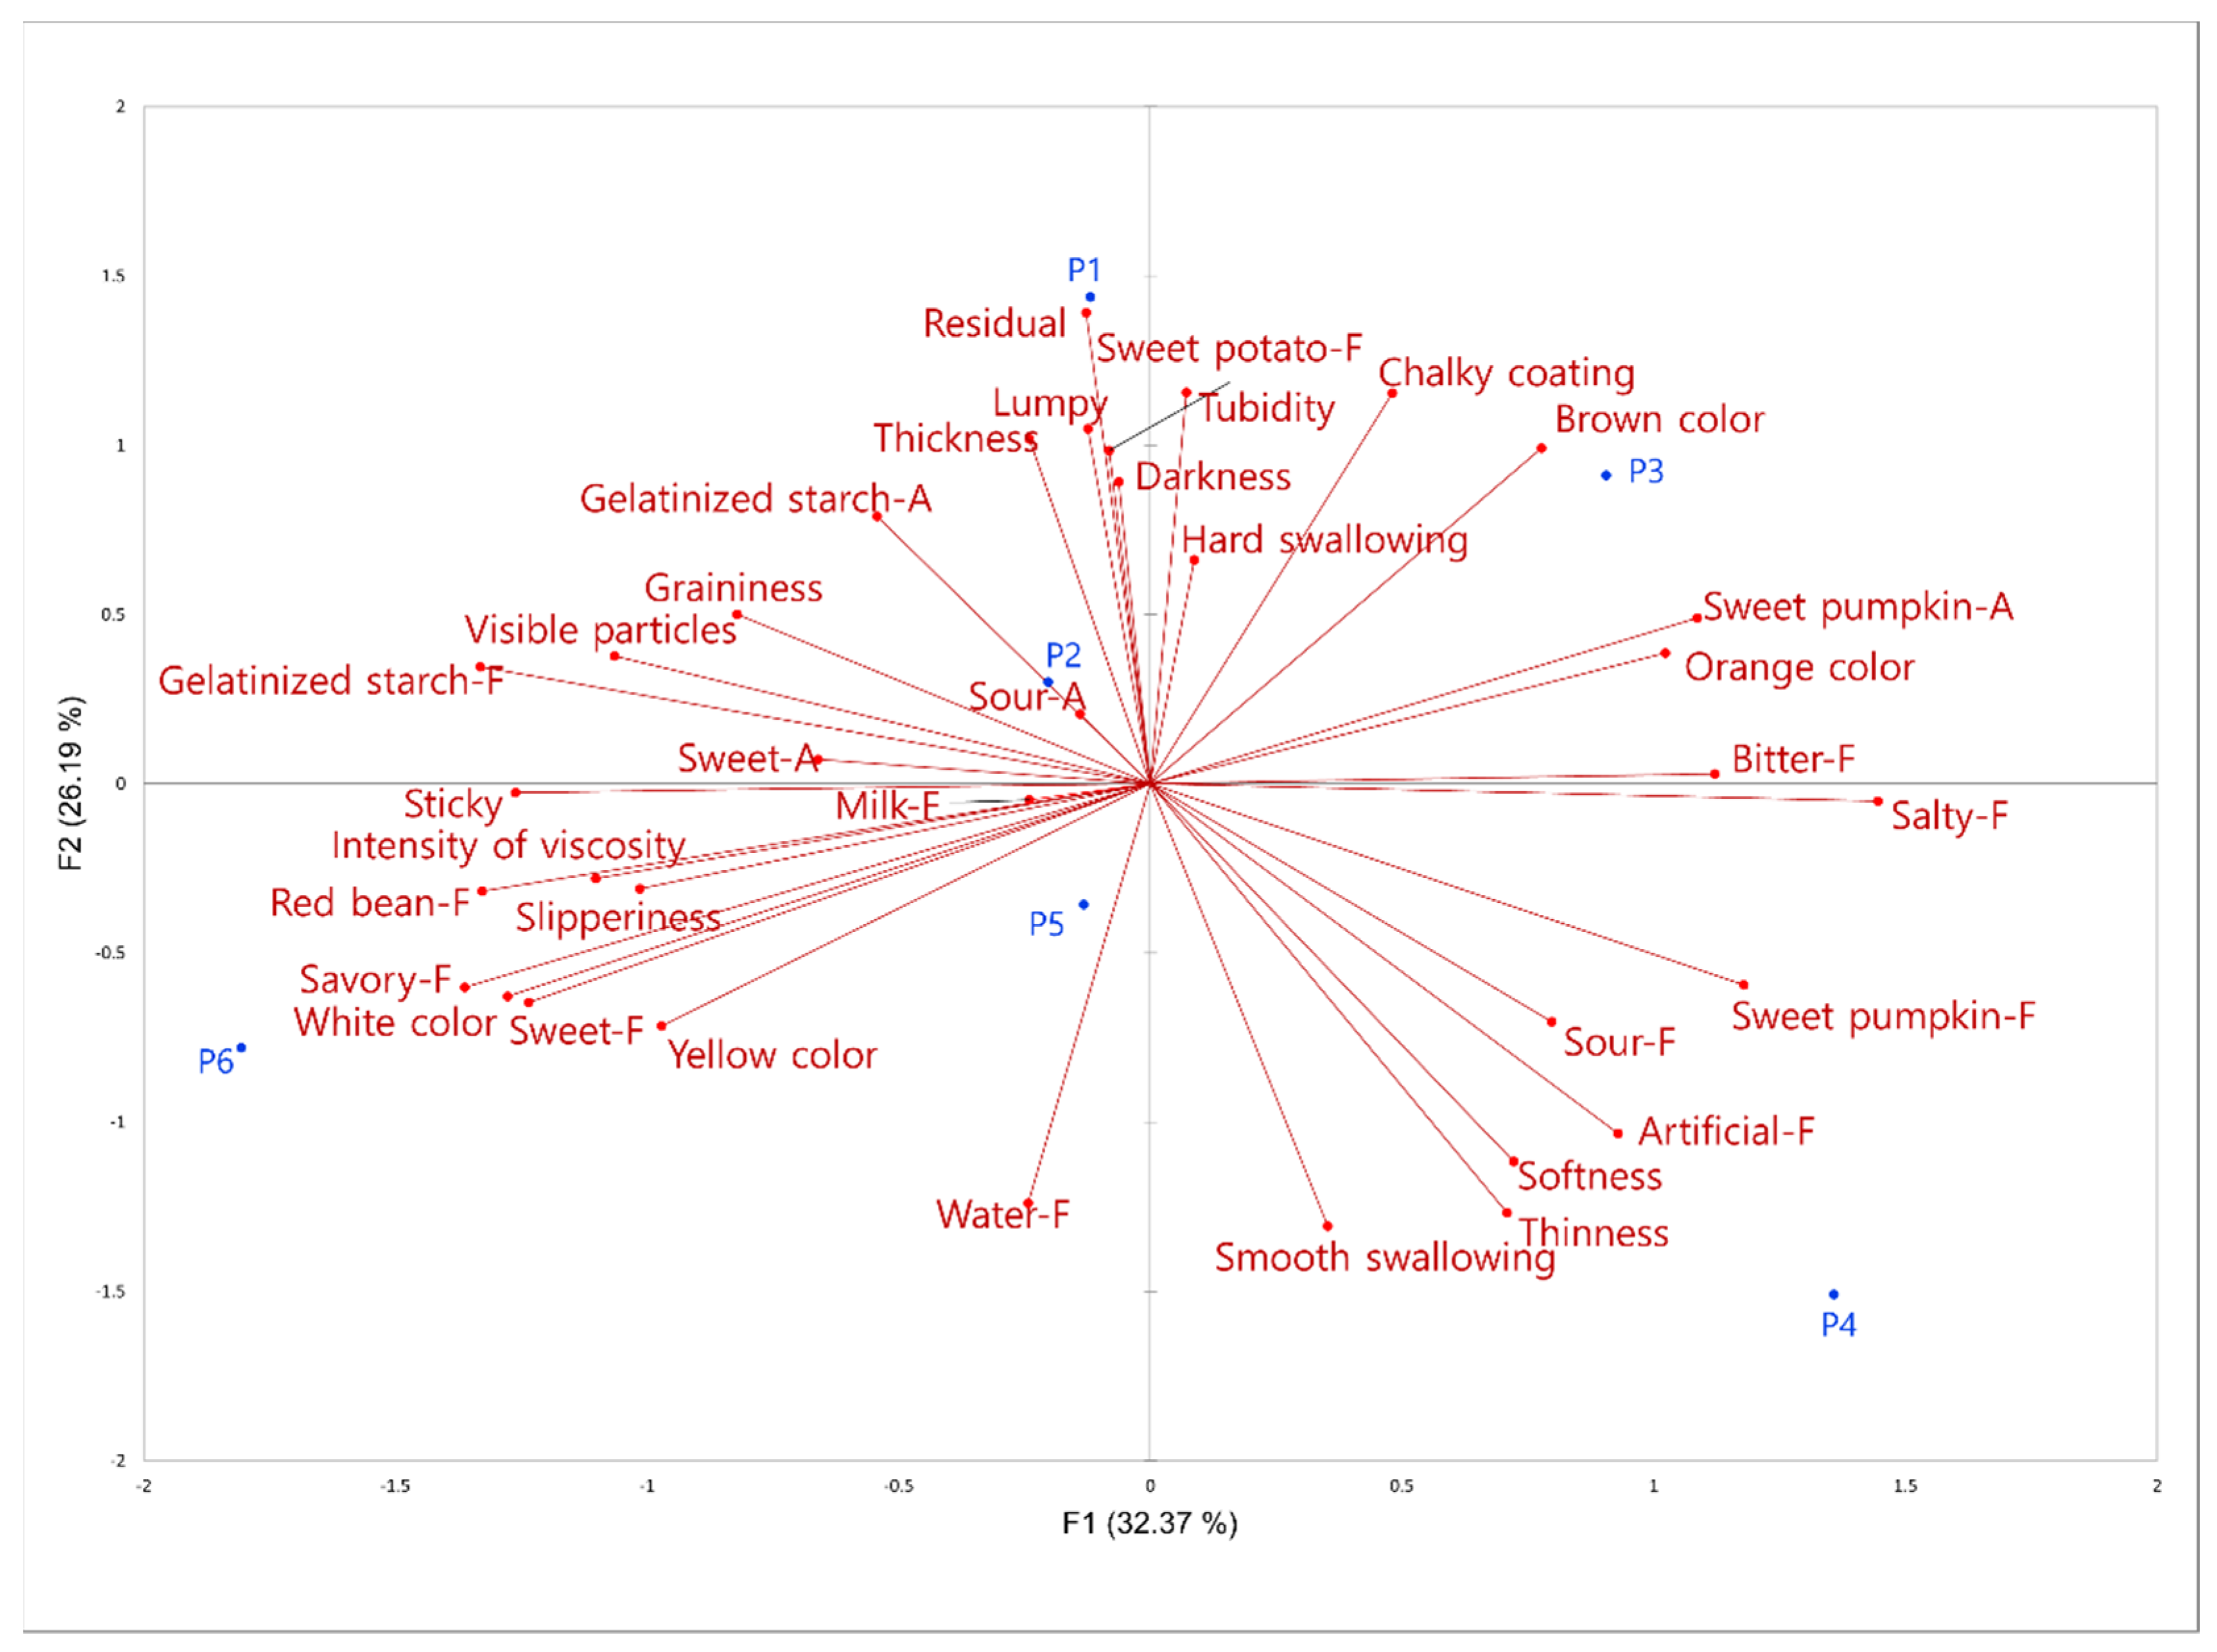
3.4. Flash Profile
3.5. Free Listing
3.6. Comparison of the DA and Consumer-Based Sensory Profiling
3.7. Feedback Questionnaire
4. Conclusions
Author Contributions
Funding
Institutional Review Board Statement
Informed Consent Statement
Data Availability Statement
Conflicts of Interest
References
- Marques, C.; Correia, E.; Dinis, L.T.; Vilela, A. An Overview of Sensory Characterization Techniques: From Classical Descriptive Analysis to the Emergence of Novel Profiling Methods. Foods 2022, 11, 255. [Google Scholar] [CrossRef] [PubMed]
- Lawless, H.T.; Heymann, H. Sensory Evaluation of Food: Principles and Practices; Springer Science and Business Media LLC: Berlin/Heidelberg, Germany, 2010; pp. 227–257. [Google Scholar]
- Varela, P.; Ares, G. Sensory Profiling, the blurred line between sensory and consumer science. A review of novel methods for product characterization. Food Res. Int. 2012, 48, 893–908. [Google Scholar] [CrossRef]
- Dong, Y.; Karboune, S. A Review of Bread Qualities and Current Strategies for Bread Bioprotection: Flavor, Sensory, Rheological, and Textural Attributes. Compr. Rev. Food Sci. Food Saf. 2021, 20, 1937–1981. [Google Scholar] [CrossRef] [PubMed]
- Lazo, O.; Claret, A.; Guerrero, L. A comparison of two methods for generating descriptive attributes with trained assessors: Check-all-that-apply (CATA) vs. free choice profiling (FCP). J. Sens. Stud. 2016, 31, 163–176. [Google Scholar] [CrossRef]
- Kemp, S.E.; Ng, M.; Hort, J.; Hollowood, T. Introduction to Descriptive Analysis Chapter 1. In Descriptive Analysis in Sensory Evaluation; Sarah, E., Kemp, S.E., Hort, J., Hollowood, T., Eds.; John Wiley & Sons Ltd.: Chichester, UK, 2018; pp. 3–40. [Google Scholar]
- Stone, H.; Bleibaum, R.N.; Thomas, H.A. Descriptive Analysis Chapter 6. In Sensory Evaluation Practices, 5th ed.; Food Science and Technology International Series; Academic Press: London, UK, 2012; pp. 235–294. [Google Scholar]
- Liu, J.; Bredie, W.L.P.; Sherman, E.; Harbertson, J.F.; Heymann, H. Comparison of Rapid Descriptive Sensory Methodologies: Free-Choice Profiling, Flash Profile, and Modified Flash Profile. Food Res. Int. 2018, 106, 892–900. [Google Scholar] [CrossRef] [PubMed]
- Alexi, N.; Nanou, E.; Lazo, O.; Guerrero, L.; Grigorakis, K.; Byrne, D.V. Check-All-That-Apply (CATA) with Semi-Trained Assessors: Sensory Profiles Closer to Descriptive Analysis or Consumer Elicited Data? Food Qual. Prefer. 2018, 64, 11–20. [Google Scholar] [CrossRef]
- Cruz, A.G.; Cadena, R.S.; Castro, W.F.; Esmerino, E.A.; Rodrigues, J.B.; Gaze, L.; Faria, J.A.F.; Freitas, M.Q.; Deliza, R.; Bolini, H.M.A. Consumer perception of probiotic yogurt: Performance of check all that apply (CATA), projective mapping, sorting and intensity scale. Food Res. Int. 2013, 54, 601–610. [Google Scholar] [CrossRef]
- Pineau, N.; Girardi, A.; Lacoste Gregorutti, C.; Fillion, L.; Labbe, D. Comparison of RATA, CATA, sorting and napping® as rapid alternatives to sensory profiling in a food industry environment. Food Res. Int. 2022, 158, 111467. [Google Scholar] [CrossRef]
- Ares, G.; Varela, P. Trained vs. consumer panels for analytical testing: Fueling a long lasting debate in the field. Food Qual. Prefer. 2017, 61, 79–86. [Google Scholar] [CrossRef]
- Moss, R.; McSweeney, M.B. Projective mapping as a versatile sensory profiling tool: A review of recent studies on different food products. J. Sens. Stud. 2022, 37, e12743. [Google Scholar] [CrossRef]
- Heo, J.; Kim, S.S.; Kim, M.R.; Kwak, H.S. Comparison of Sensory Profiling by Descriptive Analysis, Free-Choice Profiling, and Polarized Sensory Positioning on Bottled Water. Foods 2023, 12, 1579. [Google Scholar] [CrossRef] [PubMed]
- Pearson, W.; Schmidtke, L.; Francis, I.L.; Blackman, J.W. An Investigation of the Pivot© Profile Sensory Analysis Method Using Wine Experts: Comparison with Descriptive Analysis and Results from Two Expert Panels. Food Qual. Prefer. 2020, 83, 103858. [Google Scholar] [CrossRef]
- De Carvalho, M.A.; Kitzberger, C.S.G.; de Souza Sartori, A.V.; de Toledo Benassi, M.; dos Santos Scholz, M.B.; da Silva, C.M. Free choice profiling sensory analysis and principal component analysis as tools to support an apple breeding program. AIMS Agric. and Food. 2020, 5, 769–784. [Google Scholar] [CrossRef]
- Silva, F.; Duarte, A.M.; Mendes, S.; Pinto, F.R.; Barroso, S.; Ganhao, R.; Gil, M.M. CATA vs. FCP for a rapid descriptive analysis in sensory characterization of fish. J. Sens. Stud. 2020, 35, e12605. [Google Scholar] [CrossRef]
- Rodríguez-Noriega, S.; Buenrostro-Figueroa, J.J.; RebollosoPadilla, O.N.; Corona-Flores, J.; Camposeco-Montejo, N.; FloresNaveda, A.; Ruelas-Chacón, X. Developing a Descriptive Sensory Characterization of Flour Tortilla Applying Flash Profile. Foods 2021, 10, 1473. [Google Scholar] [CrossRef] [PubMed]
- He, W.; Chung, H.Y. Comparison between quantitative descriptive analysis and flash profile in profiling the sensory properties of commercial red sufu (Chinese fermented soybean curd). J. Sci. Food Agric. 2019, 99, 3024–3033. [Google Scholar] [CrossRef]
- Rodrigues, J.F.; Mangia, B.A.; e Silva, J.G.; Lacorte, G.A.; Coimbra, L.O.; Esmerino, E.A.; da Cruz, A.G. Sorting task as a tool to elucidate the sensory patterns of artisanal cheeses. J. Sens. Stud. 2020, 353, e12562. [Google Scholar] [CrossRef]
- Tiepo, C.B.V.; Werlang, S.; Reinehr, C.O.; Colla, L.M. Sensory methodologies used in descriptive studies with consumers: Check-All-That-Apply (CATA) and variations. Res. Soc. Dev. 2020, 9, e407985705. [Google Scholar] [CrossRef]
- Rabitti, N.S.; Cattaneo, C.; Appiani, M.; Proserpio, C.; Laureati, M. Describing the Sensory Complexity of Italian Wines: Application of the Rate-All-That-Apply (RATA) Method. Foods 2022, 11, 2417. [Google Scholar] [CrossRef]
- Vieira, A.H.; Balthazar, C.F.; Rocha, R.S.; Silva, R.; Guimaraes, J.T.; Pagani, M.M.; Cruz, A.G. The free listing task for describing the sensory profiling of dairy foods: A case study with microfiltered goat whey orange juice beverage. J. Sens. Stud. 2020, 35, e12594. [Google Scholar] [CrossRef]
- Antúnez, L.; Vidal, L.; de Saldamando, L.; Giménez, A.; Ares, G. Comparison of consumer-based methodologies for sensory characterization: Case study with four sample sets of powdered drinks. Food Qual. Prefer. 2016, 56, 149–163. [Google Scholar] [CrossRef]
- Harwood, W.S.; McLean, K.G.; Ennis, J.M.; Ennis, D.M.; Drake, M. Comparison of preference mapping with projective mapping for characterizing consumer perception of brewed black coffees. J. Sens. Stud. 2020, 35, e12563. [Google Scholar] [CrossRef]
- Wang, S.; Ng, K.H.; Yee, K.H.; Tang, Y.; Meng, R.; He, W. Comparison of pivot profile, CATA, and pivot-CATA for the sensory profiling of instant black coffee. Food Qual. Prefer. 2023, 108, 104858. [Google Scholar] [CrossRef]
- Yoon, G.; Kwak, H.S.; Heo, J.; Lee, Y. Comparison of conventional and consumer-based sensory profiling methods for ready-to-drink coffee beverages. J. Sens. Stud. 2023, 38, e12839. [Google Scholar] [CrossRef]
- Hough, G.; Ferraris, D. Free listing: A method to gain initial insight of a food category. Food Qual. Prefer. 2010, 21, 295–301. [Google Scholar] [CrossRef]
- Oppermann, A.K.L.; de Graaf, C.; Scholten, E.; Stieger, M.; Piqueras-Fiszman, B. Comparison of Rate-All-That-Apply (RATA) and Descriptive sensory Analysis (DA) of model double emulsions with subtle perceptual differences. Food Qual. Prefer. 2017, 56, 55–68. [Google Scholar] [CrossRef]
- Kim, H.J.; Park, H.Y.; Kim, M.Y.; Lee, J.Y.; Lee, J.H.; Lee, J.Y.; Lee, B. Physicochemical characteristics of brown rice porridge added with colored rice cultivars. J. Korean Soc. Food Sci. Nutr. 2021, 50, 279–284. [Google Scholar] [CrossRef]
- Korea Agro-Fisheries & Food Trade Corporation. Available online: https://www.atfis.or.kr/home/board/FB0002.do?act=read&bpoId=3334 (accessed on 11 August 2023).
- Korea Agro-Fisheries & Food Trade Corporation. 2019 Processed Food Segment Market Status: Convenience Food Market; Report No. 11-1543000-002872-01; Korea Agro-Fisheries & Food Trade Corporatio: Naju, Korea, 2018. [Google Scholar]
- Park, J.S.; Na, H.S. Development of fermented pumpkin porridge as a meal replacement. Korean J. Food Preserv. 2018, 25, 501–506. [Google Scholar] [CrossRef]
- Aimi Fadzirul, K.; Haris, A.; Nurazira, S.; Daud, M.; Zurina, K.; Nursilah, A.; Syadiyah, A.S. The potential of pumpkin (Cucurbita moschata Duschene) as commercial crop in Malaysia. Pertanika J. Sch. Res. Rev. 2018, 4, 1–10. [Google Scholar]
- Montesano, D.; Rocchetti, G.; Putnik, P.; Lucini, L. Bioactive profile of pumpkin: An overview on terpenoids and their health-promoting properties. Curr. Opin. Food Sci. 2018, 22, 81–87. [Google Scholar] [CrossRef]
- Sharif, M.K.; Butt, M.S.; Sharif, H.R.; Nasir, M. Sensory Evaluation and Consumer Acceptability. In Handbook of Food Science and Technology; Khan, I.A., Farooq, M., Eds.; University of Agriculture: Faisalabad, Pakistan, 2017; pp. 361–386. [Google Scholar]
- Chung, S.J.; Hwang, Y.S.; Chung, C.J.; Kim, J.H.; Um, S.Y.; Chang, Y.R.; Kim, S.J. Developing a Descriptive Analysis Procedure for Korean Pumpkin Gruel (Hobakjuk). Food Qual. Cult. 2009, 3, 1–5. [Google Scholar]
- Albert, A.; Varela, P.; Salvador, A.; Hough, G.; Fiszman, S. Overcoming the issues in the sensory description of hot served food with a complex texture. Application of QDA®, flash profiling and projective mapping using panels with different degrees of training. Food Qual. Prefer. 2011, 22, 463–473. [Google Scholar] [CrossRef]
- Saldaña, E.; Saldarriaga, L.; Cabrera, J.; Behrens, J.H.; Selani, M.M.; Rios-Mera, J.; Contreras-Castillo, C.J. Descriptive and hedonic sensory perception of Brazilian consumers for smoked bacon. Meat Sci. 2019, 147, 60–69. [Google Scholar] [CrossRef] [PubMed]
- Valentin, D.; Chollet, S.; Lelièvre, M.; Abdi, H. Quick and dirty but still pretty good: A review of new descriptive methods in food science. Int. J. Food Sci. Technol. 2012, 47, 1563–1578. [Google Scholar] [CrossRef]
- Kostov, B.; Bécue-Bertaut, M.; Husson, F. An original methodology for the analysis and interpretation of word-count based methods: Multiple factor analysis for contingency tables complemented by consensual words. Food Qual. Prefer. 2014, 32, 35–40. [Google Scholar] [CrossRef]
- Meyners, M.; Castura, J.C.; Carr, B.T. Existing and new approaches for the analysis of CATA data. Food Qual. Prefer. 2013, 30, 309–319. [Google Scholar] [CrossRef]
- Meynersa, M.; Jaegerb, S.R.; Ares, G. On the Analysis of Rate-All-That-Apply (RATA) Data. Food Qual. Prefer. 2016, 49, 1–10. [Google Scholar] [CrossRef]
- Symoneaux, R.; Galmarini, M.V.; Mehinagic, E. Comment analysis of consumer’s likes and dislikes as an alternative tool to preference mapping. A case study on apples. Food Qual. Prefer. 2012, 24, 59–66. [Google Scholar] [CrossRef]
- Moussaoui, K.A.; Varela, P. Exploring Consumer Product Profiling Techniques and Their Linkage to a Quantitative Descriptive Analysis. Food Qual. Prefer. 2010, 21, 1088–1099. [Google Scholar] [CrossRef]
- Dos Santos, B.A.; Bastianello Campagnol, P.C.; da Cruz, A.G.; Galvão, M.T.E.L.; Monteiro, R.A.; Wagner, R.; Pollonio, M.A.R. Check all that apply and free listing to describe the sensory characteristics of low sodium dry fermented sausages: Comparison with trained panel. Food Res. Int. 2015, 76, 725–734. [Google Scholar] [CrossRef]
- Lawrence, G.; Symoneaux, R.; Maître, I.; Brossaud, F.; Maestrojuan, M.; Mehinagic, E. Using the free comments method for sensory characterisation of Cabernet Franc wines: Comparison with classical profiling in a professional context. Food Qual. Prefer. 2013, 30, 145–155. [Google Scholar] [CrossRef]
- Karseno, E.; Yanto, T.; Setyowati, R.; Haryanti, P. Effect of pH and temperature on browning intensity of coconut sugar and its antioxidant activity. Food Res. Int. 2018, 2, 32–38. [Google Scholar] [CrossRef] [PubMed]
- Dhenge, R.; Rinaldi, M.; Ganino, T.; Santi, S.; Ferrarese, I.; Dall’Acqua, S. Variations of polyphenols, sugars, carotenoids, and volatile constituents in pumpkin (Cucurbita moschata) during high pressure processing: A kinetic study. Innov. Food Sci. Emerg. Technol. 2022, 78, 103005. [Google Scholar] [CrossRef]
- Pueschel, V.A.; Schieberle, P. Changes in the key aroma compounds of matsutake mushroom (Tricholoma matsutake Sing.) from Canada during pan-frying elucidated by application of the sensomics approach. Eur. Food Res. Technol. 2021, 247, 51–65. [Google Scholar] [CrossRef]
- Papadochristopoulos, A.; Kerry, J.P.; Fegan, N.; Burgess, C.M.; Duffy, G. Natural Anti-Microbials for Enhanced Microbial Safety and Shelf-Life of Processed Packaged Meat. Foods 2021, 10, 1598. [Google Scholar] [CrossRef]
- Merino, G.; Marín-Arroyo, M.R.; Beriain, M.J.; Ibañez, F.C. Dishes Adapted to Dysphagia: Sensory Characteristics and Their Relationship to Hedonic Acceptance. Foods 2021, 10, 480. [Google Scholar] [CrossRef]
- Jaeger, S.R.; Beresford, M.K.; Lo, K.R.; Hunter, D.C.; Chheang, S.L. What Does It Mean to Check-All-That-Apply? Four Case Studies with Beverages. Food Qual. Prefer. 2020, 80, 103794. [Google Scholar] [CrossRef]
- Ares, G.; Bruzzone, F.; Gimenez, A.N.A. Is a consumer panel able to reliably evaluate the texture of dairy desserts using unstructured intensity scales? Evaluation of global and individual performance. J. Sens. Stud. 2011, 26, 363–370. [Google Scholar] [CrossRef]
- Beeren, C. Application of descriptive sensory analysis to food and drink products Chapter 18. In Descriptive Analysis in Sensory Evaluation; Sarah, E., Kemp, S.E., Hort, J., Hollowood, T., Eds.; John Wiley & Sons Ltd.: Chichester, UK, 2018; pp. 633–638. [Google Scholar]
- Jamir, S.M.R.; Stelick, A.; Dando, R. Cross-cultural examination of a product of differing familiarity (Hard Cider) by American and Chinese panelists using rapid profiling techniques. Food Qual. Prefer. 2020, 79, 103783. [Google Scholar] [CrossRef]
- Lawless, H.T. Descriptive analysis of complex odors: Reality, model or illusion? Food Qual. Prefer. 1992, 10, 325–332. [Google Scholar] [CrossRef]
- Dairou, V.; Sieffermann, J. A comparison of 14 jams characterized by conventional profile and a quick original method, the flash profile. J. Food Sci. 2002, 62, 826–834. [Google Scholar] [CrossRef]
- Fleming, E.E.; Ziegler, G.R.; Hayes, J.E. Check-all-that-apply (CATA), sorting, and polarized sensory positioning (PSP) with astringent stimuli. Food Qual. Prefer. 2015, 45, 41–49. [Google Scholar] [CrossRef] [PubMed]
- Ares, G.; Bruzzone, F.; Vidal, L.; Cadena, R.S.; Giménez, A.; Pineau, B.; Hunter, D.C.; Paisley, A.G.; Jaeger, S.R. Evaluation of a rating-based variant of check-all-that-apply questions: Rate-all-that-apply (RATA). Food Qual. Prefer. 2014, 36, 87–95. [Google Scholar] [CrossRef]

| Samples | Sweet Pumpkin Content (%) and Origin | Ingredients |
|---|---|---|
| P1 | 24 (China) | Sweet pumpkin dice 8%, chestnut dice 4.2%, soybean 4%, sugar, etc. |
| P2 | 26.42 (China) | Pumpkin 10.71%, red bean flakes 1.87%, rice flour, sugar, etc. |
| P3 | 43 (China) | Powdered cream (cream, refined salt), specified honey 0.5%, sugar, etc. |
| P4 | 48.89 (China) | Sweet pumpkin paste [sweet pumpkin puree, white bean paste (soybean paste)], red bean 1.48%, sugar processed products, xanthan gum, sugar, etc. |
| P5 | 40 (China) | Sweet pumpkin paste, mixed milk, sugar, etc. |
| P6 | 34 (Foreign origin/Vietnam, China, New Zealand, etc.) | Sweet red bean paste 3.8% (red bean 51%, sugar), rice grits, vitamin C, sugar, etc. |
| Attribute | Definition | Reference (Intensity) | |
|---|---|---|---|
| Appearance | Yellow color | Intensity of the yellow color of sweet pumpkin porridge | - |
| Brown color | Intensity of the brown color of sweet pumpkin porridge | - | |
| Appearance of viscosity | Intensity of the appearance of the viscosity of sweet pumpkin porridge | - | |
| Gloss | Intensity of the gloss of sweet pumpkin porridge | - | |
| Turbidity | Intensity of the turbidity of sweet pumpkin porridge | - | |
| Aroma | Sweet pumpkin | Intensity of the sweet pumpkin aroma of sweet pumpkin porridge | Steamed sweet pumpkin (9) |
| Sweet | Intensity of the sweet aroma of sweet pumpkin porridge | Granola cereal (6) (Kellogg, Battle Creek, MI, USA) | |
| Gelatinized starch | Intensity of the gelatinized starch aroma of sweet pumpkin porridge | Rice gruel (Hetbahn, CJ Cheiljedang, Seoul, Republic of Korea) (6) | |
| Sour | Intensity of the sour aroma of sweet pumpkin porridge | Minced dill pickles (4.5) (Rio santo, YONCA FOOD, Turkiye) | |
| Flavor | Sweet | Intensity of the sweet taste of sweet pumpkin porridge | 2%, 4% Sucrose solution (4), (6) |
| Salty | Intensity of the salty taste of sweet pumpkin porridge | 2%, 4% NaClsolution (3), (5) | |
| Sour | Intensity of the sour taste of sweet pumpkin porridge | 2.5%, 4% citric acid solution (3), (5) | |
| Gelatinized starch | Intensity of the gelatinized starch flavor of sweet pumpkin porridge | Rice gruel (Hetbahn, CJ Cheiljedang, Seoul, Republic of Korea) (8) | |
| Sweet pumpkin | Intensity of the sweet pumpkin flavor of sweet pumpkin porridge | Steamed sweet pumpkin (9) | |
| Milk | Intensity of the milk flavor of sweet pumpkin porridge | Whole milk (7.5) (Seoul Milk, Seoul, Republic of Korea) | |
| Mouthfeel | Chalky coating | Intensity of the chalky coating of milk of sweet pumpkin porridge | Greek yogurt, plain (5.5) (Ildong Foodis Co., Ltd., Republic of Korea) |
| Residual | Intensity of the aroma or flavor remaining in the mouth after tasting sweet pumpkin porridge | Carrot cube, 2 × 2 cm (5) | |
| Smooth swallowing | Intensity of the smooth swallowing of sweet pumpkin porridge | Water (8), Yogurt (13) (Maeil Dairy Industry Co., Ltd., Republic of Korea) | |
| Viscosity | Intensity of the thickness felt when holding the sweet pumpkin porridge in the mouth | Whipped cream (5.5) (Président, France) | |
| Graininess | Grains chewed using teeth when tasting sweet pumpkin porridge | Sweet pumpkin porridge (3.5) (Somemeal, Ganghwadream Co., Ltd., Republic of Korea), Sweet pumpkin porridge (Choroc Co., Ltd., Republic of Korea) (6.5) |
| Attribute | P1 | P2 | P3 | P4 | P5 | P6 | p-Value |
|---|---|---|---|---|---|---|---|
| Appearance | |||||||
| Yellow color | 6.2 d | 8.4 b | 6.0 d | 7.3 c | 11.0 a | 11.4 a | <0.0001 |
| Brown color | 8.4 a | 4.3 d | 7.0 b | 5.9 c | 2.5 e | 0.4 f | <0.0001 |
| Appearance Viscosityt | 8.0 ab | 7.6 b | 8.4 a | 8.1 ab | 4.8 c | 4.9 c | <0.0001 |
| Gloss | 5.0 c | 5.1 c | 3.7 d | 8.0 a | 7.1 b | 7.6 ab | <0.0001 |
| Turbidity | 4.9 b | 4.8 b | 6.5 a | 4.0 c | 4.5 bc | 2.5 d | <0.0001 |
| Aroma | |||||||
| Sweet pumpkin | 7.8 b | 10.0 a | 6.8 c | 8.4 b | 8.2 b | 6.0 d | <0.0001 |
| Sweet | 5.5 a | 4.7 b | 4.0 c | 4.3 bc | 4.9 ab | 4.8 b | <0.0001 |
| Gelatinized starch | 2.5 a | 1.1 b | 2.8 a | 2.2 a | 1.5 b | 2.2 a | <0.0001 |
| Sour | 0.5 c | 1.5 b | 2.7 a | 3.0 a | 1.5 b | 1.8 b | <0.0001 |
| Flavor | |||||||
| Sweet | 7.6 a | 7.8 a | 2.3 d | 5.6 c | 6.5 b | 7.8 a | <0.0001 |
| Salty | 1.1 cd | 1.5 c | 3.0 a | 2.1 b | 2.4 b | 1.0 d | <0.0001 |
| Sour | 0.4 d | 2.1 c | 3.3 b | 5.1 a | 2.3 c | 1.9 c | <0.0001 |
| Gelatinized starch | 2.5 b | 3.1 ab | 3.2 a | 0.8 c | 1.2 c | 2.8 ab | <0.0001 |
| Sweet pumpkin | 7.4 b | 9.9 a | 4.9 d | 6.5 c | 7.0 bc | 6.4 c | <0.0001 |
| Milk | 0.6 c | 1.8 a | 0.4 c | 1.3 b | 2.1 a | 1.1 b | <0.0001 |
| Mouthfeel | |||||||
| Chalky coating | 6.4 b | 2.1 d | 8.1 a | 1.3 e | 5.6 c | 2.3 d | <0.0001 |
| Residual | 8.2 a | 1.9 e | 6.6 b | 1.7 e | 4.5 c | 3.6 d | <0.0001 |
| Smooth swallowing | 2.5 c | 7.6 b | 3.1 c | 11.9 a | 7.0 b | 6.8 b | <0.0001 |
| Viscosity | 6.9 bc | 7.9 a | 7.6 ab | 7.9 a | 5.9 d | 6.3 cd | <0.0001 |
| Graininess | 9.5 a | 2.0 d | 3.4 c | 1.1 e | 2.6 d | 4.9 b | <0.0001 |
| Attribute | P1 | P2 | P3 | P4 | P5 | P6 | p-Value |
|---|---|---|---|---|---|---|---|
| Appearance | |||||||
| Brown color | 49 a | 28 b | 36 ab | 30 b | 5 c | 0 c | <0.0001 |
| Yellow color | 30 b | 49 a | 28 b | 29 b | 59 a | 60 a | <0.0001 |
| Gloss | 32 cd | 33 bcd | 25 d | 48 a | 43 abc | 46 ab | <0.0001 |
| Turbidity | 30 a | 29 a | 36 a | 23 ab | 26 ab | 13 b | <0.0001 |
| Thickness | 47 a | 41 ab | 51 a | 48 a | 24 c | 30 bc | <0.0001 |
| Aroma | |||||||
| Sweet pumpkin | 45 ab | 56 a | 38 b | 48 ab | 46 ab | 35 b | <0.0001 |
| Sweet | 33 a | 26 a | 19 a | 21 a | 28 a | 27 a | 0.081 |
| Sour | 5 b | 16 ab | 23 a | 25 a | 16 ab | 19 ab | 0.001 |
| Gelatinized starch | 25 ab | 12 b | 28 a | 23 ab | 18 ab | 23 ab | 0.029 |
| Flavor | |||||||
| Sweet pumpkin | 40 abc | 54 a | 28 c | 39 bc | 44 ab | 37 bc | <0.0001 |
| Sweet | 43 a | 45 a | 17 c | 28 bc | 36 ab | 45 a | <0.0001 |
| Salt | 7 ab | 10 ab | 18 a | 13 ab | 16 ab | 6 b | 0.012 |
| Sour | 1 c | 16 ab | 22 ab | 26 a | 13 abc | 12 bc | <0.0001 |
| Gelatinized starch | 15 ab | 21 a | 23 a | 7 b | 11 ab | 19 ab | 0.003 |
| Milk | 5 a | 10 a | 4 a | 9 a | 14 a | 8 a | 0.090 |
| Mouthfeel | |||||||
| Residual | 48 a | 14 c | 37 ab | 13 c | 27 bc | 19 c | <0.0001 |
| Chalky coating | 36 a | 13 b | 42 a | 6 b | 32 a | 15 b | <0.0001 |
| Thickness | 36 ab | 42 a | 27 b | 9 c | 24 b | 37 ab | <0.0001 |
| Graininess | 49 a | 10 bc | 17 bc | 4 c | 13 bc | 23 b | <0.0001 |
| Smooth swallowing | 12 d | 38 b | 18 cd | 55 a | 35 b | 32 bc | <0.0001 |
| Attribute | P1 | P2 | P3 | P4 | P5 | P6 |
|---|---|---|---|---|---|---|
| Appearance | ||||||
| Brown color | +0.511 | −0.075 | +0.495 | +0.058 | −0.725 b | −0.830 b |
| Yellow color | −0.452 | +0.280 | −0.613 | −0.127 | +0.703 | +0.828 a |
| Gloss | −0.628 | −0.040 | −0.636 | +0.622 | +0.331 | +0.657 |
| Turbidity | +0.137 | −0.021 | +0.786 a | −0.061 | −0.191 | −0.906 b |
| Thickness | −0.042 | −0.084 | +0.578 | +0.523 | −0.876 b | −0.533 |
| Aroma | ||||||
| Sweet pumpkin | −0.490 | +0.717 a | −0.440 | +0.566 | +0.098 | −0.137 |
| Sweet | +0.361 | +0.010 | −0.830 b | −0.412 | +0.485 | +0.551 |
| Sour | −0.908 b | +0.000 | +0.221 | +0.775 a | −0.083 | +0.209 |
| Gelatinized starch | −0.008 | −0.835 b | +0.498 | +0.228 | −0.312 | +0.038 |
| Flavor | ||||||
| Sweet pumpkin | −0.397 | +0.804 a | −0.768 b | +0.228 | +0.345 | +0.304 |
| Sweet | +0.038 | +0.459 | −0.908 b | −0.200 | +0.264 | +0.719 a |
| Salt | −0.508 | −0.212 | +0.580 | +0.348 | +0.270 | −0.429 |
| Sour | −0.864 b | +0.109 | +0.298 | +0.841 a | −0.173 | −0.062 |
| Gelatinized starch | −0.030 | +0.279 | +0.420 | −0.443 | −0.264 | +0.202 |
| Milk | −0.585 | +0.319 | −0.631 | +0.283 | +0.782 a | +0.373 |
| Mouthfeel | ||||||
| Residual | +0.813 a | −0.690 | +0.502 | −0.658 | −0.039 | −0.426 |
| Chalky coating | +0.509 | −0.579 | +0.658 | −0.663 | +0.216 | −0.416 |
| Thickness | +0.280 | +0.465 | −0.213 | −0.702 | +0.003 | +0.431 |
| Graininess | +0.915 a | −0.436 | −0.024 | −0.705 | −0.155 | +0.008 |
| Smooth swallowing | −0.833 b | +0.326 | −0.441 | +0.875 a | +0.117 | +0.295 |
| Attribute | P1 | P2 | P3 | P4 | P5 | P6 | p-Value |
|---|---|---|---|---|---|---|---|
| Appearance | |||||||
| Brown color | 2.9 a | 1.5 cd | 2.4 ab | 2.0 bc | 0.8 de | 0.1 e | <0.0001 |
| Yellow color | 2.2 bc | 3.0 b | 2.2 c | 2.5 bc | 3.9 a | 4.0 a | <0.0001 |
| Gloss | 1.8 bc | 1.8 abc | 1.4 c | 2.7 a | 2.4 ab | 2.6 ab | <0.0001 |
| Turbidity | 1.8 ab | 1.8 ab | 2.2 a | 1.4 ab | 1.6 ab | 1.0 b | 0.014 |
| Thickness | 1.9 bcd | 3.2 a | 2.6 ab | 1.1 d | 1.5 cd | 2.1 bc | <0.0001 |
| Aroma | |||||||
| Sweet pumpkin | 2.7 ab | 3.4 a | 2.3 b | 2.9 ab | 2.8 ab | 2.2 b | 0.000 |
| Sweet | 1.9 a | 1.6 a | 1.5 a | 1.6 a | 1.7 a | 1.7 a | 0.805 |
| Sour | 0.2 b | 0.5 ab | 0.9 a | 1.0 a | 0.6 ab | 0.7 ab | 0.006 |
| Gelatinized starch | 0.8 a | 0.5 a | 1.0 a | 0.8 a | 0.6 a | 0.7 a | 0.412 |
| Flavor | |||||||
| Sweet pumpkin | 2.5 b | 3.4 a | 1.8 b | 2.2 b | 2.4 b | 2.3 b | <0.0001 |
| Sweet | 2.6 a | 2.7 a | 0.9 b | 2.0 a | 2.3 a | 2.7 a | <0.0001 |
| Salt | 0.4 a | 0.6 a | 1.0 a | 0.7 a | 0.8 a | 0.4 a | 0.101 |
| Sour | 0.1 c | 0.8 b | 1.1 ab | 1.7 a | 0.9 b | 0.7 bc | <0.0001 |
| Gelatinized starch | 0.8 a | 1.0 a | 1.0 a | 0.3 a | 0.5 a | 0.9 a | 0.019 |
| Milk | 0.2 ab | 0.6 a | 0.1 b | 0.4 ab | 0.7 a | 0.3 ab | 0.007 |
| Mouthfeel | |||||||
| Residual | 2.9 a | 0.8 d | 2.3 ab | 0.7 d | 1.6 bc | 1.4 cd | <0.0001 |
| Chalky coating | 2.2 ab | 0.7 c | 2.8 a | 0.5 c | 1.9 b | 0.8 c | <0.0001 |
| Thickness | 1.7 bc | 2.8 a | 1.8 b | 0.7 d | 0.8 cd | 2.0 ab | <0.0001 |
| Graininess | 3.3 a | 0.7 cd | 1.3 bc | 0.4 d | 0.8 cd | 1.7 b | <0.0001 |
| Smooth swallowing | 0.9 c | 2.6 b | 1.1 c | 4.1 a | 2.5 b | 2.4 b | <0.0001 |
| Attribute | Number of Citations | Attribute | Number of Citations |
|---|---|---|---|
| Brightness | 3 | Gelatinized starch_F * | 3 |
| Brown color * | 23 | Light_F | 1 |
| Gloss * | 12 | Milk_F * | 1 |
| Intensity of viscosity * | 1 | Nutty_F | 1 |
| Orange color | 1 | Salty_F | 5 |
| Thickness * | 6 | Savory_F | 6 |
| Thinness * | 18 | Sour_F | 29 |
| Transparent | 3 | Sweet potato_F | 1 |
| Turbidity * | 2 | Sweet pumpkin_F * | 21 |
| Visible particles | 14 | Sweet_F * | 54 |
| White color | 1 | After aroma | 1 |
| Yellow color * | 30 | After taste | 1 |
| Burnt_A | 1 | Astringent | 6 |
| Curry_A | 1 | Chalky coating * | 24 |
| Gelatinized starch_A * | 1 | Graininess * | 37 |
| Mustard_A | 1 | Intensity of viscosity * | 14 |
| Savory_A | 1 | Lumpy | 5 |
| Sour_A * | 2 | Moistness | 3 |
| Sweet pumpkin_A * | 24 | Residual * | 28 |
| Sweet_A * | 10 | Slipperiness | 1 |
| Bean_F | 1 | Smooth swallowing * | 4 |
| Bitter_F | 14 | Softness | 6 |
| Burnt_F | 1 | Sticky * | 4 |
| Butter_F | 1 | Thickness * | 26 |
| Fatty_F | 2 | ||
| Fishy_F | 1 | ||
| Fresh_F | 1 |
| Attribute | P1 | P2 | P3 | P4 | P5 | P6 | ||||||||||||
|---|---|---|---|---|---|---|---|---|---|---|---|---|---|---|---|---|---|---|
| SSI 1 | N 2 | AP 3 | SSI | N | AP | SSI | N | AP | SSI | N | AP | SSI | N | AP | SSI | N | AP | |
| Appearance | ||||||||||||||||||
| Brown color | 0.265 | 22 | 2.5 | 0.080 | 8 | 2.9 | 0.169 | 17 | 3.0 | 0.133 | 12 | 2.5 | 0.022 | 4 | 3.8 | 0.007 | 1 | 4.0 |
| Orange color | 0.015 | 1 | 2.0 | 0.028 | 2 | 1.5 | 0.023 | 2 | 3.5 | 0.023 | 3 | 4.3 | - | - | - | - | - | - |
| Turbidity | 0.041 | 4 | 2.5 | 0.004 | 1 | 4.0 | 0.037 | 3 | 2.7 | 0.006 | 1 | 3.0 | 0.002 | 2 | 7.0 | 0.017 | 1 | 1.0 |
| Visible particles | 0.148 | 12 | 2.8 | 0.160 | 14 | 2.2 | 0.012 | 1 | 3.0 | 0.025 | 2 | 2.0 | 0.007 | 1 | 4.0 | 0.161 | 14 | 2.7 |
| Yellow color | 0.272 | 21 | 2.1 | 0.187 | 16 | 2.4 | 0.280 | 20 | 1.9 | 0.301 | 23 | 2.0 | 0.434 | 35 | 2.0 | 0.544 | 40 | 1.9 |
| White color | - | - | - | - | - | - | - | - | - | - | - | - | 0.010 | 1 | 3.0 | 0.027 | 3 | 2.5 |
| Darkness | 0.017 | 1 | 1.0 | - | - | - | 0.029 | 3 | 4.0 | - | - | - | - | - | - | 0.015 | 1 | 2.0 |
| Aroma | ||||||||||||||||||
| Gelatinized starch | 0.036 | 4 | 3.8 | 0.070 | 7 | 3.3 | 0.061 | 4 | 2.0 | 0.011 | 1 | 2.0 | 0.025 | 2 | 2.5 | 0.051 | 5 | 2.8 |
| Sour | - | - | - | 0.011 | 3 | 2.0 | - | - | - | - | - | - | - | - | - | - | - | - |
| Sweet pumpkin | 0.233 | 18 | 2.3 | 0.285 | 20 | 2.0 | 0.298 | 22 | 2.2 | 0.252 | 20 | 2.2 | 0.272 | 19 | 1.8 | 0.177 | 16 | 3.1 |
| Sweet | 0.066 | 6 | 3.0 | 0.122 | 9 | 2.0 | 0.041 | 3 | 2.7 | 0.054 | 4 | 1.8 | 0.049 | 4 | 2.5 | 0.078 | 5 | 1.8 |
| Flavor | ||||||||||||||||||
| Artificial | - | - | - | - | - | - | - | - | - | 0.003 | 3 | 5.0 | - | - | - | - | - | - |
| Bitter | 0.045 | 4 | 2.5 | 0.033 | 3 | 3.7 | 0.055 | 5 | 2.4 | 0.071 | 7 | 2.9 | - | - | - | 0.017 | 1 | 1.0 |
| Gelatinized starch | 0.044 | 5 | 3.6 | 0.035 | 4 | 3.8 | 0.008 | 1 | 5.0 | 0.007 | 1 | 5.0 | 0.017 | 2 | 4.0 | 0.052 | 8 | 5.4 |
| Milk | 0.028 | 2 | 2.0 | 0.011 | 1 | 2.0 | 0.024 | 2 | 3.0 | 0.010 | 2 | 3.5 | 0.102 | 9 | 2.7 | 0.025 | 2 | 2.0 |
| Red bean | 0.011 | 1 | 2.0 | - | - | - | - | - | - | - | - | - | 0.017 | 1 | 1.0 | 031 | 3 | 4.3 |
| Salty | 0.033 | 4 | 5.0 | 0.038 | 6 | 4.5 | 0.081 | 7 | 3.3 | 0.078 | 7 | 2.6 | 0.033 | 4 | 4.0 | 0.010 | 2 | 7.0 |
| Savory | - | - | - | 0.011 | 1 | 2.0 | - | - | - | - | - | - | 0.017 | 2 | 1.0 | 0.037 | 3 | 2.3 |
| Sour | - | - | - | 0.099 | 11 | 3.5 | 0.144 | 15 | 3.6 | 0.132 | 12 | 2.8 | 0.111 | 12 | 3.6 | 0.069 | 8 | 4.0 |
| Sweet potato | 0.013 | 3 | 6.5 | - | - | - | - | - | - | - | - | - | - | - | - | - | - | - |
| Sweet pumpkin | 0.180 | 19 | 3.0 | 0.152 | 18 | 3.2 | 0.263 | 21 | 2.7 | 0.292 | 29 | 2.6 | 0.232 | 23 | 2.8 | 0.177 | 19 | 3.3 |
| Sweet | 0.319 | 32 | 3.0 | 0.346 | 33 | 2.7 | 0.229 | 21 | 3.2 | 0.309 | 30 | 2.7 | 0.340 | 29 | 2.3 | 0.399 | 41 | 2.9 |
| Water | - | - | - | - | - | - | - | - | - | 0.030 | 2 | 2.7 | - | - | - | 0.030 | 3 | 1.5 |
| Mouthfeel | ||||||||||||||||||
| Chalky coating | 0.135 | 15 | 3.3 | 0.074 | 6 | 2.0 | 0.199 | 19 | 3.5 | 0.033 | 4 | 3.3 | 0.137 | 16 | 3.6 | 0.034 | 3 | 2.0 |
| Graininess | 0.166 | 20 | 3.3 | 0.017 | 1 | 1.0 | 0.049 | 5 | 3.2 | 0.030 | 3 | 3.0 | 0.114 | 12 | 3.3 | 0.123 | 10 | 3.2 |
| Hard swallowing | 0.015 | 2 | 5.5 | 0.003 | 1 | 6.0 | 0.009 | 1 | 2.0 | - | - | - | 0.023 | 5 | 4.8 | - | - | - |
| Intensity of viscosity | - | - | - | 0.013 | 1 | 2.0 | 0.015 | 2 | 3.5 | - | - | - | 0.017 | 1 | 1.0 | 0.030 | 3 | 2.7 |
| Lumpy | 0.074 | 5 | 1.4 | 0.017 | 2 | 2.5 | - | - | - | - | - | - | 0.006 | 1 | 5.0 | - | - | - |
| Residual | 0.041 | 5 | 4.8 | 0.032 | 3 | 2.3 | 0.032 | 5 | 5.0 | 0.018 | 3 | 3.7 | 0.033 | 5 | 4.0 | 0.023 | 4 | 4.0 |
| Slipperiness | - | - | - | 0.027 | 2 | 2.5 | - | - | - | 0.002 | 1 | 8.0 | - | - | - | 0.025 | 3 | 4.7 |
| Smooth swallowing | 0.017 | 1 | 1.0 | 0.036 | 5 | 2.8 | 0.009 | 1 | 2.0 | 0.063 | 8 | 3.5 | 0.044 | 4 | 2.3 | 0.030 | 4 | 4.8 |
| Softness | 0.017 | 2 | 3.5 | 0.031 | 4 | 3.3 | 0.006 | 1 | 3.0 | 0.070 | 7 | 3.1 | 0.026 | 4 | 4.0 | 0.017 | 2 | 3.5 |
| Time to Complete (min) 1 | Difficulty of Test | Tediousness of Test | |
|---|---|---|---|
| CATA | 11.7 c | 2.5 b | 1.6 bc |
| RATA | 15.8 b | 2.5 b | 1.4 c |
| FP | 15.8 b | 2.6 b | 1.7 ab |
| FL | 22.7 a | 3.1 a | 2.0 a |
| Pr > F (Model) | <0.0001 | 0.019 | 0.000 |
Disclaimer/Publisher’s Note: The statements, opinions and data contained in all publications are solely those of the individual author(s) and contributor(s) and not of MDPI and/or the editor(s). MDPI and/or the editor(s) disclaim responsibility for any injury to people or property resulting from any ideas, methods, instructions or products referred to in the content. |
© 2023 by the authors. Licensee MDPI, Basel, Switzerland. This article is an open access article distributed under the terms and conditions of the Creative Commons Attribution (CC BY) license (https://creativecommons.org/licenses/by/4.0/).
Share and Cite
Kim, D.; Kwak, H.; Lim, M.; Lee, Y. Comparison of Check-All-That-Apply (CATA), Rate-All-That-Apply (RATA), Flash Profile, Free Listing, and Conventional Descriptive Analysis for the Sensory Profiling of Sweet Pumpkin Porridge. Foods 2023, 12, 3556. https://doi.org/10.3390/foods12193556
Kim D, Kwak H, Lim M, Lee Y. Comparison of Check-All-That-Apply (CATA), Rate-All-That-Apply (RATA), Flash Profile, Free Listing, and Conventional Descriptive Analysis for the Sensory Profiling of Sweet Pumpkin Porridge. Foods. 2023; 12(19):3556. https://doi.org/10.3390/foods12193556
Chicago/Turabian StyleKim, DaEun, HanSub Kwak, Manyoel Lim, and Youngseung Lee. 2023. "Comparison of Check-All-That-Apply (CATA), Rate-All-That-Apply (RATA), Flash Profile, Free Listing, and Conventional Descriptive Analysis for the Sensory Profiling of Sweet Pumpkin Porridge" Foods 12, no. 19: 3556. https://doi.org/10.3390/foods12193556