Abstract
SWATHtoMRM technology was used in this experiment to further identify and trace the sources of Dendrobium devonianum and Dendrobium officinale produced in the same area using TOF and MS-MRM. After the conversion of the R package of SWATHtoMRM, 191 MRM pairs of positive ions and 96 pairs of negative ions were obtained. Dendrobium devonianum and Dendrobium officinale can be separated very well using the PCA and PLS-DA analysis of MRM ion pairs; this shows that there are obvious differences in chemical composition between Dendrobium devonianum and Dendrobium officinale, which clearly proves that the pseudotargeted metabolomics method based on SWATHtoMRM can be used for traceability identification research. A total of 146 characteristic compounds were obtained, with 20 characteristic compounds in Dendrobium devonianum. The enrichment pathways of the characteristic compounds were mainly concentrated in lipids and atherosclerosis, chagas disease, fluid shear stress and atherosclerosis, proteoglycans in cancer, the IL-17 signaling pathway, the sphingolipid signaling pathway, diabetic cardiomyopathy, arginine and proline metabolism, etc., among which the lipid and atherosclerosis pathways were more enriched, and 11 characteristic compounds affected the expression levels of IL-1, TNFα, CD36, IL-1β, etc. These can be used as a reference for research on variety improvement and active substance accumulation in Dendrobium devonianum and Dendrobium officinale.
1. Introduction
Dendrobium devonianum is a characteristic Chinese herbal medicine produced in the Longling area of Yunnan, China, and it is also a Chinese plant that can be eaten as food [1,2,3]. Dendrobium devonianum has good biological health effects [4,5], and the geographical location where it grows has a large impact on it. Among them, the Longling area produces nationally important products, but the Dendrobium devonianum that grows in other parts of Yunnan is not a notable product [6]. In order to counterfeit Dendrobium devonianum produced in the Longling area of Yunnan, Dendrobium officinale is often planted in the Longling area and sold as Dendrobium devonianum. Although the appearance and shape of Dendrobium devonianum and Dendrobium officinale produced in the Longling area are different, it is difficult to identify when it is dried or crushed into a powder, which seriously affects the quality evaluation and origin traceability of Dendrobium devonianum [7]. Therefore, it is essential to establish an effective Dendrobium devonianum traceability technology.
High-resolution mass spectrometry is one of the commonly used and effective traceability technologies [8,9,10,11]. In our laboratory, TOF and UPLC-PDA have also been used to trace the origins of Dendrobium devonianum and Dendrobium officinale produced in the same area; Dendrobium devonianum and Dendrobium officinale can be better distinguished through relevant PCA and VIP analyses, etc., but the number of confirmed differential markers obtained was small, and the amount of characteristic information about the differential markers was low [7,12]. This also shows that, although they have a wide coverage, TOF or UPLC-PDA have a dynamic range, quantitative accuracy, and significantly reduced sensitivity, and the final characteristic information total obtained is less [13,14,15].
With the emergence of sequential windowed acquisition of all theoretical fragment ions to multiple reaction monitoring (SWATHtoMRM) technology, the problems of the low sensitivity of mass spectrometry in full scan mode and accuracy and reliability in the process of structure identification have been effectively solved. Through a non-targeted analysis of SWATH data, the generation of MRM ion pair information, and the targeted analysis of each correlated MRM ion pair, SWATHtoMRM technology combines the powerful qualitative ability of SWATH technology with the precise quantitative ability of MRM technology to achieve high coverage and accurate quantification of known and unknown metabolites detected in a non-targeted analysis [16]. At present, this has been widely used in metabolomics, foodomics, etc. [17,18,19].
In order to obtain as much information as possible about the characteristic compounds in Dendrobium devonianum produced in the Longling area of Yunnan, SWATHtoMRM technology was used in this experiment to further identify and trace the sources of Dendrobium devonianum and Dendrobium officinale produced in the same area using TOF and MS-MRM to analyze the known and unknown metabolites in Dendrobium devonianum and Dendrobium officinale to obtain more information on the characteristic metabolites in Dendrobium devonianum.
2. Materials and Methods
2.1. Sample Collection and Preparation
Twenty-six samples of Dendrobium devonianum and Dendrobium officinale, thirteen each, were collected from the Longling area of Yunnan, China, in 2020. Each collected sample was composed of 10 fresh branches, kept under the same growth condition. The branches were cut into lengths of about 5 cm, dried at 60 °C, crushed at a high speed, passed through a 0.28 μm sample sieve, and stored in the laboratory at 4 °C in the dark.
2.2. Chemicals and Reagents
HPLC-grade acetonitrile, isopropanol, and methanol were purchased from Merck (Darmstadt, Germany). HPLC-grade ammonium acetate and formic acid were purchased from DiKMA Technologies (Beijing, China). Ultrapure water was prepared using Elga’s water system (Wycombe, UK).
2.3. Sample Preparation and Analysis
2.3.1. Sample Preparation and Instrumental Method
First, 2 g of sample was placed into a 50 mL centrifuge tube, 20 mL of methanol–water solution (V:V = 90:10) was added and vortexed for 1 min, then ultrasonic was extracted for 30 min and centrifuged at 5000 r/min for 5 min, and the supernatant was filtered through a 0.22 μm filter membrane.
The SCIEX X500R QTOF system (Framingham, MS, USA) used was equipped with an ExionLC AD ultra-high-performance liquid chromatography (Framingham, MS, USA) and Waters ACQUITY UPLC BEH C18 column (2.1 × 100 mm, 1.7 μm, Waters, Milford, MA, USA). Referring to the relevant parameters in reference [7]: solvent A was 2 mM ammonium acetate in ultrapure water with 0.01% formic acid, and B was the mixed solution of acetonitrile, isopropanol, and water (V:V:V = 47.5:47.5:5) containing 2 mM formic acid and 0.01% formic acid. The flow rate for UPLC was 0.4 mL/min with the following gradients: 10% B (0~5.0 min), 10% B~50% B (5.0~6.0 min), 50% B~95% B (6.0~15.0 min), 95% B~100% B (15.0~20.0 min), 100% B (20.0~35.0 min), 100% B~5% B (35.0~35.1 min), and 5% B (35.1~40.0 min). The injection volume was 5 µL. Data were collected using primary and secondary mass spectrometry, among which the MS scan range was 100~1500 m/z, and the MS IDA scan range was 50~1500 m/z, CE = ±30 V.
2.3.2. MRM Data Collection
The wiff format of the sample data collected via TOF was converted to the mzXML format using MSConvert software (3.0.4140), and the R package (4.3.1) of SWATHtoMRM was used for the conversion of MRM transitions. Twenty-six samples were analyzed using the AB SCIEX 4500 system (Framingham, MS, USA). The same chromatographic column and gradient elution conditions as in QTOF-MS data collection were used, along with the converted MRM transition and schedule mode (MRM detection window: 50 s), where the DP was uniformly ±50 V and the collision energy was uniformly ±40 V. At the same time, the same volume of the extraction solution of each sample in this experiment was drawn and mixed to make a quality control sample (QC). During the sample analysis process, the analysis of QC samples was performed after every 5 samples to monitor the sensitivity and stability of the instrument and to perform a subsequent data analysis and correction.
2.3.3. Data Processing and Statistical Analysis
The ions whose response peak area was lower than 102 were deleted, and the ion pairs with a high response intensity were retained, which were analyzed using the peak area response of each ion pair of the QC sample. Lists of peak areas corresponding to MRM were imported into MetaboAnalyst (https://www.metaboanalyst.ca/ (accessed on 7 July 2023)) for a principal component analysis (PCA), ANOVA, false discovery rate (FDR), and VIP analysis to find differential MRM ion pairs. Differential MRM ion pairs were compared to TOF data using ion pair information and the peak time to obtain primary and secondary mass spectrum information of differential compounds, and the chemical structure was identified using the Natural Product s-TCM Library_1.0 established by SCIEX and the online ChemSpider database (HMDB, Massbank, Pubmed, etc.). In order to further analyze the possible signaling pathways affecting differential metabolites, the differential metabolites were imported into the MetaboAnalyst5.0 (https://www.metaboanalyst.ca/ (accessed on 7 July 2023)) online website to analyze the main enriched KEGG biosynthetic pathways.
3. Results
3.1. Analytical Characteristics of SWATHtoMRM Method
After the conversion of the R package of SWATHtoMRM, the ion pairs were obtained, in which the positive ions totaled 2439 pairs of MRMs and the negative ions totaled 601 pairs of MRMs (Supplementary File S1). From the m/z distribution of the parent ions in Figure 1, it can be seen that the MRM of the positive ions was mainly concentrated in the range of 300–600. After screening the ion pairs with the low-level response QC samples, 191 MRM pairs of positive ions and 96 pairs of negative ions were obtained (Supplementary File S2).
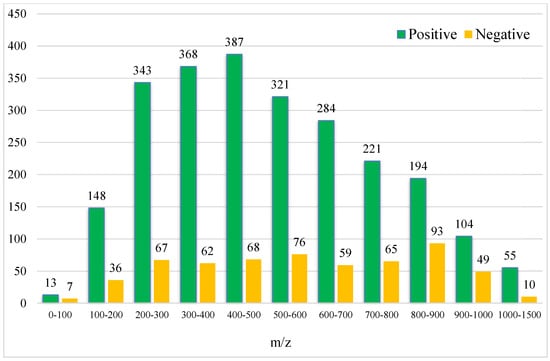
Figure 1.
Molecular weight distribution of compounds converted using SWATHtoMRM.
3.2. MRM Data Analysis
As can be seen from Figure 2, the MRM ion pairs obtained after screening were analyzed using a PCA, and the degree of polymerization of the QC was high, indicating that the data were stable and the quality was guaranteed. It can be seen that Dendrobium devonianum and Dendrobium officinale can be separated very well using a PCA analysis; this shows that there are obvious differences in the chemical composition between Dendrobium devonianum and Dendrobium officinale.
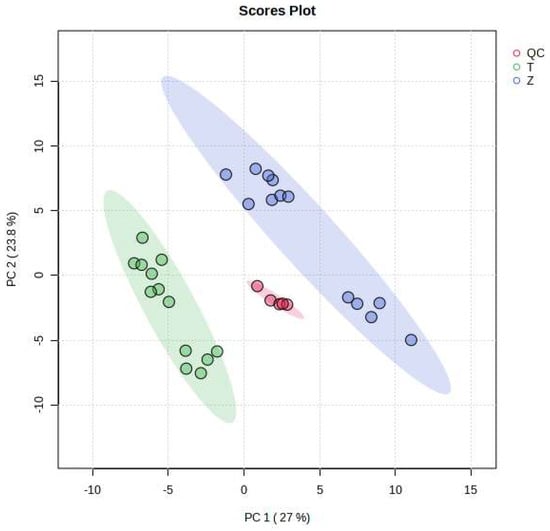
Figure 2.
Loading plots of PCA of Dendrobium devonianum and Dendrobium officinale (T: Dendrobium officinale, Z: Dendrobium devonianum, QC: QC samples).
The difference in the comparisons in this experiment is mainly reflected in the difference in the peak areas of the common components contained in Dendrobium devonianum and Dendrobium officinale. The two principal components, PC1 and PC2, accounted for 27.0% and 23.8% of the total difference, respectively, indicating that by comparing the difference in the peak area of the common components in Dendrobium devonianum and Dendrobium officinale, it is possible to effectively distinguish Dendrobium devonianum and Dendrobium officinale. It also shows that the ion pairs converted using SWATHtoMRM were analyzed via PCA, and the two Dendrobium samples were densely gathered together, which clearly proves that the pseudotargeted metabolomics method based on SWATHtoMRM can be used for traceability identification research.
On the other hand, PLS-DA was also used for the analysis, and the analysis results were consistent with the PCA, and Dendrobium devonianum and Dendrobium officinale can be separated well (Figure 3), as can be seen in the PLS-DA cross-validation data (Figure 4). R2 is the correlation coefficient of cross validation, and the values of components of 1–5 were 0.96224, 0.98362, 0.99473, 0.99767, and 0.99929, respectively, which were close to 1, indicating that their fitting degree was good. Q2 represents the predictive performance of the PLS-DA model, and Q2 was higher than 0.9, so it can be considered a very good model in this experiment.
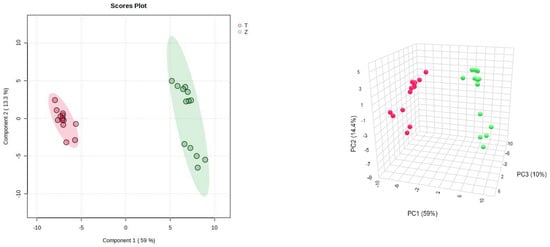
Figure 3.
PLS-DA score chart and model diagram of Dendrobium devonianum and Dendrobium officinale (T: Dendrobium officinale, red range; Z: Dendrobium devonianum, green range).
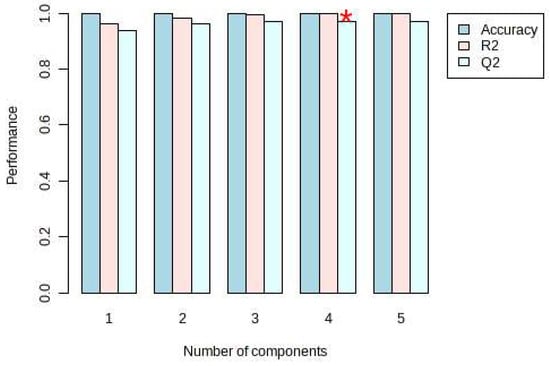
Figure 4.
PLS-DA cross validation details of Dendrobium devonianum and Dendrobium officinale. (* The Q2 value was 0.96961, which was also the largest).
3.3. ANOVA, FDR, and VIP Analysis
ANOVA, FDR, and VIP analyses were performed on the obtained MRM ion pairs, and the MRM ion pairs with a p-value < 0.01, FDR < 0.05, and VIP > 1 were selected as the ion pairs with large differences. A total of 146 characteristic compounds were obtained (Supplementary File S3).
As shown in Figure 5 and Figure 6, the retention time of the 146 characteristic compounds was mainly the range of 6–20 min, and the molecular weight was mainly concentrated between 200 and 300 and 500 and 700. According to the chromatographic conditions in Section 2.3.1, during a time period of 6–15 min, the organic phase was from 50 to 95%, and at 15–20 min, the organic phase was from 95 to 100%. The main elution components were medium and medium-to-small polar compounds, which were the same as the main components in Dendrobium, which were consistent with alkaloids, flavonoids, phenanthrenes, and bibenzyls [20].
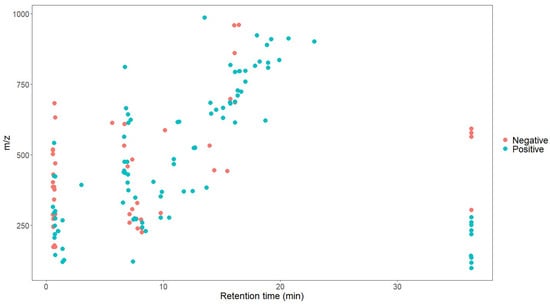
Figure 5.
Scatter plot of 146 characteristic compounds.
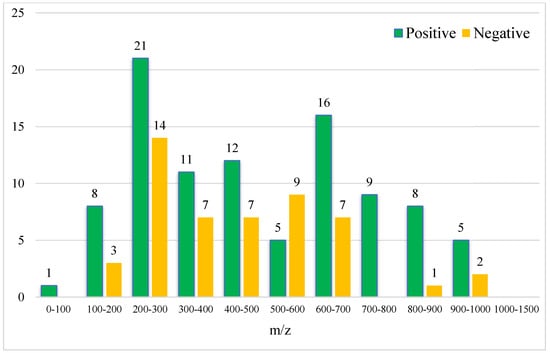
Figure 6.
Molecular weight distribution of 146 characteristic compounds (the numbers on the bar graph represent the number of characteristic compounds in that molecular weight range).
It can be seen from the analysis of the VIP scores (Figure 7), volcano map (Figure 8), and heat map (Figure 9) of the 50 compounds with large differences that, as shown in Table 1, there were 20 characteristic compounds in Dendrobium devonianum, the content of Dendrobium devonianum was larger than that of Dendrobium officinale, and the content of 30 characteristic compounds was smaller than that of Dendrobium officinale. The difference in the contents of the common compounds was the largest (p = 6.32 × 10⁻¹⁷), which may be the characteristic component of Dendrobium devonianum; the three differential compounds with a reduced content may be the characteristic components of Dendrobium officinale. As shown in Figure 10, the contents of the five characteristic compounds of Dendrobium devonianum and Dendrobium officinale were very different. The normalized concentrations of the five characteristic compounds were close to +1 and −1, respectively, and the difference can be clearly seen after normalization.
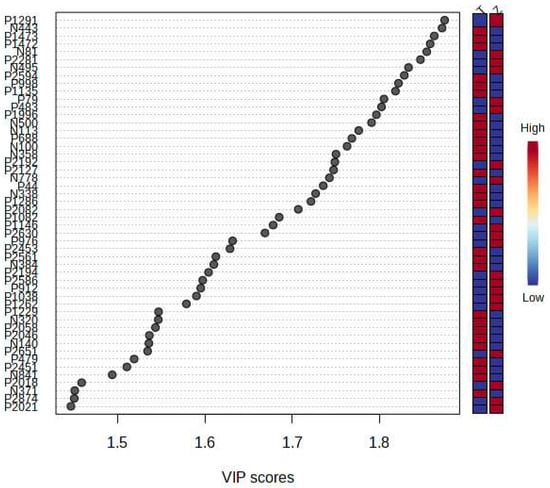
Figure 7.
The VIP scores of Dendrobium devonianum and Dendrobium officinale (T: Dendrobium officinale, Z: Dendrobium devonianum).
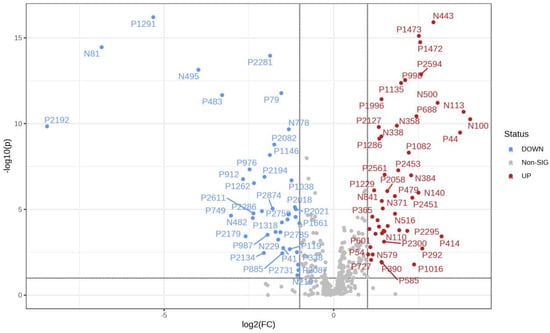
Figure 8.
A volcano plot of Dendrobium devonianum and Dendrobium officinale.
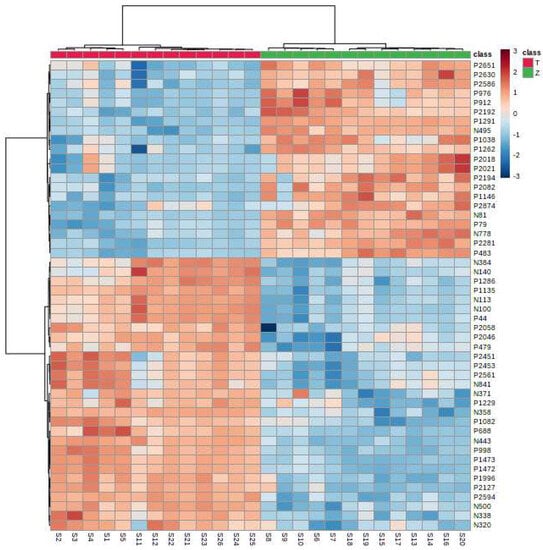
Figure 9.
A heatmap of Dendrobium devonianum (Z) and Dendrobium officinale (T).

Table 1.
Information on characteristic compounds.
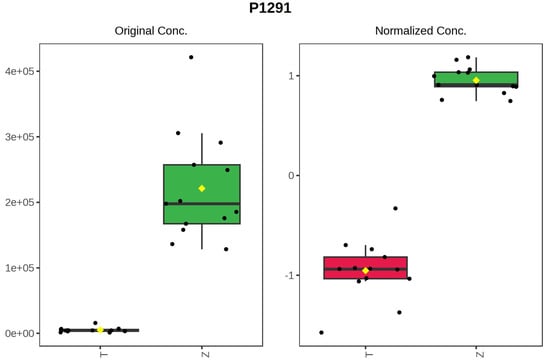
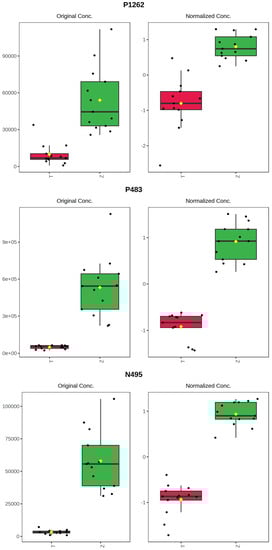
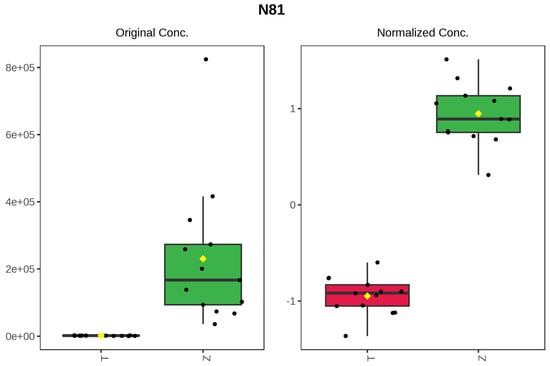
Figure 10.
Box plot of the five characteristic compounds (T: Dendrobium officinale, red range, Z: Dendrobium devonianum, green range).
3.4. Structural Identification of Characteristic Compounds
Using the Natural Products s-TCM Library_1.0 and online ChemSpider database, a total of 34 characteristic compounds were identified, including 20 in the positive ion mode and 14 in the negative ion mode, as shown in Table 2.
Table 2.
Information on characteristic compounds identified.
3.5. KEGG Pathway Analysis of Dendrobium devonianum and Dendrobium officinale
According to the 11 of the top 50 characteristic compounds with a confirmed chemical structure obtained above, a KEGG pathway analysis was performed, and the top 20 pathways with p ≤ 0.05 were selected for visual depiction. As shown in Figure 11, the enrichment pathways of the characteristic compounds were mainly concentrated in the lipids and atherosclerosis, chagas disease, fluid shear stress and atherosclerosis, proteoglycans in cancer, IL-17 signaling pathway, sphingolipid signaling pathway, diabetic cardiomyopathy, arginine and proline metabolism, etc., among which the lipid and atherosclerosis pathways were more enriched and 11 characteristic compounds could better affect the expression levels of IL-1, TNFα, CD36, IL-1β, etc. (Figure 12). On the other hand, this also proved that the metabolic processes of lipids and atherosclerosis can be better regulated by Dendrobium devonianum, which is consistent with the biological health effects of Dendrobium nobile reported in the literature [67,68,69], which can be used as a reference for future research on variety improvement and active substance accumulation in Dendrobium devonianum and Dendrobium officinale.
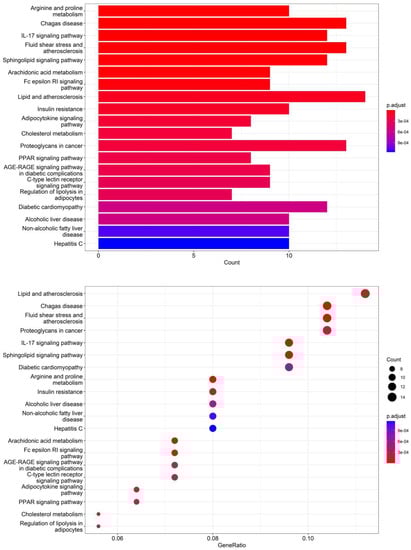
Figure 11.
Barplot and dotplot of the top 20 KEGG enrichment pathways based on 11 characteristic compounds.
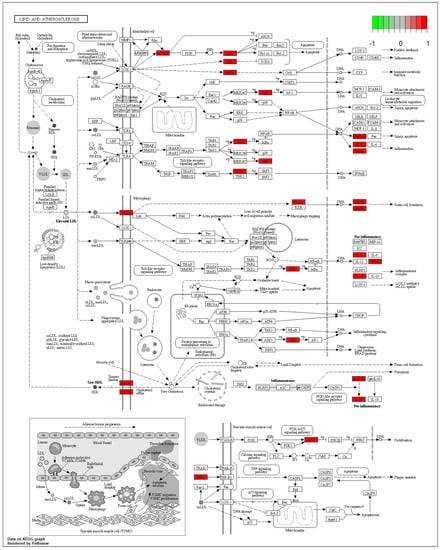
Figure 12.
Lipid and atherosclerosis metabolic pathway.
4. Conclusions
In this study, SWATHtoMRM technology was used in this experiment to further identify and trace the sources of Dendrobium devonianum and Dendrobium officinale produced in the same area using TOF and MS-MRM. After the conversion of the R package of SWATHtoMRM, the ion pairs were obtained, in which the positive ions totaled 2439 pairs of MRMs, and the negative ions totaled 601 pairs of MRMs. After screening the ion pairs with low-level response QC samples, 191 MRM pairs of positive ions and 96 pairs of negative ions were obtained. Dendrobium devonianum and Dendrobium officinale can be separated very well via a PCA analysis of MRM ion pairs; this shows that there are obvious differences in chemical composition between Dendrobium devonianum and Dendrobium officinale. The difference in the comparisons in this experiment mainly reflect the differences in the peak areas of the common components contained in Dendrobium devonianum and Dendrobium officinale. This also shows that the ion pairs converted using SWATHtoMRM were analyzed via PCA, and the two Dendrobium samples were densely gathered together, which clearly proves that the pseudotargeted metabolomics method based on SWATHtoMRM can be used for traceability identification research. On the other hand, Dendrobium devonianum and Dendrobium officinale can be separated well via PLS-DA, as can be seen through PLS-DA cross validation. The R2 values of components 1–5 were 0.96224, 0.98362, 0.99473, 0.99767, and 0.99929, respectively, which were close to 1, indicating that their fitting degree was good, and the Q2 was above 0.9, which indicates a very good model.
The ANOVA FDR and VIP analyses were performed on the obtained MRM ion pairs. A total of 146 characteristic compounds were obtained. There were 20 characteristic compounds in Dendrobium devonianum; the content of Dendrobium devonianum was larger than that of Dendrobium officinale; and the content of 30 characteristic compounds was smaller than that of Dendrobium officinale. The difference in the contents of the most common compounds was the largest (p = 6.32 × 10⁻¹⁷), which may represent the characteristic component of Dendrobium devonianum; three differential compounds with reduced contents may be the characteristic components of Dendrobium officinale. The enrichment pathways of the characteristic compounds were mainly concentrated in the lipids and atherosclerosis, chagas disease, fluid shear stress and atherosclerosis, proteoglycans in cancer, IL-17 signaling pathway, sphingolipid signaling pathway, diabetic cardiomyopathy, arginine and proline metabolism, etc., among which the lipid and atherosclerosis pathways were more enriched and 11 characteristic compounds could better affect the expression levels of IL-1, TNFα, CD36, IL-1β, etc., which can be used as a reference for future research on variety improvement and active substance accumulation in Dendrobium devonianum and Dendrobium officinale.
Supplementary Materials
The following supporting information can be downloaded at https://www.mdpi.com/article/10.3390/foods12193608/s1: Supplementary File S1: MRMTransition; Supplementary File S2: MRMTransition peak area; Supplementary File S3: Differential MRM.
Author Contributions
Conceptualization, T.L. and H.L.; methodology, T.L. and X.C.; software, L.C. and J.W.; validation, L.D. and Z.H.; formal analysis, X.C.; investigation, Z.L.; resources, J.W. and Z.H.; data curation, L.C.; writing—original draft preparation, T.L.; writing—review and editing, H.L. and Z.L.; supervision, H.L. and Z.L.; funding acquisition. All authors have read and agreed to the published version of the manuscript.
Funding
This study was funded by General Program of Natural Science Foundation of Yunnan Province, grant number 202001AT070017, Yunnan Province Agricultural Basic Research Joint Special Project, grant number 202301BD070001-049, Yunnan Academician Expert Workstation, grant number 202305AF150015, and Yunnan Key Research and Development, grant number 202102AE090021.
Data Availability Statement
The data used to support the findings of this study can be made available by the corresponding author upon request.
Conflicts of Interest
Author Long Cheng was employed by the company SCIEX Analytical Instrument Trading Co., Ltd., which had the role of mass spectrometry detection and data analysis in this study, without any potential conflict. The remaining authors declare that the research was conducted in the absence of any commercial or financial relationship that could be construed as a potential conflict of interest.
References
- Wu, B.-L.; Zhao, Z.-R.; Liu, H.; Jiao, D.; Wu, Y.-G. Research progress of Dendrobium devonianum. Chin. Tradit. Pat. Med. 2020, 42, 2990–2998. [Google Scholar]
- Wu, L.-L.; Ding, Y.-L.; Xie, Y.-F.; Chen, D.-Q.; Xu, H. Research on bibenzyl constituents and TLC identification of the stem of Dendrobium devoninum. Northwest Pharm. J. 2020, 35, 791–795. [Google Scholar]
- Available online: http://www.pbh.yn.gov.cn/wjwWebsite/web/doc/UU151669310662159294 (accessed on 7 July 2023).
- Zhan, R.; Zhang, X.-Y.; Li, Z.-Y.; Liu, B.; Chen, Y.-G. Immunosuppressive bibenzyl-phenylpropane hybrids from Dendrobium devonianum. Chem. Biodivers. 2023, 20, e202201185. [Google Scholar] [CrossRef]
- Li, J.; Zhang, X.; Li, Y.; Liu, B.; Zhan, R. Bibenzyls and lignans from Dendrobium devonianum and their immunosuppressive activities. Phytochem. Lett. 2023, 54, 137–140. [Google Scholar] [CrossRef]
- Geographical Indication Products-Dendrobium devonianum from Longling; Yunnan Provincial Bureau of Quality and Technical Supervision: Baoshan, China, 2014.
- Lin, T.; Chen, X.-L.; Wang, J.; Hu, Z.-X.; Wu, G.-W.; Sha, L.-J.; Cheng, L.; Liu, H.-C. Application of time of flight mass spectrometry in the identification of Dendrobium devonianum Paxt and Dendrobium officinale Kimura et Migo Grown in Longling Area of Yunnan, China. Separations 2022, 9, 108. [Google Scholar] [CrossRef]
- Dou, X.; Zhang, L.; Yang, R.; Wang, X.; Yu, L.; Yue, X.; Ma, F.; Mao, J.; Wang, X.; Zhang, W.; et al. Mass spectrometry in food authentication and origin traceability. Mass Spectrom. Rev. 2022, 42, 1772–1807. [Google Scholar] [CrossRef]
- Li, Q.; Yang, S.; Li, B.; Zhang, C.; Li, Y.; Li, J. Exploring critical metabolites of honey peach (Prunus persica (L.) Batsch) from five main cultivation regions in the north of China by UPLC-Q-TOF/MS combined with chemometrics and modeling. Food Res. Int. 2022, 157, 111213. [Google Scholar] [CrossRef]
- Liu, X.; Zhong, C.; Xie, J.; Liu, H.; Xie, Z.; Zhang, S.; Jin, J. Geographical region traceability of Poria cocos and correlation between environmental factors and biomarkers based on a metabolomic approach. Food Chem. 2023, 417, 135817. [Google Scholar] [CrossRef]
- Ye, Z.; Dai, J.-R.; Zhang, C.-G.; Lu, Y.; Wu, L.-L.; Gong, A.G.W.; Xu, H.; Tsim, K.W.K.; Wang, Z.-T. Chemical differentiation of Dendrobium officinale and Dendrobium devonianum by using HPLC fingerprints, HPLC-ESI-MS, and HPTLC analyses. Evid.-Based Complement Alternat. Med. 2017, 2017, 8647212. [Google Scholar] [CrossRef]
- Lin, T.; Chen, X.-L.; Wu, G.-W.; Sha, L.-J.; Wang, J.; Hu, Z.-X.; Liu, H.-C. A simple method for distinguishing Dendrobium devonianum and Dendrobium officinale by ultra performance liquid chromatography-photo diode array detector. Food Sci. Technol. 2023, 43, e110122. [Google Scholar] [CrossRef]
- Simonnet-Laprade, C.; Bayen, S.; McGoldrick, D.; McDaniel, T.; Hutinet, S.; Marchand, P.; Vénisseau, A.; Cariou, R.; Le Bizec, B.; Dervilly, G.J.C. Evidence of complementarity between targeted and non-targeted analysis based on liquid and gas-phase chromatography coupled to mass spectrometry for screening halogenated persistent organic pollutants in environmental matrices. Chemosphere 2022, 293, 133615. [Google Scholar] [CrossRef]
- Crimmins, B.S.; Holsen, T.M. Non-targeted screening in environmental monitoring programs. In Advancements of Mass Spectrometry in Biomedical Research; Woods, A.G., Darie, C.C., Eds.; Springer International Publishing: Cham, Switzerland, 2019; pp. 731–741. [Google Scholar]
- Martínez-Bueno, M.; Ramos, M.G.; Bauer, A.; Fernández-Alba, A. An overview of non-targeted screening strategies based on high resolution accurate mass spectrometry for the identification of migrants coming from plastic food packaging materials. TrAC Trends Anal. Chem. 2019, 110, 191–203. [Google Scholar] [CrossRef]
- Zha, H.; Cai, Y.; Yin, Y.; Wang, Z.; Li, K.; Zhu, Z.-J. SWATHtoMRM: Development of high-coverage targeted metabolomics method using SWATH technology for biomarker discovery. Anal. Chem. 2018, 90, 4062–4070. [Google Scholar] [CrossRef]
- Song, J.; Wang, X.; Guo, Y.; Yang, Y.; Xu, K.; Wang, T.; Sa, Y.; Yuan, L.; Jiang, H.; Guo, J. Novel high-coverage targeted metabolomics method (SWATHtoMRM) for exploring follicular fluid metabolome alterations in women with recurrent spontaneous abortion undergoing in vitro fertilization. Sci. Rep. 2019, 9, 10873. [Google Scholar] [CrossRef]
- Xu, L.; Xu, Z.; Wang, X.; Wang, B.; Liao, X. The application of pseudotargeted metabolomics method for fruit juices discrimination. Food Chem. 2020, 316, 126278. [Google Scholar] [CrossRef]
- Song, J.; Xiang, S.; Pang, C.; Guo, J.; Sun, Z. Metabolomic alternations of follicular fluid of obese women undergoing in-vitro fertilization treatment. Sci. Rep. 2020, 10, 5968. [Google Scholar] [CrossRef]
- Tao, Z.; Lu, N.; Wu, X.; Huang, Y.; Xiao, Y.; Wang, X. Research progress on chemical constituents and pharmacological action of Dendrobium. J. Pharm. Res. 2021, 40, 44–51+70. [Google Scholar]
- Rao, D.; Zhao, R.; Hu, Y.; Li, H.; Chun, Z.; Zheng, S. Revealing of intracellular antioxidants in Dendrobium nobile by high performance liquid chromatography-tandem mass spectrometry. Metabolites 2023, 13, 702. [Google Scholar] [CrossRef]
- He, C.; Peng, C.; Dai, O.; Yang, L.; Liu, J.; Guo, L.; Xiong, L.; Liu, Z. Chemical constituents from Leonurus japonicus Injection. Chin. Tradit. Herb. Drugs 2014, 45, 3048–3052. [Google Scholar]
- Zhang, J.; Xu, H.-X.; Zhao, Z.-L.; Xian, Y.-F.; Lin, Z.-X. Dendrobium nobile Lindl: A review on its chemical constituents and pharmacological effects. Chin. Med. Cult. 2021, 4, 235–242. [Google Scholar] [CrossRef]
- Horton, D.; Rodemeyer, G.; Haskell, T.H. Analytical characterization of lipopolysaccharide antigens from seven strains of Pseudomonas aeruginosa. Carbohydr. Res. 1977, 55, 35–47. [Google Scholar] [CrossRef]
- Chen, W.; Yeo, S.C.M.; Chuang, X.F.; Lin, H.-S. Determination of pinostilbene in rat plasma by LC–MS/MS: Application to a pharmacokinetic study. J. Pharm. Biomed. Anal. 2016, 120, 316–321. [Google Scholar] [CrossRef]
- Kato, Y.; Terada, H. Determination method of linamarin in cassava products and beans by ultra high performance liquid chromatography with tandem mass spectrometry. Shokuhin Eiseigaku Zasshi J. Food Hyg. Soc. Jpn. 2014, 55, 162–166. [Google Scholar] [CrossRef]
- Yang, X.-B.; Yan, S.; Hu, J.-M.; Zhou, J. Chemical constituents from Dendrobium heterocarpum Lindl. Nat. Prod. Res. Dev. 2019, 31, 1745–1752. [Google Scholar]
- Song, C.; Zhang, Y.; Manzoor, M.A.; Li, G. Identification of alkaloids and related intermediates of Dendrobium officinale by solid-phase extraction coupled with high-performance liquid chromatography tandem mass spectrometry. Front. Plant Sci. 2022, 13, 952051. [Google Scholar] [CrossRef]
- Ma, Y.; Li, P.; Chen, D.; Fang, T.; Li, H.; Su, W. LC/MS/MS quantitation assay for pharmacokinetics of naringenin and double peaks phenomenon in rats plasma. Int. J. Pharm. 2006, 307, 292–299. [Google Scholar] [CrossRef]
- Katsumata, S.; Hamana, K.; Horie, K.; Toshima, H.; Hasegawa, M. Identification of sternbin and naringenin as detoxified metabolites from the rice flavanone phytoalexin sakuranetin by pyricularia oryzae. Chem. Biodivers. 2017, 14, e1600240. [Google Scholar] [CrossRef]
- Bulama, J.; Dangoggo, S.; Halilu, M.; Tsafe, A.; Hassan, S. Isolation and characterization of palmitic acid from ethyl acetate extract of root bark of Terminalia glaucescens. Chem. Mater. Res. 2014, 6, 140–143. [Google Scholar]
- Ye, Q.; Zhao, W. New alloaromadendrane, cadinene and cyclocopacamphane type sesquiterpene derivatives and bibenzyls from Dendrobium nobile. Planta Medica 2002, 68, 723–729. [Google Scholar] [CrossRef]
- Zhu, Y.; Feng, Y.; Shen, L.; Xu, D.; Wang, B.; Ruan, K.; Cong, W. Effect of metformin on the urinary metabolites of diet-induced-obese mice studied by ultra performance liquid chromatography coupled to time-of-flight mass spectrometry (UPLC-TOF/MS). J. Chromatogr. B 2013, 925, 110–116. [Google Scholar] [CrossRef]
- Wei, M.; Liu, Z.; Liu, Y.; Li, S.; Hu, M.; Yue, K.; Liu, T.; He, Y.; Pi, Z.; Liu, Z.; et al. Urinary and plasmatic metabolomics strategy to explore the holistic mechanism of lignans in S. chinensis in treating Alzheimer’s disease using UPLC-Q-TOF-MS. Food Funct. 2019, 10, 5656–5668. [Google Scholar] [CrossRef] [PubMed]
- Yang, J.; Han, X.; Wang, H.-Y.; Yang, J.; Kuang, Y.; Ji, K.-Y.; Yang, Y.; Pang, K.; Yang, S.-X.; Qin, J.-C.; et al. Comparison of metabolomics of Dendrobium officinale in different habitats by UPLC-Q-TOF-MS. Biochem. Syst. Ecol. 2020, 89, 104007. [Google Scholar] [CrossRef]
- Wu, D.; Li, X.; Zhang, X.; Han, F.; Lu, X.; Liu, L.; Zhang, J.; Dong, M.; Yang, H.; Li, H. Pharmacometabolomics Identifies 3-Hydroxyadipic Acid, d-Galactose, Lysophosphatidylcholine (P-16:0), and Tetradecenoyl-l-Carnitine as Potential Predictive Indicators of Gemcitabine Efficacy in Pancreatic Cancer Patients. Front. Oncol. 2020, 9, 1524. [Google Scholar] [CrossRef]
- Lu, X.; Zhang, X.; Zhang, Y.; Zhang, K.; Zhan, C.; Shi, X.; Li, Y.; Zhao, J.; Bai, Y.; Wang, Y.; et al. Metabolic profiling analysis upon acylcarnitines in tissues of hepatocellular carcinoma revealed the inhibited carnitine shuttle system caused by the downregulated carnitine palmitoyltransferase 2. Mol. Carcinog. 2019, 58, 749–759. [Google Scholar] [CrossRef]
- Zhao, W.; Ye, Q.; Tan, X.; Jiang, H.; Li, X.; Chen, K.; Kinghorn, A.D. Three New Sesquiterpene Glycosides from Dendrobium nobile with Immunomodulatory Activity. J. Nat. Prod. 2001, 64, 1196–1200. [Google Scholar] [CrossRef]
- Yang, W.; Kong, L.; Zhang, Y.; Tang, G.; Zhu, F.; Li, S.; Guo, L.; Cheng, Y.; Hao, X.; He, H. Phragmalin-type Limonoids from Heynea trijuga. Planta Med. 2012, 78, 1676–1682. [Google Scholar] [CrossRef]
- Zhao, D.; Xie, L.; Yu, L.; An, N.; Na, W.; Chen, F.; Li, Y.; Tan, Y.; Zhang, X. New 2-Benzoxazolinone Derivatives with Cytotoxic Activities from the Roots of Acanthus Ilicifolius Chem. Pharm. Bull. 2015, 63, 1087–1090. [Google Scholar] [CrossRef]
- Xiang, Y.; Li, Y.-B.; Zhang, J.; Li, P.; Yao, Y.-z. Studies on chemical constituents of Salsola collina. China J. Chin. Mater. Medica 2007, 32, 409–413. [Google Scholar]
- Avula, B.; Wang, Y.-H.; Smillie, T.J.; Khan, I.A. Determination of Shikimic Acid in Fruits of Illicium Species and Various Other Plant Samples by LC–UV and LC–ESI–MS. Chromatographia 2009, 69, 307–314. [Google Scholar] [CrossRef]
- Zhuang, B.; Bi, Z.-M.; Wang, Z.-Y.; Duan, L.; Lai, C.-J.-S.; Liu, E.H. Chemical profiling and quantitation of bioactive compounds in Platycladi Cacumen by UPLC-Q-TOF-MS/MS and UPLC-DAD. J. Pharm. Biomed. Anal. 2018, 154, 207–215. [Google Scholar] [CrossRef]
- Wu, C.; Wang, J.; Zhang, C.; Wang, D.; Zhang, L.; Cao, M.; Wang, Y.; Li, Q. Determination of Four Sugars in Infant Formula Milk Powder and Dairy Products by Ion Chromatography-Mass Spectrometry. Food Sci. Technol. 2020, 45, 264–268. [Google Scholar]
- Lan, Y.; Zhang, J.; Ll, O.; Feng, J. Determination of Three Monosaccharides in Dendrobium denneanum and D.officinale by UPLC-QQQ-MS. Guangzhou Chem. Ind. 2022, 50, 143–145. [Google Scholar]
- Chen, Y.; Yu, H.; Lian, X. Isolation of stilbenoids and lignans from Dendrobium hongdie. Trop. J. Pharm. Res. 2015, 14, 2055–2059. [Google Scholar] [CrossRef]
- Yang, L.; Wang, Y.; Zhang, G.; Zhang, F.; Zhang, Z.; Wang, Z.; Xu, L. Simultaneous quantitative and qualitative analysis of bioactive phenols in Dendrobium aurantiacum var. denneanum by high-performance liquid chromatography coupled with mass spectrometry and diode array detection. Biomed. Chromatogr. 2007, 21, 687–694. [Google Scholar] [CrossRef] [PubMed]
- Zhu, A.-L.; Hao, J.-W.; Liu, L.; Wang, Q.; Chen, N.-D.; Wang, G.-L.; Liu, X.-Q.; Li, Q.; Xu, H.-M.; Yang, W.-H. Simultaneous Quantification of 11 Phenolic Compounds and Consistency Evaluation in Four Dendrobium Species Used as Ingredients of the Traditional Chinese Medicine Shihu. Front. Nutr. 2021, 8, 771078. [Google Scholar] [CrossRef] [PubMed]
- Wang, Y.; Han, B.; Li, Z.; Nie, X.; Yang, M.; Wang, W.; Sun, Z. Determination of the Compounds of Dendrobium pendulum Roxb. by UPLC-Q-TOF-MS. Chin. Pharm. J. 2021, 56, 708–714. [Google Scholar]
- Tezuka, Y.; Hirano, H.; Kikuchi, T.; Xu, G.-J. Constituents of Ephemerantha lonchophylla; isolation and structure elucidation of new phenolic compounds, ephemeranthol-A, ephemeranthol-B, and ephemeranthoquinone, and of a new diterpene glucoside, ephemeranthoside. Chem. Pharm. Bull. 1991, 39, 593–598. [Google Scholar] [CrossRef]
- Yang, H.; Gong, Y.; Wang, Z.; Xu, L.; Hu, Z.; Xu, G. Studies on chemical constituents of Dendrobium chrysotoxum. Chin. Tradit. Herb. Drugs 2001, 32, 972–974. [Google Scholar]
- Kaganda, N.; Adesanya, S. A new dihydrostilbene from diseased Dioscorea mangenotiana. J. Nat. Prod. 1990, 53, 1345–1346. [Google Scholar] [CrossRef]
- Li, Y.; Wang, C.-L.; Guo, S.-X.; Yang, J.-S.; Xiao, P.-G. Two new compounds from Dendrobium candidum. Chem. Pharm. Bull. 2008, 56, 1477–1479. [Google Scholar] [CrossRef]
- Okamoto, T.; Natsume, M.; Onaka, T.; Uchimaru, F.; Shimizu, M. The structure of dendroxine the third alkaloid from Dendrobium nobile. Chem. Pharm. Bull. 1966, 14, 672–675. [Google Scholar] [CrossRef] [PubMed]
- Wang, Y.-H.; Avula, B.; Abe, N.; Wei, F.; Wang, M.; Ma, S.-C.; Ali, Z.; Elsohly, M.A.; Khan, I.A. Tandem Mass Spectrometry for Structural Identification of Sesquiterpene Alkaloids from the Stems of Dendrobium nobile Using LC-QToF. Planta Medica 2016, 82, 662–670. [Google Scholar] [CrossRef] [PubMed]
- Nagai, T.; Kiyohara, H.; Munakata, K.; Shirahata, T.; Sunazuka, T.; Harigaya, Y.; Yamada, H. Pinellic acid from the tuber of Pinellia ternata Breitenbach as an effective oral adjuvant for nasal influenza vaccine. Int. Immunopharmacol. 2002, 2, 1183–1193. [Google Scholar] [CrossRef]
- Cong, W.; Schwartz, E.; Peterson, D.G. Identification of inhibitors of pinellic acid generation in whole wheat bread. Food Chem. 2021, 351, 129291. [Google Scholar] [CrossRef]
- Fujimoto, T.; Oku, K.; Tashiro, M.; Machinami, T. Crystal Structure of α,α-Trehalose–Calcium Chloride Monohydrate Complex. J. Carbohydr. Chem. 2006, 25, 521–532. [Google Scholar] [CrossRef]
- Tan, D.; Song, Y.; Wang, J.; Gao, C.; Qin, L.; Zhao, Y.; Lu, Y.; Yang, Z.; He, Y. Identification of sesquiterpene glycosides from Dendrobium nobile and their α-glycosidase and α-amylase inhibitory activities. Food Sci. Technol. 2022, 43, e99722. [Google Scholar] [CrossRef]
- Ye, Q.; Qin, G.; Zhao, W. Immunomodulatory sesquiterpene glycosides from Dendrobium nobile. Phytochemistry 2002, 61, 885–890. [Google Scholar] [CrossRef]
- Zhao, C.; Liu, Q.; Halaweish, F.; Shao, B.; Ye, Y.; Zhao, W. Copacamphane, Picrotoxane, and Alloaromadendrane Sesquiterpene Glycosides and Phenolic Glycosides from Dendrobium moniliforme. J. Nat. Prod. 2003, 66, 1140–1143. [Google Scholar] [CrossRef]
- Lijina, P.; Gnanesh Kumar, B.S. Discrimination of raffinose and planteose based on porous graphitic carbon chromatography in combination with mass spectrometry. J. Chromatogr. B 2023, 1224, 123758. [Google Scholar] [CrossRef]
- Huang, Y.P.; Robinson, R.C.; Barile, D. Food glycomics: Dealing with unexpected degradation of oligosaccharides during sample preparation and analysis. J. Food Drug Anal. 2022, 30, 62–76. [Google Scholar] [CrossRef]
- Han, J.; Ye, M.; Qiao, X.; Xu, M.; Wang, B.-R.; Guo, D.-A. Characterization of phenolic compounds in the Chinese herbal drug Artemisia annua by liquid chromatography coupled to electrospray ionization mass spectrometry. J. Pharm. Biomed. Anal. 2008, 47, 516–525. [Google Scholar] [CrossRef] [PubMed]
- Silva, D.B.; Turatti, I.C.C.; Gouveia, D.R.; Ernst, M.; Teixeira, S.P.; Lopes, N.P. Mass Spectrometry of Flavonoid Vicenin-2, Based Sunlight Barriers in Lychnophora species. Sci. Rep. 2014, 4, 4309. [Google Scholar] [CrossRef] [PubMed]
- Yang, J.; Qian, D.; Jiang, S.; Shang, E.-X.; Guo, J.; Duan, J.-A. Identification of rutin deglycosylated metabolites produced by human intestinal bacteria using UPLC–Q-TOF/MS. J. Chromatogr. B 2012, 898, 95–100. [Google Scholar] [CrossRef] [PubMed]
- Oskouei, Z.; Rahbardar, M.G.; Hosseinzadeh, H. The effects of Dendrobium species on the metabolic syndrome: A review. Iran. J. Basic Med. Sci. 2023, 26, 738. [Google Scholar] [PubMed]
- Zhou, X.; Wang, X.; Sun, Q.; Zhang, W.; Liu, C.; Ma, W.; Sun, C. Natural compounds: A new perspective on targeting polarization and infiltration of tumor-associated macrophages in lung cancer. Biomed. Pharmacother. 2022, 151, 113096. [Google Scholar] [CrossRef]
- Inthongkaew, P.; Chatsumpun, N.; Supasuteekul, C.; Kitisripanya, T.; Putalun, W.; Likhitwitayawuid, K.; Sritularak, B. α-Glucosidase and pancreatic lipase inhibitory activities and glucose uptake stimulatory effect of phenolic compounds from Dendrobium formosum. Rev. Bras. Farmacogn. 2017, 27, 480–487. [Google Scholar] [CrossRef]


Disclaimer/Publisher’s Note: The statements, opinions and data contained in all publications are solely those of the individual author(s) and contributor(s) and not of MDPI and/or the editor(s). MDPI and/or the editor(s) disclaim responsibility for any injury to people or property resulting from any ideas, methods, instructions or products referred to in the content. |
© 2023 by the authors. Licensee MDPI, Basel, Switzerland. This article is an open access article distributed under the terms and conditions of the Creative Commons Attribution (CC BY) license (https://creativecommons.org/licenses/by/4.0/).