
Physicochemical Characteristics of Meat Analogs Supplemented with Vegetable Oils

Abstract
:1. Introduction
2. Materials and Methods
2.1. Materials
2.2. Preparation of Vegetable Protein
2.3. Experimental Method
2.3.1. Cooking Loss
2.3.2. Water Contents
2.3.3. Liquid-Holding Capacity
2.3.4. Texture Measurement
2.3.5. DPPH Radical Scavenging Activity
2.3.6. Sensory Test
2.3.7. Statistical Analysis
3. Results and Discussion
3.1. Cooking Loss
3.2. Water Contents
3.3. Liquid-Holding Capacity
3.4. Texture and pH Measurement
3.5. DPPH Radical Scavenging Activity
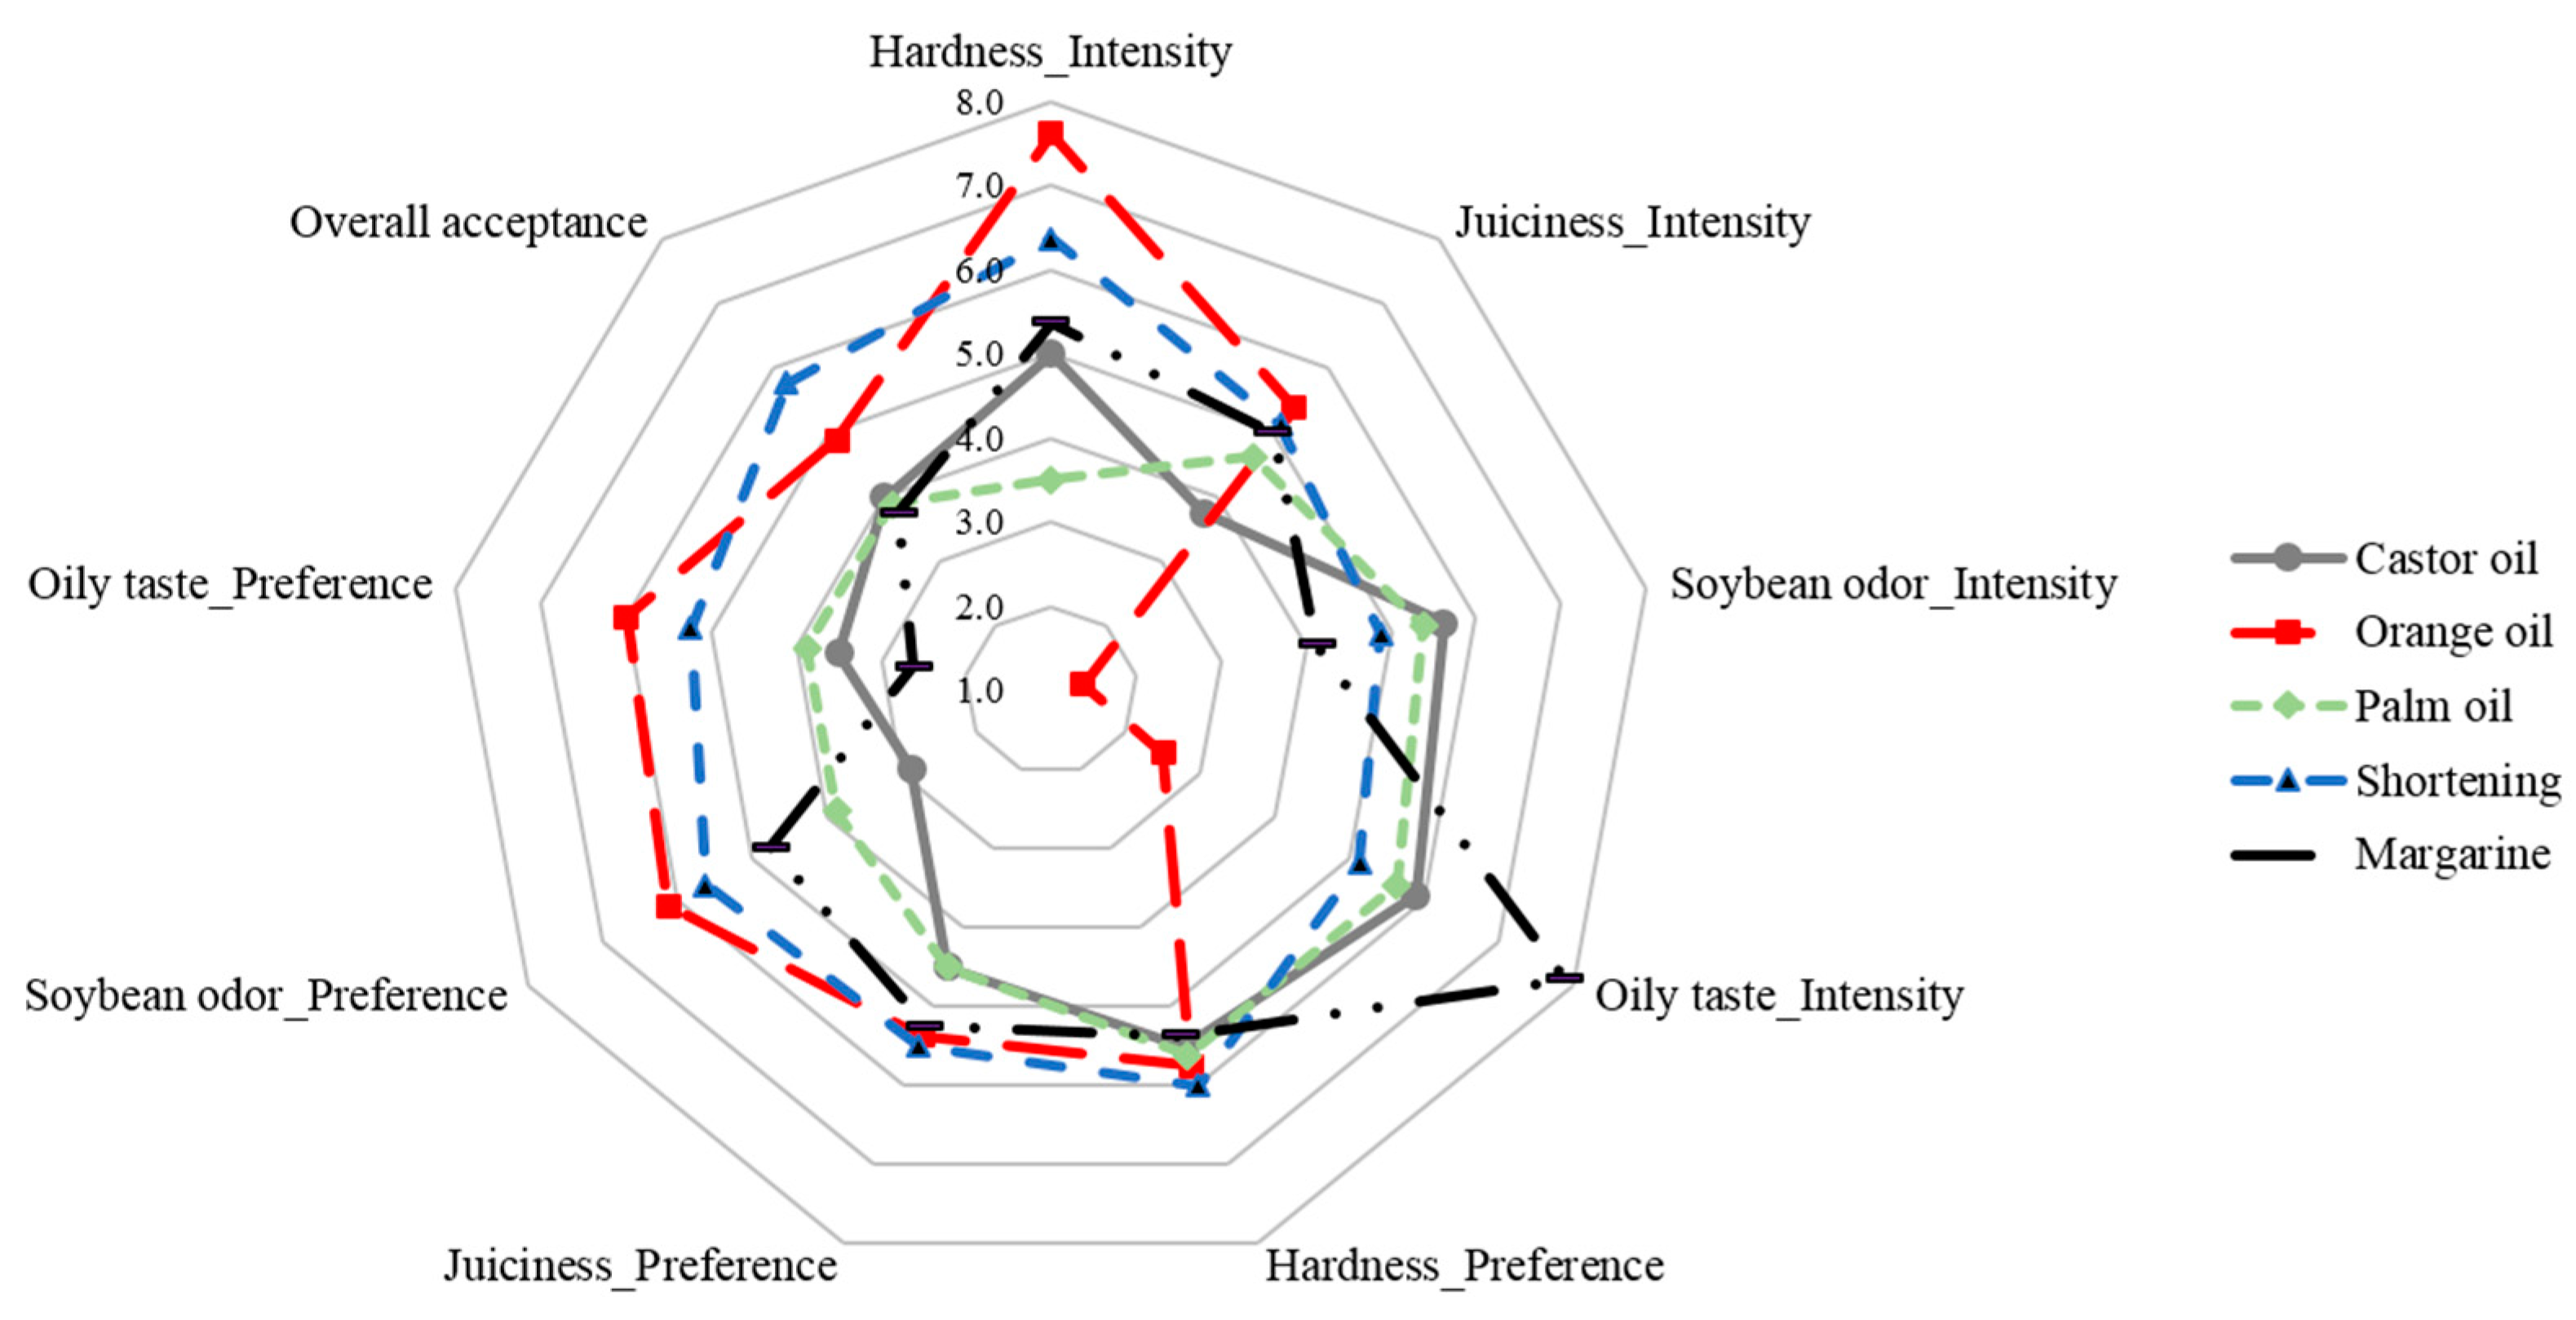
3.6. Sensory Test
4. Conclusions
Author Contributions
Funding
Institutional Review Board Statement
Informed Consent Statement
Data Availability Statement
Conflicts of Interest
References
- OECD. Meat Consumption (Indicator); Organization for Economic Co-Operation and Development: Paris, France, 2017; Available online: https://data.oecd.org/agroutput/meat-consumption.htm (accessed on 20 May 2019).
- Hicks, T.M.; Knowles, S.O.; Farouk, M.M. Global provisioning of red meat for flexitarian diets. Front. Nutr. 2018, 5, 50. [Google Scholar] [CrossRef] [PubMed]
- Kim, H.; Bae, J.; Wi, G.; Kim, H.T.; Cho, Y.; Choi, M.J. Physicochemical properties and sensory evaluation of meat analog mixed with different liquid materials as an animal fat substitute. Food Eng. Prog. 2019, 23, 62–68. [Google Scholar] [CrossRef]
- Krintiras, G.A.; Diaz, J.G.; Goot, A.J.; Stankiewicz, A.I.; Stefanidis, G.D. On the use of the Couette Cell technology for large scale production of textured soy-based meat replacers. J. Food Eng. 2016, 169, 205–213. [Google Scholar] [CrossRef] [Green Version]
- Toorn, S.I.; Broek, M.A.; Worrell, E. Decarbonising meat: Exploring greenhouse gas emissions in the meat sector. Energy Procedia 2017, 123, 353–360. [Google Scholar] [CrossRef]
- Herrero, M.; Henderson, B.; Havlik, P.; Thornton, P.K.; Conant, R.T.; Smith, P.; Wirsenius, S.; Hristov, A.N.; Gerber, P.; Gill, M.; et al. Greenhouse gas mitigation potentials in the livestock sector. Nat. Clim. Chang. 2016, 6, 452–461. [Google Scholar] [CrossRef] [Green Version]
- Dangal, S.R.S.; Tian, H.; Zhang, B.; Pan, S.; Lu, C.; Yang, J. Methane emission from global livestock sector during 1890-2014: Magnitude, trends and spatiotemporal patterns. Glob. Chang. Biol. 2017, 23, 4147–4161. [Google Scholar] [CrossRef] [PubMed]
- Nerea, B.T.; Nancy, B.; Miguel-Ángel, M.G.; Dolores, C.; Ramon, E.; Emilio, R.; Montserrat, F.; Lluís, S.M.; Itziar, S.; Rosa, M.; et al. Replacing red meat and processed red meat for white meat, fish, legumes, or eggs is associated with a lower risk of metabolic syndrome. Clin. Nutr. 2016, 35, 1442–1449. [Google Scholar]
- Kim, G.H.; Shin, S.W.; Lee, J.; Hwang, J.H.; Park, S.W.; Moon, J.S.; Kim, H.J.; Ahn, H.S. Red meat and chicken consumption and its association with high blood pressure and obesity in South Korean children and adolescents: A cross-sectional analysis of KSHES, 2011–2015. Nutr. J. 2017, 16, 31. [Google Scholar] [CrossRef] [Green Version]
- Rijsberman, F. The key role of the meat industry in transformation to a low-carbon, climate resilient, sustainable economy. Meat Sci. 2017, 132, 2–5. [Google Scholar] [CrossRef] [PubMed]
- Geerts, M.E.J.; Dekkers, B.L.; Padt, A.; Goot, A.J. Aqueous fractionation processes of soy protein for fibrous structure formation. Innov. Food Sci. Emerg. Technol. 2018, 45, 313–319. [Google Scholar] [CrossRef]
- Palanisamya, M.; Topfl, S.; Aganovic, K.; Berger, R.G. Influence of iota carrageenan addition on the properties of soya protein meat analogues. LWT-Food Sci. Technol. 2018, 87, 546–552. [Google Scholar] [CrossRef]
- Hoek, A.C.; Luning, P.A.; Weijzen, P.; Engels, W.; Kok, F.J.; Graaf, C. Replacement of meat by meat substitutes. A survey on person- and product-related factors in consumer acceptance. Appetite 2011, 56, 662–673. [Google Scholar] [CrossRef] [PubMed]
- Kinsella, J.E. Functional properties of soy proteins. J. Am. Oil Chem. Soc. 1979, 56, 242–258. [Google Scholar] [CrossRef]
- Shin, Y.M.; Cho, K.M.; Seo, W.T.; Choi, J.S. Quality characteristics and antioxidant activity of soybean meat using heat-treated soybean powder. J. Agric. Life Sci. 2014, 84, 105–117. [Google Scholar] [CrossRef]
- Kim, E.B.; Kim, E.J.; Lee, H.N.; Lee, M.K.; Oh, J.S.; Kim, S.O.; Lee, S.Y. The quality characteristics of soy cutlets using textured soy protein treated with different enzymes. J. Korean Soc. Food Cult. 2008, 23, 507–513. [Google Scholar]
- Lin, S.; Huff, H.E.; Hsieh, F. Texture and chemical characteristics of soy protein meat analog extruded at high moisture. J. Food Sci. 2000, 65, 264–269. [Google Scholar] [CrossRef]
- Asgar, M.A.; Fazilah, A.; Huda, N.; Bhat, R.; Karim, A.A. Nonmeat protein alternatives as meat extenders and meat analogs. Compr. Rev. Food Sci. Food Saf. 2010, 9, 513–529. [Google Scholar] [CrossRef]
- Semma, M. Trans fatty acids: Properties, benefits and risks. J. Health Sci. 2002, 48, 7–13. [Google Scholar] [CrossRef] [Green Version]
- Bica, K.; Gaertner, P.; Rogers, R.D. Ionic liquids and fragrances—Direct isolation of orange essential oil. Green Chem. 2011, 13, 1997–1999. [Google Scholar] [CrossRef]
- Ahmad, M.M.; Rehman, S.U.; Iqbal, Z.; Anjum, F.M.; Sultan, J.I. Genetic variability to essential oil composition in four citrus fruit species. Pak. J. Bot. 2006, 38, 319–324. [Google Scholar]
- Ramezani, K.; Rowahanzamir, S.; Eikani, M.H. Castor oil transesterification reaction: A kinetic study and optimization of parameters. Energy 2010, 35, 4142–4148. [Google Scholar] [CrossRef]
- Lee, T.S.; Lee, Y.H.; Kim, K.S.; Kim, W.; Kim, K.S.; Jang, Y.S.; Park, K.G. Characteristics of fatty acid composition and properties by blending of vegetable oils. Korean J. Plant Res. 2012, 25, 624–632. [Google Scholar] [CrossRef] [Green Version]
- AOAC. Official Methods of Analysis, 15th ed.; Association of Analytical Chemists: Washington, DC, USA, 1990; pp. 8–35. [Google Scholar]
- Wierbicki, E.; Deatherage, F.E. Water content of meats, Determination of water-holding capacity of fresh meats. J. Agric. Food Chem. 1958, 6, 387–392. [Google Scholar] [CrossRef]
- Blois, M.S. Antioxidant determinations by the use of a stable free radical. Nature 1958, 181, 1199–1200. [Google Scholar] [CrossRef]
- Kim, H.; Lee, K.; Kim, S.; Chung, H. Nutritional retention factor of 1+ quality grade Hanwoo beef using different cooking methods. Food Sci. Anim. Resour. 2010, 30, 1024–1030. [Google Scholar] [CrossRef] [Green Version]
- Williams, K.R.; Pierce, R.E. The analysis of orange oil and the aqueous solubility of d-limonene—Two complementary gas chromatography experiments. J. Chem. Educ. 1998, 75, 223–226. [Google Scholar] [CrossRef]
- Zhang, Q.Q.; Li, W.; Li, H.K.; Chen, X.H.; Jiang, M.; Dong, M.S. Low-field nuclear magnetic resonance for online determination of water content during sausage fermentation. J. Food Eng. 2017, 212, 291–297. [Google Scholar] [CrossRef]
- Kim, H.; Hwang, J.B.; Kim, S.N.; Choi, Y.; Kim, S.M.; Han, H.K.; Yang, M.R.; Kim, H.R. Changes of nutrient composition and retention rate of sweet pepper by different types and blanching method. Korean J. Food Cook. Sci. 2016, 32, 433–440. [Google Scholar] [CrossRef] [Green Version]
- Han, S.H.; Lee, H.Y.; Kum, J.S.; Park, J.D. Physicochemical properties of modified chufa (Cyperus esculentus L., var sativus Boeck) starch. Korean J. Food Preserv. 2006, 13, 404–412. [Google Scholar]
- Park, J.C.; Jeong, J.Y.; Lee, E.S.; Choi, J.H.; Choi, Y.S.; Yu, L.H.; Paik, H.D.; Kim, C.J. Effects of replaced plant oils on the quality properties in low-fat hamburger patties. Korean J. Food Sci. Technol. 2005, 37, 412–417. [Google Scholar]
- Deb, P.; Jin, G.Y.; Singh, S.K.; Moon, J.; Kwon, H.; Das, A.; Bagchi, S.; Kim, Y.S. Interconverting hydrogen-bonding and weak n → π* interactions in aqueous solution: A direct spectroscopic evidence. J. Phys. Chem. Lett. 2018, 9, 5425–5429. [Google Scholar] [CrossRef] [PubMed]
- Kim, S.H.; Jung, E.S.; Kim, S.Y.; Park, S.Y.; Cho, Y.S. Effect of heat treatment on physicochemical properties of soybean. Korean J. Food Preserv. 2017, 24, 820–826. [Google Scholar] [CrossRef] [Green Version]
- Yoon, H.H.; Jeon, E.J. Functional properties of soy protein isolate from heat treated soybean. Korean J. Food Sci. Technol. 2004, 36, 38–43. [Google Scholar]
- Cha, Y.H. Effect of ohmic heating on characteristics of heating denaturation of soybean protein. J. Korean Soc. Food Sci. Nutr. 2011, 24, 740–745. [Google Scholar] [CrossRef] [Green Version]
- Gokdogan, O.; Eryilmaz, T.; Yesilyurt, M.K. Thermophysical properties of castor oil (Ricinus communis L.) biodiesel and its blends. Cienc. Tecnol. Futuro 2015, 6, 95–128. [Google Scholar] [CrossRef]
- Beom, S.W.; Jiang, G.H.; Eun, J.B. Effect of blanching time on physicochemical characteristics and sensory evaluation of Aster scaber. Korean J. Food Preserv. 2015, 22, 51–55. [Google Scholar] [CrossRef]
- Jeon, K.S.; Park, S.I. Manufacturing and functional properties of soymilk prepared with Korean and Chinese soybeans. Korean J. Culin. Res. 2015, 21, 68–79. [Google Scholar]
- Xia, W.; Ma, L.; Chen, X.; Li, X.; Zhang, Y. Physicochemical and structural properties of composite gels prepared with myofibrillar protein and lecithin at various ionic strengths. Food Hydrocoll. 2018, 82, 135–143. [Google Scholar] [CrossRef]
- Zhuang, X.; Han, M.; Kang, Z.; Wang, K.; Bai, Y.; Xua, X.; Zhou, G. Effects of the sugarcane dietary fiber and pre-emulsified sesame oil on low-fat meat batter physicochemical property, texture, and microstructure. Meat Sci. 2016, 113, 107–115. [Google Scholar] [CrossRef]
- Lee, S.; Kim, Y.R. Principle and Application of Food Rheology; Soohaksa: Seoul, Republic of Korea, 2017; pp. 149–157. [Google Scholar]
- Gu, B.Y.; Ryu, G.H. Effects of moisture content and screw speed on physical properties of extruded soy protein isolate. J. Korean Soc. Food Sci. Nutr. 2017, 46, 751–758. [Google Scholar]
- Ammar, R.B.; Bhouri, W.; Sghaier, M.B.; Boubaker, J.; Skandrani, I.; Neffati, A.; Bouhlel, I.; Kilani, S.; Mariotte, A.M.; Chekir-Ghedira, L.; et al. Antioxidant and free radical-scavenging properties of three flavonoids isolated from the leaves of Rhamnus alaternus L. (Rhamnaceae): A structure-activity relationship study. Food Chem. 2009, 116, 258–264. [Google Scholar] [CrossRef]
- Thongchai, W.; Liawruangrath, B.; Liawruangrath, S. Flow injection analysis of total curcuminoids in turmeric and antioxidant capacity using 2,2′-diphenyl-1-picrylhydrazyl assay. Food Chem. 2009, 112, 494–499. [Google Scholar] [CrossRef]
- Qian, C.; Decker, E.A.; Xiao, H.; McClements, D.J. Comparison of biopolymer emulsifier performance in formation and stabilization of orange oil-in-water emulsions. J. Am. Oil Chem. Soc. 2011, 88, 47–55. [Google Scholar] [CrossRef]
- Chaudhary, S.C.; Siddiqui, M.S.; Athar, M.; Alam, M.S. D-Limonene modulates inflammation, oxidative stress and Ras-ERK pathway to inhibit murine skin tumorigenesis. Hum. Exp. Toxicol. 2012, 31, 798–811. [Google Scholar] [CrossRef] [PubMed]
- Moosavy, M.H.; Hassanzadeh, P.; Mohammadzadeh, E.; Mahmoudi, R.; Khatibi, S.A.; Mardani, K. Antioxidant and antimicrobial activities of essential oil of lemon (Citrus limon) peel in vitro and in a food model. J. Food Qual. Hazards Control 2017, 4, 42–48. [Google Scholar]
- Torres-Alvarez, C.; Núñez González, A.; Rodríguez, J.; Castillo, S.; Leos-Rivas, C.; Báez-González, J.G. Chemical composition, antimicrobial, and antioxidant activities of orange essential oil and its concentrated oils. CyTA-J. Food 2017, 15, 129–135. [Google Scholar] [CrossRef] [Green Version]
- Pietrasik, Z.; Wang, H.; Janz, J.A.M. Effect of canola oil emulsion injection on processing characteristics and consumer acceptability of three muscles from mature beef. Meat Sci. 2013, 93, 322–328. [Google Scholar] [CrossRef]
- Mirhosseini, H.; Tan, C.P.; Hamid, N.S.A.; Yusof, S. Effect of arabic gum, xanthan gum and orange oil on flavor release from diluted orange beverage emulsion. Food Chem. 2008, 107, 1161–1172. [Google Scholar] [CrossRef]
- Mei, L.; Choi, S.J.; Alamed, J.; Henson, L.; Popplewell, M.; McClements, D.J. Citral stability in oil-in-water emulsions with solid or liquid octadecane. J. Agric. Food Chem. 2009, 58, 533–536. [Google Scholar] [CrossRef]
- Im, S.I.; Choi, S.H. Study on fishy off-flavor in porcine liver by GC-O. Korean J. Food Sci. Technol. 2003, 35, 353–358. [Google Scholar]

| Sample (1) | Oil Concentration (g/100 g TVP (2)) | ||||
|---|---|---|---|---|---|
| Castor | Orange | Palm | Shortening | Margarine | |
| C10 | 10 | - | - | - | - |
| C20 | 20 | - | - | - | - |
| C30 | 30 | - | - | - | - |
| C40 | 40 | - | - | - | - |
| C50 | 50 | - | - | - | - |
| O10 | - | 10 | - | - | - |
| O20 | - | 20 | - | - | - |
| O30 | - | 30 | - | - | - |
| O40 | - | 40 | - | - | - |
| O50 | - | 50 | - | - | - |
| P10 | - | - | 10 | - | - |
| P20 | - | - | 20 | - | - |
| P30 | - | - | 30 | - | - |
| P40 | - | - | 40 | - | - |
| P50 | - | - | 50 | - | - |
| S10 | - | - | - | 10 | - |
| S20 | - | - | - | 20 | - |
| S30 | - | - | - | 30 | - |
| S40 | - | - | - | 40 | - |
| S50 | - | - | - | 50 | - |
| M10 | - | - | - | - | 10 |
| M20 | - | - | - | - | 20 |
| M30 | - | - | - | - | 30 |
| M40 | - | - | - | - | 40 |
| M50 | - | - | - | - | 50 |
| Oil | Concentration (g/100 g TVP) | ||||||||||||||
|---|---|---|---|---|---|---|---|---|---|---|---|---|---|---|---|
| 10 | 20 | 30 | 40 | 50 | |||||||||||
| Castor oil | 10.64 | ± | 0.64 Ba | 9.03 | ± | 0.59 CDb | 8.92 | ± | 0.20 Db | 7.80 | ± | 0.32 Dc | 7.55 | ± | 0.45 Dc |
| Orange oil | 9.91 | ± | 0.32 Ce | 11.04 | ± | 0.63 Ad | 14.76 | ± | 0.64 Bc | 16.05 | ± | 0.65 Cb | 19.40 | ± | 0.93 Ba |
| Palm oil | 10.26 | ± | 0.62 BCb | 8.65 | ± | 0.48 Dc | 7.73 | ± | 0.65 Ed | 7.34 | ± | 0.50 Ed | 17.68 | ± | 0.75 Ca |
| Shortening | 11.63 | ± | 0.64 Ad | 9.49 | ± | 0.89 BCe | 16.63 | ± | 0.68 Ac | 18.01 | ± | 0.64 Ab | 20.10 | ± | 1.00 Aa |
| Margarine | 11.26 | ± | 0.84 Ad | 9.62 | ± | 0.87 Be | 13.95 | ± | 0.78 Cc | 16.74 | ± | 0.33 Bb | 19.83 | ± | 0.33 ABa |
| Concentration (g/100 g TVP) | Oil | Water Contents (%) | t-Value (1) | |||||
|---|---|---|---|---|---|---|---|---|
| Non-Cooking | Cooking | |||||||
| 10 | Castor oil | 57.52 | ± | 0.39 Ca | 57.96 | ± | 0.24 Ca | NS |
| Orange oil | 61.61 | ± | 0.85 Ac | 63.34 | ± | 0.21 Ad | * | |
| Palm oil | 58.78 | ± | 0.58 Ba | 58.34 | ± | 0.03 Ba | NS | |
| Shortening | 58.43 | ± | 0.15 Ba | 58.39 | ± | 0.12 Ba | NS | |
| Margarine | 58.81 | ± | 0.09 Ba | 58.53 | ± | 0.21 Ba | NS | |
| 20 | Castor oil | 52.63 | ± | 0.25 Db | 53.61 | ± | 0.07 Cb | ** |
| Orange oil | 64.65 | ± | 0.13 Ab | 65.29 | ± | 0.34 Ac | * | |
| Palm oil | 53.51 | ± | 0.28 Cb | 52.96 | ± | 0.09 Db | * | |
| Shortening | 54.12 | ± | 0.07 Bb | 54.47 | ± | 0.29 Bb | NS | |
| Margarine | 54.40 | ± | 0.08 Bb | 54.75 | ± | 0.37 Bb | NS | |
| 30 | Castor oil | 48.91 | ± | 0.48 Dc | 49.53 | ± | 0.31 Dc | NS |
| Orange oil | 65.57 | ± | 0.17 Aa | 66.28 | ± | 0.08 Ab | ** | |
| Palm oil | 49.41 | ± | 0.49 CDc | 50.17 | ± | 0.43 Cc | NS | |
| Shortening | 50.13 | ± | 0.50 Cc | 52.59 | ± | 0.11 Bc | ** | |
| Margarine | 50.90 | ± | 0.26 Bc | 52.34 | ± | 0.26 Bc | ** | |
| 40 | Castor oil | 45.79 | ± | 0.29 Dd | 45.48 | ± | 0.58 Dd | NS |
| Orange oil | 66.21 | ± | 0.35 Aa | 66.45 | ± | 0.14 Ab | NS | |
| Palm oil | 47.42 | ± | 0.71 Cd | 46.68 | ± | 0.44 Cd | NS | |
| Shortening | 47.41 | ± | 0.42 Cd | 50.17 | ± | 0.25 Bd | ** | |
| Margarine | 48.56 | ± | 0.07 Bd | 50.96 | ± | 0.58 Bd | ** | |
| 50 | Castor oil | 44.04 | ± | 0.17 Ce | 42.68 | ± | 0.25 De | ** |
| Orange oil | 66.29 | ± | 0.50 Aa | 67.26 | ± | 0.41 Aa | NS | |
| Palm oil | 45.49 | ± | 0.37 Be | 44.32 | ± | 0.12 Ce | ** | |
| Shortening | 44.30 | ± | 0.28 Ce | 47.14 | ± | 0.46 Be | ** | |
| Margarine | 45.82 | ± | 0.41 Be | 47.52 | ± | 0.45 Be | ** | |
| Concentration (g/100 g TVP) | Oil | Liquid Holding Capacity (%) | t-Value (1) | |||||
|---|---|---|---|---|---|---|---|---|
| Non-Cooking | Cooking | |||||||
| 10 | Castor oil | 93.09 | ± | 0.94 Ba | 97.70 | ± | 0.85 Aa | ** |
| Orange oil | 96.80 | ± | 0.14 Aa | 95.79 | ± | 0.41 Ba | * | |
| Palm oil | 96.53 | ± | 0.32 Aa | 96.19 | ± | 0.53 Ba | NS | |
| Shortening | 96.16 | ± | 0.79 Aa | 95.98 | ± | 0.73 Ba | NS | |
| Margarine | 96.13 | ± | 0.62 Aa | 96.00 | ± | 0.10 Ba | NS | |
| 20 | Castor oil | 92.24 | ± | 0.57 Ca | 96.80 | ± | 0.13 Aa | *** |
| Orange oil | 96.11 | ± | 0.03 Aab | 94.86 | ± | 0.89 Bb | NS | |
| Palm oil | 96.42 | ± | 0.05 Aa | 96.44 | ± | 0.42 Aa | NS | |
| Shortening | 95.52 | ± | 0.20 Bab | 96.74 | ± | 0.16 Aa | ** | |
| Margarine | 96.51 | ± | 0.03 Aa | 96.18 | ± | 0.69 Aa | NS | |
| 30 | Castor oil | 89.38 | ± | 0.61 Cb | 95.21 | ± | 0.31 Bb | *** |
| Orange oil | 95.67 | ± | 0.58 Ab | 94.20 | ± | 0.08 Cbc | * | |
| Palm oil | 96.27 | ± | 0.74 Aa | 96.31 | ± | 0.22 Aa | NS | |
| Shortening | 94.42 | ± | 0.87 Bb | 96.28 | ± | 0.58 Aa | * | |
| Margarine | 95.81 | ± | 0.18 Aa | 96.45 | ± | 0.17 Aa | * | |
| 40 | Castor oil | 86.86 | ± | 0.63 Dc | 92.53 | ± | 0.28 Cc | *** |
| Orange oil | 94.71 | ± | 0.42 BCc | 94.01 | ± | 0.30 Bbc | NS | |
| Palm oil | 95.81 | ± | 0.42 Aab | 96.41 | ± | 0.29 Aa | NS | |
| Shortening | 95.65 | ± | 0.68 ABab | 96.31 | ± | 0.60 Aa | NS | |
| Margarine | 94.29 | ± | 0.51 Cb | 94.40 | ± | 0.61 Bb | NS | |
| 50 | Castor oil | 84.19 | ± | 0.29 Cd | 86.28 | ± | 0.84 Cd | * |
| Orange oil | 94.47 | ± | 0.46 ABc | 93.84 | ± | 0.45 Bc | NS | |
| Palm oil | 95.21 | ± | 0.74 Ab | 96.09 | ± | 0.30 Aa | NS | |
| Shortening | 94.72 | ± | 0.75 Ab | 95.89 | ± | 0.34 Aa | NS | |
| Margarine | 93.60 | ± | 0.35 Bb | 94.31 | ± | 0.71 Bb | NS | |
| Concentration (g/100 g TVP) | Oil | Liquid Holding Capacity (%) | t-Value (1) | |||||
|---|---|---|---|---|---|---|---|---|
| Non-Cooking | Cooking | |||||||
| 10 | Castor oil | 92.67 | ± | 0.63 Ba | 92.85 | ± | 0.43 Ca | NS |
| Orange oil | 94.54 | ± | 0.17 Aa | 94.31 | ± | 0.46 Ba | NS | |
| Palm oil | 93.12 | ± | 0.07 Ba | 95.25 | ± | 0.30 Aa | ** | |
| Shortening | 91.34 | ± | 0.97 Ca | 94.45 | ± | 0.12 Ba | * | |
| Margarine | 93.48 | ± | 0.79 ABa | 93.90 | ± | 0.23 Ba | NS | |
| 20 | Castor oil | 91.89 | ± | 0.61 BCa | 92.66 | ± | 0.87 Ba | NS |
| Orange oil | 94.40 | ± | 0.10 Aa | 94.07 | ± | 0.53 Aa | NS | |
| Palm oil | 92.92 | ± | 0.57 Ba | 94.44 | ± | 0.25 Aab | * | |
| Shortening | 90.41 | ± | 0.95 Da | 90.03 | ± | 0.20 Cb | NS | |
| Margarine | 90.97 | ± | 0.68 CDb | 90.41 | ± | 0.09 Cb | NS | |
| 30 | Castor oil | 91.50 | ± | 0.82 Ba | 91.33 | ± | 0.59 Bb | NS |
| Orange oil | 93.40 | ± | 0.86 Ab | 93.71 | ± | 0.09 Aab | NS | |
| Palm oil | 91.74 | ± | 0.81 Bb | 94.15 | ± | 0.18 Ab | * | |
| Shortening | 88.64 | ± | 0.37 Cb | 88.93 | ± | 0.78 Cc | NS | |
| Margarine | 88.35 | ± | 0.42 Cc | 87.38 | ± | 0.29 Cc | * | |
| 40 | Castor oil | 82.61 | ± | 0.22 Eb | 89.91 | ± | 0.50 Bc | *** |
| Orange oil | 92.81 | ± | 0.29 Ab | 93.26 | ± | 0.05 Ab | NS | |
| Palm oil | 90.77 | ± | 0.43 Bc | 92.60 | ± | 0.66 Ac | * | |
| Shortening | 86.93 | ± | 0.59 Cc | 84.91 | ± | 0.15 Cd | ** | |
| Margarine | 85.77 | ± | 0.85 Dd | 84.48 | ± | 0.12 Cd | NS | |
| 50 | Castor oil | 77.24 | ± | 0.80 Dc | 85.18 | ± | 0.45 Cd | *** |
| Orange oil | 92.89 | ± | 0.36 Ab | 93.28 | ± | 0.18 Ab | NS | |
| Palm oil | 81.91 | ± | 0.30 Cd | 88.43 | ± | 0.94 Bd | *** | |
| Shortening | 85.33 | ± | 0.09 Bd | 82.90 | ± | 0.75 De | ** | |
| Margarine | 82.35 | ± | 0.19 Ce | 80.92 | ± | 0.09 Ee | *** | |
| Concentration (g/100 g TVP) | Oil | Liquid Holding Capacity (%) | t-Value (1) | |||||
|---|---|---|---|---|---|---|---|---|
| Non-Cooking | Cooking | |||||||
| 10 | Castor oil | 90.91 | ± | 0.88 Ba | 94.26 | ± | 0.61 Aa | ** |
| Orange oil | 92.46 | ± | 0.25 Aa | 92.33 | ± | 0.19 Ca | NS | |
| Palm oil | 92.91 | ± | 0.74 Aa | 93.22 | ± | 0.45 Ba | NS | |
| Shortening | 87.85 | ± | 0.28 Ca | 92.25 | ± | 0.54 Ca | *** | |
| Margarine | 91.28 | ± | 0.14 Ba | 90.58 | ± | 0.35 Da | * | |
| 20 | Castor oil | 87.98 | ± | 0.70 Bb | 93.85 | ± | 0.27 Aa | *** |
| Orange oil | 91.14 | ± | 0.43 Ab | 90.60 | ± | 2.03 Bab | NS | |
| Palm oil | 91.52 | ± | 0.54 Ab | 92.18 | ± | 0.51 ABb | NS | |
| Shortening | 84.57 | ± | 0.30 Cb | 88.24 | ± | 0.22 Cb | *** | |
| Margarine | 88.25 | ± | 0.15 Bb | 87.38 | ± | 0.33 Cb | * | |
| 30 | Castor oil | 86.70 | ± | 0.22 Bc | 91.96 | ± | 0.16 Ab | *** |
| Orange oil | 90.16 | ± | 0.24 Ac | 89.97 | ± | 0.34 Bb | NS | |
| Palm oil | 90.74 | ± | 0.97 Ab | 91.55 | ± | 0.55 Ab | NS | |
| Shortening | 83.45 | ± | 0.67 Dc | 84.73 | ± | 0.87 Cc | NS | |
| Margarine | 84.52 | ± | 0.27 Cc | 85.34 | ± | 0.12 Cc | ** | |
| 40 | Castor oil | 85.65 | ± | 0.38 Bd | 91.78 | ± | 0.77 Ab | *** |
| Orange oil | 88.83 | ± | 0.59 Ad | 88.83 | ± | 0.49 Bbc | NS | |
| Palm oil | 88.37 | ± | 0.75 Ac | 88.76 | ± | 0.30 Bc | NS | |
| Shortening | 82.09 | ± | 0.58 Cd | 80.07 | ± | 0.59 Dd | * | |
| Margarine | 78.02 | ± | 0.37 Dd | 81.55 | ± | 0.34 Cd | *** | |
| 50 | Castor oil | 76.23 | ± | 0.42 Ce | 86.32 | ± | 0.20 Bc | *** |
| Orange oil | 88.62 | ± | 0.28 Ad | 88.14 | ± | 0.31 Ac | NS | |
| Palm oil | 80.33 | ± | 0.67 Bd | 87.70 | ± | 0.33 Ad | *** | |
| Shortening | 80.82 | ± | 0.44 Be | 77.12 | ± | 0.36 Ce | *** | |
| Margarine | 75.23 | ± | 0.40 De | 77.22 | ± | 0.23 Ce | ** | |
| Oil | Concentration (g/100 g TVP) | |||||||||||||||
|---|---|---|---|---|---|---|---|---|---|---|---|---|---|---|---|---|
| 10 | 20 | 30 | 40 | 50 | ||||||||||||
| Hardness (N) | Castor oil | 39.82 | ± | 1.02 Aa | 32.53 | ± | 1.81 Bb | 29.95 | ± | 1.33 Ac | 23.59 | ± | 0.38 Ad | 15.71 | ± | 0.27 Be |
| Orange oil | 41.44 | ± | 1.53 Aa | 36.84 | ± | 1.06 Ab | 29.36 | ± | 0.61 Ac | 25.49 | ± | 1.09 Ad | 23.05 | ± | 0.60 Ae | |
| Palm oil | 36.16 | ± | 3.74 Ba | 27.37 | ± | 0.91 Cb | 26.10 | ± | 0.73 Bb | 16.75 | ± | 1.69 Cc | 16.46 | ± | 2.00 Bc | |
| Shortening | 31.27 | ± | 3.25 Ca | 24.57 | ± | 1.20 Db | 22.58 | ± | 2.23 Cb | 21.24 | ± | 2.65 Bb | 12.41 | ± | 1.87 Cc | |
| Margarine | 29.35 | ± | 0.89 Ca | 26.36 | ± | 0.55 Cb | 19.82 | ± | 0.57 Dc | 17.54 | ± | 0.49 Cd | 14.85 | ± | 0.42 Be | |
| Adhesiveness (mJ) | Castor oil | 0.03 | ± | 0.05 Ab | 0.10 | ± | 0.00 Ab | 0.15 | ± | 0.17 Ab | 0.18 | ± | 0.10 Ab | 0.40 | ± | 0.16 Aa |
| Orange oil | 0.10 | ± | 0.08 Aa | 0.05 | ± | 0.06 Aa | 0.15 | ± | 0.24 Aa | 0.00 | ± | 0.00 Ca | 0.05 | ± | 0.10 Ba | |
| Palm oil | 0.05 | ± | 0.06 Ab | 0.03 | ± | 0.05 Ab | 0.15 | ± | 0.10 Aa | 0.00 | ± | 0.00 Cb | 0.03 | ± | 0.05 Bb | |
| Shortening | 0.05 | ± | 0.06 Aa | 0.08 | ± | 0.15 Aa | 0.03 | ± | 0.05 Aa | 0.05 | ± | 0.06 BCa | 0.15 | ± | 0.06 Ba | |
| Margarine | 0.03 | ± | 0.05 Ab | 0.05 | ± | 0.06 Ab | 0.10 | ± | 0.00 Aab | 0.10 | ± | 0.00 ABab | 0.18 | ± | 0.10 Ba | |
| Cohesiveness | Castor oil | 0.33 | ± | 0.04 Aa | 0.34 | ± | 0.06 Aba | 0.32 | ± | 0.03 BCa | 0.22 | ± | 0.02 Cb | 0.23 | ± | 0.01 Bb |
| Orange oil | 0.29 | ± | 0.01 Bc | 0.31 | ± | 0.03 Bbc | 0.29 | ± | 0.02 Cc | 0.33 | ± | 0.03 Aab | 0.36 | ± | 0.01 Aa | |
| Palm oil | 0.31 | ± | 0.04 ABab | 0.35 | ± | 0.02 ABa | 0.33 | ± | 0.01 Bab | 0.30 | ± | 0.01 Bb | 0.34 | ± | 0.03 Aa | |
| Shortening | 0.33 | ± | 0.01 Ac | 0.38 | ± | 0.02 Ab | 0.43 | ± | 0.03 Aa | 0.36 | ± | 0.01 Abc | 0.34 | ± | 0.02 Ac | |
| Margarine | 0.30 | ± | 0.01 ABc | 0.35 | ± | 0.02 ABb | 0.42 | ± | 0.02 Aa | 0.35 | ± | 0.03 Ab | 0.34 | ± | 0.01 Ab | |
| Oil | Concentration (g/100 g TVP) | |||||||||||||||
|---|---|---|---|---|---|---|---|---|---|---|---|---|---|---|---|---|
| 10 | 20 | 30 | 40 | 50 | ||||||||||||
| Springiness (mm) | Castor oil | 7.25 | ± | 0.55 Aa | 6.80 | ± | 0.58 Aab | 6.53 | ± | 0.31 Ab | 4.50 | ± | 0.35 Cc | 4.11 | ± | 0.37 Dc |
| Orange oil | 6.81 | ± | 0.31 Ab | 6.50 | ± | 0.90 Ab | 6.64 | ± | 0.40 Ab | 6.84 | ± | 0.19 Ab | 7.66 | ± | 0.26 Aa | |
| Palm oil | 6.81 | ± | 0.62 Aab | 7.39 | ± | 0.44 Aa | 7.02 | ± | 0.22 Aa | 6.31 | ± | 0.28 Bb | 6.32 | ± | 0.32 Bb | |
| Shortening | 6.98 | ± | 0.36 Aab | 7.19 | ± | 0.35 Aa | 6.56 | ± | 0.39 Abc | 6.29 | ± | 0.23 Bc | 5.63 | ± | 0.35 Cd | |
| Margarine | 6.66 | ± | 0.24 Aab | 7.08 | ± | 0.42 Aa | 6.95 | ± | 0.34 Aa | 6.19 | ± | 0.43 Bbc | 5.66 | ± | 0.40 Cc | |
| Gumminess (N) | Castor oil | 13.37 | ± | 2.35 Aa | 11.12 | ± | 2.49 Aab | 9.49 | ± | 0.65 ABb | 3.43 | ± | 0.28 Cc | 2.38 | ± | 0.56 Dc |
| Orange oil | 11.82 | ± | 1.10 ABa | 11.24 | ± | 1.22 Aa | 8.07 | ± | 1.15 ABb | 8.54 | ± | 1.74 Ab | 10.87 | ± | 0.74 Aa | |
| Palm oil | 11.21 | ± | 1.25 ABCa | 9.50 | ± | 0.42 ABab | 8.50 | ± | 1.86 ABb | 4.91 | ± | 0.58 Bc | 5.57 | ± | 1.05 Bc | |
| Shortening | 10.40 | ± | 1.14 BCa | 8.74 | ± | 1.20 Bab | 10.01 | ± | 1.68 Aa | 7.59 | ± | 0.92 Ab | 4.26 | ± | 0.45 Cc | |
| Margarine | 8.99 | ± | 0.65 Ca | 8.31 | ± | 0.39 Bab | 7.72 | ± | 0.37 Bb | 6.12 | ± | 0.36 Bc | 5.14 | ± | 0.46 BCd | |
| Chewiness (mJ) | Castor oil | 97.9 | ± | 23.1 Aa | 76.8 | ± | 22.8 Aab | 62.1 | ± | 6.0 Ab | 15.5 | ± | 2.4 Dc | 9.9 | ± | 3.0 Dc |
| Orange oil | 80.8 | ± | 10.8 ABa | 73.9 | ± | 17.0 Aab | 53.3 | ± | 4.4 Ac | 58.3 | ± | 11.0 Abc | 83.3 | ± | 6.0 Aa | |
| Palm oil | 76.7 | ± | 14.0 ABCa | 70.3 | ± | 6.4 Aab | 59.8 | ± | 13.5 Ab | 31.0 | ± | 3.9 Cc | 35.4 | ± | 8.5 Bc | |
| Shortening | 72.4 | ± | 5.5 BCa | 63.0 | ± | 9.9 Aa | 65.7 | ± | 11.9 Aa | 48.0 | ± | 7.5 ABb | 24.1 | ± | 3.6 Cc | |
| Margarine | 56.6 | ± | 5.1 Ca | 59.4 | ± | 3.8 Aa | 57.1 | ± | 2.6 Aa | 41.1 | ± | 8.2 BCb | 29.2 | ± | 4.2 BCc | |
| Oil | pH | ||
|---|---|---|---|
| Castor oil | 5.64 | ± | 0.02 D |
| Orange oil | 3.19 | ± | 0.04 E |
| Palm oil | 5.88 | ± | 0.03 C |
| Shortening | 6.31 | ± | 0.04 B |
| Margarine | 6.51 | ± | 0.05 A |
| Oil | Concentration (g/100 g TVP) | ||||||||||||||
|---|---|---|---|---|---|---|---|---|---|---|---|---|---|---|---|
| 10 | 20 | 30 | 40 | 50 | |||||||||||
| Castor oil | 22.12 | ± | 0.72 Cd | 24.27 | ± | 2.40 Ccd | 26.22 | ± | 0.59 Cbc | 27.66 | ± | 0.42 Cab | 29.22 | ± | 0.75 Ca |
| Orange oil | 30.15 | ± | 0.41 Ae | 32.54 | ± | 1.01 Ad | 33.96 | ± | 0.35 Ac | 35.36 | ± | 0.57 Ab | 36.91 | ± | 0.28 Aa |
| Palm oil | 28.41 | ± | 1.08 Bd | 29.33 | ± | 0.84 Bcd | 30.19 | ± | 0.52 Bbc | 31.46 | ± | 0.37 Bb | 33.46 | ± | 1.21 Ba |
| Shortening | 20.07 | ± | 1.11 Dd | 22.33 | ± | 0.42 Cc | 25.21 | ± | 1.84 Cb | 27.57 | ± | 0.34 Ca | 28.13 | ± | 0.47 Ca |
| Margarine | 21.67 | ± | 0.80 Cd | 23.01 | ± | 0.60 Cc | 26.21 | ± | 0.51 Cb | 27.91 | ± | 0.46 Ca | 28.65 | ± | 0.94 Ca |
Disclaimer/Publisher’s Note: The statements, opinions and data contained in all publications are solely those of the individual author(s) and contributor(s) and not of MDPI and/or the editor(s). MDPI and/or the editor(s) disclaim responsibility for any injury to people or property resulting from any ideas, methods, instructions or products referred to in the content. |
© 2023 by the authors. Licensee MDPI, Basel, Switzerland. This article is an open access article distributed under the terms and conditions of the Creative Commons Attribution (CC BY) license (https://creativecommons.org/licenses/by/4.0/).
Share and Cite
Cho, Y.; Bae, J.; Choi, M.-J. Physicochemical Characteristics of Meat Analogs Supplemented with Vegetable Oils. Foods 2023, 12, 312. https://doi.org/10.3390/foods12020312
Cho Y, Bae J, Choi M-J. Physicochemical Characteristics of Meat Analogs Supplemented with Vegetable Oils. Foods. 2023; 12(2):312. https://doi.org/10.3390/foods12020312
Chicago/Turabian StyleCho, Youngjae, Junhwan Bae, and Mi-Jung Choi. 2023. "Physicochemical Characteristics of Meat Analogs Supplemented with Vegetable Oils" Foods 12, no. 2: 312. https://doi.org/10.3390/foods12020312