Abstract
Mannan oligosaccharides (MOSs) have been implicated in the animal growth rate, health indices, and lipid oxidative stability. MOSs have been indicated to maintain intestinal health and anti-inflammatory effects via modulation of gut microbiota. Furthermore, the role of MOSs in modulating skeletal muscle function is largely unknown. Here, this study aimed to investigate the effects of MOS supplementation on muscle function and muscle mass in mice. Additionally, the possible underlying mechanisms, including the contributions of gut microbiota and microbial metabolites, were explored. In our study, 3-week-old C57BL/6J male mice (body weight of approximately 10.7 ± 1.1 g) were given pure water or pure water with 1% MOS. To study the effect of MOSs on gut-microbiota-derived metabolites, serum metabolic profiles were analyzed through untargeted metabolomic profiling. Moreover, we detected the downstream signals of differential metabolites, and decanoic acid (DA) was selected as our target spot. Then, DA was used to treat C2C12 cells, and we found that DA promotes C2C12 cell differentiation via the GPR84 and PI3K/AKT signaling pathways. In conclusion, these results showed that MOS supplementation improves muscle function and muscle mass. Additionally, gut microbiome and microbial metabolites were regulated by MOSs, and DA may be one of the most important links between the gut microbiome and skeletal muscle function regulation.
1. Introduction
Muscle development directly influences growth and health in humans and animals [1,2]. Therefore, altering the capacity and/or efficiency of muscle growth is very important [3]. Skeletal muscle is a highly adaptive tissue with plastic properties. Skeletal muscle is capable of altering its phenotype in response to external stimuli, including physiological stimuli, atrophy, disease, exercise and injury [4]. Exercise, hormonal and nutritional levels may all be involved in skeletal muscle hypertrophy and increase skeletal muscle mass. A variety of signaling molecules are involved in skeletal muscle hypertrophy. Insulin-like growth factor-1 (IGF-1) increases skeletal muscle hypertrophy via the PI3K/Akt/mTOR and PI3K/Akt/GSK3β pathways [5]. Recently, transplantation of the gut microbiota from pathogen-free mice into germ-free mice resulted in an improvement in germ-free mouse skeletal muscle atrophy [6]. This shows that the gut microbiome may influence the physiological functions of muscles.
Mannan oligosaccharides (MOSs) are low-molecular-weight carbohydrates, and the degree of polymerization can vary from 2 to 10 [7]. MOSs are nondigestible carbohydrates that cannot be hydrolyzed by pancreatic amylases but can be degraded by enzymes produced by the gut microbiome [8]. Thus, MOSs have no direct nutritive value, but they have been shown to be able to have a positive effect on the performance of animals [9]. MOSs are being utilized for the modulation of gut microbiota, and microbial metabolites, such as bile acids (BAs) and short-chain fatty acids (SCFAs), play an important role in improving human and animal health [10]. Studies of other carbohydrates have found similar results. Epilactose (a rare nondigestible disaccharide) can increase in UCP-1 in the skeletal muscle through propionic acid (a bacterial metabolite) [11]. Chitosan oligosaccharides promoted blood perfusion and neovascularization in the ischemic hindlimb muscle of mice. The changed gut microbiome and microbial metabolites might play an important role in this process [12]. MOSs have been indicated to maintain intestinal health and anti-inflammatory activity [13], while there is little research on the effect of MOSs on skeletal muscle function.
Thus, this study aimed to investigate the effects of MOS supplementation on muscle function and muscle mass in mice. In addition, the possible underlying mechanisms, including the contributions of gut microbiota and microbial metabolites, were explored. Furthermore, the selected metabolites were verified in C2C12 cells. Our data showed that MOS supplementation may activate the GPR84 and PI3K/AKT signaling pathways in skeletal muscle by increasing the level of DA in serum, thereby improving muscle fiber types and muscle function.
2. Materials and Methods
2.1. Animals and Experimental Design
All animal experiments were conducted with the permission number SYXK (Guangdong) 2019-0136.
Twelve 3-week-old C57BL/6J male mice (body weight 10.7 ± 1.1 g) were purchased from Guangdong Medical Laboratory Animal Center. The mice were housed in environmentally controlled rooms on a 12 h light–dark cycle.
The body weight of the mice was measured weekly. The experiment lasted 8 weeks. At the end of treatment, the mice were sacrificed by carbon dioxide anesthesia. The serum was collected and stored at −20 °C. Meanwhile, the gastrocnemius (GAS), soleus (Sol), tibialis anterior (TA) and extensor digitorum longus (EDL) were collected and weighed. These samples were stored at −80 °C until further analyses.
2.2. Dosage Information
The mice were randomly divided into two groups (n = 6). There was free feeding (diet composition in Table 1) and drinking of mice. The control group was given pure water. The MOS group was given pure water with 1% MOS (w/w). The MOS (the purity is 96.1%, 61.3% have a polymerization degree of 2–6, and the rest have a polymerization degree of 7–10) was purchased from Shaanxi Scipher Natural Products Co., Ltd. (Xi’an, China).

Table 1.
Diet composition (g/kg diet).
2.3. Body Composition
After 7 weeks of treatment, the body composition was assessed by using an NMR Analyzer (MesoQMR23-060H, Niumag Corporation, Shanghai, China).
2.4. Grip Strength and Weight Test
After the mice were fed for 7 weeks, the grip strength test was performed as previously described [14]. After the grip strength test, the mice rested for 3 days. Weight tests were performed as described previously [6].
2.5. Staining of ATPase
Staining of ATPase in GAS and cell count were performed as previously described [15].
2.6. Serum Metabolite Profile Assessment
Serum metabolic profiles were analyzed by untargeted metabolomic profiling using UPLC–MS/MS at Metaboprofile Biotechnology Co., Ltd. (Shanghai, China) [16].
2.7. 16S rRNA Microbiome Analysis
After 7 weeks of treatment, feces were collected in sterile centrifuge tubes and stored at −80° for further analyses. The fecal microbiome was sequenced by Metaboprofile Biotechnology Co., Ltd. (Shanghai, China). Fecal sample preparation and the sequencing protocol were based on a previously published method [17].
2.8. Western Blot Analysis
Western blotting was conducted as previously described [18]. A total of 20 μg of protein was loaded. The primary antibodies used included FXR (ab235094, Abcam PLC, Cambridge, UK), TGR5 (NBP2-23669, Novus Biologicals, Littleton, CO, USA), GPR84 (bs-13507R, Bioss, Beijing, China), TLR4 (sc-293072, Santa Cruz Biotechnology, Santa Cruz, CA, USA), p-AKT/AKT (#4060/9272s, CST, Danvers, MA, USA) and p-PI3K/PI3K (310163/R22768, ZEN-BIOSCIENCE, Chengdu, China).
2.9. Enzyme-Linked Immunosorbent Assay (ELISA)
cAMP and L-carnosine were detected by using ELISA kits according to the manufacturer’s instructions (Shanghai Ruifan Biotechnology Co., Ltd., Shanghai, China). The detection limits of the cAMP ELISA kit were 0–12 nmol/mL. The detection limits of the L-carnosine ELISA kit were 1–48 pmol/L.
2.10. Cell Culture and Treatment
The mouse myoblast cell line C2C12 was cultured based on a previously published method [15]. When cells reached 50% confluency, they were transfected with GPR84 siRNA (Guangzhou RiboBio Co., Ltd., Guangzhou, China). The transfection procedure was carried out according to the instructions of the manufacturer. When the cells reached 80% confluency, the culture media was switched to high glucose DMEM with 2% horse serum and 100 μM DA to induce myoblast differentiation into myotubes for 6 days. After treatment, the cells were harvested for further analyses.
2.11. Immunocytochemistry
The immunocytochemistry of C2C12 cells was performed as previously described [19]. The primary antibody used was MyHC (MAB4470, R&D Systems, Minneapolis, MN, USA). The secondary antibody used was goat anti-mouse IgM/Alexa Fluor 555 antibody (bs-0368G-AF555, Bioss, Beijing, China). Images were captured with a microscope at 20 X magnification (6 fields per sample captured), and the myotube diameter and myotube fusion index were counted by using IPP.
2.12. Statistical Analysis
Data are expressed as the mean ± S.E.M. Significance comparisons were performed using Student’s t-test and one-way ANOVA in Graphpad Prism 8.0, with p < 0.05 indicating a significant difference.
3. Results
3.1. Mannan Oligosaccharide Supplementation Shows Positive Effects on the Gastrocnemius Muscle
First of all, the role of MOS supplementation on growth and body composition in mice was investigated. Although MOS supplementation significantly decreased food intake and water intake (Figure 1B,C), it had no effect on body weight or body composition in mice (Figure 1A,D,E). Through the grip strength test and weight lifting test on mice, we found that the grip strength and weight lifting of mice were significantly improved in the MOS group (Figure 1F,G). Moreover, the GAS index was increased in the MOS group (Figure 1H). To explore the possible reasons for the enhancement of muscle function, the gastrocnemius was histologically stained. Staining of ATPase in GAS showed that the proportion of MHC 1 expression was decreased, while MHC 2a expression was increased in the MOS group (Figure 1I,J).
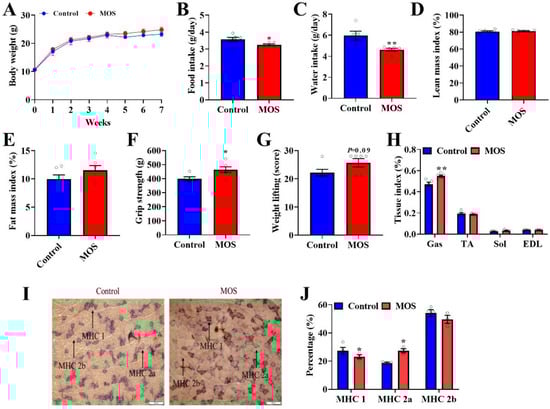
Figure 1.
Mannan oligosaccharide supplementation shows positive effects on the gastrocnemius. (A) Body weight of mice. (B) Average daily food intake. (C) Average daily water intake. (D,E) QMR analyses of body composition of mice. (F) The grip strength of mice. (G) The weight test of mice. (H) The GAS, TA, SOL and EDL tissue indices of mice. (I,J) Staining of ATPase in GAS. * p < 0.05 versus the control group, ** p < 0.01 versus the control group.
3.2. Serum Metabolic Profiles of Mice Fed Mannan Oligosaccharides
According to previous studies, MOSs resist the hydrolysis of intestinal digestive enzymes and regulate organism metabolism through the decomposition of the gut microbiome [20]. To study the effect of MOSs on gut-microbiota-derived metabolites, serum metabolic profiles were analyzed through untargeted metabolomic profiling by using a UPLC–MS/MS system. The differential metabolites were analyzed by orthogonal partial least squares discriminant analysis (OPLS–DA). The results showed that there was a distinct difference between the control and MOS groups (Figure 2A), which means that MOS supplementation influenced the serum metabolic profile in mice. As shown in Figure 2B, 148 gut microbiome metabolites were detected in the control and MOS groups. Among these metabolites, seven gut microbiome metabolites were significantly upregulated in the MOS group. Specifically, gut microbiome metabolites including decanoic acid (DA, FC value = 1.63), alanine (FC value = 1.21), hyodeoxycholic acid (HDCA, FC value = 19.67), asparagine (FC value = 1.27), lithocholic acid (LCA, FC value = 13.12), 3-methyl-2-oxopentanoic acid (FC value = 1.36) and alpha-ketoisovaleric acid (FC value = 1.35) were significantly upregulated (Figure 2C–I).
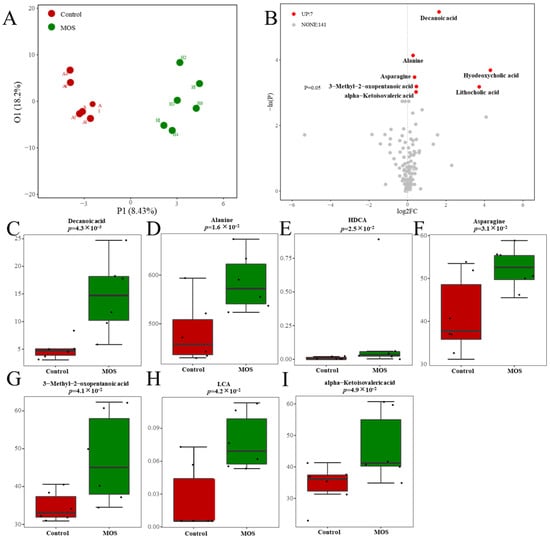
Figure 2.
Serum metabolic profiles of mice fed mannan oligosaccharides. (A) The serum metabolome by OPLS–DA. (B) Metabolites in mice serum of volcano plot. (C–I) The box charts show the detailed serum metabolites and significant changes between the control and MOS groups (μM). Up, upregulated; FC, fold change.
3.3. The Gut Microbiome of Mice Fed Mannan Oligosaccharides
To investigate the effects of MOS supplementation on the gut microbiome of mice, the fecal microbiota composition was evaluated by 16S rRNA gene sequencing. The relative abundance analysis at the phylum level showed no apparent differences (Figure 3A). OTU Venn analysis, principal coordinate analysis and hierarchical clustering analysis showed differences in the microbiome (Figure 3B–D). As shown in Figure 3E, the MOS group had higher community richness. However, MOS supplementation had no significant differences in microbiota community diversity (Figure 3F,G). LEfSe was used for linear discriminant analysis (LDA) to identify significant differences in the abundance of the microbiota. The different species (LDA score > 2, p < 0.05) are shown in Figure 3H. Spearman correlation analysis was conducted between the serum differential metabolites (Figure 2A) and the differential microbiome (Figure 3D). Interestingly, there was a positive correlation between the abundances of specific microbiota (Candidatus_Stoquefichus, Ileibacterium, Lachnospiraceae_UCG_008 and Ruminococcus_1), which were significantly increased, and metabolites were significantly increased in the MOS group (Figure 3I). In contrast, there was a negative correlation between the abundance of the microbiota (Pelagibacterium), which was increased significantly in the control group, and specific metabolites (DA, asparagine, alanine and HDCA) (Figure 3I). These results indicated that these differential microbiomes were closely associated with and might contribute to the altered serum metabolic profiles in response to MOS supplementation.
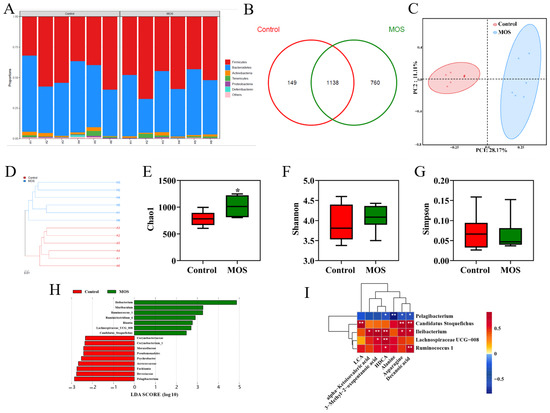
Figure 3.
Gut microbiome of mice fed mannan oligosaccharides. (A) Relative abundance analysis at the phylum level. (B) OTU Venn analysis. (C) Principal coordinate analysis (PCOA). (D) Hierarchical clustering analysis. (E) Chao1 value. (F,G) Shannon and Simpson index of gut microbiota. (H) LDA score of gut microbiota. (I) Correlations between serum differential metabolites and differential gut microbiota. * p < 0.05 versus the control group.
3.4. Decanoic Acid May Be the Key Metabolite That Mediates the Effects of Mannan Oligosaccharides on Skeletal Muscle
To explore which metabolite caused an increase in mouse skeletal muscle function, we examined the downstream signals of differential metabolites. Among the seven significantly changed metabolites, asparagine, 3-methyl-2-oxopentanoic acid and alpha-ketoisovaleric acid had a lower fold change than the other metabolites, so we will focus on DA, alanine, HDCA and LCA. HDCA and LCA, as secondary bile acids, play a role in organism metabolism through bile acid receptors. Therefore, the protein expression levels of FXR and TGR in the GAS were detected. Western blot analysis revealed that the expression of FXR and TGR5 was not significantly different (Figure 4A,B). In addition, the cAMP level in the gastrocnemius was not significantly different, which is a downstream signaling molecule of TGR5 (Figure 4C). There was no significant difference in the L-carnosine level, which is composed of alanine and histidine (Figure 4D). The level of expression of MCFA receptors was detected, and GPR84 was significantly increased in the MOS group (Figure 4E,F). Furthermore, the PI3K/AKT signaling pathway was activated in the MOS group (Figure 4E,F). In summary, we speculate that MOS supplementation may activate the GPR84 and PI3K/AKT signaling pathways in GAS by increasing the level of DA in serum.
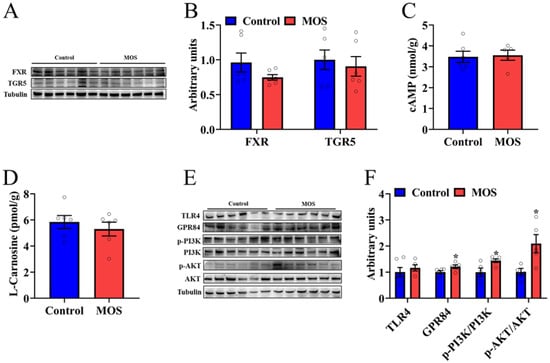
Figure 4.
Decanoic acid may be the key metabolite that mediates the effects of mannan oligosaccharides on skeletal muscle. (A,B) The protein expression level of FXR and TGR5 in the GAS. (C,D) cAMP and L-carnosine concentrations in the GAS. (E,F) The protein expression level of TLR4, GPR84 and PI3K/AKT signaling pathways in the GAS. * p < 0.05 versus the control group.
3.5. Decanoic Acid Mediates C2C12 Cell Differentiation through the GPR84 and PI3K/AKT Signaling Pathways
To prove the regulatory effect of DA on skeletal muscle, DA was used to treat C2C12 cells, and the results were consistent with those in mice. After DA treatment, the protein expression level of GPR84 was significantly upregulated, and the PI3K/AKT signaling pathway was activated (Figure 5A,B). Additionally, immunocytochemistry of C2C12 cells showed that DA significantly increased the myotube diameter and myotube fusion index (Figure 5C–E). Moreover, the protein expression of MyHC was increased significantly (Figure 5F,G), and MyHC 1 had a tendency to convert to MyHC 2a (Figure 5F,G). To further confirm that GPR84 plays a role in DA-mediated promotion of C2C12 cell differentiation, GPR84 siRNA was used to knockdown the expression of GPR84. As expected, the protein expression of GPR84 was significantly decreased by GPR84 siRNA, while the phosphorylation levels of PI3K and AKT were not significantly different (Figure 5A,B). Consistently, the increase in C2C12 cell differentiation induced by DA was eliminated by GPR84 siRNA (Figure 5C–G). These results demonstrated that DA promotes C2C12 cell differentiation via GPR84.
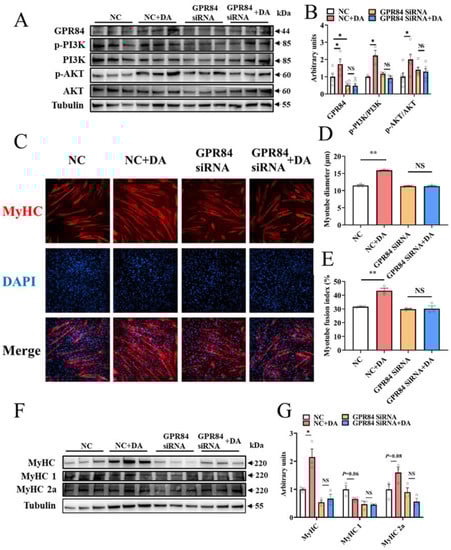
Figure 5.
Decanoic acid mediates C2C12 cell differentiation through the GPR84 and PI3K/AKT signaling pathways. (A,B) The protein expression level of GPR84 and PI3K/AKT signaling pathways in C2C12 cells. (C–E) Immunocytochemistry of myotubes in C2C12 cells. Red: MyHC; blue: DAPI. (F,G) The protein expression level of MyHC, MyHC 1 and MyHC 2a in C2C12 cells. NS indicates no significant differences. * p < 0.05 versus the control group, ** p < 0.01 versus the control group.
4. Discussion
Consistent with previous reports, we found that MOS supplementation had no discernible effect on body weight or composition [21]. Significantly better body weight gain and feed conversion ratios were observed in broiler chickens supplemented with MOS [22]. In our study, the decrease in food intake and water intake also proves that MOSs decrease the feed conversion ratio. This may be due to MOSs improving nutrient availability and absorption. A previous study has shown that type 2 fibers have the largest diameter and highest myofibrillar and ATPase activities [23]. In this study, MOS supplementation decreased the proportion of type I muscle fibers while increasing the proportion of type IIa muscle fibers in the GAS. Therefore, we speculate that the increase in muscle function and mass is due to the increase in the proportion of IIa muscle fibers. The synbiotic-supplemented (comprising MOSs) diet alters the fatty acid composition of broiler muscles [24]. Dietary supplementation with chitosan and galacto-mannan-oligosaccharides may improve growth and feed conversion by increasing plasma IGF-I levels and increasing muscle IGF-1 mRNA expression levels in piglets [25]. In this study, supplemented MOSs increased MCFA (DA) levels in serum. This study found that supplemented MOSs activate the AKT/PI3K signaling pathway downstream of IGF-1.
Because MOS supplementation affects muscle function and muscle mass, we further explored the possible underlying mechanisms. One study indicates that MOSs can help the proliferation of beneficial microbes to improve animal health [26]. Our results showed that the MOS group had more microbiota species. MOSs could improve health by modulating the composition of the gut microbiome and by changing microbial metabolites such as SCFAs in the feces and serum [27,28]. Although MOS supplementation reshaped the gut microbiota in mice, the composition of the gut microbiota and microbial metabolites were different from those in these previous studies, which might be explained by the differences in the dietary pattern, the composition of treatment, the experiment duration and the feeding environment.
In the gut, the microbiota can produce many substances, such as fatty acids and bile acids, which contribute to the physiology of the host [29]. These metabolites exert their effects within the host as signaling molecules and substrates for metabolic reactions [30]. In myostatin-edited Large White pigs, there was a significant correlation between Candidatus_Stoquefichus and glycerophospholipid metabolites [31]. It has been reported that in LPS-challenged piglets, LPS disturbs the normal enterohepatic circulation of bile acids, which may be due to LPS changing operational taxonomic units related to Ileibacterium [32]. Lachnospiraceae UCG-008 can enhance the utilization efficiencies of cellulose and hemicellulose from native forage [33]. Other studies have shown that serum bile acid levels were significantly correlated with the abundance of Ruminococcus_1 (T. Li et al., 2021). This is similar to our research, in which these bacteria were correlated with changes in metabolites.
In our study, a total of seven microbial metabolites were changed, including DA, alanine, HDCA, LCA, asparagine, 3-methyl-2-oxopentanoic acid and alpha-ketoisovaleric acid. These latter three metabolites are intermediate products of amino acid metabolism, and there are fewer reports related to skeletal muscle [34,35,36]. In our study, these metabolites had a lower fold change and p value than other metabolites, so we focused on other metabolites. HDCA and LCA, as secondary bile acids, play a role in organism metabolism through bile acid receptors [37]. Other studies have shown that the BA receptors FXR and TGR5 can regulate skeletal muscle function and metabolism [38]. Alanine combines with histidine to form L-carnosine, which relieves muscle damage caused by oxidative stress [39]. DA increases the capacity for fatty acid oxidation in skeletal muscle [40]. Although these metabolites changed, only the downstream signals of DA changed accordingly. We speculate that although the changes in these metabolites are significantly different, they are still not enough to cause changes in downstream signals. DA had the largest change, with an average increase of approximately three times, and thus caused a change in the downstream signal.
GPR84 has high expression in skeletal muscle as an MCFA receptor and plays an important role in regulating mitochondrial function [41]. It has been demonstrated that lauric-acid-induced activation of the PI3K/AKT signaling pathway was inhibited by GPR84 siRNA [42]. Consistent with previous reports, DA-induced activation of the PI3K/AKT signaling pathway was inhibited by GPR84 siRNA. It has been reported that activation of the PI3K/AKT signaling pathway promotes skeletal muscle hypertrophy and mass [43]. In this study, MOS supplementation enhanced muscle function and muscle mass in mice and activated the PI3K/AKT signaling pathway. Similar results were found in cell experiments, in which DA treatment promoted the differentiation of C2C12 cells by activating the PI3K/AKT signaling pathway.
5. Conclusions
In conclusion, MOS supplementation improves muscle function and muscle mass. Additionally, gut microbiome and microbial metabolites were regulated by MOSs, and DA may be one of the most important links between the gut microbiome and skeletal muscle function regulation. Specifically, we speculate that MOS supplementation may activate the GPR84 and PI3K/AKT signaling pathways in skeletal muscle by increasing the level of DA in serum, thereby improving muscle mass and muscle function.
Author Contributions
W.Z.: investigation; validation; writing-original draft. L.C., W.T., Y.L. and L.S.: investigation. X.Z., S.W., P.G., C.Z. and G.S.: project administration. L.W. and Q.J.: funding acquisition; resources; supervision; writing- review and editing. All authors have read and agreed to the published version of the manuscript.
Funding
This research was funded by the National Natural Science Foundation of China, grant numbers 31790411 and 32072779.
Institutional Review Board Statement
All animal experiments were conducted with the permission number SYXK (Guangdong) 2019-0136, and animal care procedures were performed in accordance with the guidelines for the care and use of animals approved by The Animal Ethics Committee of South China Agricultural University.
Informed Consent Statement
Not applicable.
Data Availability Statement
Data available on request due to restrictions eg privacy or ethical.
Conflicts of Interest
The authors declare no conflict of interest.
References
- Castro, F.L.S.; Su, S.; Choi, H.; Koo, E.; Kim, W.K. L-Arginine Supplementation Enhances Growth Performance, Lean Muscle, and Bone Density but Not Fat in Broiler Chickens. Poult. Sci. 2019, 98, 1716–1722. [Google Scholar] [CrossRef] [PubMed]
- Dostalova, A.; Svitakova, A.; Bures, D.; Valis, L.; Volek, Z. Effect of an Outdoor Access System on the Growth Performance, Carcass Characteristics, and Longissimus Lumborum Muscle Meat Quality of the Prestice Black-Pied Pig Breed. Animals 2020, 10, 1244. [Google Scholar] [CrossRef] [PubMed]
- Anthony, T.G. Mechanisms of Protein Balance in Skeletal Muscle. Domest. Anim. Endocrinol. 2016, 56, S23–S32. [Google Scholar] [CrossRef]
- Bassel-Duby, R.; Olson, E.N. Signaling Pathways in Skeletal Muscle Remodeling. Annu. Rev. Biochem. 2006, 75, 19–37. [Google Scholar] [CrossRef] [PubMed]
- Schiaffino, S.; Dyar, K.A.; Ciciliot, S.; Blaauw, B.; Sandri, M. Mechanisms Regulating Skeletal Muscle Growth and Atrophy. FEBS J. 2013, 280, 4294–4314. [Google Scholar] [CrossRef]
- Lahiri, S.; Kim, H.; Garcia-Perez, I.; Reza, M.M.; Martin, K.A.; Kundu, P.; Cox, L.M.; Selkrig, J.; Posma, J.M.; Zhang, H.; et al. The Gut Microbiota Influences Skeletal Muscle Mass and Function in Mice. Sci. Transl. Med. 2019, 11, eaan5662. [Google Scholar] [CrossRef]
- Tiwari, U.P.; Fleming, S.A.; Abdul, R.M.S.; Jha, R.; Dilger, R.N. The Role of Oligosaccharides and Polysaccharides of Xylan and Mannan in Gut Health of Monogastric Animals. J. Nutr. Sci. 2020, 9, e21. [Google Scholar] [CrossRef]
- Fu, X.; Liu, Z.; Zhu, C.; Mou, H.; Kong, Q. Nondigestible Carbohydrates, Butyrate, and Butyrate-Producing Bacteria. Crit. Rev. Food Sci. Nutr. 2019, 59, S130–S152. [Google Scholar] [CrossRef]
- Martin, R.; Chamignon, C.; Mhedbi-Hajri, N.; Chain, F.; Derrien, M.; Escribano-Vazquez, U.; Garault, P.; Cotillard, A.; Pham, H.P.; Chervaux, C.; et al. The Potential Probiotic Lactobacillus Rhamnosus CNCM I-3690 Strain Protects the Intestinal Barrier by Stimulating Both Mucus Production and Cytoprotective Response. Sci. Rep. 2019, 9, 5398. [Google Scholar] [CrossRef]
- Jana, U.K.; Suryawanshi, R.K.; Prajapati, B.P.; Kango, N. Prebiotic Mannooligosaccharides: Synthesis, Characterization and Bioactive Properties. Food Chem. 2021, 342, 128328. [Google Scholar] [CrossRef]
- Murakami, Y.; Ojima-Kato, T.; Saburi, W.; Mori, H.; Matsui, H.; Tanabe, S.; Suzuki, T. Supplemental Epilactose Prevents Metabolic Disorders through Uncoupling Protein-1 Induction in the Skeletal Muscle of Mice Fed High-Fat Diets. Br. J. Nutr. 2015, 114, 1774–1783. [Google Scholar] [CrossRef] [PubMed]
- Zhu, L.; Hu, B.; Guo, Y.; Yang, H.; Zheng, J.; Yao, X.; Hu, H.; Liu, H. Effect of Chitosan Oligosaccharides on Ischemic Symptom and Gut Microbiota Disbalance in Mice with Hindlimb Ischemia. Carbohydr. Polym. 2020, 240, 116271. [Google Scholar] [CrossRef] [PubMed]
- Thambiraj, S.R.; Phillips, M.; Koyyalamudi, S.R.; Reddy, N. Yellow Lupin (Lupinus luteus L.) Polysaccharides: Antioxidant, Immunomodulatory and Prebiotic Activities and Their Structural Characterisation. Food Chem. 2018, 267, 319–328. [Google Scholar] [CrossRef] [PubMed]
- Zhao, W.; Su, H.; Wang, L.; Sun, L.; Luo, P.; Li, Y.; Wu, H.; Shu, G.; Wang, S.; Gao, P.; et al. Effects of Maternal Dietary Supplementation of Phytosterol Esters during Gestation on Muscle Development of Offspring in Mice. Biochem. Biophys. Res. Commun. 2019, 520, 479–485. [Google Scholar] [CrossRef]
- Wang, L.; Luo, L.; Zhao, W.; Yang, K.; Shu, G.; Wang, S.; Gao, P.; Zhu, X.; Xi, Q.; Zhang, Y.; et al. Lauric Acid Accelerates Glycolytic Muscle Fiber Formation through TLR4 Signaling. J. Agric. Food Chem. 2018, 66, 6308–6316. [Google Scholar] [CrossRef]
- Han, J.; Gagnon, S.; Eckle, T.; Borchers, C.H. Metabolomic Analysis of Key Central Carbon Metabolism Carboxylic Acids as Their 3-Nitrophenylhydrazones by UPLC/ESI-MS. Electrophoresis 2013, 34, 2891–2900. [Google Scholar] [CrossRef]
- Lozupone, C.; Lladser, M.E.; Knights, D.; Stombaugh, J.; Knight, R. UniFrac: An Effective Distance Metric for Microbial Community Comparison. ISME J. 2011, 5, 169–172. [Google Scholar] [CrossRef]
- Ye, J.; Ai, W.; Zhang, F.; Zhu, X.; Shu, G.; Wang, L.; Gao, P.; Xi, Q.; Zhang, Y.L.; Jiang, Q.; et al. Enhanced Proliferation of Porcine Bone Marrow Mesenchymal Stem Cells Induced by Extracellular Calcium Is Associated with the Activation of the Calcium-Sensing Receptor and ERK Signaling Pathway. Stem. Cells Int. 2016, 2016, 6570671. [Google Scholar] [CrossRef]
- Li, F.; Yin, C.; Ma, Z.; Yang, K.; Sun, L.; Duan, C.; Wang, T.; Hussein, A.; Wang, L.; Zhu, X.; et al. PHD3 Mediates Denervation Skeletal Muscle Atrophy through Nf-KappaB Signal Pathway. FASEB J. 2021, 35, e21444. [Google Scholar] [CrossRef]
- Gao, G.; Cao, J.; Mi, L.; Feng, D.; Deng, Q.; Sun, X.; Zhang, H.; Wang, Q.; Wang, J. BdPUL12 Depolymerizes β-Mannan-like Glycans into Mannooligosaccharides and Mannose, Which Serve as Carbon Sources for Bacteroides Dorei and Gut Probiotics. Int. J. Biol. Macromol. 2021, 187, 664–674. [Google Scholar] [CrossRef]
- Zheng, J.; Li, H.; Zhang, X.; Jiang, M.; Luo, C.; Lu, Z.; Xu, Z.; Shi, J. Prebiotic Mannan-Oligosaccharides Augment the Hypoglycemic Effects of Metformin in Correlation with Modulating Gut Microbiota. J. Agric. Food Chem. 2018, 66, 5821–5831. [Google Scholar] [CrossRef] [PubMed]
- Dev, K.; Akbar, M.N.; Biswas, A.; Kannoujia, J.; Begum, J.; Kant, R. Dietary Mannan-Oligosaccharides Potentiate the Beneficial Effects of Bifidobacterium Bifidum in Broiler Chicken. Lett. Appl. Microbiol. 2020, 71, 520–530. [Google Scholar] [CrossRef]
- Lefaucheur, L. A Second Look into Fibre Typing—Relation to Meat Quality. Meat. Sci. 2010, 84, 257–270. [Google Scholar] [CrossRef] [PubMed]
- Salah, A.S.; Ahmed-Farid, O.A.; El-Tarabany, M.S. Carcass Yields, Muscle Amino Acid and Fatty Acid Profiles, and Antioxidant Indices of Broilers Supplemented with Synbiotic and/or Organic Acids. J. Anim. Physiol. Anim. Nutr. 2019, 103, 41–52. [Google Scholar] [CrossRef] [PubMed]
- Tang, Z.R.; Yin, Y.L.; Nyachoti, C.M.; Huang, R.L.; Li, T.J.; Yang, C.; Yang, X.J.; Gong, J.; Peng, J.; Qi, D.S.; et al. Effect of Dietary Supplementation of Chitosan and Galacto-Mannan-Oligosaccharide on Serum Parameters and the Insulin-like Growth Factor-I MRNA Expression in Early-Weaned Piglets. Domest. Anim. Endocrinol. 2005, 28, 430–441. [Google Scholar] [CrossRef] [PubMed]
- Amaretti, A.; Bernardi, T.; Leonardi, A.; Raimondi, S.; Zanoni, S.; Rossi, M. Fermentation of Xylo-Oligosaccharides by Bifidobacterium Adolescentis DSMZ 18350: Kinetics, Metabolism, and Beta-Xylosidase Activities. Appl. Microbiol. Biotechnol. 2013, 97, 3109–3117. [Google Scholar] [CrossRef]
- Wang, H.; Zhang, X.; Wang, S.; Li, H.; Lu, Z.; Shi, J.; Xu, Z. Mannan-Oligosaccharide Modulates the Obesity and Gut Microbiota in High-Fat Diet-Fed Mice. Food Funct. 2018, 9, 3916–3929. [Google Scholar] [CrossRef]
- Yan, S.; Shi, R.; Li, L.; Ma, S.; Zhang, H.; Ye, J.; Wang, J.; Pan, J.; Wang, Q.; Jin, X.; et al. Mannan Oligosaccharide Suppresses Lipid Accumulation and Appetite in Western-Diet-Induced Obese Mice Via Reshaping Gut Microbiome and Enhancing Short-Chain Fatty Acids Production. Mol. Nutr. Food Res. 2019, 63, e1900521. [Google Scholar] [CrossRef]
- Sun, L.; Xie, C.; Wang, G.; Wu, Y.; Wu, Q.; Wang, X.; Liu, J.; Deng, Y.; Xia, J.; Chen, B.; et al. Gut Microbiota and Intestinal FXR Mediate the Clinical Benefits of Metformin. Nat. Med. 2018, 24, 1919–1929. [Google Scholar] [CrossRef]
- Krautkramer, K.A.; Fan, J.; Backhed, F. Gut Microbial Metabolites as Multi-Kingdom Intermediates. Nat. Rev. Microbiol. 2021, 19, 77–94. [Google Scholar] [CrossRef]
- Pei, Y.; Chen, C.; Mu, Y.; Yang, Y.; Feng, Z.; Li, B.; Li, H.; Li, K. Integrated Microbiome and Metabolome Analysis Reveals a Positive Change in the Intestinal Environment of Myostatin Edited Large White Pigs. Front. Microbiol. 2021, 12, 628685. [Google Scholar] [CrossRef]
- Xiao, X.; Cheng, Y.; Fu, J.; Lu, Z.; Wang, F.; Jin, M.; Zong, X.; Wang, Y. Gut Immunity and Microbiota Dysbiosis Are Associated with Altered Bile Acid Metabolism in LPS-Challenged Piglets. Oxid Med. Cell Longev. 2021, 2021, 6634821. [Google Scholar] [CrossRef]
- Yang, C.; Tsedan, G.; Liu, Y.; Hou, F. Shrub Coverage Alters the Rumen Bacterial Community of Yaks (Bos Grunniens) Grazing in Alpine Meadows. J. Anim. Sci. Technol. 2020, 62, 504–520. [Google Scholar] [CrossRef]
- Kohno, J.; Koguchi, Y.; Nishio, M.; Nakao, K.; Kuroda, M.; Shimizu, R.; Ohnuki, T.; Komatsubara, S. Structures of TMC-95A-D: Novel Proteasome Inhibitors from Apiospora Montagnei Sacc. TC 1093. J. Org. Chem. 2000, 65, 990–995. [Google Scholar] [CrossRef]
- Kwon, W.B.; Touchette, K.J.; Simongiovanni, A.; Syriopoulos, K.; Wessels, A.; Stein, H.H. Excess Dietary Leucine in Diets for Growing Pigs Reduces Growth Performance, Biological Value of Protein, Protein Retention, and Serotonin Synthesis1. J. Anim. Sci. 2019, 97, 4282–4292. [Google Scholar] [CrossRef]
- Wagenmakers, A.J. Protein and Amino Acid Metabolism in Human Muscle. Adv. Exp. Med. Biol. 1998, 441, 307–319. [Google Scholar] [CrossRef]
- Abrigo, J.; Gonzalez, F.; Aguirre, F.; Tacchi, F.; Gonzalez, A.; Meza, M.P.; Simon, F.; Cabrera, D.; Arrese, M.; Karpen, S.; et al. Cholic Acid and Deoxycholic Acid Induce Skeletal Muscle Atrophy through a Mechanism Dependent on TGR5 Receptor. J. Cell Physiol. 2021, 236, 260–272. [Google Scholar] [CrossRef]
- Sasaki, T.; Kuboyama, A.; Mita, M.; Murata, S.; Shimizu, M.; Inoue, J.; Mori, K.; Sato, R. The Exercise-Inducible Bile Acid Receptor Tgr5 Improves Skeletal Muscle Function in Mice. J. Biol. Chem. 2018, 293, 10322–10332. [Google Scholar] [CrossRef]
- Blancquaert, L.; Everaert, I.; Derave, W. Beta-Alanine Supplementation, Muscle Carnosine and Exercise Performance. Curr. Opin. Clin. Nutr. Metab. Care 2015, 18, 63–70. [Google Scholar] [CrossRef]
- Abe, T.; Hirasaka, K.; Kohno, S.; Tomida, C.; Haruna, M.; Uchida, T.; Ohno, A.; Oarada, M.; Teshima-Kondo, S.; Okumura, Y.; et al. Capric Acid Up-Regulates UCP3 Expression without PDK4 Induction in Mouse C2C12 Myotubes. J. Nutr. Sci. Vitaminol. 2016, 62, 32–39. [Google Scholar] [CrossRef]
- Montgomery, M.K.; Osborne, B.; Brandon, A.E.; O’Reilly, L.; Fiveash, C.E.; Brown, S.H.J.; Wilkins, B.P.; Samsudeen, A.; Yu, J.; Devanapalli, B.; et al. Regulation of Mitochondrial Metabolism in Murine Skeletal Muscle by the Medium-Chain Fatty Acid Receptor Gpr84. FASEB J. 2019, 33, 12264–12276. [Google Scholar] [CrossRef] [PubMed]
- Meng, Y.; Zhang, J.; Zhang, F.; Ai, W.; Zhu, X.; Shu, G.; Wang, L.; Gao, P.; Xi, Q.; Zhang, Y.; et al. Lauric Acid Stimulates Mammary Gland Development of Pubertal Mice through Activation of GPR84 and PI3K/Akt Signaling Pathway. J. Agric. Food Chem. 2017, 65, 95–103. [Google Scholar] [CrossRef] [PubMed]
- Yoshida, T.; Delafontaine, P. Mechanisms of IGF-1-Mediated Regulation of Skeletal Muscle Hypertrophy and Atrophy. Cells 2020, 9, 1970. [Google Scholar] [CrossRef] [PubMed]


Disclaimer/Publisher’s Note: The statements, opinions and data contained in all publications are solely those of the individual author(s) and contributor(s) and not of MDPI and/or the editor(s). MDPI and/or the editor(s) disclaim responsibility for any injury to people or property resulting from any ideas, methods, instructions or products referred to in the content. |
© 2023 by the authors. Licensee MDPI, Basel, Switzerland. This article is an open access article distributed under the terms and conditions of the Creative Commons Attribution (CC BY) license (https://creativecommons.org/licenses/by/4.0/).