
Assessment of Exposure to Aluminum through Consumption of Noodle Products

 , and
, and
Abstract
: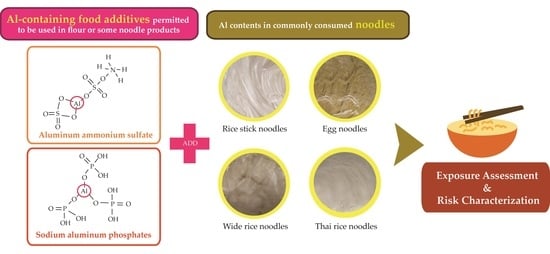
1. Introduction
2. Materials and Methods
2.1. Chemicals
2.2. Noodle Samples
2.3. Method Validation
2.4. Determination of Al Contents in Noodles
2.5. Effect of Cooking
2.6. Consumption Data of Noodles
2.7. Exposure Assessment
2.8. Risk Characterization
2.9. Statistical Analysis
3. Results and Discussion
3.1. Method Validation of Determination of Al in Noodles
3.2. Concentration of Al in the Noodle Product Samples
3.3. Effect of Cooking on Al Contents in Noodle Products
3.4. Consumption Data of Noodles
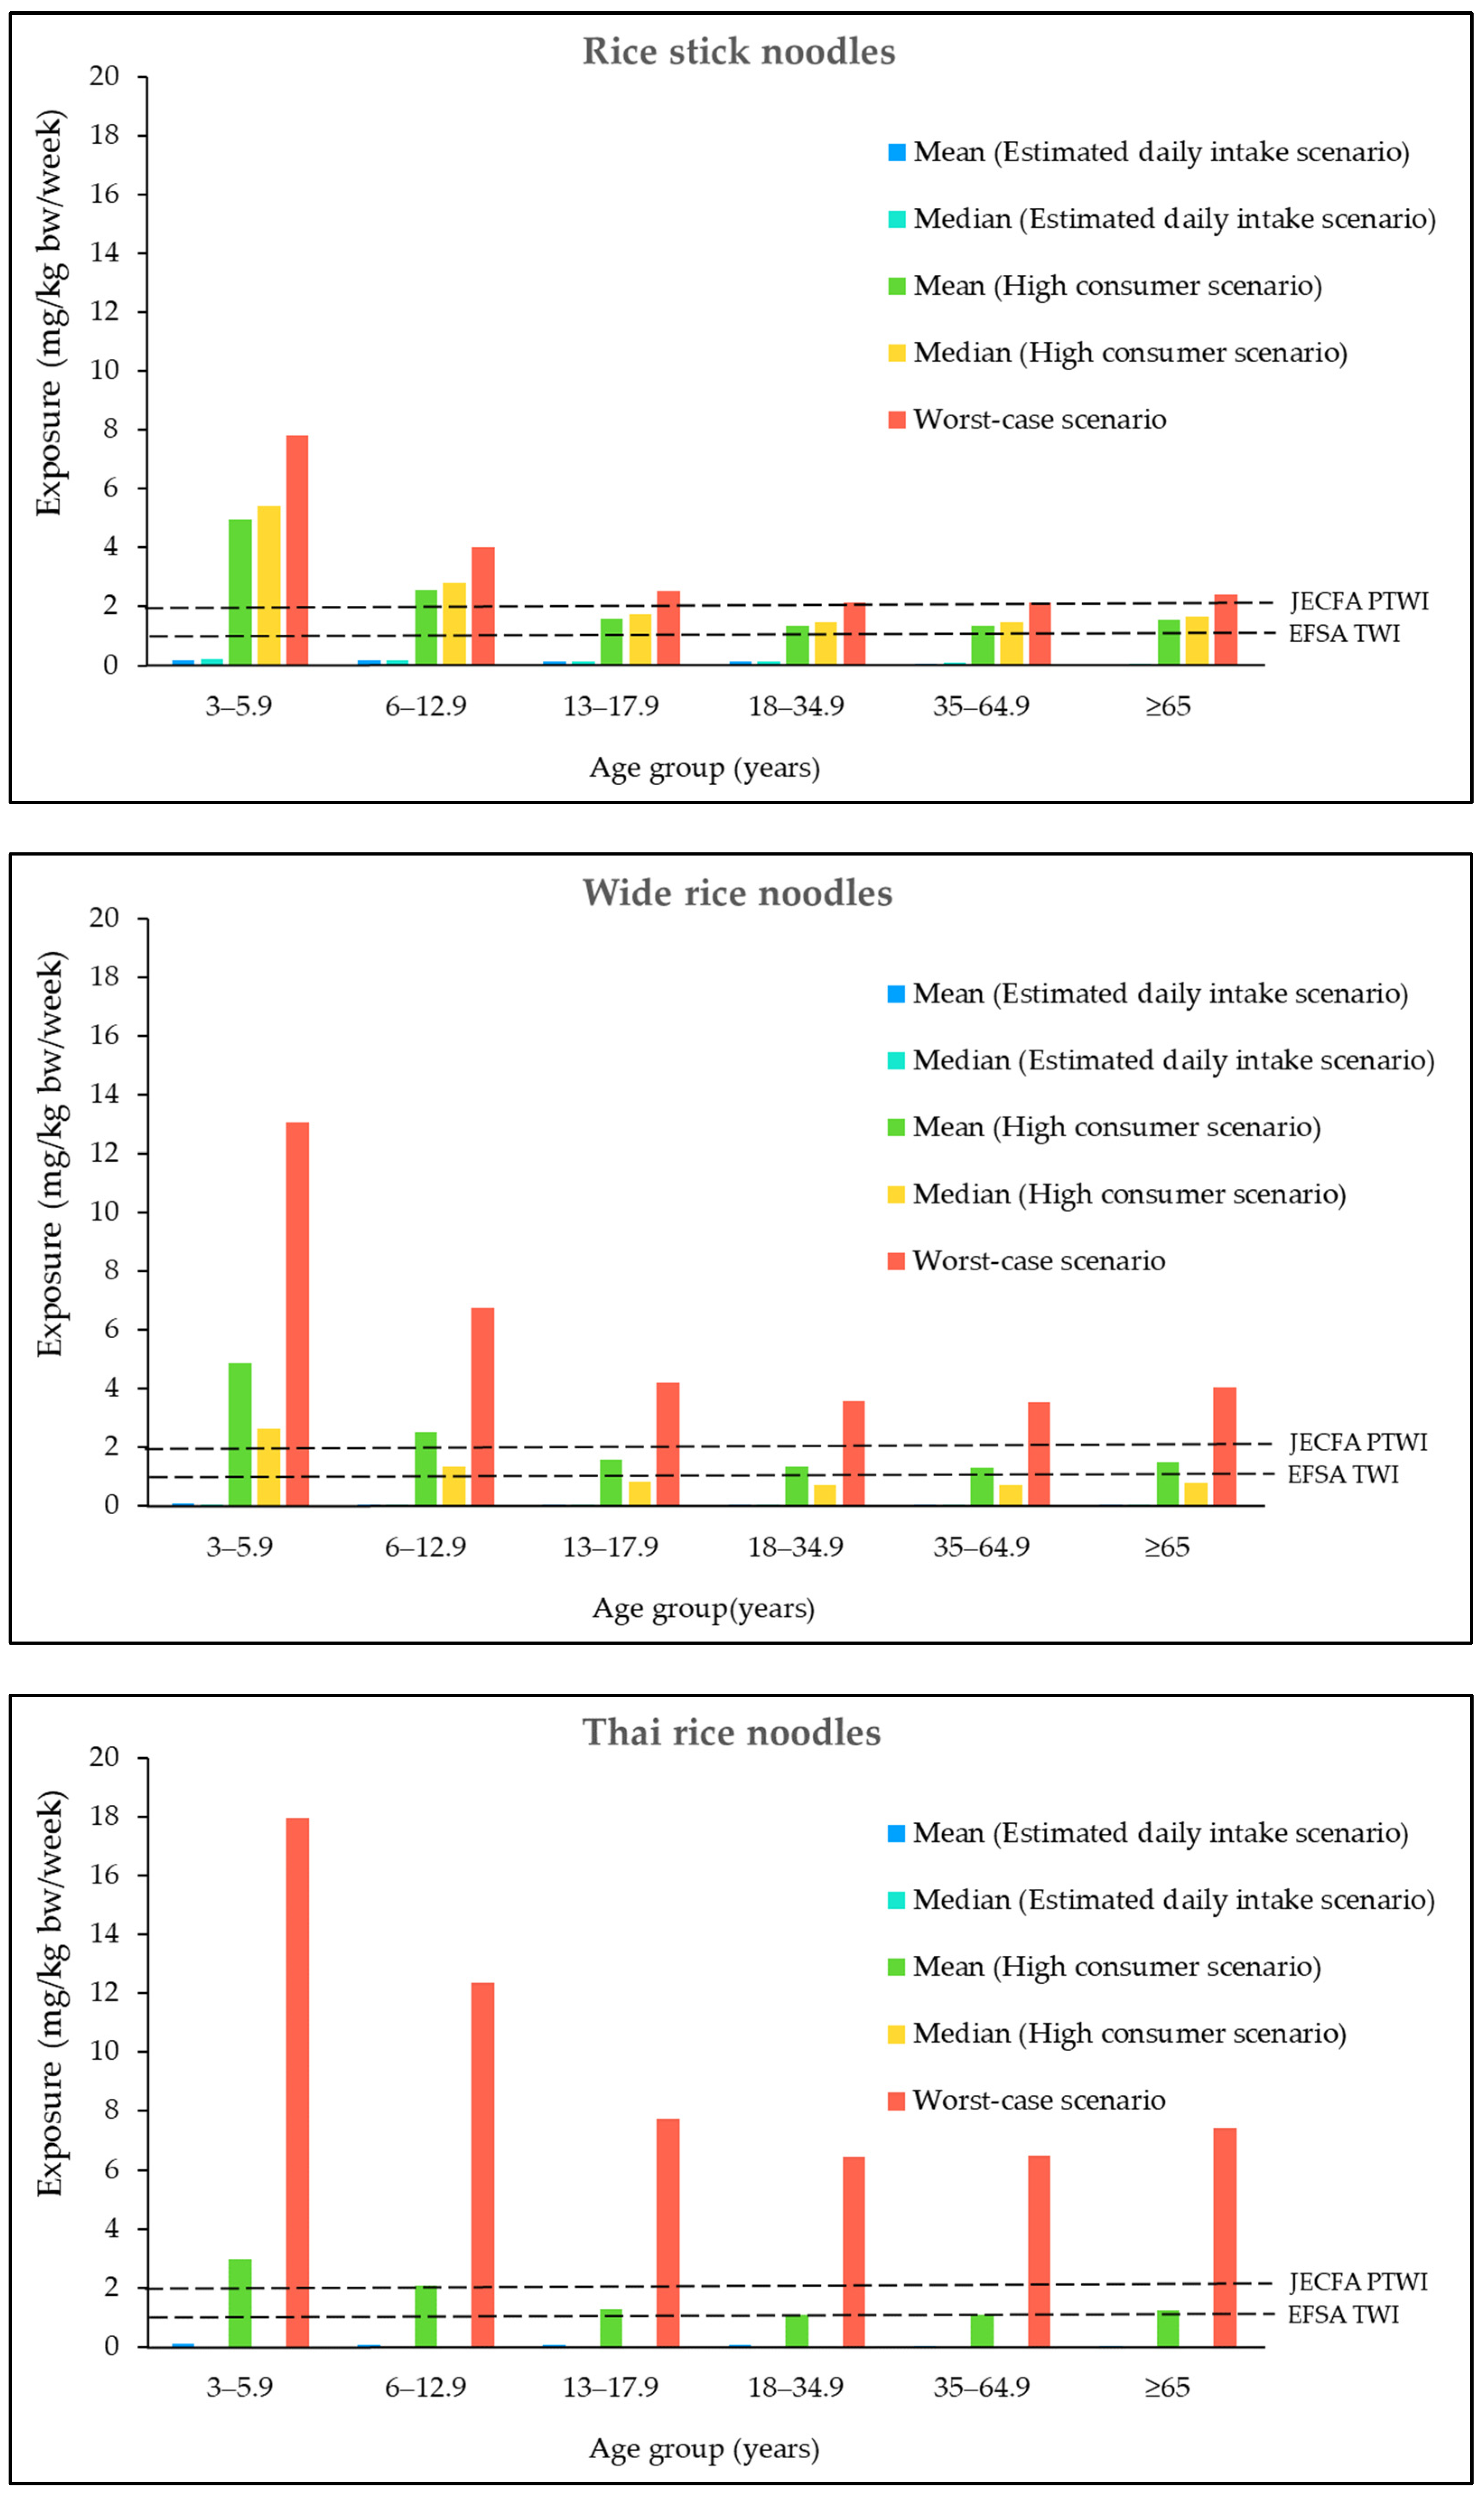
3.5. Dietary Exposure Assessment and Risk Characterization of Al from Consumption of the Noodle Products
4. Conclusions
Author Contributions
Funding
Data Availability Statement
Conflicts of Interest
References
- Zhang, H.; Tang, J.; Huang, L.; Shen, X.; Zhang, R.; Chen, J. Aluminum in food and daily dietary intake assessment from 15 food groups in Zhejiang province, China. Food Addit. Contam. Part B Surveill. 2016, 9, 73–78. [Google Scholar] [CrossRef] [PubMed]
- Crisponi, G.; Fanni, D.; Gerosa, C.; Nemolato, S.; Nurchi, V.M.; Crespo-Alonso, M.; Lachowicz, I.J.; Faa, G. The meaning of aluminum exposure on human health and aluminum-related diseases. Biomol. Concepts 2013, 4, 77–87. [Google Scholar] [CrossRef] [PubMed]
- Riihimäki, V.; Aitio, A. Occupational exposure to aluminum and its biomonitoring in perspective. Crit. Rev. Toxicol. 2012, 42, 827–853. [Google Scholar] [CrossRef] [PubMed]
- FAO/WHO. Evaluation of Certain Food Additives and Contaminants: Sixty-Seventh Report of the Joint FAO/WHO Expert Committee on Food Additives; World Health Organization: Rome, Italy, 2006; Volume 67. [Google Scholar]
- Greger, J.L. Dietary and other sources of aluminum intake. In Ciba Foundation Symposium 169—Aluminium in Biology and Medicine; Chadwick, D.J., Whelan, J., Eds.; John Wiley & Sons Ltd.: West Sussex, UK, 1992; pp. 26–49. ISBN 0-471-93413-5. [Google Scholar]
- International Programme on Chemical Safety (IPCS). Aluminum. Environmental Health Criteria 194; WHO: Geneva, Switzerland, 1997; Available online: https://www.inchem.org/documents/ehc/ehc/ehc194.htm (accessed on 20 April 2022).
- Klotz, K.; Weistenhöfer, W.; Neff, F.; Hartwig, A.; van Thriel, C.; Drexler, H. The health effects of aluminum exposure. Dtsch. Arztebl. Int. 2017, 114, 653–659. [Google Scholar] [CrossRef] [PubMed]
- Colomina, M.T.; Peris-Sampedro, F. Aluminum and Alzheimer’s disease. Adv. Neurobiol. 2017, 18, 183–197. [Google Scholar] [CrossRef] [PubMed]
- World Health Organization; WHO Expert Committee on Food Additives. Evaluation of Certain Food Additives and Contaminants: Seventy-Third Report of the Joint FAO/WHO Expert Committee on Food Additives; World Health Organization: Geneva, Switzerland, 2011. [Google Scholar]
- European Food Safety Authority (EFSA). Safety of aluminium from dietary intake—Scientific Opinion of the Panel on Food Additives, Flavourings, Processing Aids and Food Contact Materials (AFC). EFSA J. 2008, 6, 754. [Google Scholar] [CrossRef]
- Yang, M.; Jiang, L.; Huang, H.; Zeng, S.; Qiu, F.; Yu, M.; Wei, S. Dietary exposure to aluminium and health risk assessment in the residents of Shenzhen, China. PLoS ONE 2014, 9, e89715. [Google Scholar] [CrossRef] [PubMed]
- Guo, J.; Peng, S.; Tian, M.; Wang, L.; Chen, B.; Wu, M.; He, G.S. Dietary exposure to aluminum form wheat flour and puffed products of residents in Shanghai, China. Food. Addit. Contam. A 2015, 32, 2018–2026. [Google Scholar] [CrossRef]
- Başaran, B. Assessment of Aluminum via Baby Foods Consumption in Turkey: Estimated Early-Life Dietary Exposure and Target Hazard Quotient. Biol. Trace Elem. Res. 2022, 200, 3892–3901. [Google Scholar] [CrossRef]
- Tajdar-Oranj, B.; Shariatifar, N.; Alimohammadi, M.; Peivasteh-Roudsari, L.; Khaniki, G.J.; Fakhri, Y.; Khaneghah, A.M. The concentration of heavy metals in noodle samples from Iran’s market: Probabilistic health risk assessment. Environ. Sci. Pollut. Res. 2018, 25, 30928–30937. [Google Scholar] [CrossRef]
- Ma, N.; Liu, Z.P.; Yang, D.J.; Liang, J.; Zhu, J.H.; Xu, H.B.; Li, F.Q.; Li, N. Risk assessment of dietary exposure to aluminum in the Chinese population. Food Addit. Contam. Part A 2016, 33, 1557–1562. [Google Scholar] [CrossRef] [PubMed]
- Li, G.; Wu, S.; Zeng, J.; Wang, L.; Yu, W. Effect of frying and aluminum on the levels and migration of parent and oxygenate PAHs in a popular Chinese fried bread youtiao. Food Chem. 2016, 209, 123–130. [Google Scholar] [CrossRef] [PubMed]
- Ministry of Public Health. Notification of the Ministry of Public Health (no. 418) B.E. 2563 (2020). In Virtue of the Food Act B.E. 2522, Thailand. Available online: https://www.ratchakitcha.soc.go.th/DATA/PDF/2563/E/237_2/18.PDF (accessed on 5 May 2022).
- Tippairote, T.; Temviriyanukul, P.; Benjapong, W.; Trachootham, D. Prevalence and Factors Associated with High Levels of Aluminum, Arsenic, Cadmium, Lead, and Mercury in Hair Samples of Well-Nourished Thai Children in Bangkok and Perimeters. Biol. Trace Elem. Res. 2019, 188, 334–343. [Google Scholar] [CrossRef] [PubMed]
- Magnusson, B.; Ornemark, U. (Eds.) Eurachem Guide: The Fitness for Purpose of Analytical Methods—A Laboratory Guide to Method Validation and Related Topics, 2nd ed.; LGC: Teddington, UK, 2014; ISBN 978-91-87461-59-0. [Google Scholar]
- Latimer, G. (Ed.) Official Methods of Analyses of AOAC International, 21st ed.; AOAC International: Rockville, MD, USA, 2019; ISBN 0-935584-89-7. [Google Scholar]
- ISO. ISO/IEC 17025—Testing and Calibration Laboratories. Available online: https://www.iso.org/ISO-IEC-17025-testing-and-calibration-laboratories.html (accessed on 6 November 2022).
- Saiyed, S.M.; Yokel, R.A. Aluminum content of some foods and food products in the USA, with aluminum food additives. Food Addit Contam. 2005, 22, 234–244. [Google Scholar] [CrossRef]
- Surojanametakul, V.; Tungtakul, P.; Varanyanond, W.; Supasri, R. Effects of partial replacement of rice flour with various starches on the physicochemical and sensory properties of “sen lek” noodle. Agric. Nat. Resour. 2002, 36, 55–62. Available online: https://li01.tci-thaijo.org/index.php/anres/article/view/242687 (accessed on 3 April 2022).
- The National Bureau of Agricultural Commodity and Food Standards (ACFS). Food Consumption Data of Thailand. Available online: http://www.thaincd.com/document/file/info/non-communicable-disease/Thai_Food_Consumption_Data_2016.pdf (accessed on 10 September 2022). (In Thai)
- WHO. Principles and Methods for the Risk Assessment of Chemicals in Food; WHO: Geneva, Switzerland, 2009. [Google Scholar]
- Welna, M.; Szymczycha-Madeja, A.; Pohl, P. Quality of the Trace Element Analysis: Sample Preparation Steps. In Wide Spectra of Quality Control; IntechOpen: Rijeka, Croatia, 2011. [Google Scholar]
- FAO/WHO. Codex Alimentarius Commission–Procedural Manual Twenty, Seventh ed. 2019. Available online: https://www.fao.org/3/ca2329en/CA2329EN.pdf (accessed on 4 November 2022).
- FAO/WHO Food Standards. Codex Alimentarius. GSFA Online. Available online: https://www.fao.org/fao-who-codexalimentarius/codex-texts/dbs/gsfa/en/ (accessed on 20 October 2022).
- Han, S.H.; Kim, J.M.; Baek, S.H. Aluminum contents in wheat flour foods. Korean J. Food Sci. Technol. 1995, 27, 303–305. [Google Scholar]
- Ma, J.; Jiang, G.; Zheng, W.; Zhang, M. A longitudinal assessment of aluminum contents in foodstuffs and aluminum intake of residents in Tianjin metropolis. Food Sci. Nutr. 2019, 7, 997–1003. [Google Scholar] [CrossRef] [PubMed]
- Jiang, Q.; Wang, J.; Li, M.; Liang, X.; Dai, G.; Hu, Z.; Wen, J.; Huang, Q.; Zhang, Y. Dietary exposure to aluminum of urban residents from cities in South China. Food Addit. Contam. Part A 2013, 30, 698–704. [Google Scholar] [CrossRef]
- Stahl, T.; Taschan, H.; Brunn, H. Aluminum content of selected foods and food products. Environ. Sci. Eur. 2011, 23, 37. [Google Scholar] [CrossRef]
- Li, Z.; Zhang, Y.; Ai, Z.; Fan, H.; Wang, N.; Suo, B. Effect of potassium alum addition on the quality of potato starch noodles. J. Food Sci. Technol. 2019, 56, 2932–2939. [Google Scholar] [CrossRef]
- Zhang, H.Y.; Sun, H.N.; Ma, M.M.; Mu, T.H. Dough rheological properties, texture, and structure of high-moisture starch hydrogels with different potassium-, and calcium-based compounds. Food Hydrocoll. 2023, 137, 108337. [Google Scholar] [CrossRef]
- Lee, J.G.; Hwang, J.Y.; Lee, H.E.; Kim, T.H.; Choi, J.D.; Gang, G.J. Effects of food processing methods on migration of heavy metals to food. Appl. Biol. Chem. 2019, 62, 64. [Google Scholar] [CrossRef]
- Zhang, H.; Zhang, J.Y.; Wang, H.L.; Luo, P.J.; Zhang, J.B. The revision of aluminum-containing food additive provisions in China. Biomed. Environ. Sci. 2016, 29, 461–466. [Google Scholar] [CrossRef]
- El Daouk, S.; Pineau, A.; Taha, M.; Ezzeddine, R.; Hijazi, A.; Al Iskandarani, M. Aluminum exposure from food in the population of Lebanon. Toxicol. Rep. 2020, 7, 1025–1031. [Google Scholar] [CrossRef] [PubMed]
- You, S.H.; Chen, S.C.; Lin, C.H.; Chen, Y.C. Probabilistic risk analysis to assess dietary exposure to aluminum in the Taiwanese population. Int. J. Environ. Res. Public Health 2021, 18, 1099. [Google Scholar] [CrossRef] [PubMed]
- Keavency, K.; Murphy, A.; Jaiswal, A.K.; Jaiswal, S. Aluminum content of selected foods and beverages available in Irish market. JFCN 2020, 6, 150–158. [Google Scholar] [CrossRef]
- Ogimoto, M.; Suzuki, K.; Haneishi, N.; Kikuchi, Y.; Takanashi, M.; Tomioka, N.; Uematsu, Y.; Monma, K. Aluminium content of foods originating from aluminium-containing food additives. Food Addit. Contam. Part B 2016, 9, 185–190. [Google Scholar] [CrossRef] [PubMed]
- Alasfar, R.H.; Isaifan, R.J. Aluminum environmental pollution: The silent killer. Environ. Sci. Pollut. Res. 2021, 28, 44587–44597. [Google Scholar] [CrossRef] [PubMed]
- Hardisson, A.; Revert, C.; Gonzales-Weler, D.; Rubio, C. Aluminum exposure through the diet. Food Sci. Nutr. 2017, 3, 19. [Google Scholar] [CrossRef]
- Mohammadpour, A.; Hosseini, M.R.; Dehbandi, R.; Khodadadi, N.; Keshtkar, M.; Shahsavani, E.; Elshall, A.S.; Azhdarpoor, A. Probabilistic human health risk assessment and Sobol sensitivity reveal the major health risk parameters of aluminum in drinking water in Shiraz, Iran. Environ. Geochem. Health 2023, 1, 1–13. [Google Scholar] [CrossRef]
- Razak, N.H.A.; Praveena, S.M.; Aris, A.Z.; Hashim, Z. Drinking water studies: A review on heavy metal, application of biomarker and health risk assessment (a special focus in Malaysia). J. Epidemiol. Glob. Health 2015, 5, 297–310. [Google Scholar] [CrossRef]
- Bryliński, Ł.; Kostelecka, K.; Woliński, F.; Duda, P.; Góra, J.; Granat, M.; Flieger, J.; Teresiński, G.; Buszewicz, G.; Sitarz, R.; et al. Aluminium in the Human Brain: Routes of Penetration, Toxicity, and Resulting Complications. Int. J. Mol. Sci. 2023, 24, 7228. [Google Scholar] [CrossRef]
- Moussaron, A.; Alexandre, J.; Chenard, M.-P.; Mathelin, C.; Reix, N. Correlation between daily life aluminium exposure and breast cancer risk: A systematic review. J. Trace Elem. Med. Biol. 2023, 79, 127247. [Google Scholar] [CrossRef]
- Niu, Q. Overview of the Relationship between Aluminum Exposure and Health of Human Being. Adv. Exp. Med. Biol. 2018, 1091, 1–31. [Google Scholar] [CrossRef] [PubMed]

| Parameter | Setting |
|---|---|
| Lamp | Al Hollow cathode lamp |
| Lamp current (mA) | 25 |
| Wavelength (nm) | 309.27 |
| Slit width (nm) | 0.7 |
| Temperature (°C) | Pyrolysis 1200 Atomization 2300 |
| Atomization site | Pyro/Platform |
| Sample volume (μL) | 20 |
| Calibration standards (µg/L) | 10, 20, 30, 40, 60, 80, 100 |
| Step No. | Temperature (°C) | Ramp Time (s) | Hold Time (s) | Internal Flow | Gas Type |
|---|---|---|---|---|---|
| 1 | 110 | 1 | 30 | 250 | Normal |
| 2 | 130 | 15 | 30 | 250 | Normal |
| 3 | 1200 | 10 | 20 | 250 | Normal |
| 4 | 2300 | 0 | 5 | 0 | Normal |
| 5 | 2450 | 1 | 3 | 250 | Normal |
| Noodle Product | Form | Concentration (mg/kg ww) | Concentration (mg/kg dw) | ||||
|---|---|---|---|---|---|---|---|
| Mean ± SD | Median | 97.5th PCTL | Mean ± SD | Median | 97.5th PCTL | ||
| Rice stick noodles | Raw | 417.96 ± 160.56 | 455.68 a | 620.68 | 654.70 ± 251.51 | 713.78 a | 972.24 |
| Egg noodles | Raw | ND | ND c | ND | ND | ND c | ND |
| Wide rice noodles | Fresh | 89.99 ± 98.21 | 48.72 b | 240.29 | 239.14 ± 261.00 | 129.47 b | 638.56 |
| Thai rice noodles | Fresh | 19.04 ± 39.02 | ND c | 115.34 | 66.69 ± 136.66 | ND c | 403.99 |
| Noodle Product Samples | Concentration of Al (mg/kg) | Reference |
|---|---|---|
| Noodles | 297–767 | Han et al., 1995 [29] |
| Remen | 63–80 | Han et al., 1995 [29] |
| Vermicelli | 33–46 | Han et al., 1995 [29] |
| Noodles | 10–344 | Ma et al., 2016 [15] |
| Noodles | 1–531 | Ma et al., 2019 [30] |
| Vermicelli | 1–365 | Ma et al., 2019 [30] |
| Steamed cold noodles | 5–1127 | Ma et al., 2019 [30] |
| Flour and noodles | 3–44 | Jiang et al., 2013 [31] |
| Vermicelli | 5–395 | Jiang et al., 2013 [31] |
| Pasta | 1–76 | Stahl et al., 2011 [32] |
| Instant noodles | 7–16 | Tajdar-Oranj et al., 2018 [14] |
| Rice stick noodles | ND–623 | This study |
| Wide rice noodles | ND–244 | This study |
| Thai rice noodles | ND–117 | This study |
| Egg noodles | ND | This study |
| Noodle Sample | Age (Year) | Per Capita (g/Person/Day) | Eater Only (g/Person/Day) | ||
|---|---|---|---|---|---|
| Mean | 97.5th PCTL | Mean | 97.5th PCTL | ||
| Rice stick noodles | 3–5.9 | 3.98 | 23.14 | 44.66 | 108.00 |
| 6–12.9 | 6.99 | 46.28 | 59.73 | 108.00 | |
| 13–17.9 | 9.52 | 54.00 | 64.13 | 108.00 | |
| 18–34.9 | 11.33 | 61.71 | 69.66 | 108.00 | |
| 35–64.9 | 6.19 | 46.29 | 62.53 | 108.00 | |
| ≥65 | 2.67 | 23.14 | 53.88 | 108.00 | |
| Wide rice noodles | 3–5.9 | 2.66 | 19.14 | 54.22 | 134.00 |
| 6–12.9 | 2.32 | 19.15 | 69.69 | 134.00 | |
| 13–17.9 | 3.05 | 38.28 | 81.56 | 134.00 | |
| 18–34.9 | 2.87 | 38.28 | 82.17 | 134.00 | |
| 35–64.9 | 2.16 | 19.15 | 80.25 | 134.00 | |
| ≥65 | 1.83 | 19.15 | 67.88 | 134.00 | |
| Thai rice noodles | 3–5.9 | 13.49 | 73.16 | 147.03 | 384.00 |
| 6–12.9 | 17.85 | 109.72 | 192.40 | 512.00 | |
| 13–17.9 | 20.91 | 109.72 | 226.57 | 512.00 | |
| 18–34.9 | 23.66 | 146.28 | 230.91 | 512.00 | |
| 35–64.9 | 20.42 | 128.00 | 248.92 | 512.00 | |
| ≥65 | 11.18 | 73.14 | 209.25 | 512.00 | |
| Noodle Product | Age | HQ Calculated from JECFA PTWI | HQ Calculated from EFSA TWI | ||||||||
|---|---|---|---|---|---|---|---|---|---|---|---|
| Estimated Daily Intake Scenario | High Consumer Scenario | Worst-Case Scenario | Estimated Daily Intake Scenario | High Consumer Scenario | Worst-Case Scenario | ||||||
| Mean | Median | Mean | Median | 97.5th PCTL | Mean | Median | Mean | Median | 97.5th PCTL | ||
| Rice stick noodles | 3–5.9 | 0.091 | 0.099 | 2.480 | 2.710 | 3.900 | 0.182 | 0.200 | 4.950 | 5.420 | 7.800 |
| 6–12.9 | 0.083 | 0.091 | 1.280 | 1.400 | 2.020 | 0.166 | 0.181 | 2.560 | 2.800 | 4.030 | |
| 13–17.9 | 0.070 | 0.077 | 0.800 | 0.880 | 1.260 | 0.141 | 0.154 | 1.600 | 1.750 | 2.520 | |
| 18–34.9 | 0.071 | 0.078 | 0.680 | 0.740 | 1.070 | 0.142 | 0.155 | 1.350 | 1.480 | 2.130 | |
| 35–64.9 | 0.038 | 0.042 | 0.670 | 0.740 | 1.060 | 0.077 | 0.084 | 1.340 | 1.470 | 2.120 | |
| ≥65 | 0.019 | 0.021 | 0.770 | 0.840 | 1.210 | 0.038 | 0.041 | 1.530 | 1.680 | 2.410 | |
| Wide rice noodles | 3–5.9 | 0.048 | 0.026 | 2.450 | 1.330 | 6.530 | 0.097 | 0.053 | 4.890 | 2.650 | 13.070 |
| 6–12.9 | 0.022 | 0.012 | 1.260 | 0.680 | 3.380 | 0.044 | 0.024 | 2.530 | 1.370 | 6.750 | |
| 13–17.9 | 0.018 | 0.010 | 0.790 | 0.430 | 2.110 | 0.036 | 0.019 | 1.580 | 0.860 | 4.220 | |
| 18–34.9 | 0.014 | 0.008 | 0.670 | 0.360 | 1.790 | 0.029 | 0.015 | 1.340 | 0.720 | 3.570 | |
| 35–64.9 | 0.011 | 0.006 | 0.660 | 0.360 | 1.770 | 0.021 | 0.012 | 1.330 | 0.720 | 3.550 | |
| ≥65 | 0.010 | 0.006 | 0.760 | 0.410 | 2.020 | 0.021 | 0.011 | 1.510 | 0.820 | 4.040 | |
| Thai rice noodles | 3–5.9 | 0.052 | ND | 1.480 | ND | 8.990 | 0.104 | ND | 2.970 | ND | 17.970 |
| 6–12.9 | 0.036 | ND | 1.020 | ND | 6.190 | 0.071 | ND | 2.040 | ND | 12.380 | |
| 13–17.9 | 0.026 | ND | 0.640 | ND | 3.870 | 0.052 | ND | 1.280 | ND | 7.740 | |
| 18–34.9 | 0.025 | ND | 0.540 | ND | 3.270 | 0.050 | ND | 1.080 | ND | 6.550 | |
| 35–64.9 | 0.021 | ND | 0.540 | ND | 3.250 | 0.043 | ND | 1.070 | ND | 6.510 | |
| ≥65 | 0.013 | ND | 0.610 | ND | 3.710 | 0.027 | ND | 1.220 | ND | 7.410 | |
Disclaimer/Publisher’s Note: The statements, opinions and data contained in all publications are solely those of the individual author(s) and contributor(s) and not of MDPI and/or the editor(s). MDPI and/or the editor(s) disclaim responsibility for any injury to people or property resulting from any ideas, methods, instructions or products referred to in the content. |
© 2023 by the authors. Licensee MDPI, Basel, Switzerland. This article is an open access article distributed under the terms and conditions of the Creative Commons Attribution (CC BY) license (https://creativecommons.org/licenses/by/4.0/).
Share and Cite
Kongta, N.; Judprasong, K.; Chunhabundit, R.; Sirivarasai, J.; Karnpanit, W. Assessment of Exposure to Aluminum through Consumption of Noodle Products. Foods 2023, 12, 3960. https://doi.org/10.3390/foods12213960
Kongta N, Judprasong K, Chunhabundit R, Sirivarasai J, Karnpanit W. Assessment of Exposure to Aluminum through Consumption of Noodle Products. Foods. 2023; 12(21):3960. https://doi.org/10.3390/foods12213960
Chicago/Turabian StyleKongta, Nalinrat, Kunchit Judprasong, Rodjana Chunhabundit, Jintana Sirivarasai, and Weeraya Karnpanit. 2023. "Assessment of Exposure to Aluminum through Consumption of Noodle Products" Foods 12, no. 21: 3960. https://doi.org/10.3390/foods12213960
APA StyleKongta, N., Judprasong, K., Chunhabundit, R., Sirivarasai, J., & Karnpanit, W. (2023). Assessment of Exposure to Aluminum through Consumption of Noodle Products. Foods, 12(21), 3960. https://doi.org/10.3390/foods12213960