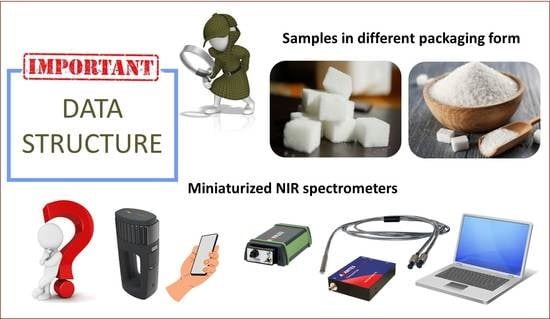
On the Importance of Investigating Data Structure in Miniaturized NIR Spectroscopy Measurements of Food: The Case Study of Sugar
Abstract
1. Introduction
2. Materials and Methods
2.1. Samples and Spectrometers
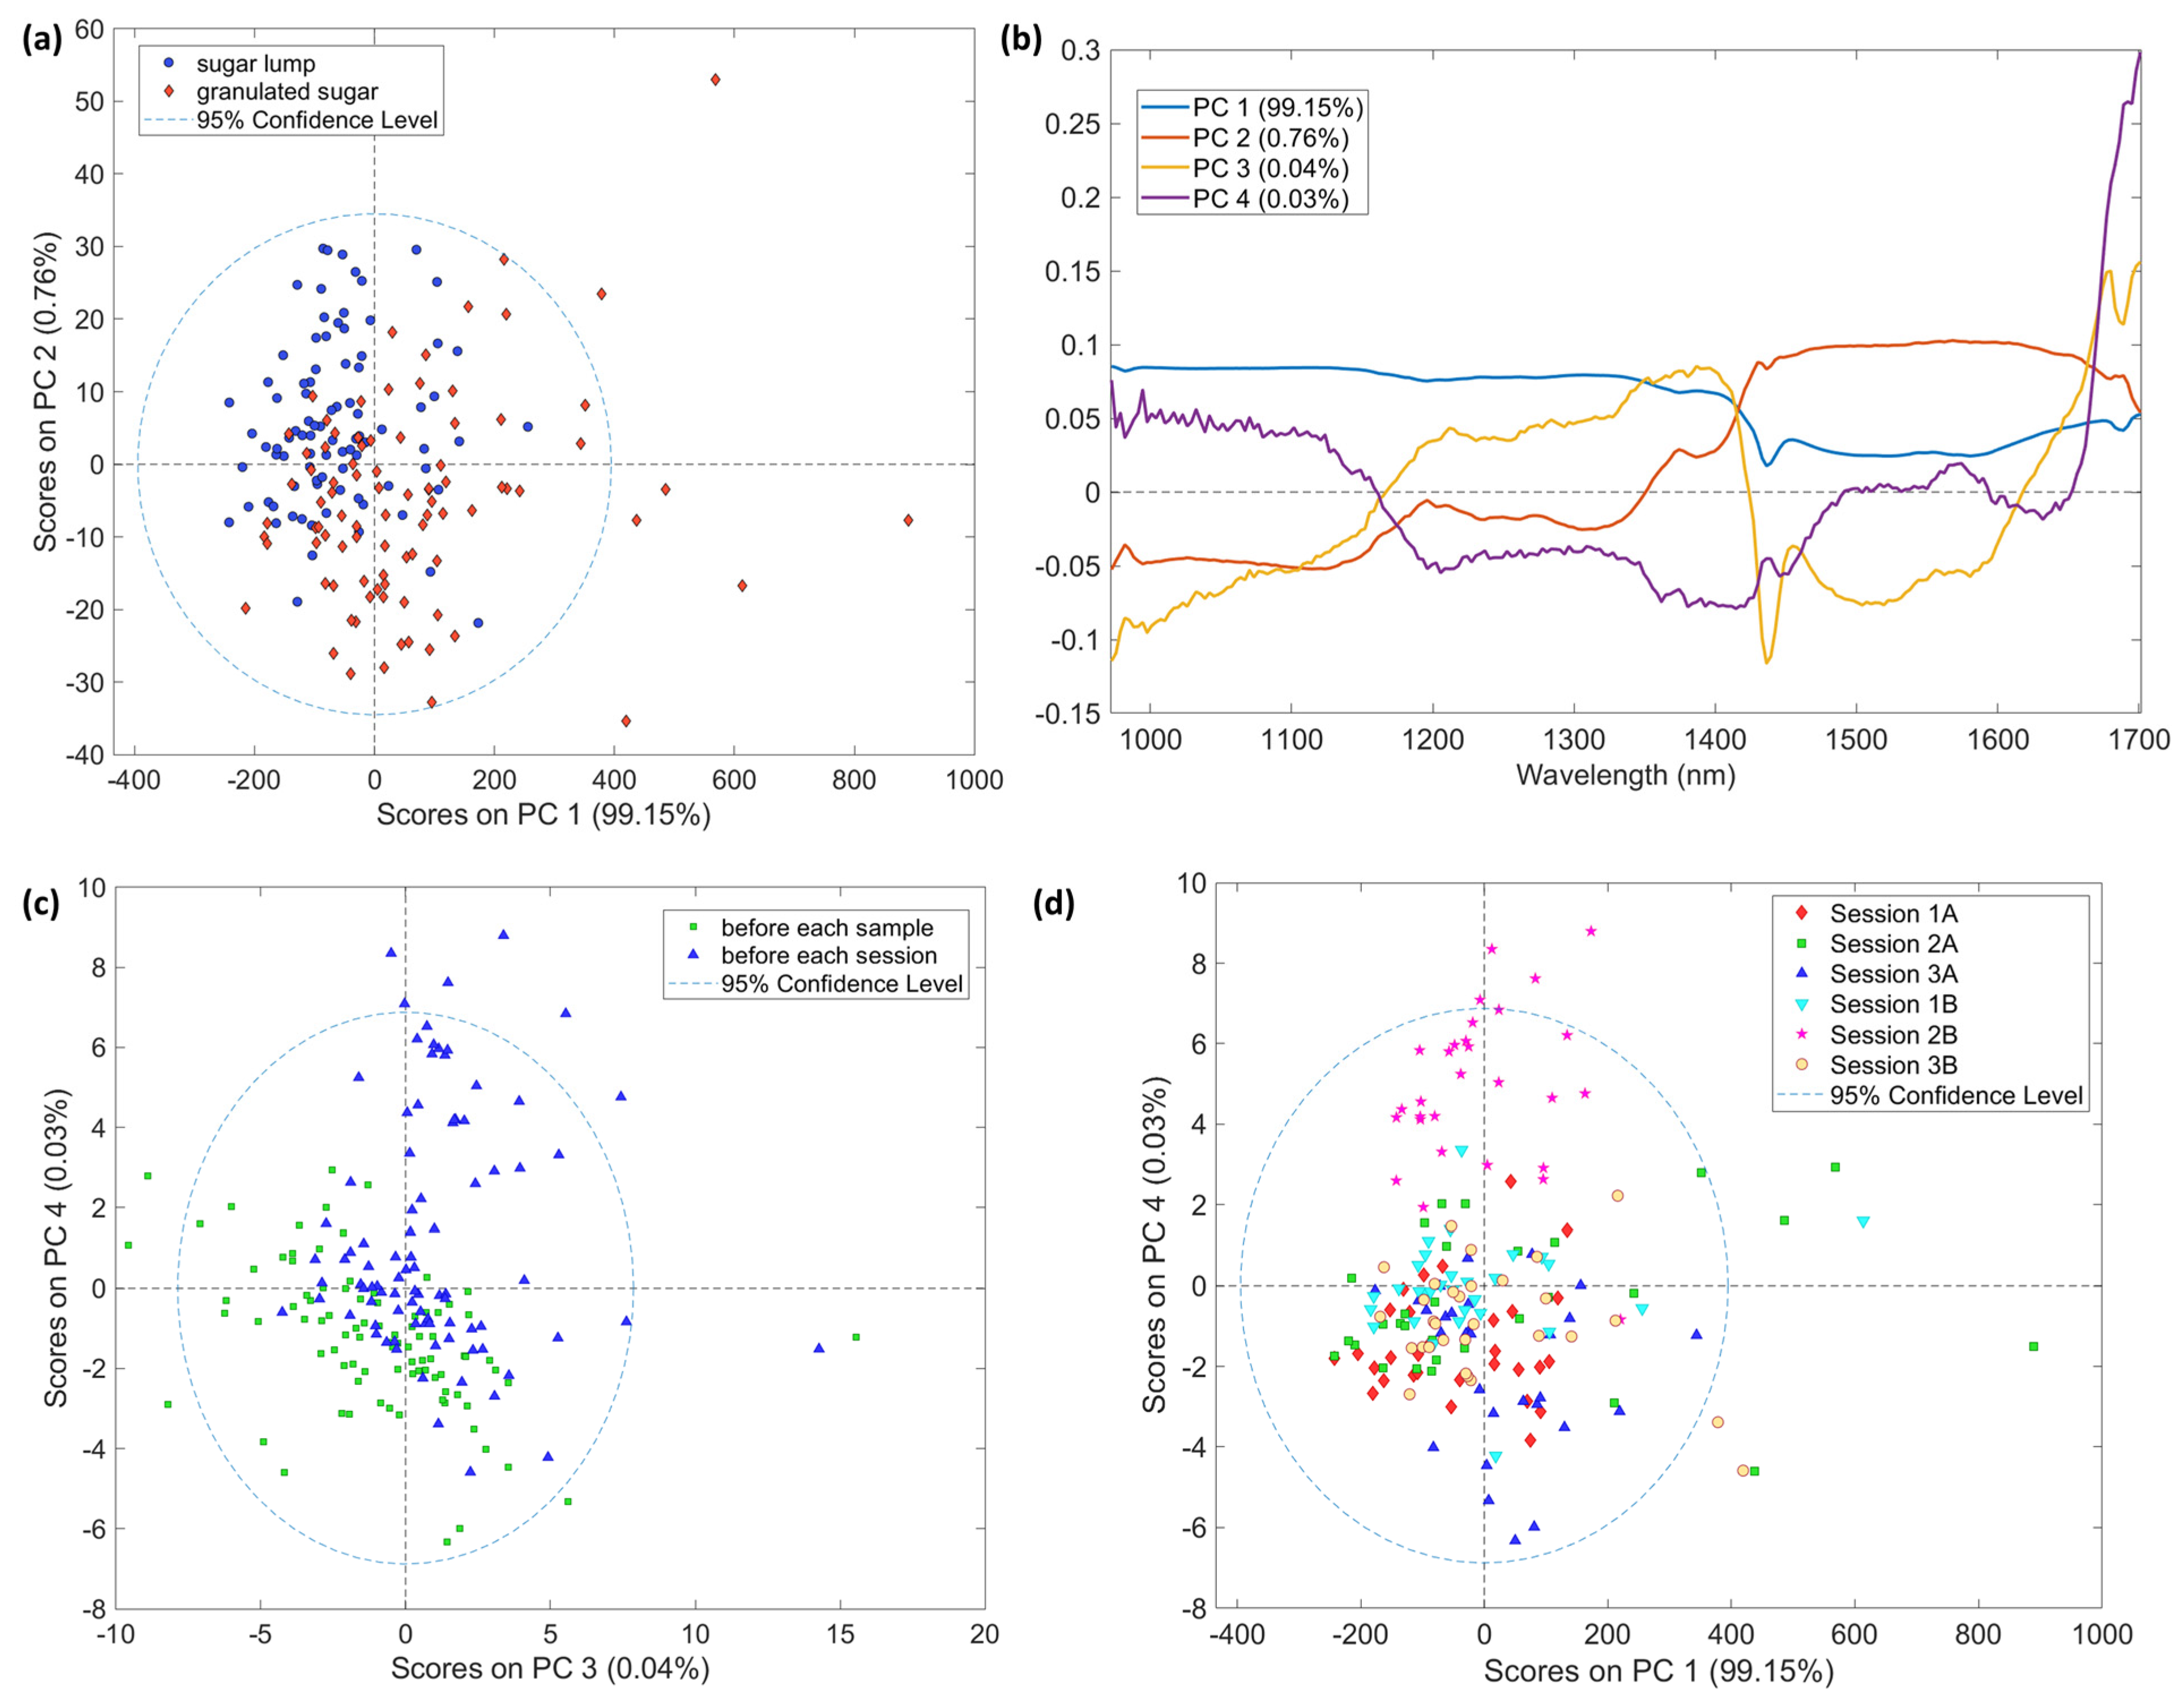
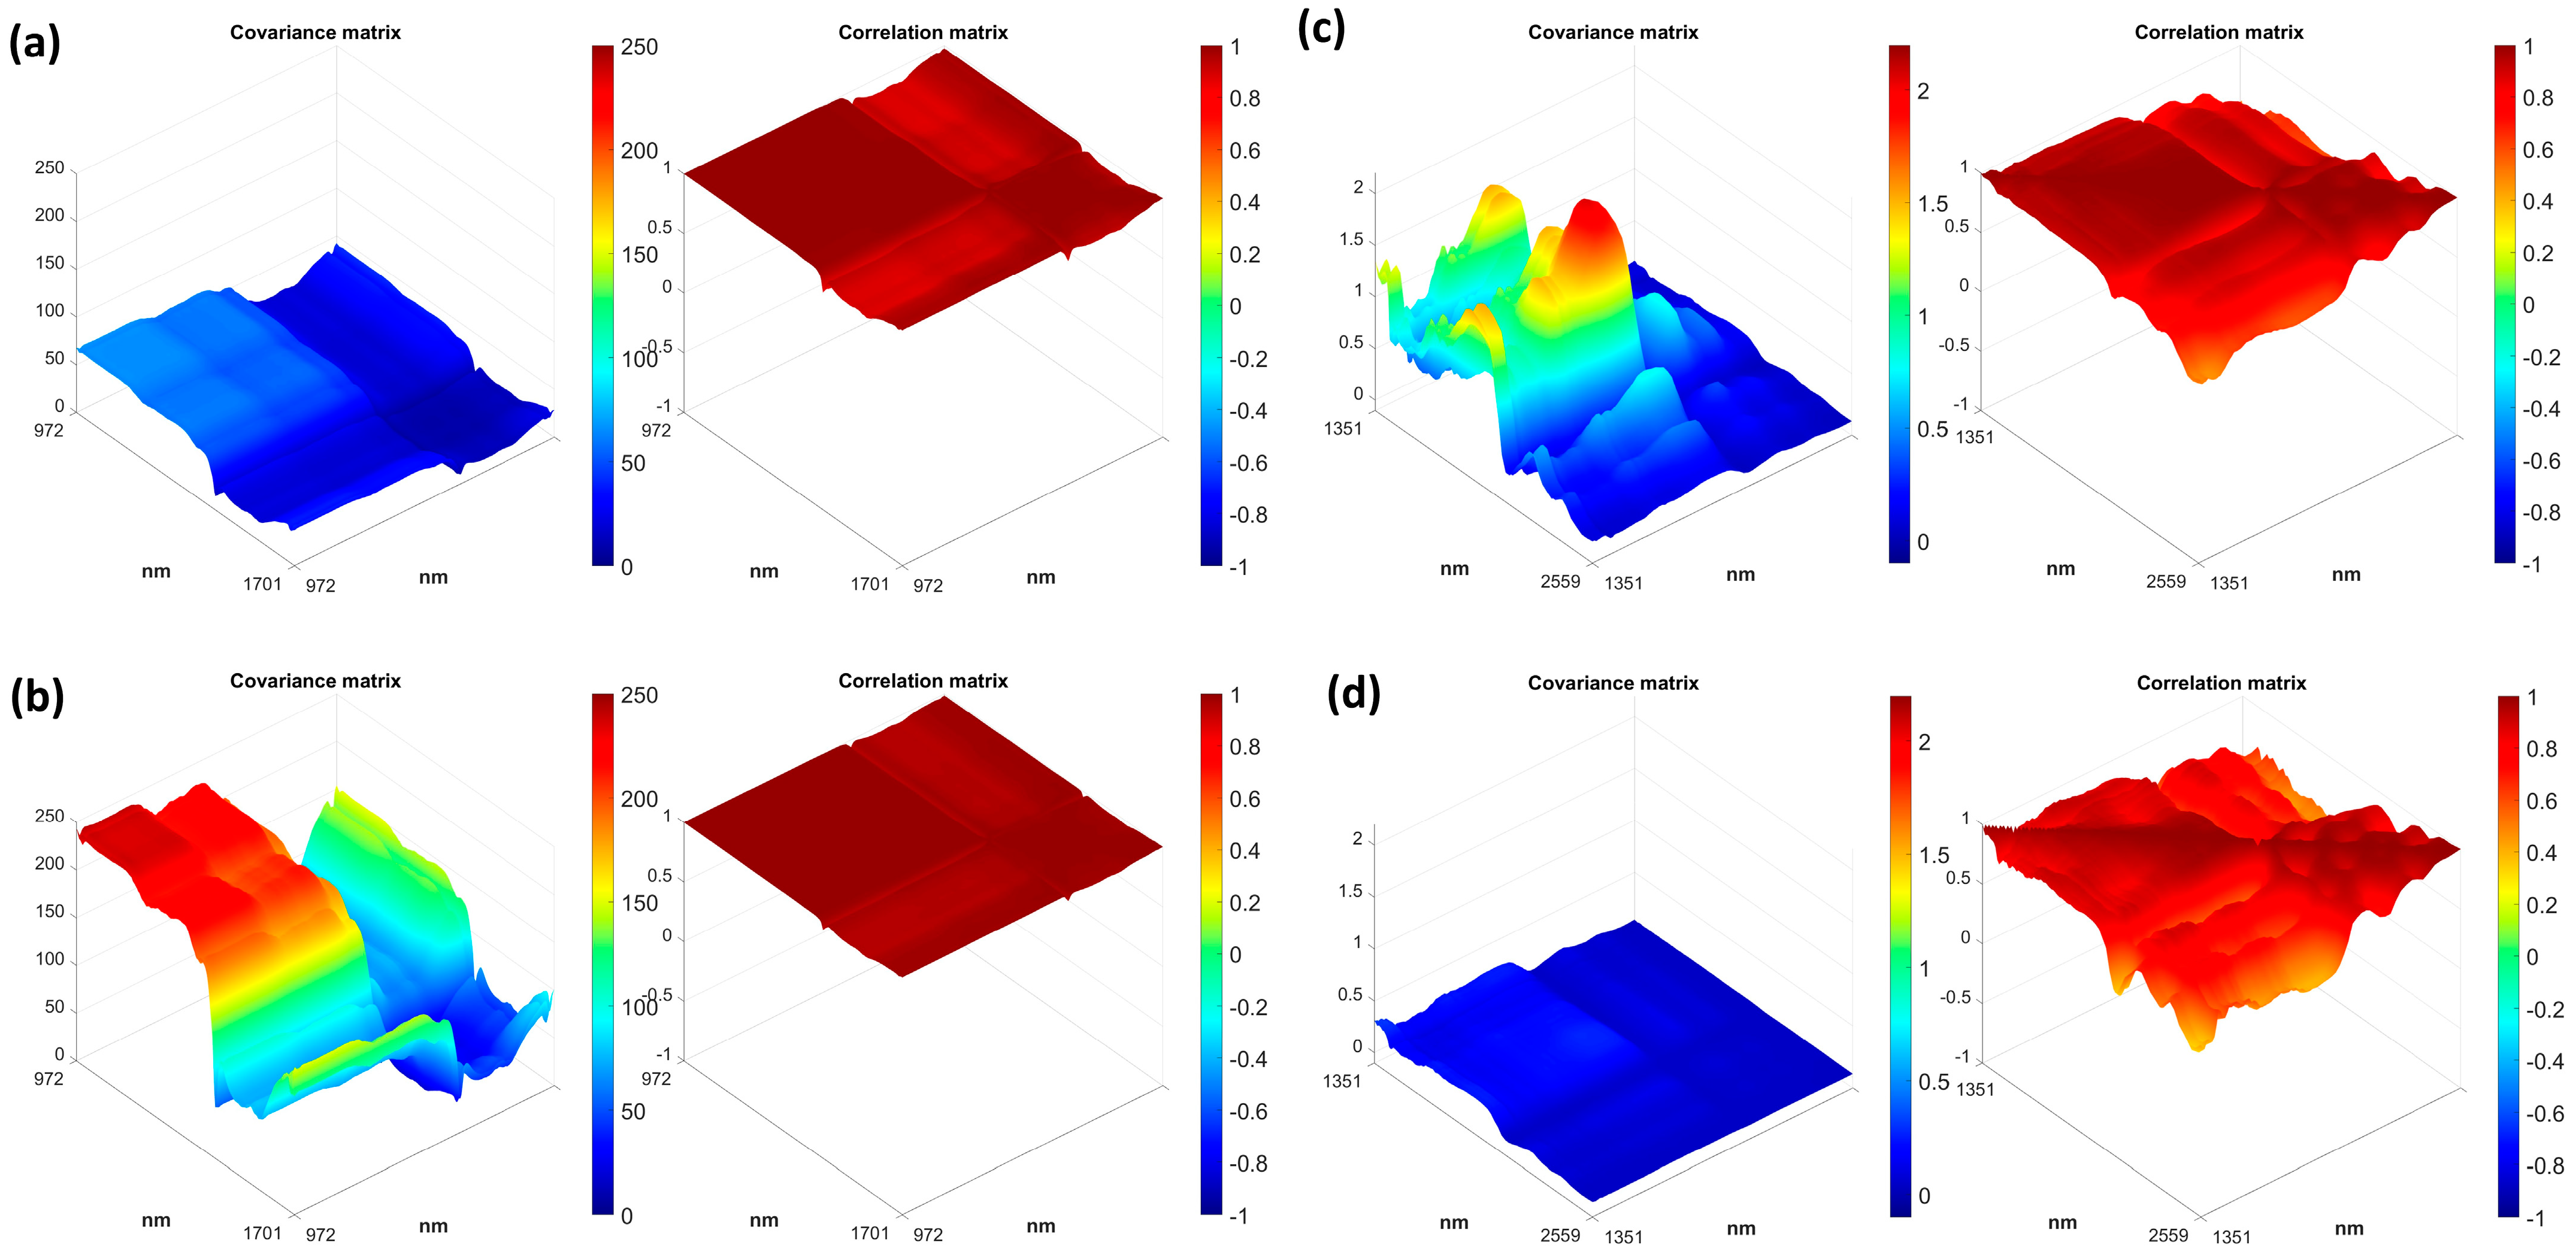
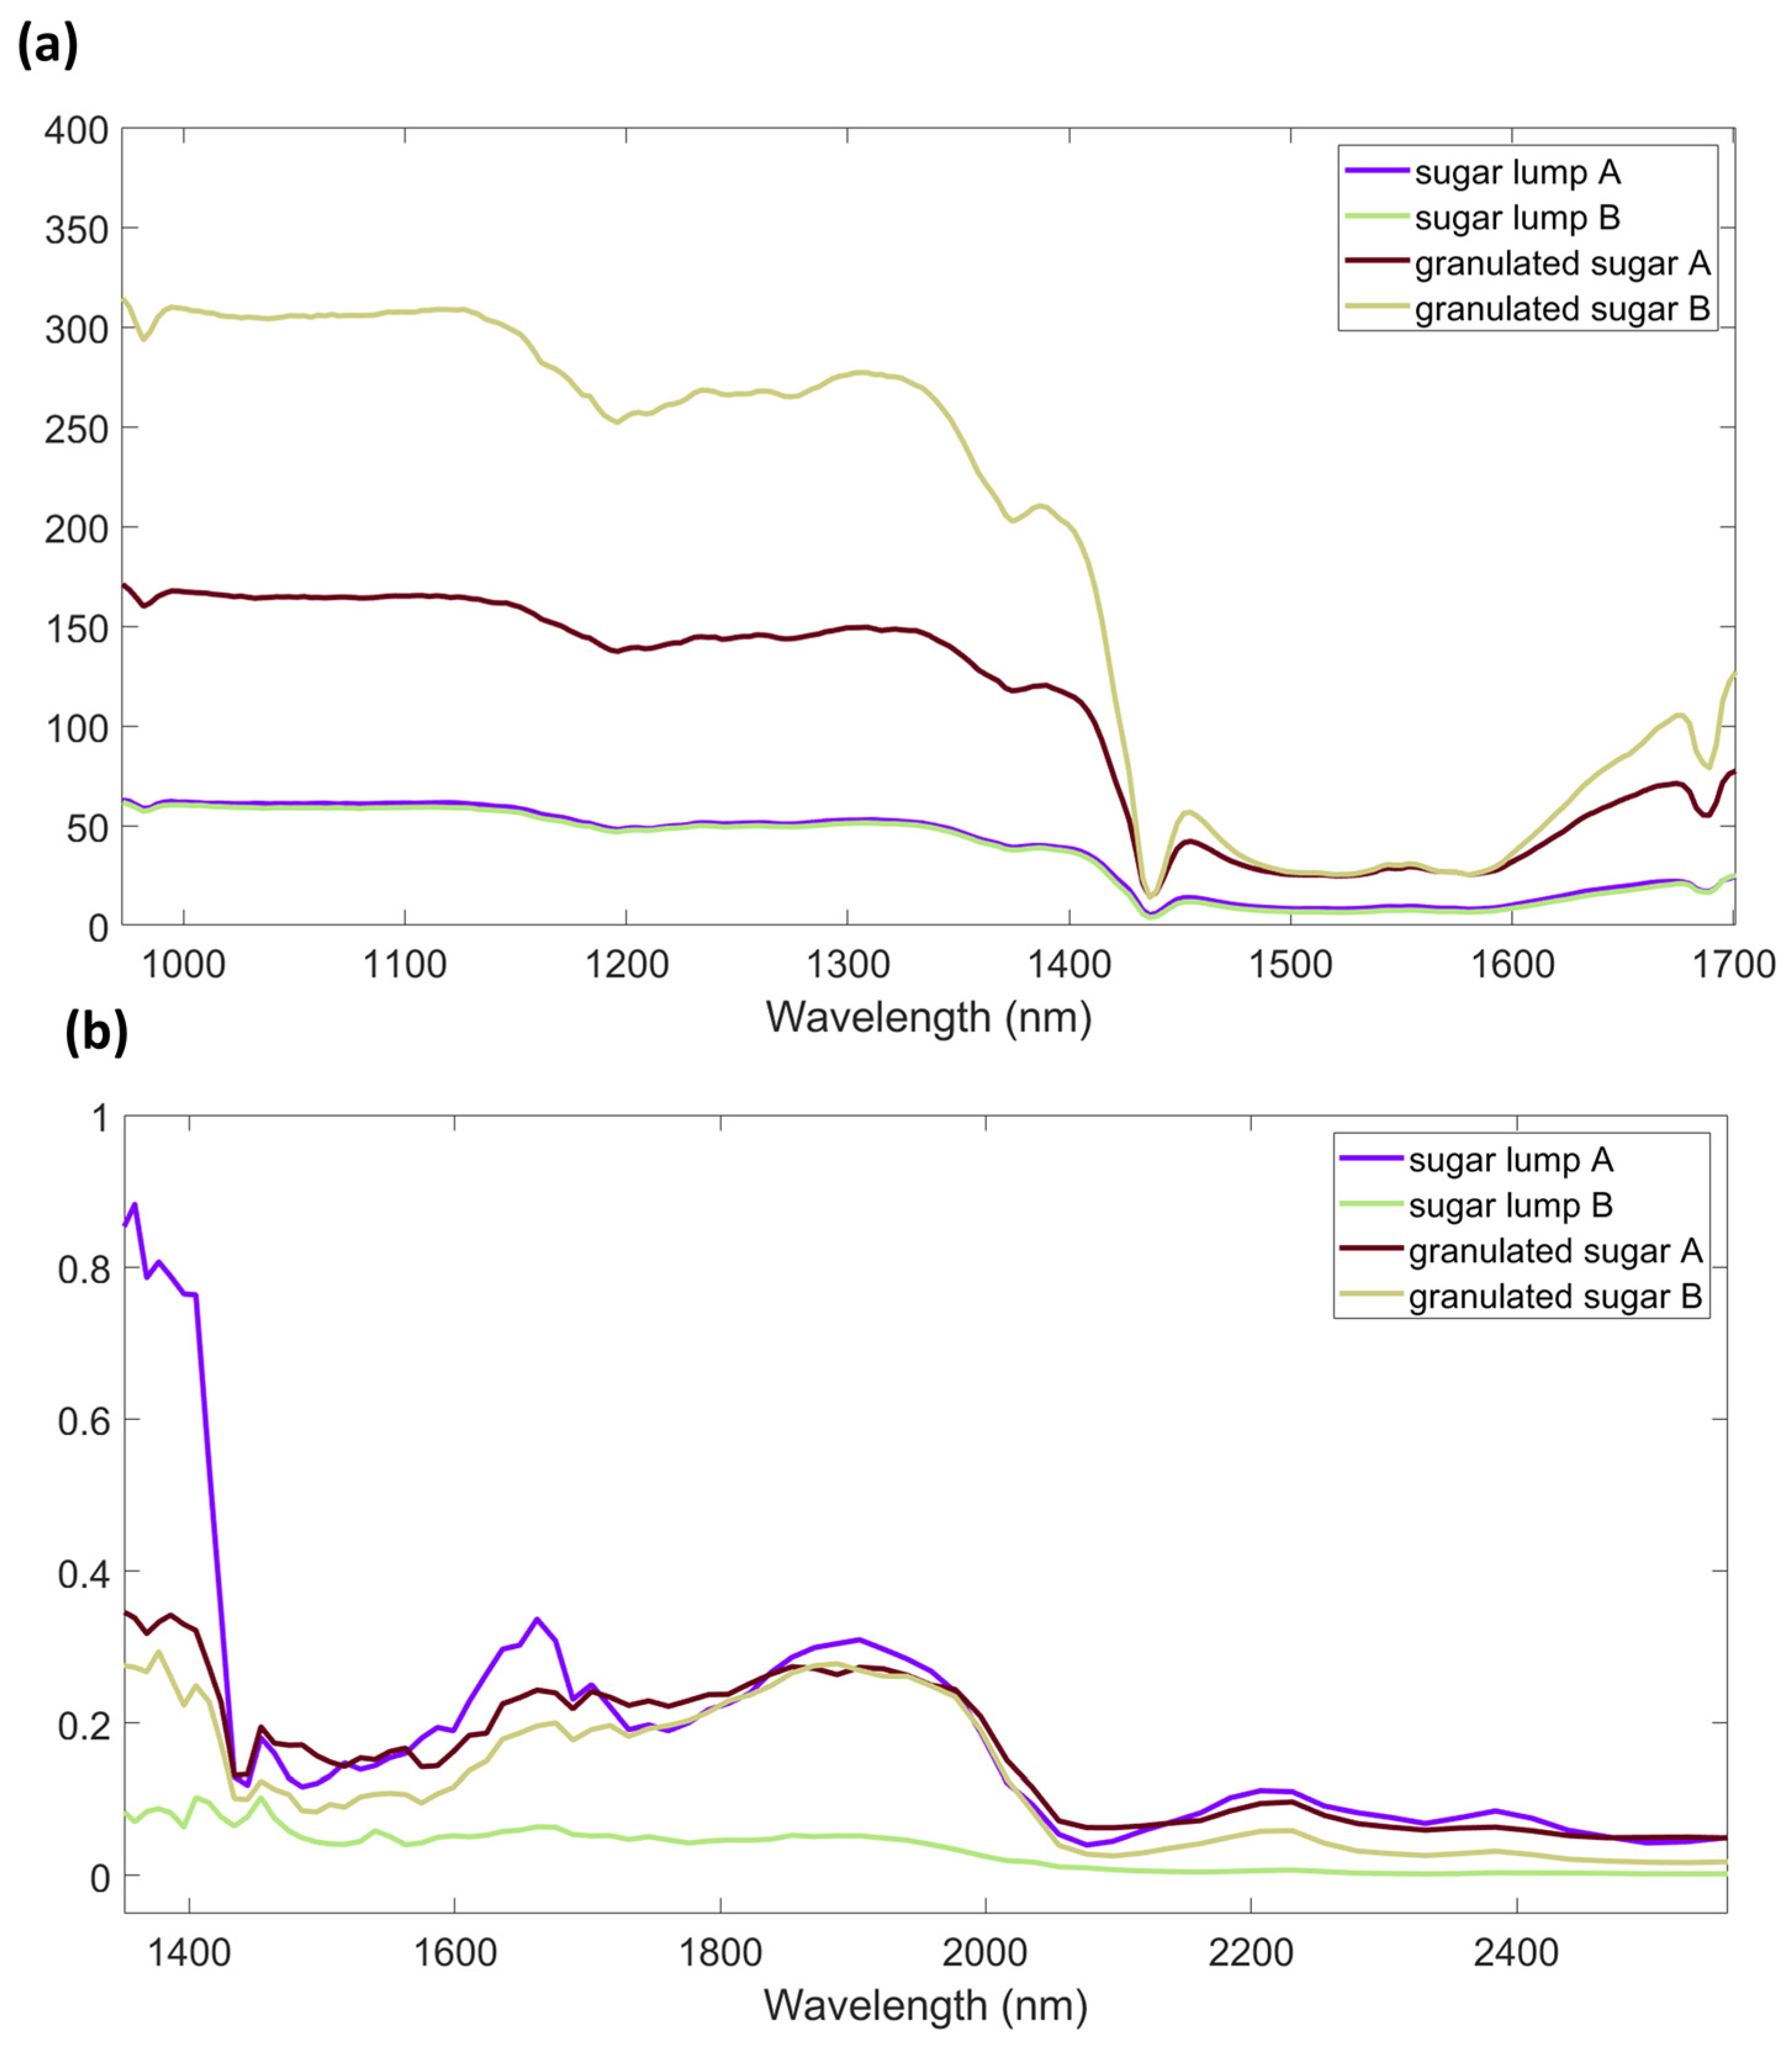
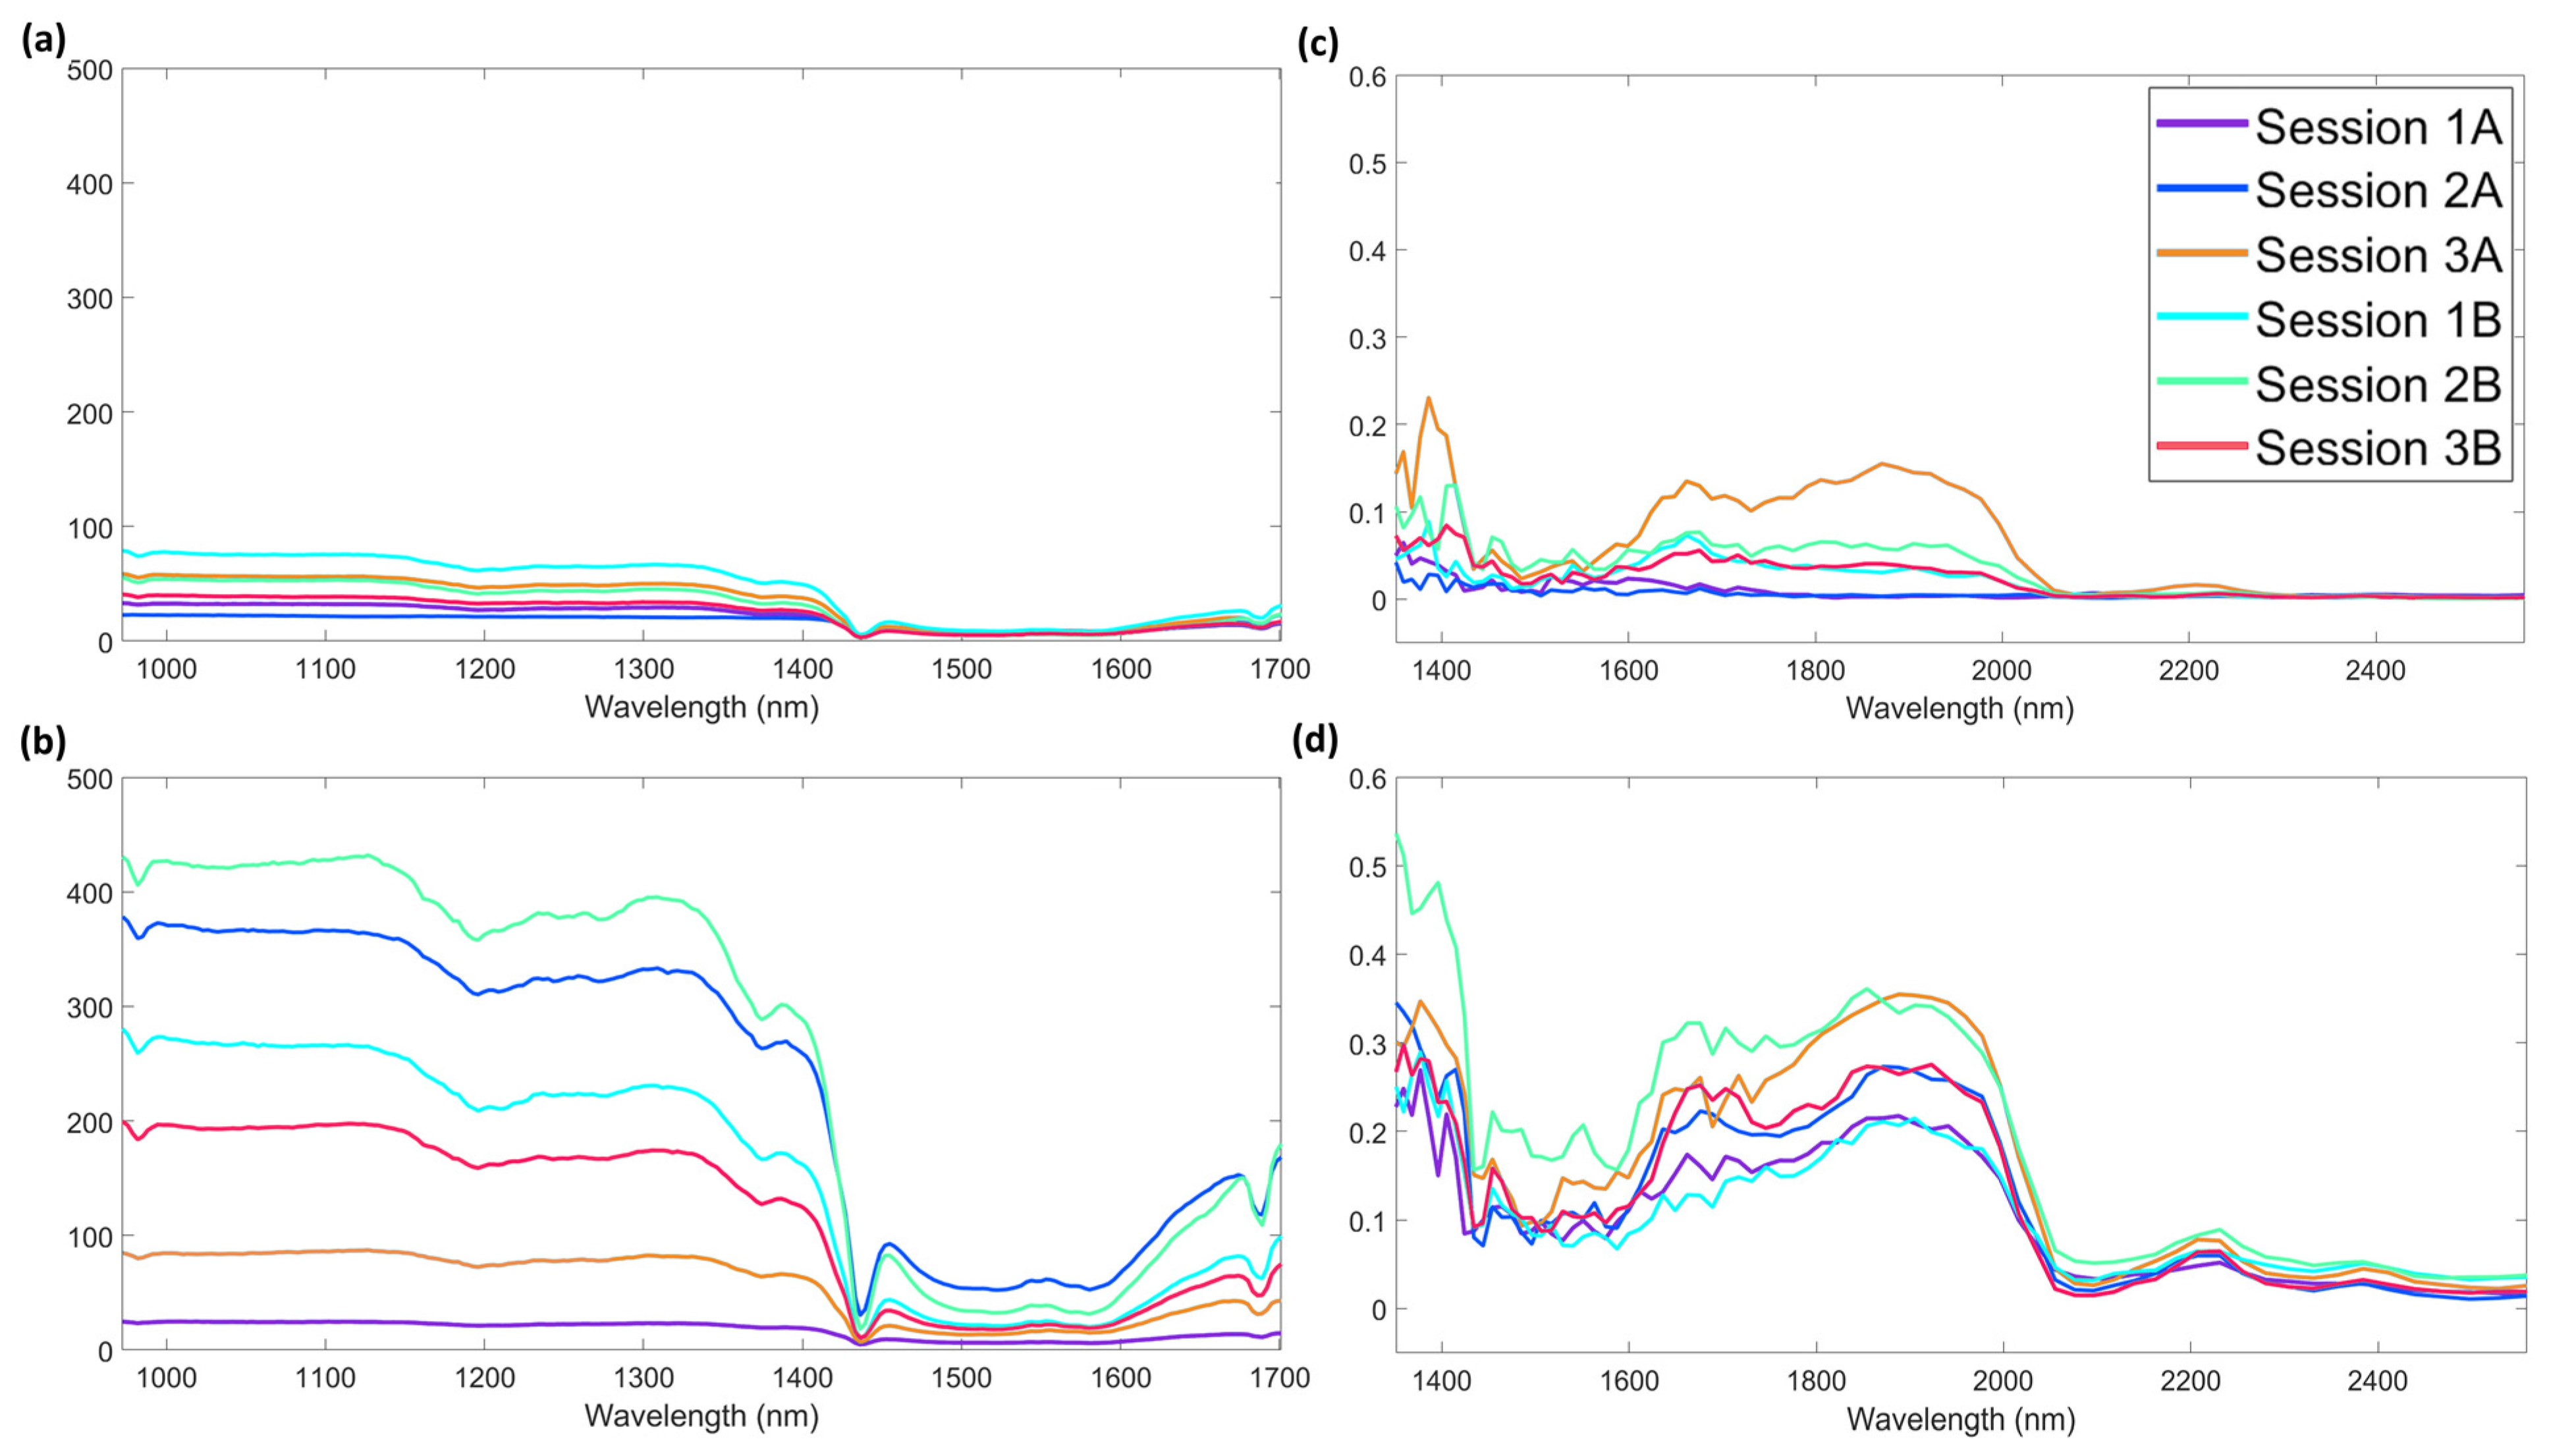
- AvaSpec-Mini-NIR (Avantes, Apeldoorn, NL, The Netherlands) with a reflection fiber probe (7 × 400 µm fiber, 2 m length, SMA term), with an integration time of 15 ms and the average scan set at 10. For each spectrum, 236 data points were obtained in the range 972–1701 nm.
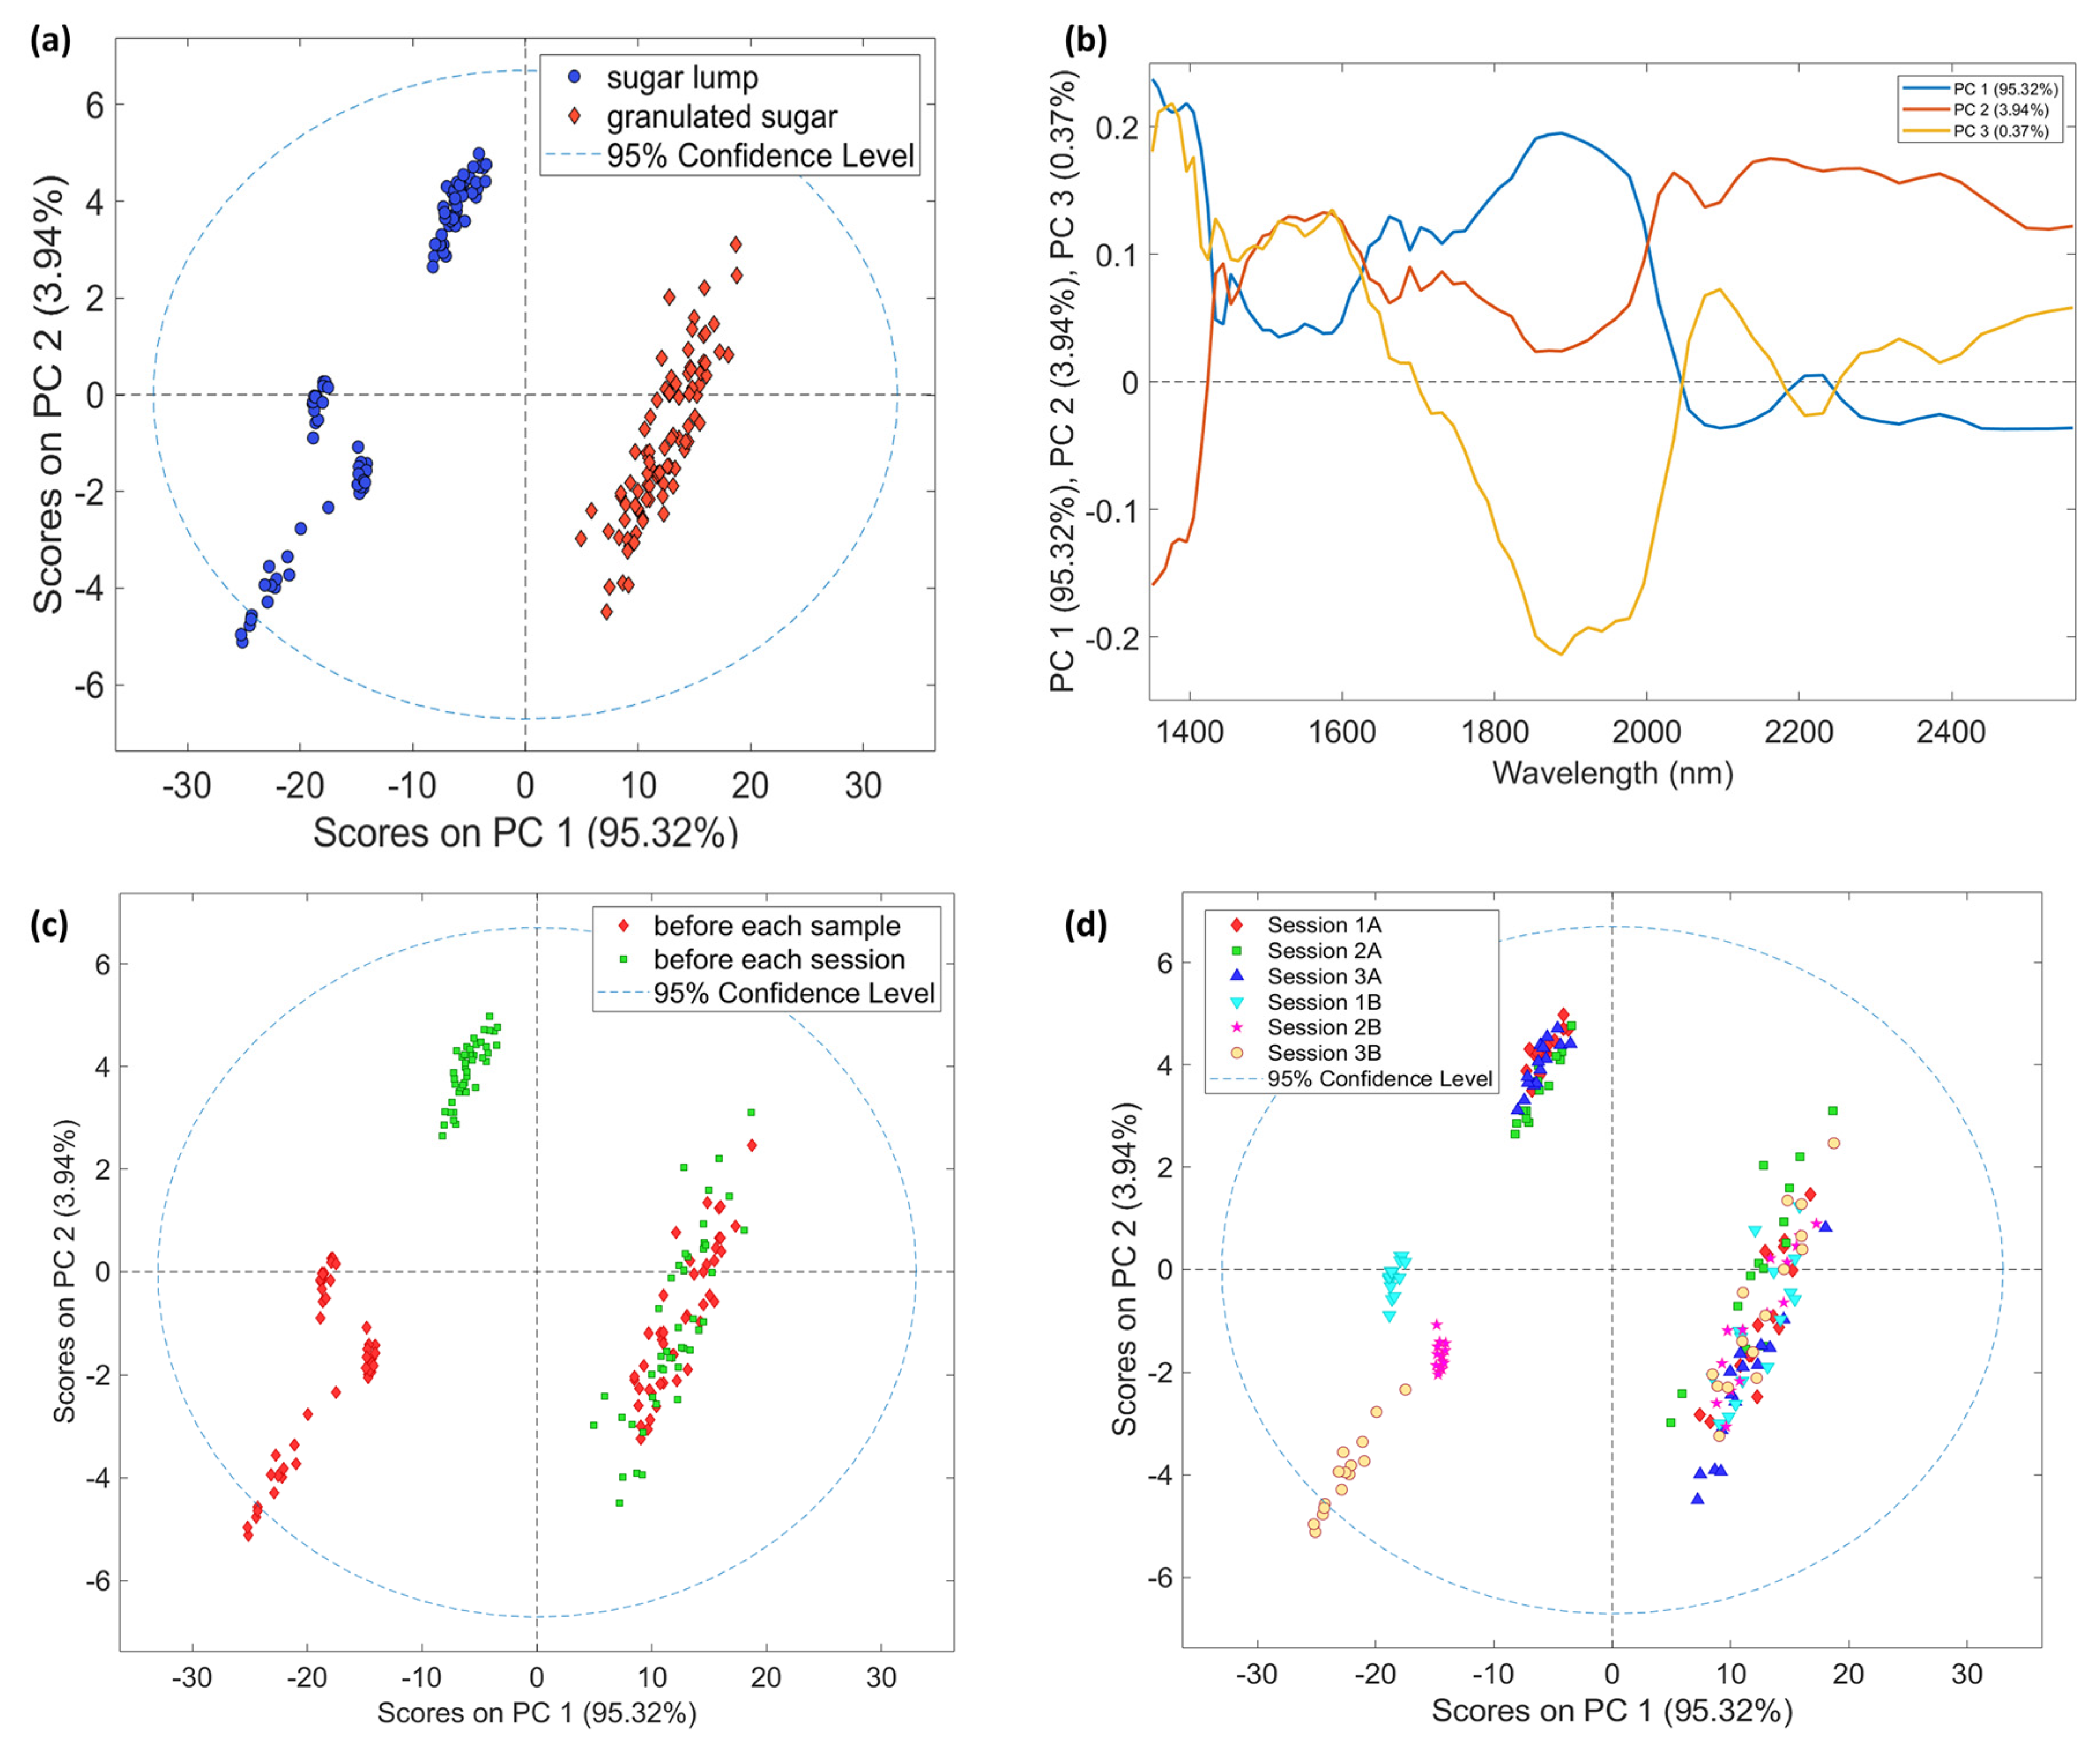
- NeoSpectra Scanner spectrometer (Si-Ware Systems, Menlo Park, CA, USA), at a time scan of 5 s without data interpolation. 74 data points for each spectrum were acquired in the range 1351–2559 nm. Data were acquired with direct contact analysis.
2.2. Methods
3. Results and Discussion
3.1. Spectra
3.2. Exploratory Analysis
3.2.1. AvaSpec-Mini-NIR
3.2.2. NeoSpectra Scanner
3.3. Multivariate Measurement Error
3.3.1. AvaSpec−Mini−NIR
Study of the Influences of Time of Background and Session
3.3.2. NeoSpectra Scanner
Study of the Influences of Time of Background and Session
4. Concluding Remarks
Supplementary Materials
Author Contributions
Funding
Data Availability Statement
Acknowledgments
Conflicts of Interest
References
- Chai, J.; Zhang, K.; Xue, Y.; Liu, W.; Chen, T.; Lu, Y.; Zhao, G. Review of Mems Based Fourier Transform Spectrometers. Micromachines 2020, 11, 214. [Google Scholar] [CrossRef]
- Beć, K.B.; Grabska, J.; Huck, C.W. Principles and Applications of Miniaturized Near-Infrared (NIR) Spectrometers. Chem. A Eur. J. 2021, 27, 1514–1532. [Google Scholar] [CrossRef]
- Giussani, B.; Gorla, G.; Riu, J. Analytical Chemistry Strategies in the Use of Miniaturised NIR Instruments: An Overview. Crit. Rev. Anal. Chem. 2022, 2022, 1–33. [Google Scholar] [CrossRef] [PubMed]
- Beć, K.B.; Grabska, J.; Huck, C.W. Miniaturized NIR Spectroscopy in Food Analysis and Quality Control: Promises, Challenges, and Perspectives. Foods 2022, 11, 1465. [Google Scholar] [CrossRef]
- Wentzell, P.D. Measurement Errors in Multivariate Chemical Data. J. Braz. Chem. Soc. 2014, 25, 183–196. [Google Scholar] [CrossRef]
- Bazar, G.; Kovacs, Z.; Tsenkova, R. Evaluating Spectral Signals to Identify Spectral Error. PLoS ONE 2016, 11, e0146249. [Google Scholar] [CrossRef] [PubMed]
- Wentzell, P.D.; Lohnes, M.T. Maximum Likelihood Principal Component Analysis with Correlated Measurement Errors: Theoretical and Practical Considerations. Chemom. Intell. Lab. Syst. 1999, 45, 65–85. [Google Scholar] [CrossRef]
- Wentzell, P.D.; Wicks, C.C.; Braga, J.W.B.; Soares, L.F.; Pastore, T.C.M.; Coradin, V.T.R. Implications of Measurement Error Structure on the Visualization of Multivariate Chemical Data: Hazards and Alternatives. Can. J. Chem. 2018, 11, 738–748. [Google Scholar] [CrossRef]
- Karakach, T.K.; Wentzell, P.D.; Walter, J.A. Characterization of the Measurement Error Structure in 1D 1 H NMR Data for Metabolomics Studies. Anal. Chim. Acta 2009, 636, 163–174. [Google Scholar] [CrossRef]
- Blanchet, L.; Réhault, J.; Ruckebusch, C.; Huvenne, J.P.; Tauler, R.; de Juan, A. Chemometrics Description of Measurement Error Structure: Study of an Ultrafast Absorption Spectroscopy Experiment. Anal. Chim. Acta 2009, 642, 19–26. [Google Scholar] [CrossRef]
- Grenyer, A.; Erkoyuncu, J.A.; Zhao, Y.; Roy, R. A Systematic Review of Multivariate Uncertainty Quantification for Engineering Systems. CIRP J. Manuf. Sci. Technol. 2021, 33, 188–208. [Google Scholar] [CrossRef]
- Keller, J.Y.; Zasadzinski, M.; Darouach, M. Analytical Estimator of Measurement Error Variances in Data Reconciliation. Comput. Chem. Eng. 1992, 16, 185–188. [Google Scholar] [CrossRef]
- Martens, H.; Høy, M.; Wise, B.M.; Bro, R.; Brockhoff, P.B. Pre-Whitening of Data by Covariance-Weighted Pre-Processing. J. Chemom. 2003, 17, 153–165. [Google Scholar] [CrossRef]
- Zhu, Y.; Fearn, T.; Samuel, D.; Dhar, A.; Hameed, O.; Bown, S.G.; Lovat, L.B. Error Removal by Orthogonal Subtraction (EROS): A Customised Pre-Treatment for Spectroscopic Data. J. Chemom. 2008, 22, 130–134. [Google Scholar] [CrossRef]
- Gorla, G.; Taiana, A.; Boqué, R.; Bani, P.; Gachiuta, O.; Giussani, B. Unravelling Error Sources in Miniaturized NIR Spectroscopic Measurements: The Case Study of Forages. Anal. Chim. Acta 2022, 1211, 339900. [Google Scholar] [CrossRef] [PubMed]
- Wentzell, P.D. 2.25—Other Topics in Soft-Modeling: Maximum Likelihood-Based Soft-Modeling Methods. In Comprehensive Chemometrics; Brown, S.D., Tauler, R., Walczak, B., Eds.; Elsevier: Oxford, UK, 2009; pp. 507–558. ISBN 978-0-444-52701-1. [Google Scholar]
- Allegrini, F.; Olivieri, A.C. Recent Advances in Analytical Figures of Merit: Heteroscedasticity Strikes Back. Anal. Methods 2017, 9, 739–743. [Google Scholar] [CrossRef]
- Folch-Fortuny, A.; Vitale, R.; de Noord, O.E.; Ferrer, A. Calibration Transfer between NIR Spectrometers: New Proposals and a Comparative Study. J. Chemom. 2017, 31, e2874. [Google Scholar] [CrossRef]
- Pereira, L.S.A.; Carneiro, M.F.; Botelho, B.G.; Sena, M.M. Calibration Transfer from Powder Mixtures to Intact Tablets: A New Use in Pharmaceutical Analysis for a Known Tool. Talanta 2016, 147, 351–357. [Google Scholar] [CrossRef]
- Workman, J.J. A Review of Calibration Transfer Practices and Instrument Differences in Spectroscopy. Appl. Spectrosc. 2018, 72, 340–365. [Google Scholar] [CrossRef]
- Schoot, M.; Alewijn, M.; Weesepoel, Y.; Mueller-Maatsch, J.; Kapper, C.; Postma, G.; Buydens, L.; Jansen, J. Predicting the Performance of Handheld Near-Infrared Photonic Sensors from a Master Benchtop Device. Anal. Chim. Acta 2022, 1203, 339707. [Google Scholar] [CrossRef]
- Eady, M.; Payne, M.; Changpim, C.; Jinnah, M.; Sortijas, S.; Jenkins, D. Establishment of Instrument Operation Qualification and Routine Performance Qualification Procedures for Handheld Near-Infrared Spectrometers Used at Different Locations within a Laboratory Network. Spectrochim. Acta Part A Mol. Biomol. Spectrosc. 2022, 267, 120512. [Google Scholar] [CrossRef]
- Stinchcombe, J.R.; Simonsen, A.K.; Blows, M.W. Estimating Uncertainty in Multivariate Responses to Selection. Evolution 2014, 68, 1188–1196. [Google Scholar] [CrossRef] [PubMed]
- Morad, K.Y.; Svrcek, W.; McKay, I. A Robust Direct Approach for Calculating Measurement Error Covariance Matrix. Comput. Chem. Eng. 1999, 23, 889–897. [Google Scholar] [CrossRef]
- Vasebi, A.; Hodouin, D.; Poulin, É. The Importance of Uncertainty Covariance Tuning for Steady-State Data Reconciliation in Mineral and Metal Processing. IFAC 2013, 46, 18–23. [Google Scholar] [CrossRef]
- Sabahno, H.; Castagliola, P.; Amiri, A. A Variable Parameters Multivariate Control Chart for Simultaneous Monitoring of the Process Mean and Variability with Measurement Errors. Qual. Reliab. Eng. Int. 2020, 36, 1161–1196. [Google Scholar] [CrossRef]
- Leger, M.N.; Vega-Montoto, L.; Wentzell, P.D. Methods for Systematic Investigation of Measurement Error Covariance Matrices. Chemom. Intell. Lab. Syst. 2005, 77, 181–205. [Google Scholar] [CrossRef]
- Martínez, M.L.; Garrido-varo, A.; De Pedro, E.; Sánchez, L. Effect of Sample Heterogeneity on near Infrared Meat Analysis: The Use of the RMS Statistic. J. Near Infrared Spectrosc. 1998, 320, A313–A320. [Google Scholar] [CrossRef]
- Adams, M.J. Chemometrics in Analytical Spectroscopy; The Royal Society of Chemistry: London, UK, 1995; ISBN 0-85404-555-4. [Google Scholar]
- Zhang, L.; Xu, H.; Gu, M. Use of Signal to Noise Ratio and Area Change Rate of Spectra to Evaluate the Visible/NIR Spectral System for Fruit Internal Quality Detection. J. Food Eng. 2014, 139, 19–23. [Google Scholar] [CrossRef]
- Wentzell, P.D.; Giglio, C.; Kompany-Zareh, M. Beyond Principal Components: A Critical Comparison of Factor Analysis Methods for Subspace Modelling in Chemistry. Anal. Methods 2021, 13, 4188–4219. [Google Scholar] [CrossRef]
- Matinrad, F.; Kompany-Zareh, M.; Omidikia, N.; Dadashi, M. Systematic Investigation of the Measurement Error Structure in a Smartphone-Based Spectrophotometer. Anal. Chim. Acta 2020, 1129, 98–107. [Google Scholar] [CrossRef]
- Todeschini, R.; Consonni, V.; Maiocchi, A. The K Correlation Index: Theory Development and Its Application in Chemometrics. Chemom. Intell. Lab. Syst. 1999, 46, 13–29. [Google Scholar] [CrossRef]
- Christian Huck, Y.O. Introduction and Principles. In Near-Infrared Spectroscopy; Huck, C., Ozaki, Y., Tsuchikawa, S.B.E., Eds.; Springer: Berlin/Heidelberg, Germany, 2014; ISBN 9789811586477. [Google Scholar]
- Berntsson, O.; Danielsson, L.G.; Folestad, S. Estimation of Effective Sample Size When Analysing Powders with Diffuse Reflectance Near-Infrared Spectrometry. Anal. Chim. Acta 1998, 364, 243–251. [Google Scholar] [CrossRef]
- Antila, J.; Tuohiniemi, M.; Rissanen, A.; Kantojärvi, U.; Lahti, M.; Viherkanto, K.; Kaarre, M.; Malinen, J. MEMS-and MOEMS-Based Near-Infrared Spectrometers; Wiley Online Library: Hoboken, NJ, USA, 2000; ISBN 9780470027318. [Google Scholar]
- Pasikatan, M.C.; Steele, J.L.; Spillman, C.K.; Haque, E. Near Infrared Reflectance Spectroscopy for Online Particle Size Analysis of Powders and Ground Materials. J. Near Infrared Spectrosc. 2001, 9, 153–164. [Google Scholar] [CrossRef]
- Szalay, A.; Antal, I.; Zsigmond, Z.; Marton, S.; Eros, I.; Regdon, G.; Pintye-Hódi, K. Technical Note: Study on the Relationship between Particle Size and near Infrared Diffuse Reflectance Spectroscopic Data. Part. Part. Syst. Charact. 2005, 22, 219–222. [Google Scholar] [CrossRef]
- Bro, R.; Smilde, A. Principal component analysis. Anal. Methods 2014, 6, 2812–2831. [Google Scholar] [CrossRef]
- Bertinetto, C.G.; Schoot, M.; Dingemans, M.; Meeuwsen, W.; Buydens, L.M.C.; Jansen, J.J. Influence of Measurement Procedure on the Use of a Handheld NIR Spectrophotometer. Food Res. Int. 2022, 161, 111836. [Google Scholar] [CrossRef] [PubMed]
- Cela, R.; Marcel Blanco, V.C. Adquisicíon y Pre-Procesamiento de Señales Analíticas. In Temas Avanzados de Quimiometría; 2007; ISBN 9878483840061. Available online: https://repositorio.utp.edu.co/server/api/core/bitstreams/3c234c69-a7a7-4502-91f9-bb78e0821626/content (accessed on 19 December 2022).
- Allegrini, F.; Braga, J.W.B.; Moreira, A.C.O.; Olivieri, A.C. Error Covariance Penalized Regression: A Novel Multivariate Model Combining Penalized Regression with Multivariate Error Structure. Anal. Chim. Acta 2018, 1011, 20–27. [Google Scholar] [CrossRef]
- Allegrini, F.; Wentzell, P.D.; Olivieri, A.C. Generalized Error-Dependent Prediction Uncertainty in Multivariate Calibration. Anal. Chim. Acta 2016, 903, 51–60. [Google Scholar] [CrossRef]
- Feital, T.; Prata, D.M.; Pinto, J.C. Comparison of Methods for Estimation of the Covariance Matrix of Measurement Errors. Can. J. Chem. Eng. 2014, 92, 2228–2245. [Google Scholar] [CrossRef]
- Arteaga, F.; Ferrer, A. Building Covariance Matrices with the Desired Structure. Chemom. Intell. Lab. Syst. 2013, 127, 80–88. [Google Scholar] [CrossRef]
- Alfriend, K.T.; Vadali, S.R.; Gurfil, P.; How, J.P.; Breger, L. Spacecraft Formation Flying; Elsevier/Butterworth-Heinemann: Amsterdam, The Netherlands, 2010; ISBN 978-0-75-068533-7. [Google Scholar]
- Roger, J.-M.; Boulet, J.-C.; Magida Zeaiter, D.N.R. 3.01—Pre-Processing Methods. In Comprehensive Chemometrics; Elsevier: Amsterdam, The Netherlands, 2020; pp. 1–75. [Google Scholar]

| AvaSpec-Mini-NIR | NeoSpectra Scanner | |||
|---|---|---|---|---|
| Sugar Lump | Granulated Sugar | Sugar Lump | Granulated Sugar | |
| Absolute standard deviation-mean | 5.9 | 11.3 | 0.8 | 0.4 |
| Relative standard deviation (%)-mean | 25.5 | 37.9 | 5.3 | 3.05 |
| RMS-mean | 4.8 | 8.5 | 0.8 | 0.3 |
| RMS-standard deviation | 3.9 | 8.5 | 0.3 | 0.18 |
| Signal/Noise Ratio-mean | 4.0 | 2.7 | 19.7 | 42.4 |
| Signal/Noise Ratio–standard deviation | 0.6 | 0.4 | 5.4 | 19.8 |
| Sugar Lump | Granulated Sugar | |||
|---|---|---|---|---|
| # of Principal Components | % Variance in Original Residuals (Ê) | % Variance in the Error Covariance Matrix (Σ) | % Variance in Original Residuals (Ê) | % Variance in the Error Covariance Matrix (Σ) |
| 1 | 98.464 | 99.993 | 99.343 | 99.998 |
| 2 | 1.404 | 0.007 | 0.559 | 0.002 |
| 3 | 0.074 | 0.000 | 0.049 | 0.000 |
| 4 | 0.032 | 0.000 | 0.024 | 0.000 |
| 5 | 0.012 | 0.000 | 0.017 | 0.000 |
| Sugar Lump | Granulated Sugar | |||
|---|---|---|---|---|
| # of Principal Components | % Variance in Original Residuals (Ê) | % Variance in the Error Covariance Matrix (Σ) | % Variance in Original Residuals (Ê) | % Variance in the Error Covariance Matrix (Σ) |
| 1 | 95.38 | 99.667 | 87.048 | 98.464 |
| 2 | 2.407 | 0.312 | 5.043 | 1.404 |
| 3 | 0.822 | 0.014 | 2.842 | 0.074 |
| 4 | 0.364 | 0.006 | 1.540 | 0.032 |
| 5 | 0.224 | 0.001 | 0.788 | 0.034 |
| Imbedded Correlation | Sample | Background A | Background B | ||||
|---|---|---|---|---|---|---|---|
| Session 1 | Session 2 | Session 3 | Session 1 | Session 2 | Session 3 | ||
| 0.81 | Sugar lump | 0.85 | 0.83 | 0.91 | 0.87 | 0.89 | 0.89 |
| Granulated sugar | 0.93 | 0.93 | 0.94 | 0.94 | 0.94 | 0.93 | |
Disclaimer/Publisher’s Note: The statements, opinions and data contained in all publications are solely those of the individual author(s) and contributor(s) and not of MDPI and/or the editor(s). MDPI and/or the editor(s) disclaim responsibility for any injury to people or property resulting from any ideas, methods, instructions or products referred to in the content. |
© 2023 by the authors. Licensee MDPI, Basel, Switzerland. This article is an open access article distributed under the terms and conditions of the Creative Commons Attribution (CC BY) license (https://creativecommons.org/licenses/by/4.0/).
Share and Cite
Gorla, G.; Taborelli, P.; Alamprese, C.; Grassi, S.; Giussani, B. On the Importance of Investigating Data Structure in Miniaturized NIR Spectroscopy Measurements of Food: The Case Study of Sugar. Foods 2023, 12, 493. https://doi.org/10.3390/foods12030493
Gorla G, Taborelli P, Alamprese C, Grassi S, Giussani B. On the Importance of Investigating Data Structure in Miniaturized NIR Spectroscopy Measurements of Food: The Case Study of Sugar. Foods. 2023; 12(3):493. https://doi.org/10.3390/foods12030493
Chicago/Turabian StyleGorla, Giulia, Paolo Taborelli, Cristina Alamprese, Silvia Grassi, and Barbara Giussani. 2023. "On the Importance of Investigating Data Structure in Miniaturized NIR Spectroscopy Measurements of Food: The Case Study of Sugar" Foods 12, no. 3: 493. https://doi.org/10.3390/foods12030493
APA StyleGorla, G., Taborelli, P., Alamprese, C., Grassi, S., & Giussani, B. (2023). On the Importance of Investigating Data Structure in Miniaturized NIR Spectroscopy Measurements of Food: The Case Study of Sugar. Foods, 12(3), 493. https://doi.org/10.3390/foods12030493


