Abstract
Lupin, an arid pulse, is gaining popularity as a super food due to its superior nutritional properties. However, it has not been considered for large scale thermal processing, e.g., canning. The present work evaluated the best time/temperature combination to hydrate lupins for canning with minimum losses of bioactive nutrients, pre-biotic fibre, and total solids during hydration. The two lupin species showed a sigmoidal hydration behaviour, which was adequately modelled by the Weibull distribution. The effective diffusivity, Deff, increased from 7.41 × 10⁻¹¹ to 2.08 × 10⁻¹⁰ m2/s for L. albus and 1.75 × 10⁻¹⁰ to 1.02 × 10⁻⁹ m2/s for L. angustifolius with increasing temperature, namely, from 25 °C to 85 °C. The lag phase decreased from 145 min to 56 min in L. albus and 61 min to 28 min in L. angustifolius. However, based on the effective hydration rate, reaching the equilibrium moisture, minimum loss of the solids, and prebiotic fibre and phytochemicals, 200 min hydration at 65 °C can be regarded as the optimum temperature of hydration. The findings are thus relevant for designing the hydration protocol to achieve the maximum equilibrium moisture content and yield with the minimum loss of solids (phytochemicals and prebiotic fibres) for L. albus and L. angustifolius.
1. Introduction
Lupin is a member of the Leguminosae family and was domesticated in twentieth century for human consumption and animal feed [1]. Lupinus angustifolius (sweet lupin) is a widely cultivated lupin species, followed by Lupinus albus (white lupin) and Lupinus luteus (yellow lupin) [2,3,4]. Lupins contain high levels of protein (30–44%) and non-starch polysaccharides (40%) and low levels of fat (6–8%) [5,6,7]. The major phenolic chemicals found in lupin are classified as flavones, phenolic acids, and isoflavones. For example, L. angustifolius contains 76%, 19%, and 4% flavones, phenolic acids, and isoflavones, respectively [2,8,9]. Variations in phenol content can exist for different cultivar and growth conditions. Lupin is becoming more popular due its nutritional profile and has recently attracted much attention towards the development of lupin-based products. The presence of alkaloids, most notably quinolizidine (in bitter lupins, 1.0–4.5 g per 100 g), limits the consumption of lupins despite their nutritional benefits [6,10]. Health authorities in the UK, Australia, New Zealand, and France have set 200 mg/kg as the amount maximum of quinolizidine that can be found in lupin flour and feed [11,12]. Commercially available cultivars with a low alkaloid content (L. angustifolius, L. albus, and L. luteus) are suitable for use in food and animal feed [13,14].
Numerous medical and animal studies have proven the nutraceutical effect of lupins in reducing obesity, diabetes, and cardiovascular disease [5,15,16]. Lupin has been used to make a variety of food products, including muffins [17], bread [14], noodles [18,19], and pasta [20,21] because of its nutritional and functional value. However, it has not yet been considered for larger scale thermal processing such as canning.
Hydration is a critical and primary unit operation in legume processing. The main purpose of soaking dry legumes before food preparation is to facilitate and improve heat and mass transfer during cooking [22,23]. In addition, it helps to maintain uniform texture throughout the products and removes certain anti-nutritional factors [24]. A previous investigation found that the tropical legume Mucana, which is native to Africa, reduced phytic acid by 27.9% and 36.0% after 6 and 24 h of soaking, respectively, at ambient temperature [25]. Phytase activity increased as a result of the soaking, which decreased the amount of phytate that was present in the grains.
However, hydration is not a simple process; it involves multiple steps such as water absorption, capillary flow, diffusion, and solid matrix relaxation. Similarly, several intrinsic factors such as seed size, seed coat thickness, cotyledon chemical composition, and the size of the micropyle and hilum and extrinsic factors such as the temperature of the soaking medium, pH, solids in media, etc., affect the hydration rate [26,27,28]. Generally, the seed coat of Fabaceae family grains consists of a more complex structure compared to the Poaceae family, such as wheat, barley, corn, and rice [29,30]. The pericarp in Poaceae family grains are very permeable to water, whereas the seed coat of grains from the Fabaceae family can be partially or entirely impervious depending on composition, variety, and moisture [31].
Typically, legume hydration can be conducted for 20–40 min at high temperatures (82–100 °C) or 8–16 h at room temperature [22,32]. Even though hydration at ambient temperature (22 °C) is time-consuming, it is preferred in terms of the nutritional perspective [22,33,34,35]. Elevated temperature is preferred in industrial processing since it increases the water uptake rate and minimises the processing time, allocation of space, tank capacity, and risk of microbial growth. However, elevated temperatures result in low equilibrium moisture content (EMC) and adversely affect thermolabile phenols, anthocyanins, and higher leaching of total solids and prebiotic fibre [33,36]. For example, polyphenols are sensitive to high temperatures, which significantly affect the phenolic content of lupins during hydration. Therefore, optimisation of hydration time/temperature on lupin can provide valuable insights while designing hydration protocols, which maximise the moisture content and reduce the loss of bioactive nutrients, total solids, and prebiotic fibre.
Though legume hydration has been widely investigated, there is still a lack of studies on total solid and phytochemical loss during hydration. Several kinetic models have been developed to estimate the hydration level under various conditions [37]. Among them, the Peleg model, which explains the downward concave behaviour of hydration, is an imperial model to estimate the moisture content at different time intervals of hydration [31]. The Kaptso and Weibull distribution models explains the sigmoidal behaviour of hydration and can predict moisture and initial lag phase time [31]. Most of the previous studies on lupin hydration focused on understanding the hydration behaviour instead of investigating the thermodynamics and the loss of valuable phytonutrients, oligosaccharides, and soluble solids and hardness changes during hydration. In the present work, we analysed the hydration and thermodynamic behaviour of two lupin species: L. albus and L. angustifolius. Moreover, we elucidated the effects of the hydration time–temperature combination on hardness, total phenols, anthocyanins, probiotic fibre loss, and total solid loss at different time points during hydration at 25 °C, 45 °C, 65 °C, and 85 °C. Therefore, our findings are novel in this regard and have scientific as well as industrial relevance.
2. Materials and Methods
2.1. Materials and Chemicals
L. albus and L. angustifolius were supplied by Seednet, Horsham VIC 3400, Australia. L. albus and L. angustifolius had initial moisture contents of 9.188 ± 0.57 and 10.128 ± 0.3 (g/100 g db.), respectively. Before the experiment, samples were kept at room temperature in an airtight sealed container. Potassium chloride, gallic acid, Folin reagent, sodium acetate, sodium carbonate, oligosaccharide standards, D-stachyose hydrate, raffinose pentahydrate, verbascose, and HPLC grade methanol were purchased from Sigma Aldrich, Melbourne, VIC, Australia.
2.2. Physical Properties
Physical properties such as mean diameter (De), volume (V), and surface area (S) of seeds were measured using the equations reported by Mohsenin [38]. On hundred randomly selected seeds were weighed in triplicate, and the total weight was multiplied by ten to measure the thousand grain weight. A digital calliper was used to measure the width (W), length (L), and thickness (T) of 50 seeds; both types of lupins were considered trapezoid (flat, rectangular, or square in shape, with rounded corners). Then the surface area was calculated using Knud Thomsen approximation combined with Equation (3) [39,40].
2.3. Hydration Kinetics and Modelling
The hydration behaviour of lupins was examined using 80 g of samples kept in a water bath (Thermoline TWB-22T) at the different temperatures of 25 °C, 45 °C, 65 °C, and 85 °C (±2). The weight of samples was measured at different time intervals (15 min) by taking out lupins from the mesh bag and blot-drying them using paper towels. Then dry basis moisture content and moisture ratios were plotted against hydration time.
Mathematical modelling was carried out to uncover the hydration behaviour and underlying factors affecting the mass transfer mechanisms. Experimental results were fitted to a mechanistic model and three empirical models. Mechanistic model, based on Fick’s law of diffusion with a lumped parameter, viz, effective diffusivity, Deff, was used. Three widely used empirical model, i.e., Peleg’s model, the Kaptso model, and the Weibull distribution model, were checked for adequacy. Non-linear regression analysis was carried out for fitting the experimental values to model values with the Levenberg–Marquardt iteration algorithm in Origin 18 software package.
2.3.1. Fickian Diffusion Model
Fick’s law of diffusion is the most commonly applied mass transport model in food processing. The mass transfer rate is directly proportional to the curvature of the concentration gradient, according to Fick’s equation of diffusion, and may be expressed mathematically as
where the term right hand term indicates the rate of concentration change, while the left-hand term is the second partial derivative of concentration with respect to position in the X coordinate.
Proportionality constant, Deff (m2/s), i.e., effective diffusivity, is the measure of mass transfer in the system. For spherical objects, Equation (6) can be reduced to [41]
where Me, Mi, and Mt are equilibrium moisture content, initial moisture content, and moisture at any time t, and r is the equivalent radius of the lupin grains. Many researchers have observed that as processing time increases, the infinite series converges rapidly to the first term of the equation, thus taking the first term into consideration and omitting the others [41,42].
Equation (8) was used in the present study to model the hydration behaviour of lupin seeds. A plot between Ln (MR) and hydration time was conducted, and the Deff was determined from the slope of the graph employing the following formula:
To determine the relationship between Deff and temperature, an Arrhenius type equation was used. A plot between Ln (Deff) and 1/T was used to determine the activation energy and pre-exponential factor.
2.3.2. Peleg’s Model
Peleg’s model is a two factor non-exponential model commonly used to demonstrate the downward concave shape hydration behaviour [42].
where the parameter K1 is indicative of the water absorption rate, and K2 is related to the achievable equilibrium moisture content.
2.3.3. Sigmoidal Model
Typically, this model simulates the sigmoidal hydration behaviour and accounts for the lag in water uptake due to the outer seed coat of pulses. The modelling equation is as follows:
where parameter k is related to the water uptake rate, and term τ describes the lag phase.
2.3.4. Weibull Distribution Model
The Weibull distribution model, a widely used probability distribution function, has been employed by several scientists to model the hydration and dehydration process with significantly high accuracy. For hydration, the model defined over two-factors, namely, scale parameter α and shape parameter β, can be used (Equation (13)) [42].
where all the symbols have the usual meaning as specified above unless stated otherwise.
2.3.5. Determination of Model Suitability
Finally, the model fitting quality was assessed by calculating the coefficient of determination (R2) and the reduced chi square and root-mean-square error values (RMSE).
where Yei is the experimental value for the ith term, Ypi is the predicted value obtained from the model, Yp is the mean of experimental values, N is the total observations, and n is the number of terms in the predicting model.
2.4. Thermodynamic Characterisation
The Fickian diffusion model was used to estimate the thermodynamic properties, viz, enthalpy of activation (), entropy of activation , and Gibb’s free energy for the effective diffusivity. These thermodynamic properties were estimated (Equations (17)–(19)) as a function of hydration temperature [39,43,44].
where R is the universal gas constant (8.314 J/mol.K), T is the absolute temperature (K), kb is Boltzmann’s constant (1.38 × 10⁻²³ J/K), and hp is Planck’s constant (6.626 × 10⁻³⁴ J·s).
2.5. Morphological Characteristics of Lupins
A scanning electron microscope (SEM) (Phenom XL Phenom World, The Netherlands, Eindhoven) was used to characterise the surfaces of the seed coat, cotyledon, and hilum at 10 kV. The lupin outer surface, seed coat, cotyledon, and hilum with micropyle were cut into thin slices using a scalpel blade and coated with 5 nm platinum before observing under SEM.
2.6. Hardness Measurement
To measure the hardness, 80 g of each lupin sample was kept in a mesh strainer bag and maintained under the same hydration conditions. At each sampling point, 20 seeds were taken out, and hardness was measured as a penetration test using a TA.XtplusC texture analyser with a load cell of 5 kg. A needle (P/2) was used to perforate the grain at 0.2 mms−1 on the abaxial side (y-axis) until a distance of 3 mm was reached.
2.7. Total Solid Loss
The solid content of hydration media was measured at several time points during hydration to determine solid loss during hydration. Then the collected samples were freeze-dried, and solid loss was calculated.
2.8. Total Phenolic and Total Anthocyanin Loss
Total phenolic content was quantified using the Folin–Ciocalteau method adapted to the micro assay following the method of Devkota et al. [45]. Initially, the sample and Folin reagent (50 μL of each) were added. Then, 100 μL of 0.7 mol dm−3 Na2CO3 was added and incubated for 1 h. Gallic acid was used to create a calibration curve. Using a Tecan Infinite 200PRO microplate reader, the absorbance values of the samples were measured at 765 nm.
The total anthocyanin loss of hydration medium was determined at each time point using the method described by Devkota et al. [45]. KCl buffer (pH 1.0) or sodium acetate buffer (pH 4.5) were used to dilute the samples. Once the dilution factor was determined, samples were mixed with KCl buffer, and absorbance was measured at 520 nm and 700 nm using a Tecan Infinite 200PRO microplate reader (Mannedorf Switzerland).
A is absorbance difference ((A520–A700) pH 1.0 − (A520–A700) pH 4.5), l is the path length in cm, DF is the dilution factor, ε is the molar coefficient (26,900 in l/mol cm), and MW is the molecular weight (449.2 g/mol) of C3G.
2.9. Oligosaccharide and Soluble Fibre Loss
The oligosaccharide loss during hydration was measured by HPLC-RI, as described by Devkota et al. [46]. Samples were first filtered using a solid-phase adsorption cartridge and then collected in glass vials after filtering through a nylon filter (0.2 μm). An Agilent HPLC-RI system (Agilent infinity 1260) equipped with an Agilent Hi-Plex Na oligosaccharide column (300 × 7.7 mm) and a Hi-Plex Na guard column (50 × 7.7 mm) was used at a flow rate of 0.2 mL/min. Columns were maintained at 80 °C, and the RI detector was maintained at 45 °C to detect oligosaccharides. A calibration curve was created by using raffinose, stachyose, and verbascose standards.
2.10. Data Analysis and Statistics
All tests were conducted in triplicate, and the results were reported as an average. SPSS statistics was used for statistical analysis (IBM, Version 27, 2021). Data were analysed using one-way ANOVA, and mean differences were evaluated using Tukey’s multiple comparison tests at a p < 0.05 significance level. The non-linear regression analysis was carried out in Origin 2018 software.
3. Results and Discussion
3.1. Physical Properties
The physical property attributes of legumes had pronounced effects on their hydration kinetics, chemical, and mechanical behaviour. The seed size, shape, and thickness and the morphology of the seed coat played a vital role in legume hydration since all these factors contributed to the mass and heat transfer through the seed coat [42,47,48]. The physical property attributes for L. albus and L. angustifolius seeds are shown in Table 1.

Table 1.
Physical properties of L. albus and L. angustifolius.
Traditionally, L. albus are larger in size, volume, and weight than the L. angustifolius species, as can be seen in Figure 1 and Table 1. The variation in seed weight can be due to differences in gene pools, storage conditions, and other climatic and agronomical factors [49]. The seed coat thickness of both species was recorded as 0.21 mm ± 0.01. Differences in the porosity of the seed coat and thickness often have significant impacts on legume water uptake [48]. Faster hydration rates positively correlate with thinner seed coats [49]. However, no significant difference was observed between the seed coat thickness of L. albus and L. angustifolius (p > 0.05).
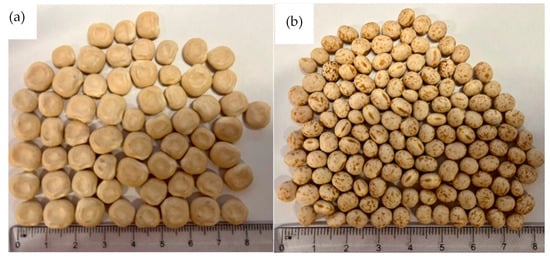
Figure 1.
External appearance of Lupins: (a) L. albus, (b) L. angustifolius.
3.2. Microstructural Characterisation of Lupin Seeds
Seed microstructures, especially the seed coat, hilum, and micropyle play vital roles in the overall hydration process. According to Garnczarska et al. [50], the hilum and micropyle are the principal openings for water uptake in lupin seeds. Microscopic images show that either species of lupins have a hair rim surrounding the hilum (Figure 2a,f). As expected, the hilum for L. albus was greater in size compared to that of L. angustifolius. Figure 2b,g present interesting pictures of the porous micropyle recorded at high magnification (2300×). Several tube shaped microchannels can be seen extending from outside of the seed all the way to the inside. There is a high likelihood that these structures are the ones responsible for the capillary transfer of water inside the seed during hydration. The outer surfaces of the seed coats of both species are shown in Figure 2c,h. Although the seed coat might appear smooth to the naked eye, a closer look employing SEM images revealed different ornamental characteristics for each species. For L. albus the structure looked like a series of various ridges arranged haphazardly, closely resembling satellite images of a mountainous terrain, while, L. angustifolius had plateau-like shapes with flat tops.
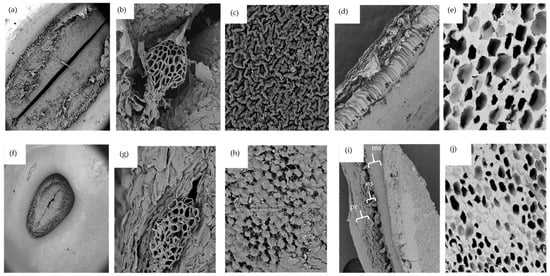
Figure 2.
SEM micrographs of L. albus: (a) hilum (mag 175×), (b) micropyle (mag 2300×), (c) external surface of the seed coat (mag 3500×), (d) transversal cut of seed coat (mag 500×), (e) transversal cut of cotyledon (mag 1000×). SEM micrographs of L. angustifolius: (f) hilum (mag 175×), (g) micropyle (mag 2300×), (h) external surface of the seed coat (mag 3500×), (i) transversal cut of seed coat (mag 500×), (j) transversal cut of cotyledon (mag 1000×). Acceleration voltage 10 kV; ms: macrosclereids, os: osteosclereids, pr: paranchyma.
Imaging the seed coat cross-section revealed that both species have similar tissue sequences. As can be seen in Figure 2d,i, there are three main cell layers in the lupin seed coat, just like other legumes. The external layer is palisade tissue made up of dried cells and having different hydrophobic substances such as lignin polysaccharides, pectin, suberin, cutin, calose, phenols, and quinones [27,51]. The surface of this layer has an abundance of cuticle compounds of wax that restrict moisture permeability to the grains. It could be the principal cause of the initial resistance to water intake. The second layer is composed of bone-shaped osteosclerosis cells with large intercellular spaces. The third layer is parenchyma, which is made up of several flat layers and is significantly more vulnerable to moisture absorption. The water that flows in through the hilum and micropyle first comes into contact with the parenchyma layer at the cotyledon–hull interface [41,51]. Similar structural arrangements were reported for carioca beans [52].
Both lupin species had similar cotyledon structures, as shown in Figure 2e,j. The cotyledons were highly porous with no starch granular structures, possibly due to the very low amount of starch present in lupin seeds. The cotyledon structures of lupin were very different from those reported for chickpea, faba bean, field peas, and lentils by Jeganathan et al. [53]. In these images, large starch granules imbedded in the protein matrix and jutting out of cell block lets were observed. Morphological analysis conducted on pea, common beans, lentils, and chickpea flour [54] also produced similar results. Lupin cotyledon structures are unique in this regard.
3.3. Hydration Kinetics and Modelling
Determination of hydration behaviour is an important consideration for legume processing. The two most common seed grain hydration behaviours are the downward curve shape (DCS) and sigmoidal [28,40]. The former is commonly observed for cereal grains and the latter for pulses. Both lupin species exhibited sigmoidal hydration behaviour, as exhibited in Figure 3. Similar results were reported for common beans [39], navy beans [42], and mung beans [27]. The outer hull layer restricts the rapid moisture migration into the seeds, resulting in a lag phase, and leads to sigmoidal hydration behaviour. Miano and co-workers suggested that during the lag phase, mass transfer takes place through the hilum and micropyle. Once sufficient water is absorbed by the grain, the outer hull layer gradually transitions from the glassy to the rubbery state and allows for rapid moisture uptake [27,39].
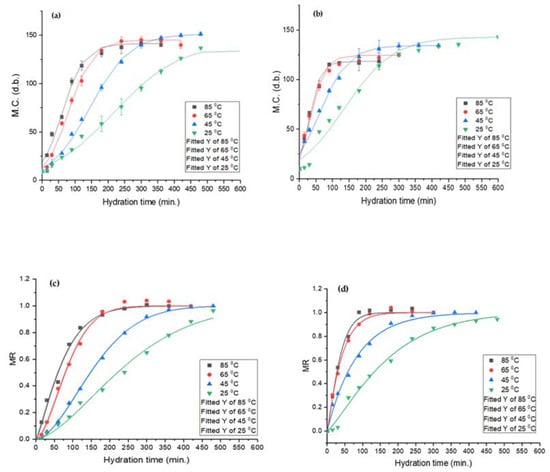
Figure 3.
Sigmoidal model (top) and Weibull distribution model (bottom) for L. albus (a,c) and L. angustifolius (b,d).
The equilibrium moisture content (EMC) is the measure of maximum moisture a seed can hold upon reaching equilibrium with the surroundings [52]. Temperature greatly affected EMC and the hydration time. For L. albus, an initial increase in temperature resulted in higher EMC; however, any further increase caused a reduction in EMC. Likewise, for L. angustifolius, an increase in temperature caused a decrease in EMC. The initial increase in EMC for L. albus may be due to the expansion of intercellular spaces and pores at medium temperatures, but at elevated temperatures high soluble solid loss may have led to a reduction in EMC [55]. The reduction in EMC may also attributed to the denaturation of the lupin protein matrix, which can decrease the numbers of water bonding site, effectively reducing the equilibrium moisture content.
3.3.1. Fickian Diffusion Model
Table 2 shows the parameter estimates for Fick’s model. It was observed that at high temperatures, the model showed good fit; however, at lower and moderate temperatures, the fit was not satisfactory. Fick’s law of diffusion makes various assumptions that do not exist in physical reality and may be the possible cause for such observations [41,42]. For instance, according to Fick’s law of diffusion, the only mode of mass transfer is diffusion, while in practice, capillary mass transfer, vapor pressure difference, and several other factors are involved in mass transfer. Similarly, uniform heat and mass transfer and isotropy are unattainable constraints. Despite these limitations, Fick’s law provides good estimates of mass transfer rates and is widely used across the food industry.
Table 2.
Parameter estimates of the Fick model and thermodynamic properties.
Deff indicates the combined effect of all modes of mass transfer but does not provide much mechanistic insights into the phenomena. Deff values for L. albus and L. angustifolius were in the range 7.41 × 10⁻¹¹ to 2.08 × 10⁻¹⁰ m2/s and 1.75 × 10⁻⁹ to 1.02 × 10⁻⁹ m2/s, respectively. The rate of moisture uptake was higher for L. angustifolius. Higher mass transfer rates in L. angustifolius may be due to the smaller size and higher effective surface area. The high fat content in L. albus may also inhibit faster moisture uptake, hence lowering the Deff value [52]. Moreover, Figure 2g,h highlight the structural difference in the seed coat composition of both lupin species, which may lead to the difference in the Deff. Wang and co-workers reported on similar lines for four different soybean varieties, where the compositional differences in the seed coat caused differences in hydration rates [56]. The hydration temperature had a direct effect on the Deff of both lupin species, and an increase in temperature increased the Deff. High temperatures impart higher kinetic energy to the water molecules, which can increase intermolecular collision and help in faster water absorption [57]. Moreover, high hydration temperature can trigger cell wall deterioration due to the depolymerisation of cellulose and pectin. This can cause development of cracks on the seed coat and can facilitate faster mass transfer [58].
The activation energy (Ea) values of L. angustifolius and L. albus were 25.52 kJ/mol and 16.00 kJ/mol, respectively (Table 2). The values were estimated using an Arrhenius type equation with a significantly high fit between the experimental and estimated data, i.e., (>0.90). A high Ea for L. angustifolius indicated that the energy requirement to initiate the hydration process for this was higher compared to the L. albus. A high Ea also signified that the Deff for L. angustifolius had high thermal sensitivity, and that a slight change in temperature can cause large changes in the Deff values [59]. A pre-exponential factor signifies the collision rates between molecules. With an increase in temperature, an increase in the pre-exponential factor of both lupin species was observed, indicating that temperature increases accelerated the molecular collision rates and facilitated faster formation of the activated complexes [59].
3.3.2. Peleg’s Model
Table 3 shows the estimated values of parameters obtained after non-linear regression analysis. The Peleg model exhibited the least fit with R2 values of 0.94–0.98 and 0.94–0.99, reduced ϰ2 values of 11.33–145.34 and 9.84–32.31, and RMSE values of 9.66–15.87 and 5.47–11.54 for L. albus and L. angustifolius, respectively. High reduced ϰ2 and RMSE values signified high residuals and a lack of fit, which may be due to the simplistic nature of the equation and non-consideration of hydration lag phenomena, which was evident for lupin hydration. The parameter k1 indicates the rate of hydration; a high k1 value indicates lower mass transfer and vice versa. The k1 value was found to be higher for L. albus compared to L. angustifolius, implying a higher rate of mass transfer in the latter variety. In addition, as the hydration temperature increased, the k1 values decreased. The parameter k2 indicates the EMC characteristics, and an increase in its value signifies a lowering of the EMC and vice versa. For L. albus, at medium temperatures (up to 65 °C), the k2 value was lower compared to values at 25 °C; however, at high temperatures (85 °C), the k2 value was higher. For L. angustifolius, the values started increasing with temperature. These conflicting results outline the complex nature of the hydration process, which depends on various intrinsic and extrinsic factors.
Table 3.
Complied model data.
3.3.3. Sigmoidal Model
The sigmoidal model performed fairly well in terms of predicting the lupin hydration behaviour model with R2 > 0.97, reduced ϰ2 < 71.63, and RMSE < 7.78. The value of k and τ decreased with an increase in hydration temperature. Elevated temperatures caused a many-fold reduction in the τ value, meaning a decrease in the lag phase time. As outlined in previous sections, this may be due to pectin and cellulosic depolymerisation, leading to the development of fractures in the seed coat [58]. Moreover, higher temperatures accelerate the moisture uptake by the seeds and decrease the resistance to moisture influx, which may lead to reductions in the lag phase [26,60]. Similar observations were reported for mung bean [27], adzuki bean [26], and cowpea [60].
3.3.4. Weibull Distribution Model
The Weibull distribution model predicted the hydration characteristics of both lupin species with distinctively highest accuracy, i.e., R2 > 0.99, reduced ϰ2~0, and RMSE < 0.03 for all the observations across the temperature range. The α value is inversely proportional to the rate of mass transfer. As shown in Table 3, α and β values for both lupin species decreased at higher temperatures, implying higher mass transfer rates at elevated temperatures.
3.4. Thermodynamic Properties
Table 2 displays the thermodynamic properties of both L. albus and L. angustifolius hydration processes. The lupin hydration process was analysed employing the transition state theory. Thermodynamic properties of the hydration process were estimated to develop insights into the nature of reactions taking place during the hydration process. Effective diffusivity was considered as the rate parameter for all the calculations. The enthalpy of activation (ΔH) for both lupin species was positive, implying that the reaction was endothermic during the formation of the activated complex. L. albus had lower values of activation enthalpy, indicating that the energy requirement for excitation of L. albus from the ground to the transition state was lower than that of L. angustifolius. It is noteworthy that even though the rate of hydration was lower for L. albus, thermodynamic analysis revealed that it is easier to hydrate with lower thermal energy consumption. Likewise, a higher temperature caused a reduction in the ΔH values, indicating that at elevated temperatures, activated complexes can be formed with lower energy requirements. This is natural, as at high temperatures, the kinetic energy in the system is higher, so molecules have high mobility and frequent collisions [59,61].
Entropy of activation (ΔS) values for both lupin varieties had negative signs, signifying an organised molecular structure with limited degrees of freedom [59,61]. As two reactant species, i.e., lupin seed and water in our case, collide with each other to form an activated complex, they undergo orientational distortion, resulting in a change in molecular bond angles and intermolecular distances. Finally, the two species aggregate to form one complex, which naturally restricts its rotation and translation [39,43]. Similar observations were reported for the hydration of soybean [62], common bean [39], and faba beans [63]. As can be seen in Table 2, L. angustifolius had lower ΔS values, signifying higher molecular ordering.
Gibbs free energy (ΔG) values were observed to be positive for both lupin species and indicated that the process is non-spontaneous. Similar to our observation, Borges et al. [62] reported non-spontaneity for soybean hydration and suggested that ΔG can also be a measure of the driving force dictating the hydration process. Miano et al. [39] also observed similar trends for the hydration of common beans. The thermodynamic properties outline that the hydration temperature plays a minimal role in activated complex formation and molecular structuring during the hydration process. Factors such as composition and morphology of a seed have more pronounced effects on their thermodynamic properties.
3.5. Changes in Hardness during Hydration
Grain hardness is an important factor that influences the processability and palatability of grains. Figure 4a,b demonstrate hardness for both species, i.e., L. albus and L. angustifolius, as a function of time and its temperature dependence. We observed that L. albus had higher initial hardness (55.54 N) compared to L. angustifolius (34.94 N), which can be due to the difference in gene pools, sizes of the seeds, storage conditions, and agronomic factors [64]. As expected, a significant reduction in lupin hardness was seen with an increase in the hydration temperature. For instance, the hardness of EMC for L. albus hydrated at 25 °C was 2.15 N, which decreased to 0.59 N as the hydration temperature was elevated to 85 °C. Similarly, for L. angustifolius, the hardness decreased from 2.34 N to 1.87 N upon increasing the temperature from 25 to 85 °C. This can be further confirmed by considering the diffusivity values. At a high temperature (85 °C) Deff was significantly higher than at a low temperature (25 °C) in both lupin species, which explains the higher moisture transfer during hydration that caused seed softening. Moreover, structural differences in the seed coat of both lupin species may lead to differences in the hardness. Wang et al. [56] reported similar results for four different varieties of soybeans. Likewise, other leguminous seeds such as adzuki beans [65] and cowpeas [55] exhibited softening upon hydration and with an increase in temperature. Possibly, these changes are due to pectin degradation, which in turn dilutes the intercellular layer and cell wall polysaccharides and results in weaker structural integrity [66].
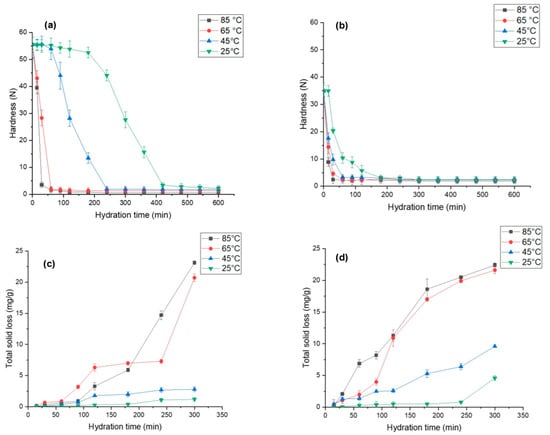
Figure 4.
Changes in hardness and total solid loss for (a,c) L. albus and (b,d) L. angustifolius during hydration at different temperature.
It is interesting to note that the change in grain hardness did not follow a linear trend, as can be clearly seen Figure 4a,b. Corelating the hardness kinetics with the hydration kinetics graph (Figure 2), it was revealed that during the lag phase of hydration, the harness plateaued and did not change much. After the lag phase, once the mass transfer rate increased, the hardness values dropped exponentially. This trend was the same for both the species and the temperature conditions. High hydration rates are indictive of high-water uptake in the lupin grains, which can render them soft and a cause of such observations. As seen in Figure 4a,b, hardness values were close at different hydration values at 85 °C and 65 °C. Therefore, it is plausible to conclude that hydration at 65 °C for less than 200 min is best for obtaining the optimum desired texture of lupin seeds.
3.6. Total Solid Loss during Hydration
Hydration at elevated temperatures destroys most of the thermolabile phytonutrients and accelerates leaching of phytochemicals, soluble solids, and prebiotic fibres into the hydration media [46,58]. Therefore, it is critical to understand the leaching behaviour of these components at different time points. Figure 4c,d illustrate the solid loss during hydration at different temperatures for both lupin species. The results show that L. angustifolius has significantly higher solid leaching than L. albus at all temperatures. This may be due to the small seed size, high surface area, seed coat surface, and internal structure of L. angustifolius [49,64]. At the end of hydration, for L. angustifolius the total solid loss was recorded as 22 mg/g at 85 °C and 9.6 mg/g at 45 °C. However, for L. albus it was recorded as 20 mg/g and 3.5 mg/g at 85 °C and 45 °C, respectively.
Much like hardness, total solid loss also did not follow a linear trend, and the high rates of loss were recorded at elevated temperatures, possibly because at elevated temperatures the structural integrity of cotyledons was affected, as has been elucidated in the preceding section, consequently increasing the mass transfer of intracellular components from legumes to the hydration media [26,29]. For cowpeas, Coffigniez et al. [58] observed a 10-fold increase in dry matter loss as the hydration temperature was increased from 20 to 95 °C. The authors linked this observation to the depolymerisation of cell wall polysaccharides triggered by high temperatures. It is also important to point out that at the beginning of the hydration process, solid loss showed very low temperature dependence (Figure 4c,d). This is evidenced by the fact that up to 50 min, the solid loss values for all the samples were comparable. However, as hydration progressed, solid loss behaviour became increasingly temperature dependent. There was a strong link between the destruction of the cell that is enhanced by high temperatures (85 °C) and molecular mass transfer through the intercellular spaces. Based on our findings comparing solid loss values at 85 °C and 65 °C, it is safe to conclude that hydration at 65 °C for less than 200 min is best for hydration.
3.7. Total Phenolics and Anthocyanin Loss during Hydration
Figure 5 show the extent of total phenolic and anthocyanin leaching during hydration of both lupin species. The total polyphenols content (TPC) in raw L. albus and L. angustifolius was 48.79 mg (GAE)/100g and 79.54 mg (GAE)/100g db, respectively. Our results are close to the TPC values reported for lupins, i.e., from 57 mg (GAE)/100g db to 93.2 mg (GAE)/100g db, by several researchers [2,8,9]. For both lupin species, we observed that high hydration temperature significantly accelerated phenolic content leaching out into the hydration water, while low temperatures hardly had any effect on the same. As seen in Figure 5a,b, TPC losses after 100 min of hydration at 85 °C and 65 °C were recorded as 60% and 50% (db) for L. albus and 25% and 8% (db) for L. angustifolius, respectively. On the other hand, anthocyanin in L. angustifolius seemed more sensitive to hydration time compared to the L. albus (Figure 5c,d). For L. albus, temperature did not exhibit any discernible effects, except at 25 °C. However, for L. angustifolius, loss of anthocyanin increased significantly with increases in temperature from 25 °C to 85 °C. This was due to the seed coat composition of both species. L. angustifolius seeds have colourful patches on the seed coat, which contains anthocyanin, whereas the seed coat of L. albus is plain yellowish in colour. The anthocyanin content of seeds truly reflected the seed coat colour [67]. Anthocyanin losses of L. angustifolius at 85 °C and 65 °C after 100 min of hydration were reported as 38% and 41%, respectively (Figure 5d). However, any further increase did not increase the anthocyanin loss drastically. During hydration of legumes, it is important to minimise the loss of phytochemicals such as phenols and anthocyanins. Based on our results, hydration at 65 °C for less than 100 min is a feasible temperature to preserve most of the phenols and anthocyanins with compared with 85 °C.
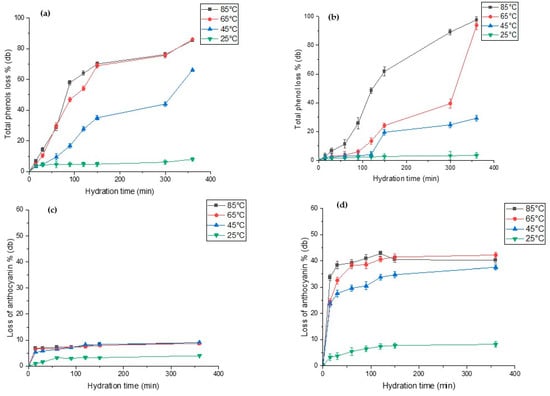
Figure 5.
Total phenolic content (%) and total anthocyanin content (%) of hydration of water during hydration at four different temperatures for (a,c) L. albus and (b,d) L. angustifolius.
3.8. Oligosaccharide and Soluble Fibre Loss during Hydration
Raffinose family oligosaccharides (RFOs) are prevalent in legumes and serve as carbon reserves [68]. During the seed development process, RFOs accumulate in legumes and participate and regulate several metabolic activities [69]. Traditionally, these soluble fibres are difficult to digest by intestinal enzymes and are associated with causing flatulence [68]. However, recent research work suggests that probiotic bacteria such as Bifidobacterium can utilise oligosaccharides to convert them into short-chain fatty acids, which can have beneficial effects on human health [70,71]. The effect of hydration parameters on the leaching behaviour of three major RFOs, i.e., raffinose, stachyose, and verbascose, is shown in Figure 6. For L. albus, it was observed that the loss of raffinose (Figure 6a) and stachyose (Figure 6c) increased by almost 25 times, whereas verbascose loss (Figure 6b) increased by 20 times as a result of temperature increases from 25 °C to 85 °C. However, in L. angustifolius, for the same increase in temperature, the loss of raffinose (Figure 6d), verbascose (Figure 6e), and stachyose (Figure 6f) increased by 10-fold, 70-fold, and 80-fold, respectively. These results agree with the hydration kinetic trends outlined in previous sections. Higher Deff for L. angustifolius may have resulted in higher RFOs loss. Likewise, hydration above 65 °C exponentially increased the loss of RFO in both lupins. For 25 °C and 45 °C, most of the RFOs were preserved within the grain. High temperatures accelerated the mass diffusivity, which may have increased the oligosaccharide leaching out. Matella et al. [72] reported that same hydration temperature can have differential effects on different beans. Furthermore, they identified that high temperature reduces the raffinose and stachyose content in black, red, and navy beans. More recently, Devkota et al. [46] observed similar results after thermal treatment of common beans. Even though hydration at 45 °C and 25 °C preserved most of the phytochemicals and probiotic fibre and maximised the EMC, it is not feasible to hydrate at low temperatures (<45 °C) from an industry point of view. However, based on our findings, it is safe to conclude that hydration at 65 °C for 200 min is the best time temperature combination to hydrate the lupin compared to the nutrient loss at 85 °C.
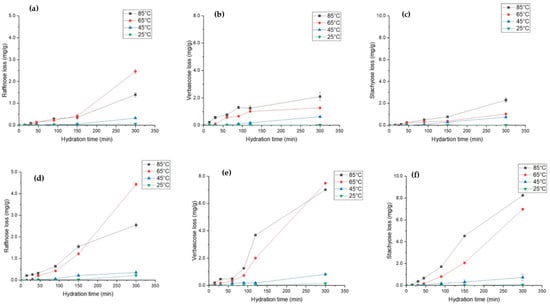
Figure 6.
Soluble fibre loss during hydration of L. albus at four different temperatures, namely, (a) raffinose loss (b), verbascose loss, and (c) stachyose loss, and for L. angustifolius, (d) raffinose loss, (e) verbascose loss, and (f) stachyose loss.
The lupin hydration water generated at 85 °C and 65 °C was rich in polyphenols, anthocyanin, and prebiotic fibre. Several research studies indicate the beneficial effects of hydration water and associate its consumption with the prevention of diseases. On the contrary, several researchers suggest that soaking water be removed in order to remove antinutritional substances that may leach during hydration and cause more harm than benefit. It appears to be advantageous not to throw away the soaking water; however, we do not endorse its consumption, as further studies are needed to establish its effects on human health.
4. Conclusions
Physical, microstructural, and hydration properties of lupin vary significantly based on the varietal differences and hydration temperatures. The study suggests that although high hydration temperatures can accelerate the mass diffusivity, they can have deleterious effect on phytochemicals and dietary fibre content. It was found that high temperatures reduced the equilibrium moisture content and increased the total solid loss and loss of oligosaccharides in both lupin species due to the depolymerization of cell wall polysaccharides. L. albus was found to be harder than L. angustifolius; however, after hydration, the loss of hardness was higher in L. albus. The hardness and solid losses were very closely related to the hydration kinetics.
The Weibull distribution model was found to best represent the lupin hydration behaviour with high accuracy (R2 > 0.99). Thermodynamic analysis revealed that increasing the temperature also increased the orderliness in the system and reduced the activation enthalpy. The Gibb’s free energy and activation enthalpy values indicated that the lupin hydration process was non-spontaneous and endothermic in nature. Based on our findings, the best time–temperature combination was identified as 200 min at 65 °C, since at these conditions the Deff values were moderately higher and the bioactive retention was better. These findings are relevant for developing a mechanistic understanding of the hydration process and designing the hydration process for L. albus and L. angustifolius to achieve the maximum equilibrium moisture content and yield with minimal loss of solids (phytochemicals and prebiotic fibres).
Author Contributions
D.P. and G.K.: Conceptualisation, methodology, investigation, formal analysis, writing—original draft, writing—review and editing. L.D. and S.D.: Supervision, conceptualisation, methodology, writing—review and editing. All authors have read and agreed to the published version of the manuscript.
Funding
This work was supported by an Australian Research Council Linkage grant LP210200616.
Institutional Review Board Statement
Not applicable.
Informed Consent Statement
Not applicable.
Data Availability Statement
The data presented in this study are available on request from the corresponding author.
Acknowledgments
The authors gratefully acknowledge the support of a Monash University Research Training Scholarship. We also thank Caleb Hill, Production & Logistics Manager, Seednet, Horsham VIC 3400, Australia, for providing the lupin seeds.
Conflicts of Interest
The authors declare no conflict of interest.
References
- Johnson, S.K.; Clements, J.; Villarino, C.B.J.; Coorey, R. Lupins: Their Unique Nutritional and Health-Promoting Attributes. In Gluten-Free Ancient Grains; Woodhead Publishing Series in Food Science, Technology and Nutrition; Woodhead Publishing: Sawston, UK, 2017; pp. 179–221. [Google Scholar] [CrossRef]
- Khan, M.K.; Karnpanit, W.; Nasar-Abbas, S.M.; Huma, Z.; Jayasena, V. Phytochemical composition and bioactivities of lupin: A review. Int. J. Food Sci. Technol. 2015, 50, 2004–2012. [Google Scholar] [CrossRef]
- Foley, R.C.; Jimenez-Lopez, J.C.; Kamphuis, L.G.; Hane, J.K.; Melser, S.; Singh, K.B. Analysis of conglutin seed storage proteins across lupin species using transcriptomic, protein and comparative genomic approaches. BMC Plant Biol. 2015, 15, 106. [Google Scholar] [CrossRef]
- Sweetingham, M.; Kingwell, A.R. Lupins—Reflections and futurea possibilities. In Proceedings of the 12th International Lupin Conference, Canterbury, New Zealand, 14–18 September 2008. [Google Scholar]
- Janusz, P. White lupin (Lupinus albus L.)—Nutritional and health values in human nutrition—A review. Czech J. Food Sci. 2017, 35, 95–105. [Google Scholar] [CrossRef]
- Shrestha, S.; Hag, L.V.T.; Haritos, V.S.; Dhital, S. Lupin proteins: Structure, isolation and application. Trends Food Sci. Technol. 2021, 116, 928–939. [Google Scholar] [CrossRef]
- van de Noort, M. Lupin. In Sustainable Protein Sources; Academic Press: Cambridge, MA, USA, 2017; pp. 165–183. [Google Scholar]
- Siger, A.; Czubinski, J.; Kachlicki, P.; Dwiecki, K.; Lampart-Szczapa, E.; Nogala-Kalucka, M. Antioxidant activity and phenolic content in three lupin species. J. Food Compos. Anal. 2012, 25, 190–197. [Google Scholar] [CrossRef]
- Karamac, M.; Orak, H.H.; Amarowicz, R.; Orak, A.; Piekoszewski, W. Phenolic contents and antioxidant capacities of wild and cultivated white lupin (Lupinus albus L.) seeds. Food Chem. 2018, 258, 1–7. [Google Scholar] [CrossRef]
- Trugo, L.C.; von Baer, E.; von Baer, D. Lupin: Breeding. In Encyclopedia of Food Grains; Elsevier Science: Amsterdam, The Netherlands, 2016; pp. 325–332. [Google Scholar]
- Resta, D.; Boschin, G.; D’Agostina, A.; Arnoldi, A. Evaluation of total quinolizidine alkaloids content in lupin flours, lupin-based ingredients, and foods. Mol. Nutr. Food Res. 2008, 52, 490–495. [Google Scholar] [CrossRef] [PubMed]
- Annicchiarico, P.; Manunza, P.; Arnoldi, A.; Boschin, G. Quality of Lupinus albus L. (white lupin) seed: Extent of genotypic and environmental effects. J. Agric. Food Chem. 2014, 62, 6539–6545. [Google Scholar] [CrossRef] [PubMed]
- Frick, K.M.; Kamphuis, L.G.; Siddique, K.H.; Singh, K.B.; Foley, R.C. Quinolizidine Alkaloid Biosynthesis in Lupins and Prospects for Grain Quality Improvement. Front. Plant Sci. 2017, 8, 87. [Google Scholar] [CrossRef] [PubMed]
- Villarino, C.B.; Jayasena, V.; Coorey, R.; Chakrabarti-Bell, S.; Johnson, S.K. Nutritional, Health, and Technological Functionality of Lupin Flour Addition to Bread and Other Baked Products: Benefits and Challenges. Crit. Rev. Food Sci. Nutr. 2016, 56, 835–857. [Google Scholar] [CrossRef]
- Lima-Cabello, E.; Morales-Santana, S.; Leon, J.; Alche, V.; Clemente, A.; Alche, J.D.; Jimenez-Lopez, J.C. Narrow-leafed lupin (Lupinus angustifolius L.) seed beta-conglutins reverse the induced insulin resistance in pancreatic cells. Food Funct. 2018, 9, 5176–5188. [Google Scholar] [CrossRef]
- Santos-Sanchez, G.; Cruz-Chamorro, I.; Bollati, C.; Bartolomei, M.; Pedroche, J.; Millán, F.; del Carmen Millán-Linares, M.; Capriotti, A.L.; Cerrato, A.; Laganà, A. A Lupinus angustifolius protein hydrolysate exerts hypocholesterolemic effects in Western diet-fed ApoE−/− mice through the modulation of LDLR and PCSK9 pathways. Food Funct. 2022, 13, 4158–4170. [Google Scholar] [CrossRef]
- Kaczmarska, K.T.; Chandra-Hioe, M.V.; Frank, D.; Arcot, J. Enhancing wheat muffin aroma through addition of germinated and fermented Australian sweet lupin (Lupinus angustifolius L.) and soybean (Glycine max L.) flour. LWT-Food Sci. Technol. 2018, 96, 205–214. [Google Scholar] [CrossRef]
- Jayasena, V.; Leung, P.P.Y.; Nasar-Abbas, S.M. Effect of Lupin Flour Substitution on the Quality and Sensory Acceptability of Instant Noodles. J. Food Qual. 2010, 33, 709–727. [Google Scholar] [CrossRef]
- Mahmoud, E.A.M.; Nassef, S.L.; Basuny, A.M.M. Production of high protein quality noodles using wheat flour fortified with different protein products from lupine. Ann. Agric. Sci. 2012, 57, 105–112. [Google Scholar] [CrossRef]
- Jayasena, V.; Nasar-Abbas, S.M. Development and Quality Evaluation of High-Protein and High-Dietary-Fiber Pasta Using Lupin Flour. J. Texture Stud. 2012, 43, 153–163. [Google Scholar] [CrossRef]
- Aiello, G.; Li, Y.; Boschin, G.; Stanziale, M.; Lammi, C.; Arnoldi, A. Analysis of Narrow-Leaf Lupin Proteins in Lupin-Enriched Pasta by Untargeted and Targeted Mass Spectrometry. Foods 2020, 9, 1083. [Google Scholar] [CrossRef] [PubMed]
- Matella, N.J.; Mishra, D.K.; Dolan, K.D. Hydration, Blanching and Thermal Processing of Dry Beans. In Dry Beans and Pulses Production, Processing and Nutrition; Wiley Online Library: Hoboken, NJ, USA, 2012; pp. 129–154. [Google Scholar] [CrossRef]
- Wainaina, I.; Wafula, E.; Sila, D.; Kyomugasho, C.; Grauwet, T.; Van Loey, A.; Hendrickx, M. Thermal treatment of common beans (Phaseolus vulgaris L.): Factors determining cooking time and its consequences for sensory and nutritional quality. Compr. Rev. Food Sci. Food Saf. 2021, 20, 3690–3718. [Google Scholar] [CrossRef] [PubMed]
- Samtiya, M.; Aluko, R.E.; Dhewa, T. Plant food anti-nutritional factors and their reduction strategies: An overview. Food Prod. Process. Nutr. 2020, 2, 6. [Google Scholar] [CrossRef]
- Udensi, E.; Arisa, N.; Maduka, M. Effects of processing methods on the levels of some antinutritional factors in Mucuna flagellipes. Niger. Food J. 2008, 26, 2. [Google Scholar] [CrossRef]
- Oliveira, A.L.; Colnaghi, B.G.; Silva, E.Z.D.; Gouvêa, I.R.; Vieira, R.L.; Augusto, P.E.D. Modelling the effect of temperature on the hydration kinetic of adzuki beans (Vigna angularis). J. Food Eng. 2013, 118, 417–420. [Google Scholar] [CrossRef]
- Miano, A.C.; Pereira, J.D.C.; Castanha, N.; Junior, M.; Augusto, P.E.D. Enhancing mung bean hydration using the ultrasound technology: Description of mechanisms and impact on its germination and main components. Sci. Rep. 2016, 6, 38996. [Google Scholar] [CrossRef]
- Ulloa, J.A.; Enriquez Lopez, K.V.; Contreras Morales, Y.B.; Rosas Ulloa, P.; Ramírez Ramírez, J.C.; Ulloa Rangel, B.E. Effect of ultrasound treatment on the hydration kinetics and cooking times of dry beans (Phaseolus vulgaris). CyTA-J. Food 2015, 13, 588–596. [Google Scholar] [CrossRef]
- Miano, A.C.; Augusto, P.E.D. The ultrasound assisted hydration as an opportunity to incorporate nutrients into grains. Food Res. Int. 2018, 106, 928–935. [Google Scholar] [CrossRef] [PubMed]
- Smykal, P.; Coyne, C.J.; Ambrose, M.J.; Maxted, N.; Schaefer, H.; Blair, M.W.; Berger, J.; Greene, S.L.; Nelson, M.N.; Besharat, N.; et al. Legume Crops Phylogeny and Genetic Diversity for Science and Breeding. Crit. Rev. Plant Sci. 2014, 34, 43–104. [Google Scholar] [CrossRef]
- Miano, A.C.; Sabadoti, V.D.; Pereira, J.D.C.; Augusto, P.E.D. Hydration kinetics of cereal and pulses: New data and hypothesis evaluation. J. Food Process Eng. 2018, 41, e12617. [Google Scholar] [CrossRef]
- Siddiq, M.; Uebersax, M.A. Dry Beans and Pulses: Production, Processing, and Nutrition, 2nd ed.; John Wiley & Sons: Hoboken, NJ, USA, 2022; pp. 81–105. [Google Scholar]
- Aharon, S.; Hana, B.; Liel, G.; Ran, H.; Yoram, K.; Ilan, S.; Shmuel, G. Total phenolic content and antioxidant activity of chickpea (Cicer arietinum L.) as affected by soaking and cooking conditions. Food Nutr. Sci. 2011, 2011, 724–730. [Google Scholar] [CrossRef]
- Downing, D.L. A Complete Course in Canning and Related Processes: Processing Procedures for Canned Food Products, 13th ed.; Elsevier: Amsterdam, The Netherlands, 2013. [Google Scholar]
- Mishra, D.K.; Matella, N.J.; Sulaiman, R.B.; Dolan, K.D. Hydration, Blanching and Thermal Processing of Dry Beans. In Dry Beans and Pulses: Production, Processing, and Nutrition, 2nd ed.; John Wiley & Sons: Hoboken, NJ, USA, 2022; pp. 159–190. [Google Scholar] [CrossRef]
- Margier, M.; George, S.; Hafnaoui, N.; Remond, D.; Nowicki, M.; Du Chaffaut, L.; Amiot, M.J.; Reboul, E. Nutritional Composition and Bioactive Content of Legumes: Characterization of Pulses Frequently Consumed in France and Effect of the Cooking Method. Nutrients 2018, 10, 1668. [Google Scholar] [CrossRef]
- Sharanagat, V.S.; Kansal, V.; Kumar, K. Modeling the effect of temperature on the hydration kinetic whole moong grain. J. Saudi Soc. Agric. Sci. 2018, 17, 268–274. [Google Scholar] [CrossRef]
- Mohsenin, N.N. Physical Properties of Plant and Animal Materials: V. 1: Physical Characteristics and Mechanical Properties; Routledge: Abingdon-on-Thames, UK, 2020. [Google Scholar]
- Miano, A.C.; Sabadoti, V.D.; Augusto, P.E.D. Enhancing the hydration process of common beans by ultrasound and high temperatures: Impact on cooking and thermodynamic properties. J. Food Eng. 2018, 225, 53–61. [Google Scholar] [CrossRef]
- Devkota, L.; He, L.; Midgley, J.; Haritos, V.S. Effect of seed coat microstructure and lipid composition on the hydration behavior and kinetics of two red bean (Phaseolus vulgaris L.) varieties. J. Food Sci. 2022, 87, 528–542. [Google Scholar] [CrossRef] [PubMed]
- Crank, J. The Mathematics of Diffusion, 2nd ed.; Oxford University Press: Oxford, UK, 1979. [Google Scholar]
- Ghafoor, M.; Misra, N.N.; Mahadevan, K.; Tiwari, B.K. Ultrasound assisted hydration of navy beans (Phaseolus vulgaris). Ultrason. Sonochem. 2014, 21, 409–414. [Google Scholar] [CrossRef] [PubMed]
- Kalita, D.; Jain, S.; Srivastava, B.; Goud, V.V. Sono-hydro priming process (ultrasound modulated hydration): Modelling hydration kinetic during paddy germination. Ultrason. Sonochem. 2021, 70, 105321. [Google Scholar] [CrossRef] [PubMed]
- Silva, N.L.; Crispim, J.M.S.; Vieira, R.P. Kinetic and Thermodynamic Analysis of Anthocyanin Thermal Degradation in Acerola (Malpighia emarginata D.C.) Pulp. J. Food Process. Preserv. 2017, 41, e13053. [Google Scholar] [CrossRef]
- Devkota, L.; He, L.; Bittencourt, C.; Midgley, J.; Haritos, V.S. Thermal and pulsed electric field (PEF) assisted hydration of common beans. LWT—Food Sci. Technol. 2022, 158, 113163. [Google Scholar] [CrossRef]
- Devkota, L.; He, L.; Midgley, J.; Chen, Y.; Haritos, V.S. Reducing added sodium and sugar intake from processed legumes without affecting quality. LWT—Food Sci. Technol. 2021, 140, 110729. [Google Scholar] [CrossRef]
- Zeng, L.; Cocks, P.; Kailis, S.; Kuo, J. Structure of the seed coat and its relationship to seed softening in Mediterranean annual legumes. Seed Sci. Technol. 2005, 33, 351–362. [Google Scholar] [CrossRef]
- Uebersax, M.A.; Siddiq, M.; Borbi, M. Hard-to-Cook and Other Storage-Induced Quality Defects in Dry Beans. In Dry Beans and Pulses: Production, Processing, and Nutrition, 2nd ed.; John Wiley & Sons: Hoboken, NJ, USA, 2022; pp. 105–127. [Google Scholar] [CrossRef]
- Norden, N.; Daws, M.I.; Antoine, C.; Gonzalez, M.A.; Garwood, N.C.; Chave, J. The relationship between seed mass and mean time to germination for 1037 tree species across five tropical forests. Funct. Ecol. 2009, 23, 203–210. Available online: https://www.jstor.org/stable/40205519 (accessed on 1 November 2022). [CrossRef]
- Garnczarska, M.; Zalewski, T.; Kempka, M. Changes in water status and water distribution in maturing lupin seeds studied by MR imaging and NMR spectroscopy. J. Exp. Bot. 2007, 58, 3961–3969. [Google Scholar] [CrossRef]
- Wood, J.A.; Knights, E.J.; Choct, M. Morphology of Chickpea Seeds (Cicer arietinum L.): Comparison of desi and kabuli Types. Int. J. Plant Sci. 2011, 172, 632–643. [Google Scholar] [CrossRef]
- Miano, A.C.; Saldana, E.; Campestrini, L.H.; Chiorato, A.F.; Augusto, P.E.D. Correlating the properties of different carioca bean cultivars (Phaseolus vulgaris) with their hydration kinetics. Food Res. Int. 2018, 107, 182–194. [Google Scholar] [CrossRef] [PubMed]
- Jeganathan, B.; Temelli, F.; Vasanthan, T. Micromorphological and elemental characteristics of chickpea, faba bean, field pea, and lentil cotyledon topographies. Cereal Chem. 2022, 99, 380–392. [Google Scholar] [CrossRef]
- Pelgrom, P.J.M.; Boom, R.M.; Schutyser, M.A.I. Method Development to Increase Protein Enrichment during Dry Fractionation of Starch-Rich Legumes. Food Bioprocess Technol. 2015, 8, 1495–1502. [Google Scholar] [CrossRef]
- Yildirim, A. Moisture diffusivity, hardness, gelatinization temperature, and thermodynamic properties of ultrasound assisted soaking process of cowpea. J. Food Process Eng. 2021, 44, 17. [Google Scholar] [CrossRef]
- Wang, D.; Chen, G.J.; Yang, B.; Chen, X.H.; Song, J.; Kong, X.B.; Kan, J.Q. Kinetic study on soybean hydration during soaking and resulting softening kinetic during cooking. J. Food Sci. 2022, 87, 266–279. [Google Scholar] [CrossRef]
- Balbinoti, T.C.V.; Jorge, L.M.d.M.; Jorge, R.M.M. Modeling the hydration step of the rice (Oryza sativa) parboiling process. J. Food Eng. 2018, 216, 81–89. [Google Scholar] [CrossRef]
- Coffigniez, F.; Briffaz, A.; Mestres, C.; Akissoe, L.; Bohuon, P.; El Maataoui, M. Impact of soaking process on the microstructure of cowpea seeds in relation to solid losses and water absorption. Food Res. Int. 2019, 119, 268–275. [Google Scholar] [CrossRef]
- Atkins, P.; de-Paula, J. Physical Chemistry, 8th ed.; W. H. Freeman and Company: New York, NY, USA, 2006. [Google Scholar]
- Kaptso, K.G.; Njintang, Y.N.; Komnek, A.E.; Hounhouigan, J.; Scher, J.; Mbofung, C.M.F. Physical properties and rehydration kinetics of two varieties of cowpea (Vigna unguiculata) and bambara groundnuts (Voandzeia subterranea) seeds. J. Food Eng. 2008, 86, 91–99. [Google Scholar] [CrossRef]
- Bui, M.K.; Kelvin, C.F.; Le, S.; Tan, E. The Arrhenius Law—Activation Energies. Available online: https://chem.libretexts.org/Bookshelves/Physical_and_Theoretical_Chemistry_Textbook_Maps/Supplemental_Modules_(Physical_and_Theoretical_Chemistry)/Kinetics/06%3A_Modeling_Reaction_Kinetics/6.02%3A_Temperature_Dependence_of_Reaction_Rates/6.2.03%3A_The_Arrhenius_Law/6.2.3.03%3A_The_Arrhenius_Law-_Activation_Energies (accessed on 1 November 2022).
- Borges, C.W.C.; Jorge, L.M.d.M.; Jorge, R.M.M. Kinetic modeling and thermodynamic properties of soybean cultivar (BRS257) during hydration process. J. Food Process Eng. 2017, 40, e12579. [Google Scholar] [CrossRef]
- Garvin, A.; Augusto, P.E.D.; Ibarz, R.; Ibarz, A. Kinetic and thermodynamic compensation study of the hydration of faba beans (Vicia faba L.). Food Res. Int. 2019, 119, 390–397. [Google Scholar] [CrossRef]
- Sandhu, K.S.; You, F.M.; Conner, R.L.; Balasubramanian, P.M.; Hou, A. Genetic analysis and QTL mapping of the seed hardness trait in a black common bean (Phaseolus vulgaris) recombinant inbred line (RIL) population. Mol. Breed. 2018, 38, 34. [Google Scholar] [CrossRef] [PubMed]
- Yadav, U.; Singh, N.; Kaur, A.; Thakur, S. Physico-chemical, hydration, cooking, textural and pasting properties of different adzuki bean (Vigna angularis) accessions. J. Food Sci. Technol. 2018, 55, 802–810. [Google Scholar] [CrossRef] [PubMed]
- Chigwedere, C.M.; Olaoye, T.F.; Kyomugasho, C.; Jamsazzadeh Kermani, Z.; Pallares Pallares, A.; Van Loey, A.M.; Grauwet, T.; Hendrickx, M.E. Mechanistic insight into softening of Canadian wonder common beans (Phaseolus vulgaris) during cooking. Food Res. Int. 2018, 106, 522–531. [Google Scholar] [CrossRef] [PubMed]
- Oomah, B.D.; Tiger, N.; Olson, M.; Balasubramanian, P. Phenolics and antioxidative activities in narrow-leafed lupins (Lupinus angustifolius L.). Plant Foods Hum. Nutr. 2006, 61, 91–97. [Google Scholar] [CrossRef]
- Martinez-Villaluenga, C.; Frıias, J.; Vidal-Valverde, C. Raffinose family oligosaccharides and sucrose contents in 13 Spanish lupin cultivars. Food Chem. 2005, 91, 645–649. [Google Scholar] [CrossRef]
- Arunraj, R.; Skori, L.; Kumar, A.; Hickerson, N.M.N.; Shoma, N.; Samuel, M.A. Spatial regulation of alpha-galactosidase activity and its influence on raffinose family oligosaccharides during seed maturation and germination in Cicer arietinum. Plant Signal. Behav. 2020, 15, 1709707. [Google Scholar] [CrossRef]
- Ashaolu, T.J.; Ashaolu, J.O.; Adeyeye, S.A.O. Fermentation of prebiotics by human colonic microbiota in vitro and short-chain fatty acids production: A critical review. J. Appl. Microbiol. 2021, 130, 677–687. [Google Scholar] [CrossRef]
- Chen, Y.; Chang, S.K.; Zhang, Y.; Hsu, C.-Y.; Nannapaneni, R. Gut microbiota and short chain fatty acid composition as affected by legume type and processing methods as assessed by simulated in vitro digestion assays. Food Chem. 2020, 312, 126040. [Google Scholar] [CrossRef]
- Matella, N.J.; Dolan, K.D.; Stoeckle, A.W.; Bennink, M.R.; Lee, Y.S.; Uebersax, M.A. Use of Hydration, Germination, and α-Galactosidase Treatments to Reduce Oligosaccharides in Dry Beans. J. Food Sci. 2006, 70, C203–C207. [Google Scholar] [CrossRef]


Disclaimer/Publisher’s Note: The statements, opinions and data contained in all publications are solely those of the individual author(s) and contributor(s) and not of MDPI and/or the editor(s). MDPI and/or the editor(s) disclaim responsibility for any injury to people or property resulting from any ideas, methods, instructions or products referred to in the content. |
© 2023 by the authors. Licensee MDPI, Basel, Switzerland. This article is an open access article distributed under the terms and conditions of the Creative Commons Attribution (CC BY) license (https://creativecommons.org/licenses/by/4.0/).