
Recovery of Biologically Active Compounds from Stinging Nettle Leaves Part II: Processing of Exhausted Plant Material after Supercritical Fluid Extraction

 , ,
, ,  , , and
Abstract
:
1. Introduction
2. Material and Methods
2.1. Plant Material
2.2. Extraction Procedures
2.3. Total Phenolics and Flavonoids Contents
2.4. Polyphenolic Profile
2.5. Biological Activity
2.6. ANN Modeling
2.7. Statistical Analyses
3. Results and Discussion
3.1. Extraction Yield
3.2. Polyphenolic Profile and Composition of the Extracts
3.3. Biological Activity of Obtained Extracts
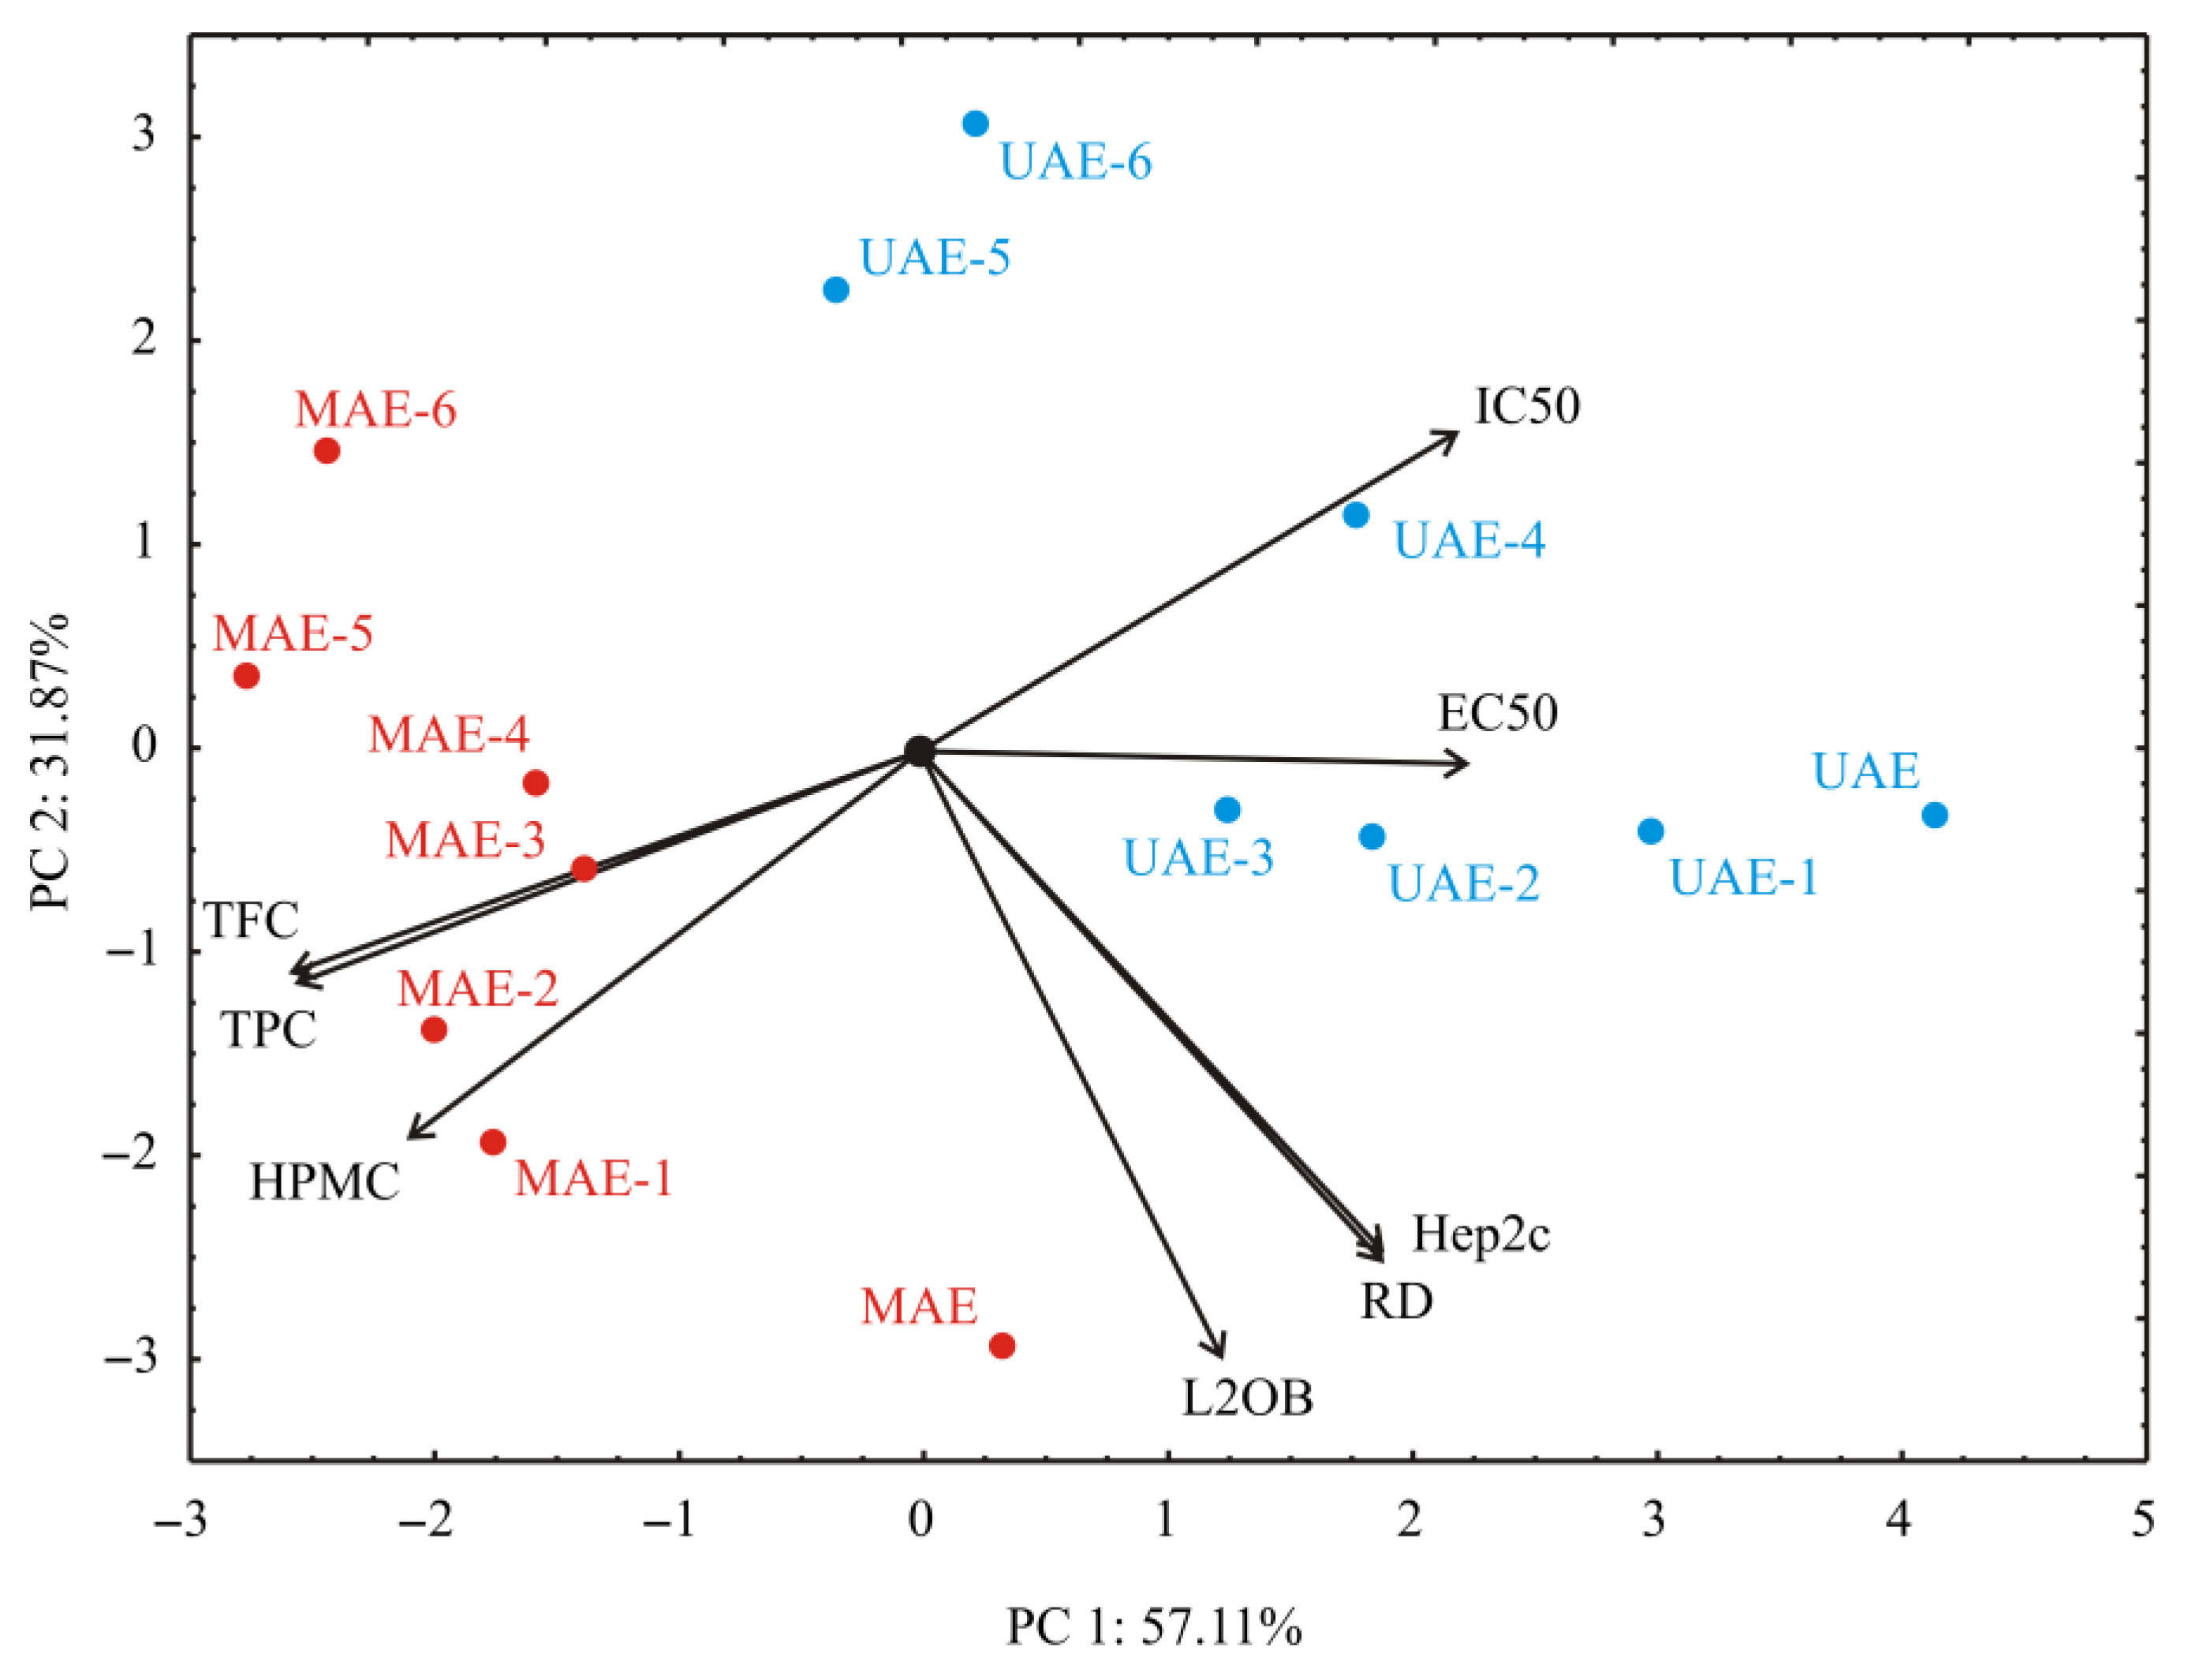
3.4. PCA Analysis
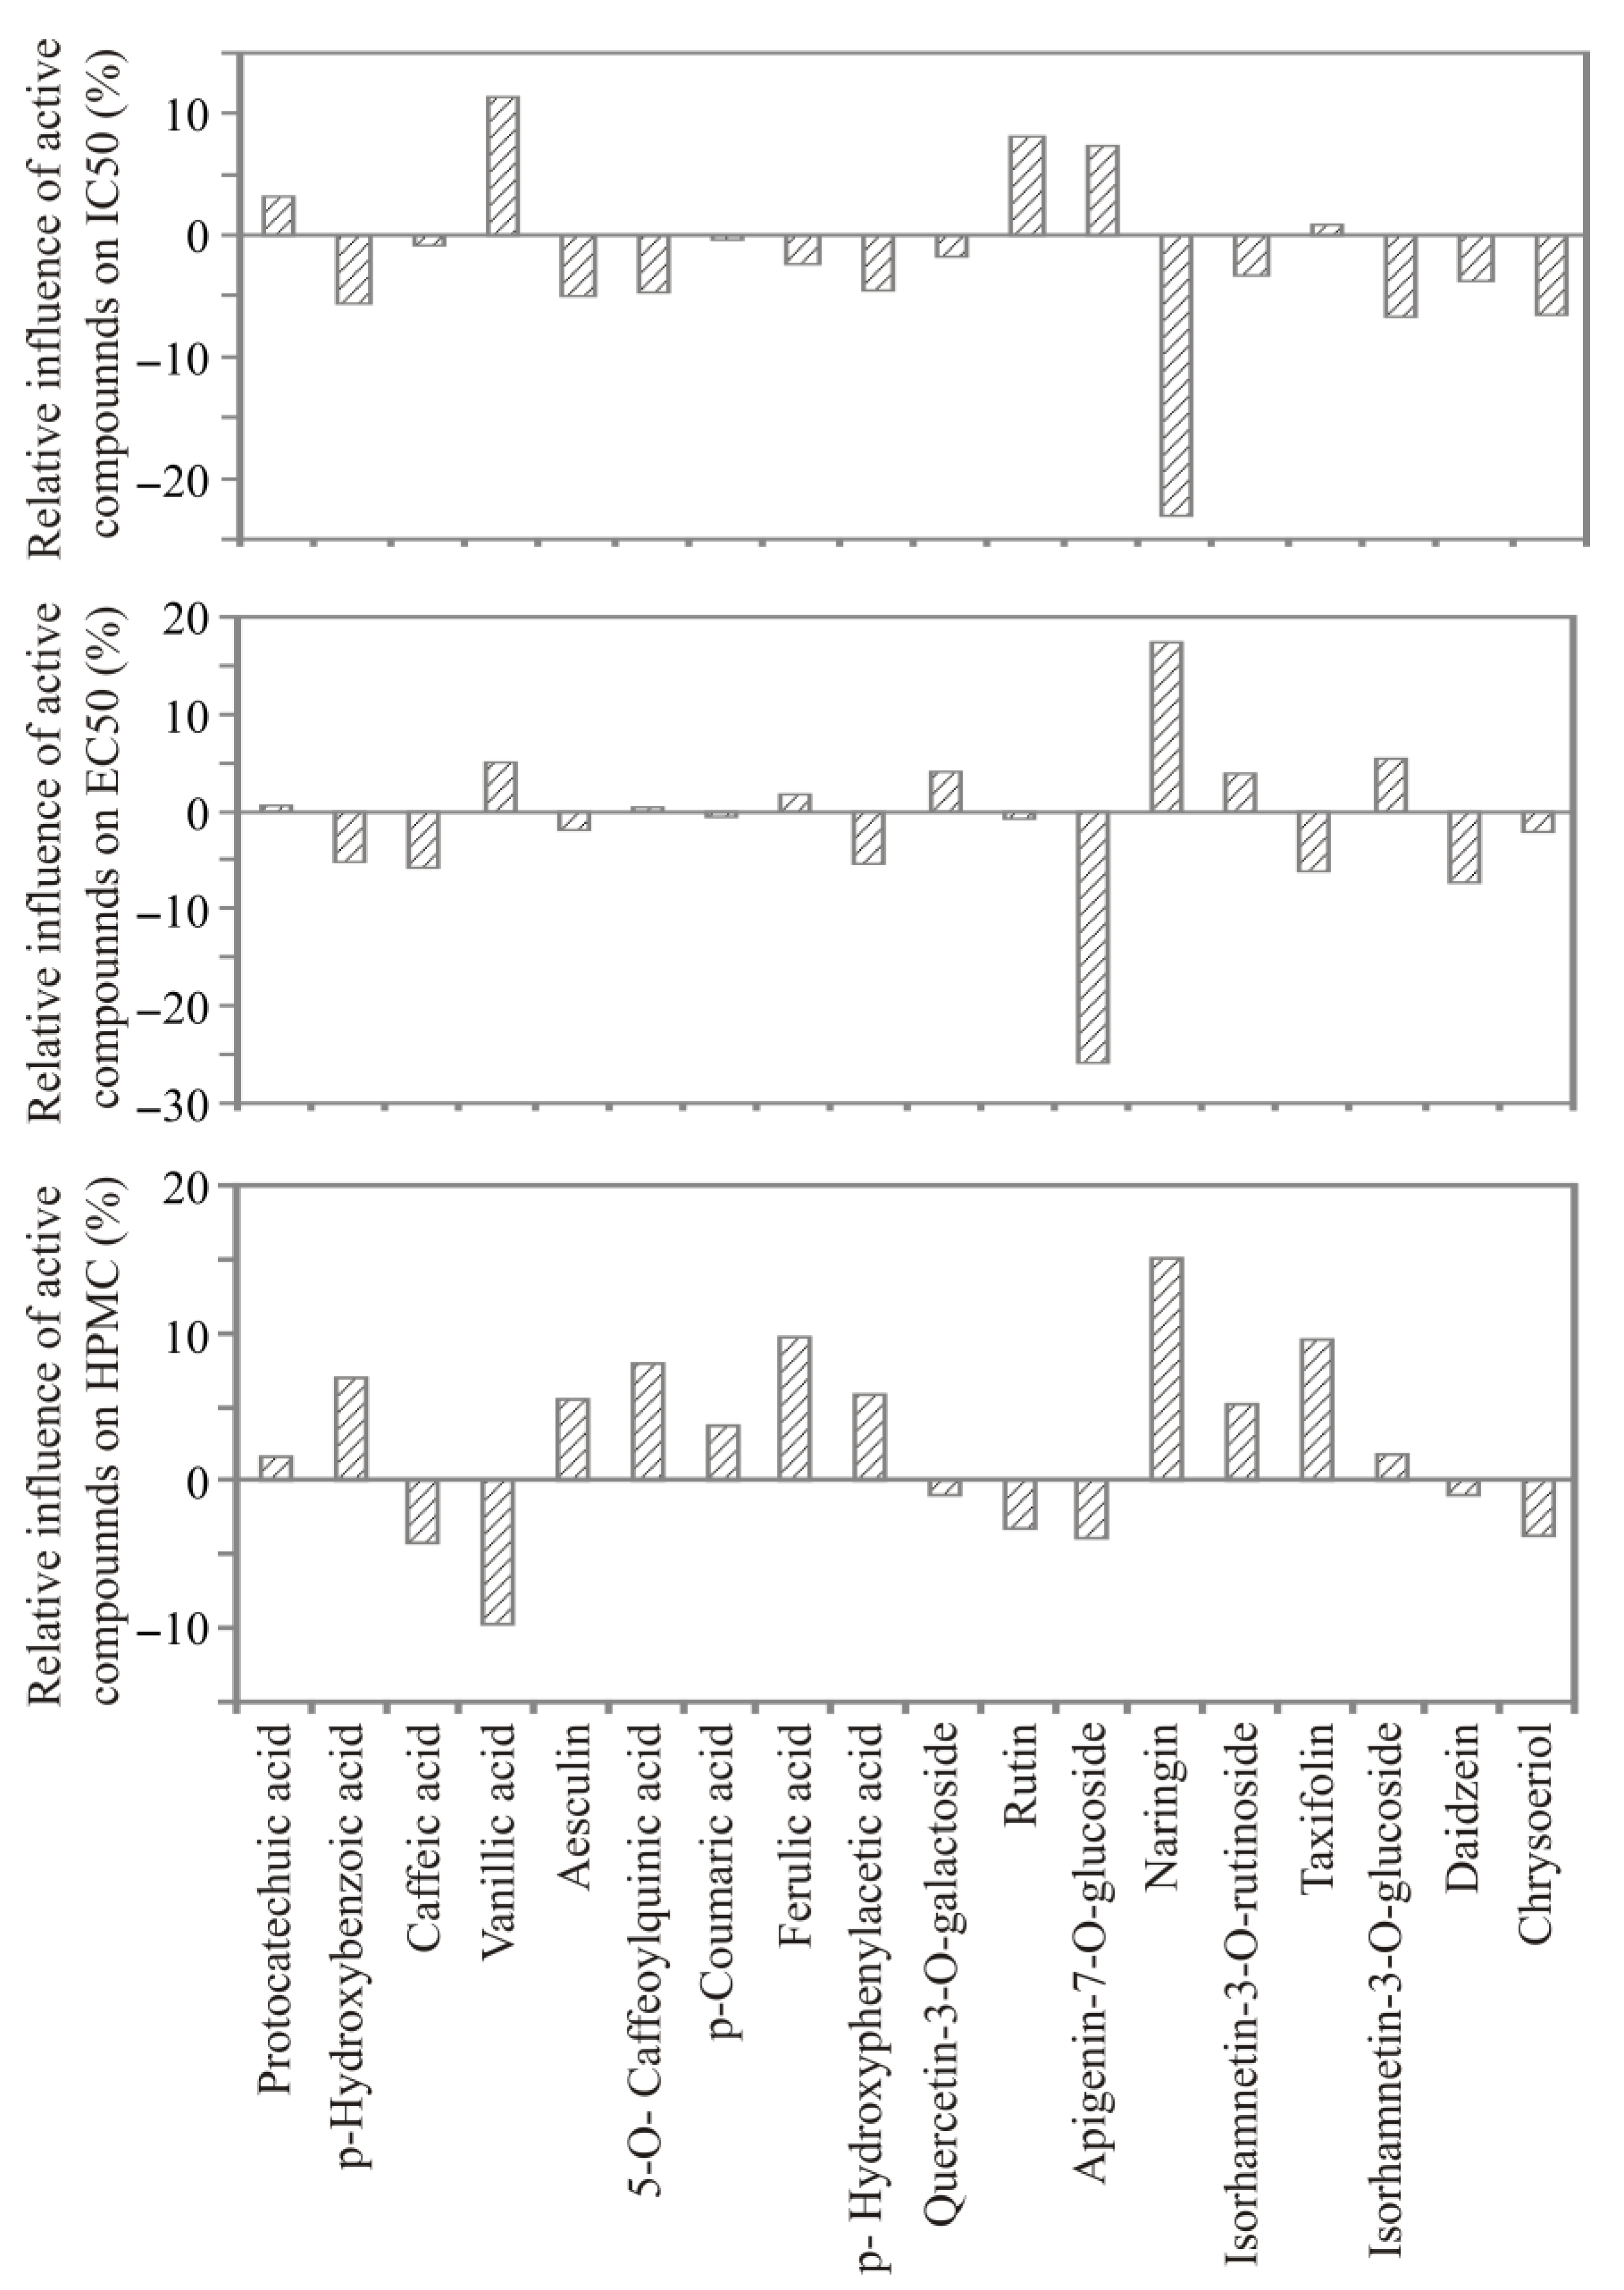
3.5. ANN Model
4. Conclusions
Supplementary Materials
Author Contributions
Funding
Data Availability Statement
Acknowledgments
Conflicts of Interest
References
- Orčić, D.; Francišković, M.; Bekvalac, K.; Svirčev, E.; Beara, I.; Lesjak, M.; Mimica-Dukić, N. Quantitative determination of plant phenolics in Urtica dioica extracts by high-performance liquid chromatography coupled with tandem mass spectrometric detection. Food Chem. 2014, 143, 48–53. [Google Scholar] [CrossRef]
- Đurović, S.; Pavlić, B.; Šorgić, S.; Popov, S.; Savić, S.; Petronijević, M.; Radojković, M.; Cvetanović, A.; Zeković, Z. Chemical composition of stinging nettle leaves obtained by different analytical approaches. J. Funct. Foods 2017, 32, 18–26. [Google Scholar] [CrossRef]
- Upton, R. Stinging nettles leaf (Urtica dioica L.): Extraordinary vegetable medicine. J. Herb. Med. 2013, 3, 9–38. [Google Scholar] [CrossRef]
- Di Virgilio, N.; Papazoglou, E.G.; Jankauskiene, Z.; Di Lonardo, S.; Praczyk, M.; Wielgusz, K. The potential of stinging nettle (Urtica dioica L.) as a crop with multiple uses. Ind. Crops Prod. 2015, 68, 42–49. [Google Scholar] [CrossRef]
- Gülçin, I.; Küfrevioǧlu, Ö.İ.; Oktay, M.; Büyükokuroǧlu, M.E. Antioxidant, antimicrobial, antiulcer and analgesic activities of nettle (Urtica dioica L.). J. Ethnopharmacol. 2004, 90, 205–215. [Google Scholar] [CrossRef]
- Zeković, Z.; Cvetanović, A.; Švarc-Gajić, J.; Gorjanović, S.; Sužnjević, D.; Mašković, P.; Savić, S.; Radojković, M.; Đurović, S. Chemical and biological screening of stinging nettle leaves extracts obtained by modern extraction techniques. Ind. Crops Prod. 2017, 108, 423–430. [Google Scholar] [CrossRef]
- Popov, S.; Skeledžija, S.; Šorgić, S.; Zeković, Z.; Micić, D.; Radulović, A.; Đurović, S. Application of Contemporary Extraction Techniques for Elements and Minerals Recovery from Stinging Nettle Leaves. Appl. Sci. 2020, 10, 793. [Google Scholar] [CrossRef]
- Sajfrtová, M.; Sovová, H.; Opletal, L.; Bártlová, M. Near-critical extraction of β-sitosterol and scopoletin from stinging nettle roots. J. Supercrit. Fluids 2005, 35, 111–118. [Google Scholar] [CrossRef]
- Đurović, S.; Šorgić, S.; Popov, S.; Radojković, M.; Zeković, Z. Isolation and GC Analysis of Fatty Acids: Study Case of Stinging Nettle Leaves. In Carboxylic Acid-Key Role in Life Sciences; Badea, G.I., Radu, G.L., Eds.; InTech: London, UK, 2018; pp. 69–83. [Google Scholar]
- Đurović, S.; Zeković, Z.; Šorgić, S.; Popov, S.; Vujanović, M.; Radojković, M. Fatty acid profile of stinging nettle leaves: Application of modern analytical procedures for sample preparation and analysis. Anal. Methods 2018, 10, 1080–1087. [Google Scholar] [CrossRef]
- Guil-Guerrero, J.; Rebolloso-Fuentes, M.; Isasa, M. Fatty acids and carotenoids from Stinging Nettle (Urtica dioica L.). J. Food Compos. Anal. 2003, 16, 111–119. [Google Scholar] [CrossRef]
- Kara, D. Evaluation of trace metal concentrations in some herbs and herbal teas by principal component analysis. Food Chem. 2009, 114, 347–354. [Google Scholar] [CrossRef]
- Kukric, Z.; Topalic-Trivunovic, L.; Kukavica, B.; Matos, S.; Pavicic, S.; Boroja, M.; Savic, A. Characterization of antioxidant and antimicrobial activities of nettle leaves (Urtica dioica L.). Acta Period. Technol. 2012, 43, 257–272. [Google Scholar] [CrossRef]
- de Cortes Sánchez-Mata, M.; Tardío, J. (Eds.) Mediterranean Wild Edible Plants; Springer: New York, NY, USA, 2016; ISBN 978-1-4939-3327-3. [Google Scholar]
- Đurović, S.; Vujanović, M.; Radojković, M.; Filipović, J.; Filipović, V.; Gašić, U.; Tešić, Ž.; Mašković, P.; Zeković, Z. The functional food production: Application of stinging nettle leaves and its extracts in the baking of a bread. Food Chem. 2020, 312, 126091. [Google Scholar] [CrossRef]
- Wang, L.; Weller, C.L. Recent advances in extraction of nutraceuticals from plants. Trends Food Sci. Technol. 2006, 17, 300–312. [Google Scholar] [CrossRef]
- Đurović, S.; Šorgić, S.; Popov, S.; Pezo, L.; Mašković, P.; Blagojević, S.; Zeković, Z. Recovery of biologically active compounds from stinging nettle leaves part I: Supercritical carbon dioxide extraction. Food Chem. 2022, 373, 131724. [Google Scholar] [CrossRef]
- Markham, K.R. Flavones, flavonoids, and their glycosides. In Methods in Plant Biochemistry; Harborne, J.B., Dey, P.M., Eds.; Academic Press Ltd.: London, UK, 1989; pp. 197–235. [Google Scholar]
- Singleton, V.L.; Rossi, J.A. Colorimetry of Total Phenolics with Phosphomolybdic-Phosphotungstic Acid Reagents. Am. J. Enol. Vitic. 1965, 16, 144–158. [Google Scholar] [CrossRef]
- Cvetanović, A.; Švarc-Gajić, J.; Gašić, U.; Tešić, Ž.; Zengin, G.; Zeković, Z.; Đurović, S. Isolation of apigenin from subcritical water extracts: Optimization of the process. J. Supercrit. Fluids 2017, 120, 32–42. [Google Scholar] [CrossRef]
- Espín, J.C.; Soler-Rivas, C.; Wichers, H.J. Characterization of the Total Free Radical Scavenger Capacity of Vegetable Oils and Oil Fractions Using 2,2-Diphenyl-1-picrylhydrazyl Radical. J. Agric. Food Chem. 2000, 48, 648–656. [Google Scholar] [CrossRef]
- Oyaizu, M. Studies on products of browning reaction. Antioxidative activities of products of browning reaction prepared from glucosamine. Jpn. J. Nutr. Diet. 1986, 44, 307–315. [Google Scholar] [CrossRef]
- Sužnjević, D.; Pastor, F.T.; Gorjanović, S. Polarographic study of hydrogen peroxide anodic current and its application to antioxidant activity determination. Talanta 2011, 85, 1398–1403. [Google Scholar] [CrossRef]
- Mosmann, T. Rapid colorimetric assay for cellular growth and survival: Application to proliferation and cytotoxicity assays. J. Immunol. Methods 1983, 65, 55–63. [Google Scholar] [CrossRef]
- Kollo, T.; von Rosen, D. Advanced Multivariate Statistics with Matrices; Hazewinkel, M., Ed.; Springer: Dordrecht, The Netherlands, 2005; ISBN 978-1-4020-3418-3. [Google Scholar]
- Ochoa-Martínez, C.I.; Ayala-Aponte, A.A. Prediction of mass transfer kinetics during osmotic dehydration of apples using neural networks. LWT-Food Sci. Technol. 2007, 40, 638–645. [Google Scholar] [CrossRef]
- Yoon, Y.; Swales, G.; Margavio, T.M. A Comparison of Discriminant Analysis versus Artificial Neural Networks. J. Oper. Res. Soc. 1993, 44, 51. [Google Scholar] [CrossRef]
- Mašković, P.; Veličković, V.; Mitić, M.; Đurović, S.; Zeković, Z.; Radojković, M.; Cvetanović, A.; Švarc-Gajić, J.; Vujić, J. Summer savory extracts prepared by novel extraction methods resulted in enhanced biological activity. Ind. Crops Prod. 2017, 109, 875–881. [Google Scholar] [CrossRef]
- Mašković, P.Z.; Veličković, V.; Đurović, S.; Zeković, Z.; Radojković, M.; Cvetanović, A.; Švarc-Gajić, J.; Mitić, M.; Vujić, J. Biological activity and chemical profile of Lavatera thuringiaca L. extracts obtained by different extraction approaches. Phytomedicine 2018, 38, 118–124. [Google Scholar] [CrossRef]
- Amorati, R.; Valgimigli, L. Advantages and limitations of common testing methods for antioxidants. Free. Radic. Res. 2015, 49, 633–649. [Google Scholar] [CrossRef]
- Escarpa, A.; González, M. Approach to the content of total extractable phenolic compounds from different food samples by comparison of chromatographic and spectrophotometric methods. Anal. Chim. Acta 2001, 427, 119–127. [Google Scholar] [CrossRef]
- Everette, J.D.; Bryant, Q.M.; Green, A.M.; Abbey, Y.A.; Wangila, G.W.; Walker, R.B. Thorough study of reactivity of various compound classes toward the Folin− Ciocalteu reagent. J. Agric. Food Chem. 2010, 58, 8139–8144. [Google Scholar] [CrossRef]
- Itharat, A.; Houghton, P.J.; Eno-Amooquaye, E.; Burke, P.; Sampson, J.H.; Raman, A. In vitro cytotoxic activity of Thai medicinal plants used traditionally to treat cancer. J. Ethnopharmacol. 2004, 90, 33–38. [Google Scholar] [CrossRef] [PubMed]
- Plaza, M.; Amigo-Benavent, M.; del Castillo, M.D.; Ibáñez, E.; Herrero, M. Facts about the formation of new antioxidants in natural samples after subcritical water extraction. Food Res. Int. 2010, 43, 2341–2348. [Google Scholar] [CrossRef] [Green Version]
- Ahmad, J.; Langrish, T. Optimisation of total phenolic acids extraction from mandarin peels using microwave energy: The importance of the Maillard reaction. J. Food Eng. 2012, 109, 162–174. [Google Scholar] [CrossRef]

| Parameter | Extracts | |||||
|---|---|---|---|---|---|---|
| 1 | 2 | 3 | 4 | 5 | 6 | |
| Pressure (bar) | 100 | 100 | 200 | 200 | 300 | 300 |
| Temperature (°C) | 40 | 60 | 40 | 60 | 40 | 60 |
| Density (g/cm3) | 0.629 | 0.290 | 0.840 | 0.724 | 0.910 | 0.830 |
| Separation parameters | ||||||
| Pressure (bar) | 15 | 15 | 15 | 15 | 15 | 15 |
| Temperature (°C) | 23 | 23 | 23 | 23 | 23 | 23 |
| Sample | Yield (mg/mL) | Yield (g/100 g) |
|---|---|---|
| UAE | ||
| UAE | 3.86 ± 0.06 b | 11.58 ± 0.09 |
| UAE-1 | 3.06 ± 0.09 a | 9.18 ± 0.06 |
| UAE-2 | 5.51 ± 0.07 c | 16.53 ± 0.10 |
| UAE-3 | 6.09 ± 0.08 d | 18.27 ± 0.11 |
| UAE-4 | 3.96 ± 0.04 b | 11.88 ± 0.08 |
| UAE-5 | 8.40 ± 0.09 e | 25.20 ± 0.06 |
| UAE-6 | 6.09 ± 0.03 d | 18.27 ± 0.11 |
| MAE | ||
| MAE | 10.27 ± 0.09 h | 30.81 ± 0.11 |
| MAE-1 | 10.56 ± 0.10 i | 31.68 ± 0.12 |
| MAE-2 | 10.79 ± 0.08 j | 32.37 ± 0.15 |
| MAE-3 | 9.80 ± 0.06 g | 29.40 ± 0.10 |
| MAE-4 | 9.65 ± 0.06 fg | 28.95 ± 0.09 |
| MAE-5 | 10.74 ± 0.10 ij | 32.22 ± 0.09 |
| MAE-6 | 9.58 ± 0.08 f | 28.74 ± 0.08 |
| Sample | TPC (mg CAE/g SN) | TFC (mg CE/g SN) |
|---|---|---|
| UAE | ||
| UAE | 133.41 ± 1.26 b | 3.31 ± 0.11 b |
| UAE-1 | 110.80 ± 2.22 a | 2.86 ± 0.09 a |
| UAE-2 | 185.35 ± 1.52 d | 5.18 ± 0.16 d |
| UAE-3 | 194.52 ± 2.82 e | 5.33 ± 0.09 d |
| UAE-4 | 149.29 ± 2.23 c | 3.60 ± 0.08 c |
| UAE-5 | 289.23 ± 3.11 g | 8.41 ± 0.06 f |
| UAE-6 | 219.57 ± 2.65 f | 6.33 ± 0.11 e |
| MAE | ||
| MAE | 371.92 ± 3.56 j | 10.92 ± 0.10 h |
| MAE-1 | 395.14 ± 2.99 k | 12.27 ± 0.06 j |
| MAE-2 | 428.14 ± 3.59 m | 12.36 ± 0.08 j |
| MAE-3 | 347.46 ± 4.11 i | 10.77 ± 0.09 h |
| MAE-4 | 337.69 ± 3.25 h | 10.25 ± 0.08 g |
| MAE-5 | 404.50 ± 3.77 l | 11.32 ± 0.07 i |
| MAE-6 | 341.37 ± 2.85 hi | 10.96 ± 0.09 h |
| Compound | Content (mg/L) | ||||||
|---|---|---|---|---|---|---|---|
| UAE | UAE-1 | UAE-2 | UAE-3 | UAE-4 | UAE-5 | UAE-6 | |
| Protocatechuic acid | 4.50 ± 0.20 c | 2.32 ± 0.02 b | 2.26 ± 0.04 b | ND * | ND | 1.20 ± 0.06 a | ND |
| p-Hydroxybenzoic acid | 1.11 ± 0.06 a | 1.73 ± 0.01 d | 1.64 ± 0.06 c | 1.88 ± 0.09 e | 1.84 ± 0.02 e | 1.34 ± 0.05 b | 1.81 ± 0.03 e |
| Caffeic acid | 20.85 ± 0.52 g | 9.88 ± 0.03 e | 10.70 ±0.09 f | 4.04 ± 0.10 a | 6.67 ± 0.09 c | 4.84 ± 0.05 b | 6.91 ± 0.10 d |
| Vanillic acid | 1.05 ± 0.01 a | 1.96 ± 0.02 d | 1.74 ± 0.01 c | 1.95 ± 0.03 d | 2.05 ± 0.03 e | 1.33 ± 0.03 b | 2.01 ± 0.08 e |
| Aesculin | 1.96 ± 0.06 e | 0.69 ± 0.01 a | 0.88 ± 0.01 b | 0.96 ± 0.06 c | 1.15 ± 0.03 d | 0.69 ± 0.02 a | 1.10 ± 0.06 d |
| 5-O-Caffeoylquinic acid | 31.00 ± 0.36 g | 0.54 ± 0.01 a | 1.58 ± 0.06 f | 0.63 ± 0.02 b | 1.40 ± 0.02 e | 0.77 ± 0.02 c | 1.21 ± 0.04 d |
| p-Coumaric acid | 4.60 ± 0.05 a | 9.72 ± 0.06 e | 8.70 ± 0.05 c | 12.04 ± 0.11 f | 8.80 ± 0.09 c | 7.55 ± 0.08 b | 9.17 ± 0.12 d |
| Ferulic acid | 1.71 ± 0.03 a | 3.58 ± 0.06 f | 2.88 ± 0.03 c | 3.16 ± 0.06 e | 2.84 ± 0.01 c | 2.11 ± 0.06 b | 2.97 ± 0.03 d |
| p-Hydroxyphenylacetic acid | 0.33 ± 0.00 b | 0.42 ± 0.01 c | 0.42 ± 0.01 c | 0.48 ± 0.02 d | 0.51 ± 0.01 e | 0.30 ± 0.01 a | 0.51 ± 0.02 e |
| Quercetin-3-O-galactoside | 0.05 ± 0.00 d | ND | 0.03 ± 0.00 c | 0.01 ± 0.00 a | 0.02 ± 0.00 b | ND | 0.03 ± 0.00 c |
| Rutin | 1.05 ± 0.03 e | 0.07 ± 0.01 c | 0.09 ± 0.01 d | 0.02 ± 0.00 a | 0.07 ± 0.00 c | 0.05 ± 0.00 b | 0.08 ± 0.01 cd |
| Apigenin-7-O-glucoside | ND | ND | ND | ND | ND | ND | ND |
| Quercetin | ND | ND | ND | ND | ND | ND | ND |
| Luteolin | ND | ND | ND | ND | ND | ND | ND |
| Naringin | 2.20 ± 0.02 f | 1.05 ± 0.02 c | 0.91 ± 0.02 a | 1.13 ± 0.02 d | 1.12 ± 0.06 d | 0.97 ± 0.03 b | 1.34 ± 0.06 e |
| Kaempferol | ND | ND | ND | ND | ND | ND | ND |
| Apigenin | ND | ND | ND | ND | ND | ND | ND |
| Isorhamnetin-3-O-rutinoside | 0.12 ± 0.00 d | 0.03 ± 0.00 b | 0.04 ± 0.00 c | 0.04 ± 0.00 c | 0.02 ± 0.00 a | 0.02 ± 0.00 a | 0.03 ± 0.00 b |
| Taxifolin | 0.28 ± 0.00 a | 0.84 ± 0.02 c | 1.11 ± 0.05 f | 0.98 ± 0.03 e | 0.90 ± 0.03 d | 0.64 ± 0.02 b | 1.00 ± 0.01 g |
| Isorhamnetin-3-O-glucoside | 0.20 ± 0.00 a | 0.46 ± 0.01 c | 0.59 ± 0.02 d | 0.56 ± 0.03 d | 0.57 ± 0.02 d | 0.38 ± 0.01 b | ND |
| Daidzein | 0.03 ± 0.00 a | ND | ND | ND | ND | ND | ND |
| Eriodictyol | ND | ND | ND | ND | ND | ND | ND |
| Chrysoeriol | ND | 0.03 | ND | ND | ND | 0.02 | ND |
| Chrysin | ND | ND | ND | ND | ND | ND | ND |
| Acacetin | ND | ND | ND | ND | ND | ND | ND |
| Genkwanin | ND | ND | ND | ND | ND | ND | ND |
| Galangin | ND | ND | ND | ND | ND | ND | ND |
| Kaempferide | ND | ND | ND | ND | ND | ND | ND |
| Total | 71.04 | 33.31 | 33.56 | 27.88 | 27.95 | 22.19 | 28.15 |
| Compound | Content (mg/L) | ||||||
| MAE | MAE-1 | MAE-2 | MAE-3 | MAE-4 | MAE-5 | MAE-6 | |
| Protocatechuic acid | ND * | ND * | ND | ND | ND | ND | ND |
| p-Hydroxybenzoic acid | 1.40 ± 0.03 a | 2.44 ± 0.02 de | 2.35 ± 0.02 c | 2.28 ± 0.02 b | 2.52 ± 0.06 e | 2.41 ± 0.03 d | 2.45 ± 0.03 de |
| Caffeic acid | 53.70 ± 0.53 b | 41.96 ± 0.12 a | ND | ND | ND | ND | ND |
| Vanillic acid | 1.40 ± 0.01 a | 1.72 ± 0.01 cd | 1.77 ± 0.03 d | 1.64 ± 0.01 b | 1.69 ± 0.02 c | 1.72 ± 0.02 cd | 1.69 ± 0.02 c |
| Aesculin | 3.55 ± 0.03 f | 2.13 ± 0.03 b | 2.05 ± 0.03 a | 2.16 ± 0.02 bc | 2.42 ± 0.03 e | 2.22 ± 0.03 c | 2.26 ± 0.03 d |
| 5-O-Caffeoylquinic acid | 71.00 ± 0.46 g | 22.44 ± 0.15 f | 13.68 ± 0.01 d | 13.31 ± 0.11 c | 14.18 ± 0.11 e | 10.27 ± 0.12 b | 8.96 ± 0.09 a |
| p-Coumaric acid | 10.05 ± 0.11 e | 7.24 ± 0.02 d | 6.38 ± 0.06 a | 6.53 ± 0.06 b | 7.29 ± 0.09 d | 6.79 ± 0.06 c | 6.52 ± 0.06 b |
| Ferulic acid | 6.60 ± 0.09 g | 6.15 ± 0.06 f | 4.95 ± 0.04 d | 4.82 ± 0.06 c | 5.50 ± 0.05 e | 4.69 ± 0.04 b | 4.45 ± 0.04 a |
| p-Hydroxyphenylacetic acid | 0.95 ± 0.03 a | 1.19 ± 0.04 c | 1.08 ± 0.02 bc | 1.04 ± 0.03 b | 1.14 ± 0.05 c | 1.04 ± 0.03 b | 1.06 ± 0.02 b |
| Quercetin-3-O-galactoside | 0.13 ± 0.01 b | 0.02 ± 0.00 b | 0.01 ± 0.00 a | ND | 0.01 ± 0.00 a | ND | ND |
| Rutin | 2.60 ± 0.08 e | 0.30 ± 0.01 d | 0.15 ± 0.01 c | 0.14 ± 0.02 c | 0.15 ± 0.01 c | 0.07 ± 0.01 b | 0.06 ± 0.00 a |
| Apigenin-7-O-glucoside | 0.03 ± 0.00 b | 0.02 ± 0.00 a | 0.02 ± 0.00 a | 0.02 ± 0.00 a | 0.03 ± 0.00 b | 0.02 ± 0.00 a | 0.03 ± 0.00 b |
| Quercetin | ND | ND | ND | ND | ND | ND | ND |
| Luteolin | ND | ND | ND | ND | ND | ND | ND |
| Naringin | 3.66 ± 0.06 f | 2.33 ± 0.04 d | 2.03 ± 0.03 a | 2.12 ± 0.03 b | 2.19 ± 0.03 c | 2.59 ± 0.03 e | 2.21 ± 0.03 c |
| Kaempferol | ND | ND | ND | ND | ND | ND | ND |
| Apigenin | ND | ND | ND | ND | ND | ND | ND |
| Isorhamnetin-3-O-rutinoside | 0.16 ± 0.00 c | 0.08 ± 0.00 b | ND | ND | 0.04 ± 0.00 a | ND | ND |
| Taxifolin | 0.62 ± 0.00 a | 1.88 ± 0.06 c | 1.90 ± 0.06 d | 1.96 ± 0.05 d | 2.18 ± 0.09 e | 1.72 ± 0.06 b | 1.76 ± 0.05 b |
| Isorhamnetin-3-O-glucoside | 0.10 ± 0.00 a | ND | ND | ND | ND | ND | ND |
| Daidzein | 0.08 ± 0.00 b | 0.03 ± 0.00 a | ND | ND | ND | ND | ND |
| Eriodictyol | ND | ND | ND | ND | ND | ND | ND |
| Chrysoeriol | ND | ND | 0.05 ± 0.00 a | ND | ND | ND | ND |
| Chrysin | ND | ND | ND | ND | ND | ND | ND |
| Acacetin | ND | ND | ND | ND | ND | ND | ND |
| Genkwanin | ND | ND | ND | ND | ND | ND | ND |
| Galangin | ND | ND | ND | ND | ND | ND | ND |
| Kaempferide | ND | ND | ND | ND | ND | ND | ND |
| Total | 156.03 | 89.94 | 36.41 | 36.02 | 39.30 | 33.55 | 31.42 |
| Sample | Antioxidant Activity | ||
|---|---|---|---|
| IC50 (μg/mL) | EC50 (μg/mL) | HPMC (%/mL) | |
| UAE | |||
| UAE | 22.25 ± 0.11 h | 113.10 ± 0.22 l | 53.2 ± 3.3 a |
| UAE-1 | 24.64 ± 0.12 k | 69.54 ± 0.19 h | 92.9 ± 2.1 c |
| UAE-2 | 23.71 ± 0.10 j | 71.33 ± 0.20 j | 118.6 ± 7.8 d |
| UAE-3 | 19.71 ± 0.09 f | 71.97 ± 0.22 k | 117.5 ± 6.9 d |
| UAE-4 | 23.10 ± 0.15 i | 71.35 ± 0.16 j | 80.9 ± 6.4 bc |
| UAE-5 | 21.69 ± 0.12 g | 66.14 ± 0.19 g | 63.9 ± 1.0 ab |
| UAE-6 | 25.62 ± 0.12 l | 70.44 ± 0.16 i | 77.1 ± 4.0 bc |
| MAE | |||
| MAE | 18.92 ± 0.13 e | 69.36 ± 0.11 h | 148.0 ± 8.2 efg |
| MAE-1 | 13.08 ± 0.11 ab | 60.54 ± 0.21 e | 164.0 ± 5.3 g |
| MAE-2 | 12.86 ± 0.09 a | 59.27 ± 0.16 c | 143.2 ± 6.6 ef |
| MAE-3 | 17.41 ± 0.10 c | 59.90 ± 0.25 d | 151.9 ± 4.5 efg |
| MAE-4 | 18.09 ± 0.11 d | 58.62 ± 0.23 b | 163.4 ± 9.1 g |
| MAE-5 | 13.29 ± 0.15 b | 62.97 ± 0.29 f | 159.6 ± 9.2 fg |
| MAE-6 | 17.61 ± 0.15 c | 55.70 ± 0.33 a | 141.8 ± 5.7 e |
| Sample | Cell Line/IC50 (μg/mL) | ||
|---|---|---|---|
| Hep2c | RD | L2OB | |
| UAE | |||
| UAE | 36.36 ± 0.12 i | 29.67 ± 0.34 g | 39.16 ± 0.32 i |
| UAE-1 | 35.45 ± 0.39 i | 32.49 ± 0.98 h | 36.23 ± 0.76 h |
| UAE-2 | 31.29 ± 0.83 h | 29.24 ± 0.38 g | 33.19 ± 0.43 g |
| UAE-3 | 29.46 ± 0.54 g | 26.76 ± 0.83 f | 28.76 ± 0.64 e |
| UAE-4 | 23.39 ± 0.72 e | 20.84 ± 0.16 d | 26.48 ± 0.13 d |
| UAE-5 | 13.35 ± 0.15 b | 11.39 ± 0.30 b | 14.60 ± 0.08 c |
| UAE-6 | 9.23 ± 0.67 a | 8.72 ± 0.23 a | 13.13 ± 0.32 b |
| MAE | |||
| MAE | 38.47 ± 0.43 j | 31.32 ± 0.54 h | 49.28 ± 0.45 j |
| MAE-1 | 25.28 ± 0.20 f | 23.73 ± 0.67 e | 36.43 ± 0.18 h |
| MAE-2 | 23.29 ± 0.82 e | 20.89 ± 0.29 d | 32.39 ± 0.38 fg |
| MAE-3 | 20.43 ± 0.14 d | 18.18 ± 0.56 c | 31.45 ± 0.24 f |
| MAE-4 | 18.34 ± 0.30 c | 17.35 ± 0.91 c | 25.83 ± 0.92 d |
| MAE-5 | 14.49 ± 0.29 b | 11.08 ± 0.18 b | 15.65 ± 0.15 c |
| MAE-6 | 10.17 ± 0.89 a | 9.46 ± 0.37 c | 11.30 ± 0.27 a |
Disclaimer/Publisher’s Note: The statements, opinions and data contained in all publications are solely those of the individual author(s) and contributor(s) and not of MDPI and/or the editor(s). MDPI and/or the editor(s) disclaim responsibility for any injury to people or property resulting from any ideas, methods, instructions or products referred to in the content. |
© 2023 by the authors. Licensee MDPI, Basel, Switzerland. This article is an open access article distributed under the terms and conditions of the Creative Commons Attribution (CC BY) license (https://creativecommons.org/licenses/by/4.0/).
Share and Cite
Đurović, S.; Pezo, L.; Gašić, U.; Gorjanović, S.; Pastor, F.; Bazarnova, J.G.; Smyatskaya, Y.A.; Zeković, Z. Recovery of Biologically Active Compounds from Stinging Nettle Leaves Part II: Processing of Exhausted Plant Material after Supercritical Fluid Extraction. Foods 2023, 12, 809. https://doi.org/10.3390/foods12040809
Đurović S, Pezo L, Gašić U, Gorjanović S, Pastor F, Bazarnova JG, Smyatskaya YA, Zeković Z. Recovery of Biologically Active Compounds from Stinging Nettle Leaves Part II: Processing of Exhausted Plant Material after Supercritical Fluid Extraction. Foods. 2023; 12(4):809. https://doi.org/10.3390/foods12040809
Chicago/Turabian StyleĐurović, Saša, Lato Pezo, Uroš Gašić, Stanislava Gorjanović, Ferenc Pastor, Julia G. Bazarnova, Yulia A. Smyatskaya, and Zoran Zeković. 2023. "Recovery of Biologically Active Compounds from Stinging Nettle Leaves Part II: Processing of Exhausted Plant Material after Supercritical Fluid Extraction" Foods 12, no. 4: 809. https://doi.org/10.3390/foods12040809