Communication

Untargeted Metabolite Profiling of Adipose Tissue in Rats Exposed to Mepiquat

China-Canada Joint Lab of Food Nutrition and Health (Beijing), Beijing Advanced Innovation Center for Food Nutrition and Human Health, Beijing Engineering and Technology Research Center of Food Additives, Beijing Laboratory for Food Quality and Safety, Beijing Technology and Business University (BTBU), 11 Fucheng Road, Beijing 100048, China
*
Author to whom correspondence should be addressed.
Foods 2023, 12(4), 867; https://doi.org/10.3390/foods12040867
Submission received: 30 December 2022 / Revised: 6 February 2023 / Accepted: 13 February 2023 / Published: 17 February 2023

Abstract

:
Mepiquat (Mep) is a contaminant produced by Maillard reaction with reducing sugar, free lysine and an alkylating agent under typical roasting conditions, particularly in the range of 200–240 °C. It has been reported that exposure to Mep is harmful to rats. However, its metabolic mechanism is still not clear. In this study, untargeted metabolomics was used to reveal the effect of Mep on the metabolic profile of adipose tissue in Sprague-Dawley rats. Twenty-six differential metabolites were screened out. Eight major perturbed metabolic pathways were found, which were linoleic acid metabolism, Phenylalanine, tyrosine, and tryptophan biosynthesis, phenylalanine metabolism, arachidonic acid metabolism, Glycine, serine, and threonine metabolism, glycerolipid metabolism, Alanine, aspartate, and glutamate metabolism, and glyoxylate and dicarboxylic acid metabolism. This study lays a solid foundation for clarifying the toxic mechanism of Mep.

1. Introduction

Mepiquat (N,N-dimethylpiperidinium, C7H16N, Mep) is a plant growth regulator usually used in agriculture with high efficiency. Maximum residue limits (MRLs) for mepiquat in foods have been established in many countries or regions [1]. It is also a contaminant produced by the Maillard reaction with reducing sugar, free lysine and an alkylating agent under typical roasting conditions, particularly in the range of 200–240 °C. The highest levels of Mep were found in roasted barley and soluble coffee, 640 μg/kg and 1400 μg/kg, respectively [2]. Levels of Mep were 1064 μg/kg and 293 μg/kg in potatoes and broccoli after roasting at 240 °C and 260 °C respectively for 20 min in the oven [3]. Mep levels in oven-cooked beef were up to 82.5 μg/kg after 10 min at 250 °C [4]. Therefore, Mep has become a potential factor affecting food safety. Mep formed in thermally processed foods may raise human exposure. The European Food Safety Authority (EFSA) has reported that exposure to Mep is harmful to rats. It was found that Mep can cause kidney vacuolization and liver and spleen damage [5], but its metabolic mechanism is still not clear.
Metabolomics can evaluate the global metabolic profiling of molecular responses in organisms that are disturbed by the outside world, and generate a large amount of metabolic pathway information for deciphering the metabolic networks altered by various stimuli [6]. Techniques such as nuclear magnetic resonance [7] and mass spectrometry [8,9] are used in metabolomic analysis. Nuclear magnetic resonance-based metabolomic analysis can achieve unbiased and high-throughput analysis of biological samples, but it has limited dynamic range, low sensitivity, and small metabolite detection coverage. As a result, its application is limited. Mass spectrometry has advantages of strong specificity, high resolution, and high sensitivity. For the analysis of biological samples, it can simultaneously detect hundreds of small molecule metabolites [10]. White adipose tissue is an important participant in energy regulation of body. It stores excess ingested fatty acids in the form of triglycerides and meets the energy needs of other organs by releasing fatty acids. In addition, it is an endocrine organ affecting essential metabolic processes, including the dynamic balance of lipid and glucose [11].
To date, there is no metabolomics study of adipose tissue of mepiquat-exposed rats. In this study, gas chromatography-mass spectrometry (GC-MS) was used to detect changes of metabolites in adipose samples. In addition, we examined histopathological changes of adipose tissues in rats. The method was established to find more differential metabolites to comprehensively reveal the mechanism of Mep toxicity.

2. Materials and Methods

2.1. Chemicals and Reagents

Mepiquat (purity > 98%) was purchased from Sigma-Aldrich (Buchs, Switzerland). Methanol was HPLC grade and obtained from Fisher (Fair Lawn, NJ, USA). All standard compounds and 4-chloro-DL-phenylalanine were gained from Sigma or Sigma-Aldrich (St. Louis, MO, USA), Sigma-Aldrich also provided the derivatization reagent (99% MSTFA + 1% TMCS, pyridine, and methoxyamine). All other chemicals were analytical grade.

2.2. Animals and Treatments

This experiment was carried out in the SPF (Specific Pathogen Free) animal laboratory of animal center of Peking University Health Science Center (Beijing, China). Conditions of the breeding environment were controlled as follows: 12 h dark/light cycle, temperature 22 °C ± 1 °C, and relative humidity 60 ± 5%. All experimental treatments were carried out according to the European Community guidelines for experimental animal use. The study plan was agreed by the Experimental Animal Protection and Use Committee of Peking University (Approval No. LA2019032). Thirty male Sprague-Dawley rats aged 5–6 weeks were randomly divided into normal diet group (Normal Diet, ND, n = 10), low-dose group (Low-dose Diet, LD, n = 10) and high-dose group (High-dose Diet, HD, n = 10). Rats were fed with standard laboratory feed and with ad libitum access to diet and water. One week later, the weight of rats was 200 ± 15 g. LD50 of mepiquat is 464 mg/kg bw [5]. Rats in LD group and HD group were given 15 mg/kg and 150 mg/kg Mep dissolved in distilled water by oral gavages once every morning [12]. Rats in ND group was given 10 mL/kg distilled water by the same way. Body weight were recorded daily. Rats were sacrificed by decapitation, adipose tissues were collected quickly, and some of the adipose tissues were frozen at −80 °C, while the rest were fixed in 10% neutral buffered formalin solution for histological analysis.

2.3. Sample Preparation

Fifty milligram white adipose tissue was homogenized in 2.0 mL of chloroform/methanol (v/v, 2:1). After centrifugation at 10,000 r/min for 5 min at 4 °C, supernatant was collected and the same procedure was used twice to extract the residue. The obtained complete supernatant was dried with nitrogen after being centrifuged for 5 min at 12,000 r/min. In total, 10 μL of 4-chloro-DL-phenylalanine (1.05 mg/mL in water) was added to each sample. Every sample was lyophilized and derivatized by adding 80 μL of MSTFA at 70 °C for 3 h. Every sample was mixed with 165 μL chloroform, vortexed, and centrifuged at 15,000 r/min for 15 min at 4 °C. Supernatant was transferred to GC-MS vials for analysis. Quality control (QC) samples were made by mixing the same volume (10 μL) of each sample. QC sample was run once every six samples during the assay [13].

2.4. GC-MS Analysis

Agilent 7890A/5975C gas chromatography mass spectrometer was used with an HP-5 MS capillary column (30 m × 250 μm i.d., 0.25 μm). The carrier gas was chromatographic grade helium, and the constant flow rate was 1.0 mL/min. The temperature program was set as follows: the initial temperature was 60 °C, held for 2 min, increased to 240 °C at a rate of 5 °C/min, then held for 3 min, and raised to 290 °C at a rate of 12 °C/min, maintained for 2 min. Injector temperature was set at 280 °C. Solvent delay was 5 min. Splitless injection mode was used. Injection volume was 1 μL. The mass spectrometry data were obtained in full scan mode (m/z 50 to 650). Electron energy was 70 eV. Identification of compounds was carried out by authentic standards and the NIST library (2014) (Gaithersburg, MD, USA) [14].

2.5. Data Processing and Multivariate Analysis

Data analysis was performed based on a previous research [14]. The normalized data were imported into SIMCA-P14.1 software (Umetrics, Umeå, Sweden). Data were analyzed with PCA model and PLS-DA model. Differential metabolites were determined based on variable importance in the projection (VIP > 1.0) and p-value (p < 0.05) gained from the Mann–Whitney U test in SPSS22.0 software (SPSS Inc., Chicago, IL, USA). Metaboanalyst 5.0 (https://www.metaboanalyst.ca/ (accessed on 26 February 2022)) and cytoscape software was utilized for metabolic pathway analysis.

2.6. Receiver Operator Characteristic (ROC) Analysis

The ROC analysis was used for assessing the diagnostic ability of the differential metabolites to classify rats into a low or high Mep exposure. The area under ROC curve (AUC) from 0.5 to 1.0 showed diagnostic accuracy from no discrimination to good classification. The ROC analysis was completed by SPSS 22.0 software.

3. Results and Discussion

3.1. Weight Change

In this study, weight gained in Mep exposure groups were slower than that in the normal diet group. It indicated that Mep significantly inhibited the weight gain of rats (p < 0.05), as shown in Figure S1.

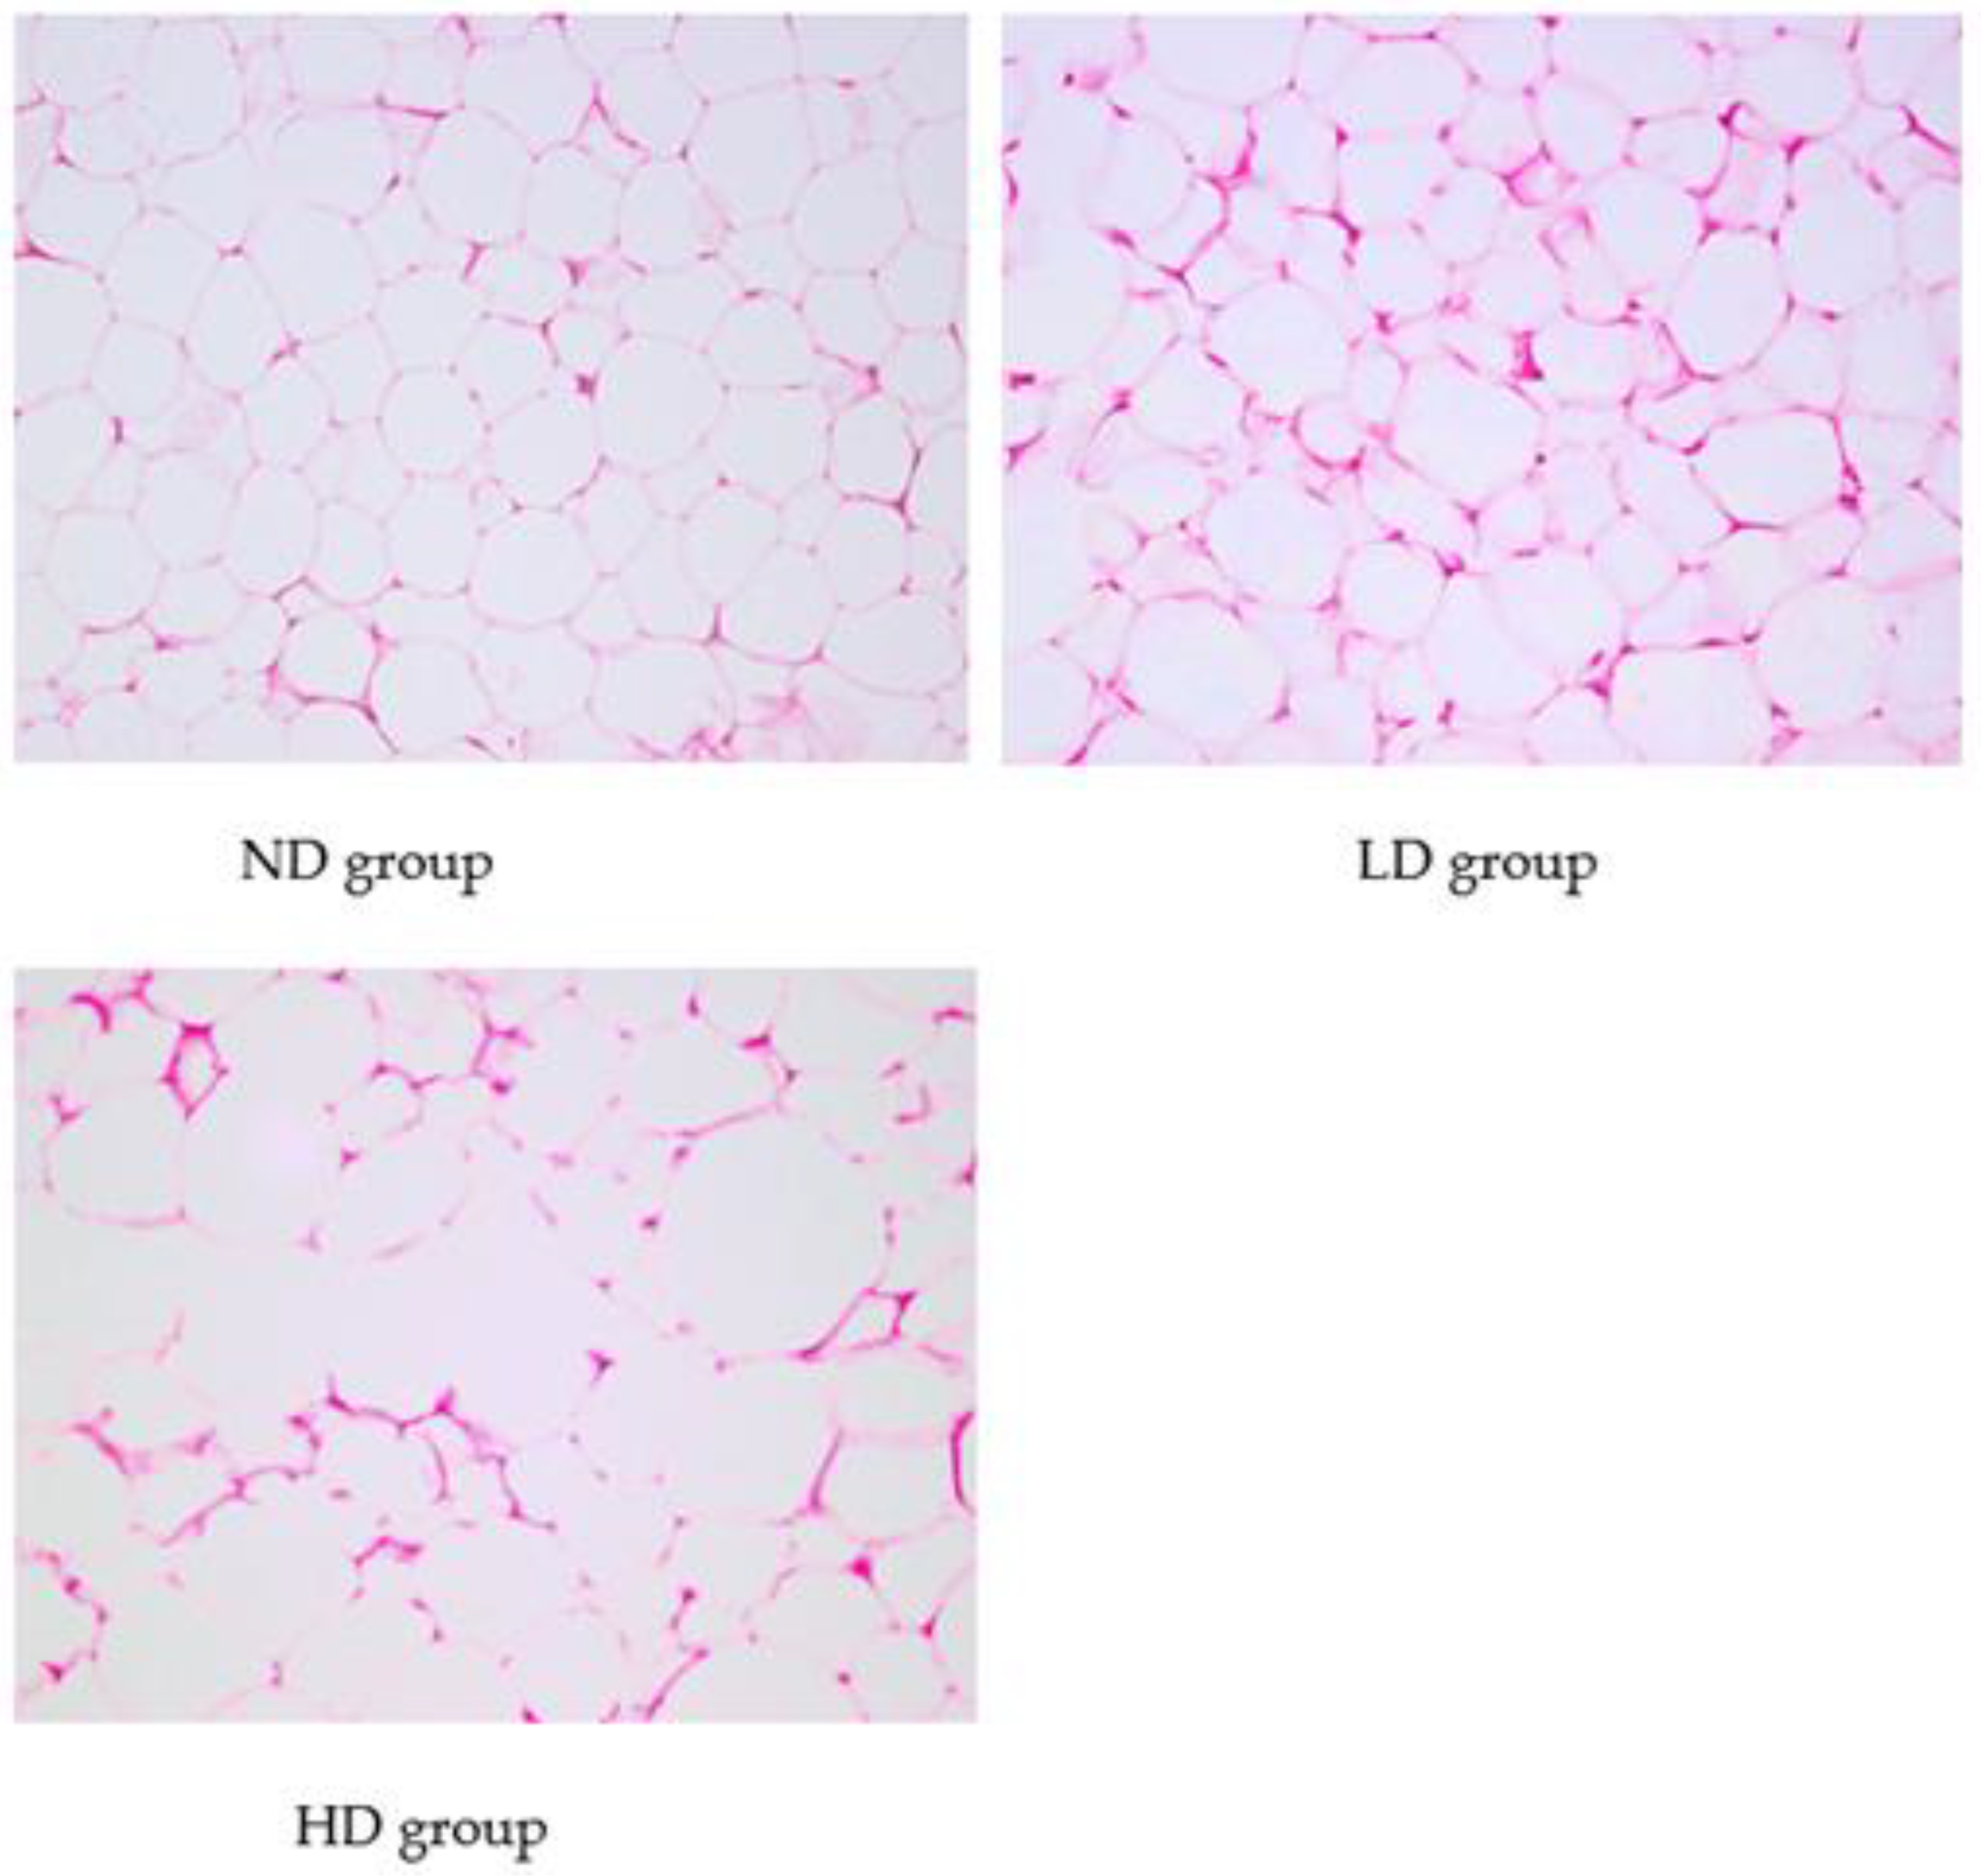
3.2. Histopathological Analysis

As shown in Figure 1, adipose tissue cells in ND group were closely arranged, and were similar in size with clear outlines. It showed disordered cell arrangement, different sizes, and irregular changes in cell shape in LD group. The number of cells increased in the same field of view. In HD group, it was observed that cells size and shape changed greatly. Some cells in HD group increased in size by a factor of two or more compared to those in ND group. In HD group, and the outline of cells was deformed and blurred, and the arrangement was disordered, accompanied by inflammatory cell infiltration.

3.3. GC-MS Analysis of Adipose Tissue

Differential metabolites were screened based on the remarkable differences (VIP > 1.0 and p < 0.05) of HD/ND in abundance. A total of twenty-six differential metabolites in adipose were quantified by normalization to 4-chloro-DL-phenylalanine (internal standard). The relative levels of metabolites were shown as fold changes (Table 1).
Twenty-six metabolites in Table 1 were regarded as differential metabolites. Elevated concentrations of many metabolites were found in rats. Compared with ND group, the levels of amino acids, such as glycine, valine, leucine, isoleucine, serine, proline, phenylalanine, and alanine, were higher in HD group. By contrast, fatty acids including propanoic acid, hexadecanoic acid, octadecanoic acid, arachidonic acid, and oleic acid decreased in rats exposed to Mep. In comparison with ND group, contents of propionate, phosphoric acid, acetamide, creatinine, D-mannitol, pentanedioic acid, and acetic acid increased, while levels of lactic acid, urea, cholesterol, and glycerol decreased in HD group.

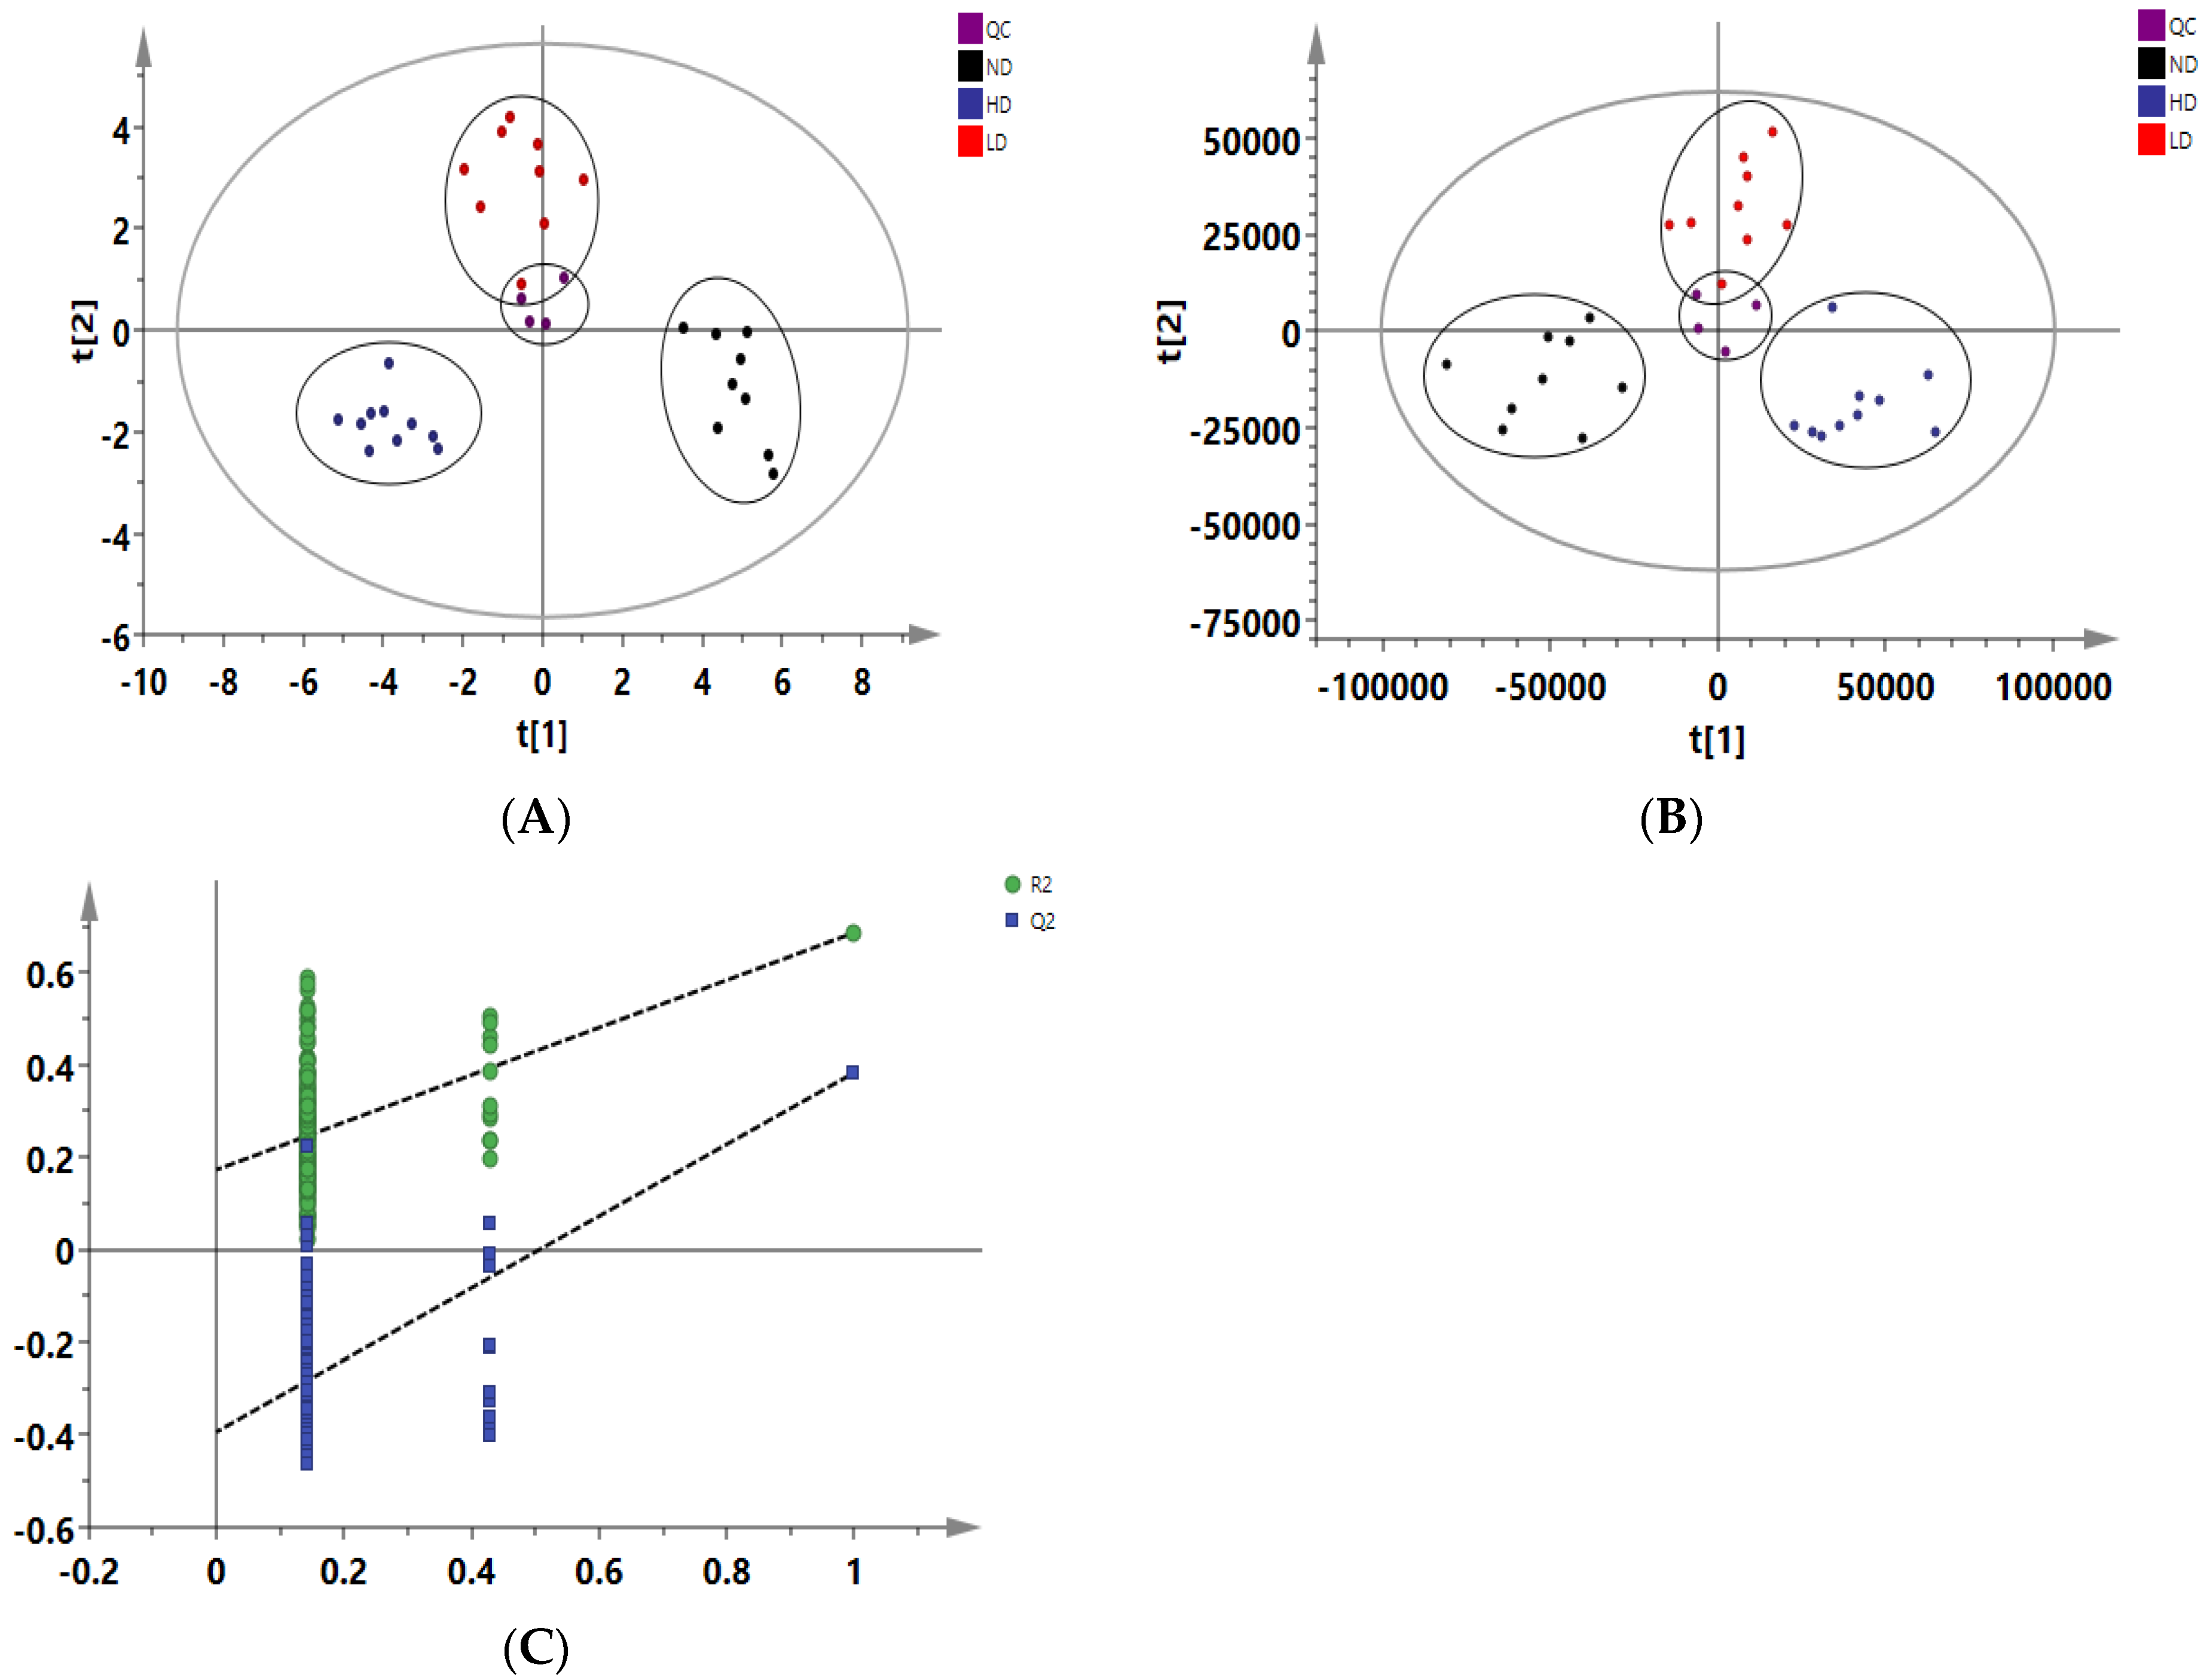
3.4. Adipose Tissue Metabolomics Analysis

Data of adipose samples from three groups were visualized. In the PCA model, it was found that the ND, LD, and HD groups was clearly separated. The PLS-DA model showed that scattered points of three groups were clearly distinguished too. Mep-exposed groups were significantly shifted from the ND group, and the HD group was more significantly shifted than the LD group. This showed that with the increase of administration doses, significant changes were found in adipose tissue. The validity of the model was confirmed by a permutation test and the cross-validation parameter Q2.
Analytical testing for stability and reproducibility was performed with quality control (QC) samples. In Figure 2, the QC samples have little change and the distribution was relatively concentrated. Its reproducibility was good, indicating that the system was stable and reliable. In Figure 2A, R2X (cum) = 77.7%, Q2 (cum) = 56.6%. In Figure 2B, R2X (cum) = 76.7%, R2Y (cum) = 84%, Q2 (cum) = 73.3%. It showed that the two models have good quality and predictive ability. By performing a permutation test, it was verified whether the PLS-DA model was overfitting to evaluate the reliability of the model. The permutation experiment (number of permutations n = 999), R2 = (0.0, 0.175) and Q2 = (0.0, −0.403), proved that the model was not over fitted.
Boxplots were used for comparing changes in relative levels of metabolites in adipose tissue. In comparison with the ND group, contents of glycine (VIP = 1.07, p < 0.001) and isoleucine (VIP = 1.19, p < 0.001) increased in Mep-exposed groups; however, levels of octadecanoic acid (VIP = 1.79, p < 0.001) and glutamine (VIP = 1.01, p < 0.001) decreased in Mep-exposed groups (Figure 3). This indicated a dose-dependent relationship in groups with Mep exposure.

3.5. ROC Curve

Differential metabolites were subjected to ROC analysis. ROC analysis results with the MS quantitative data of twenty-six metabolites are shown in Table S1, of which metabolites exhibited a good diagnostic (AUC > 0.8). These differential metabolites can distinguish between normal diet rats and relatively high exposure rats with Mep exposure.

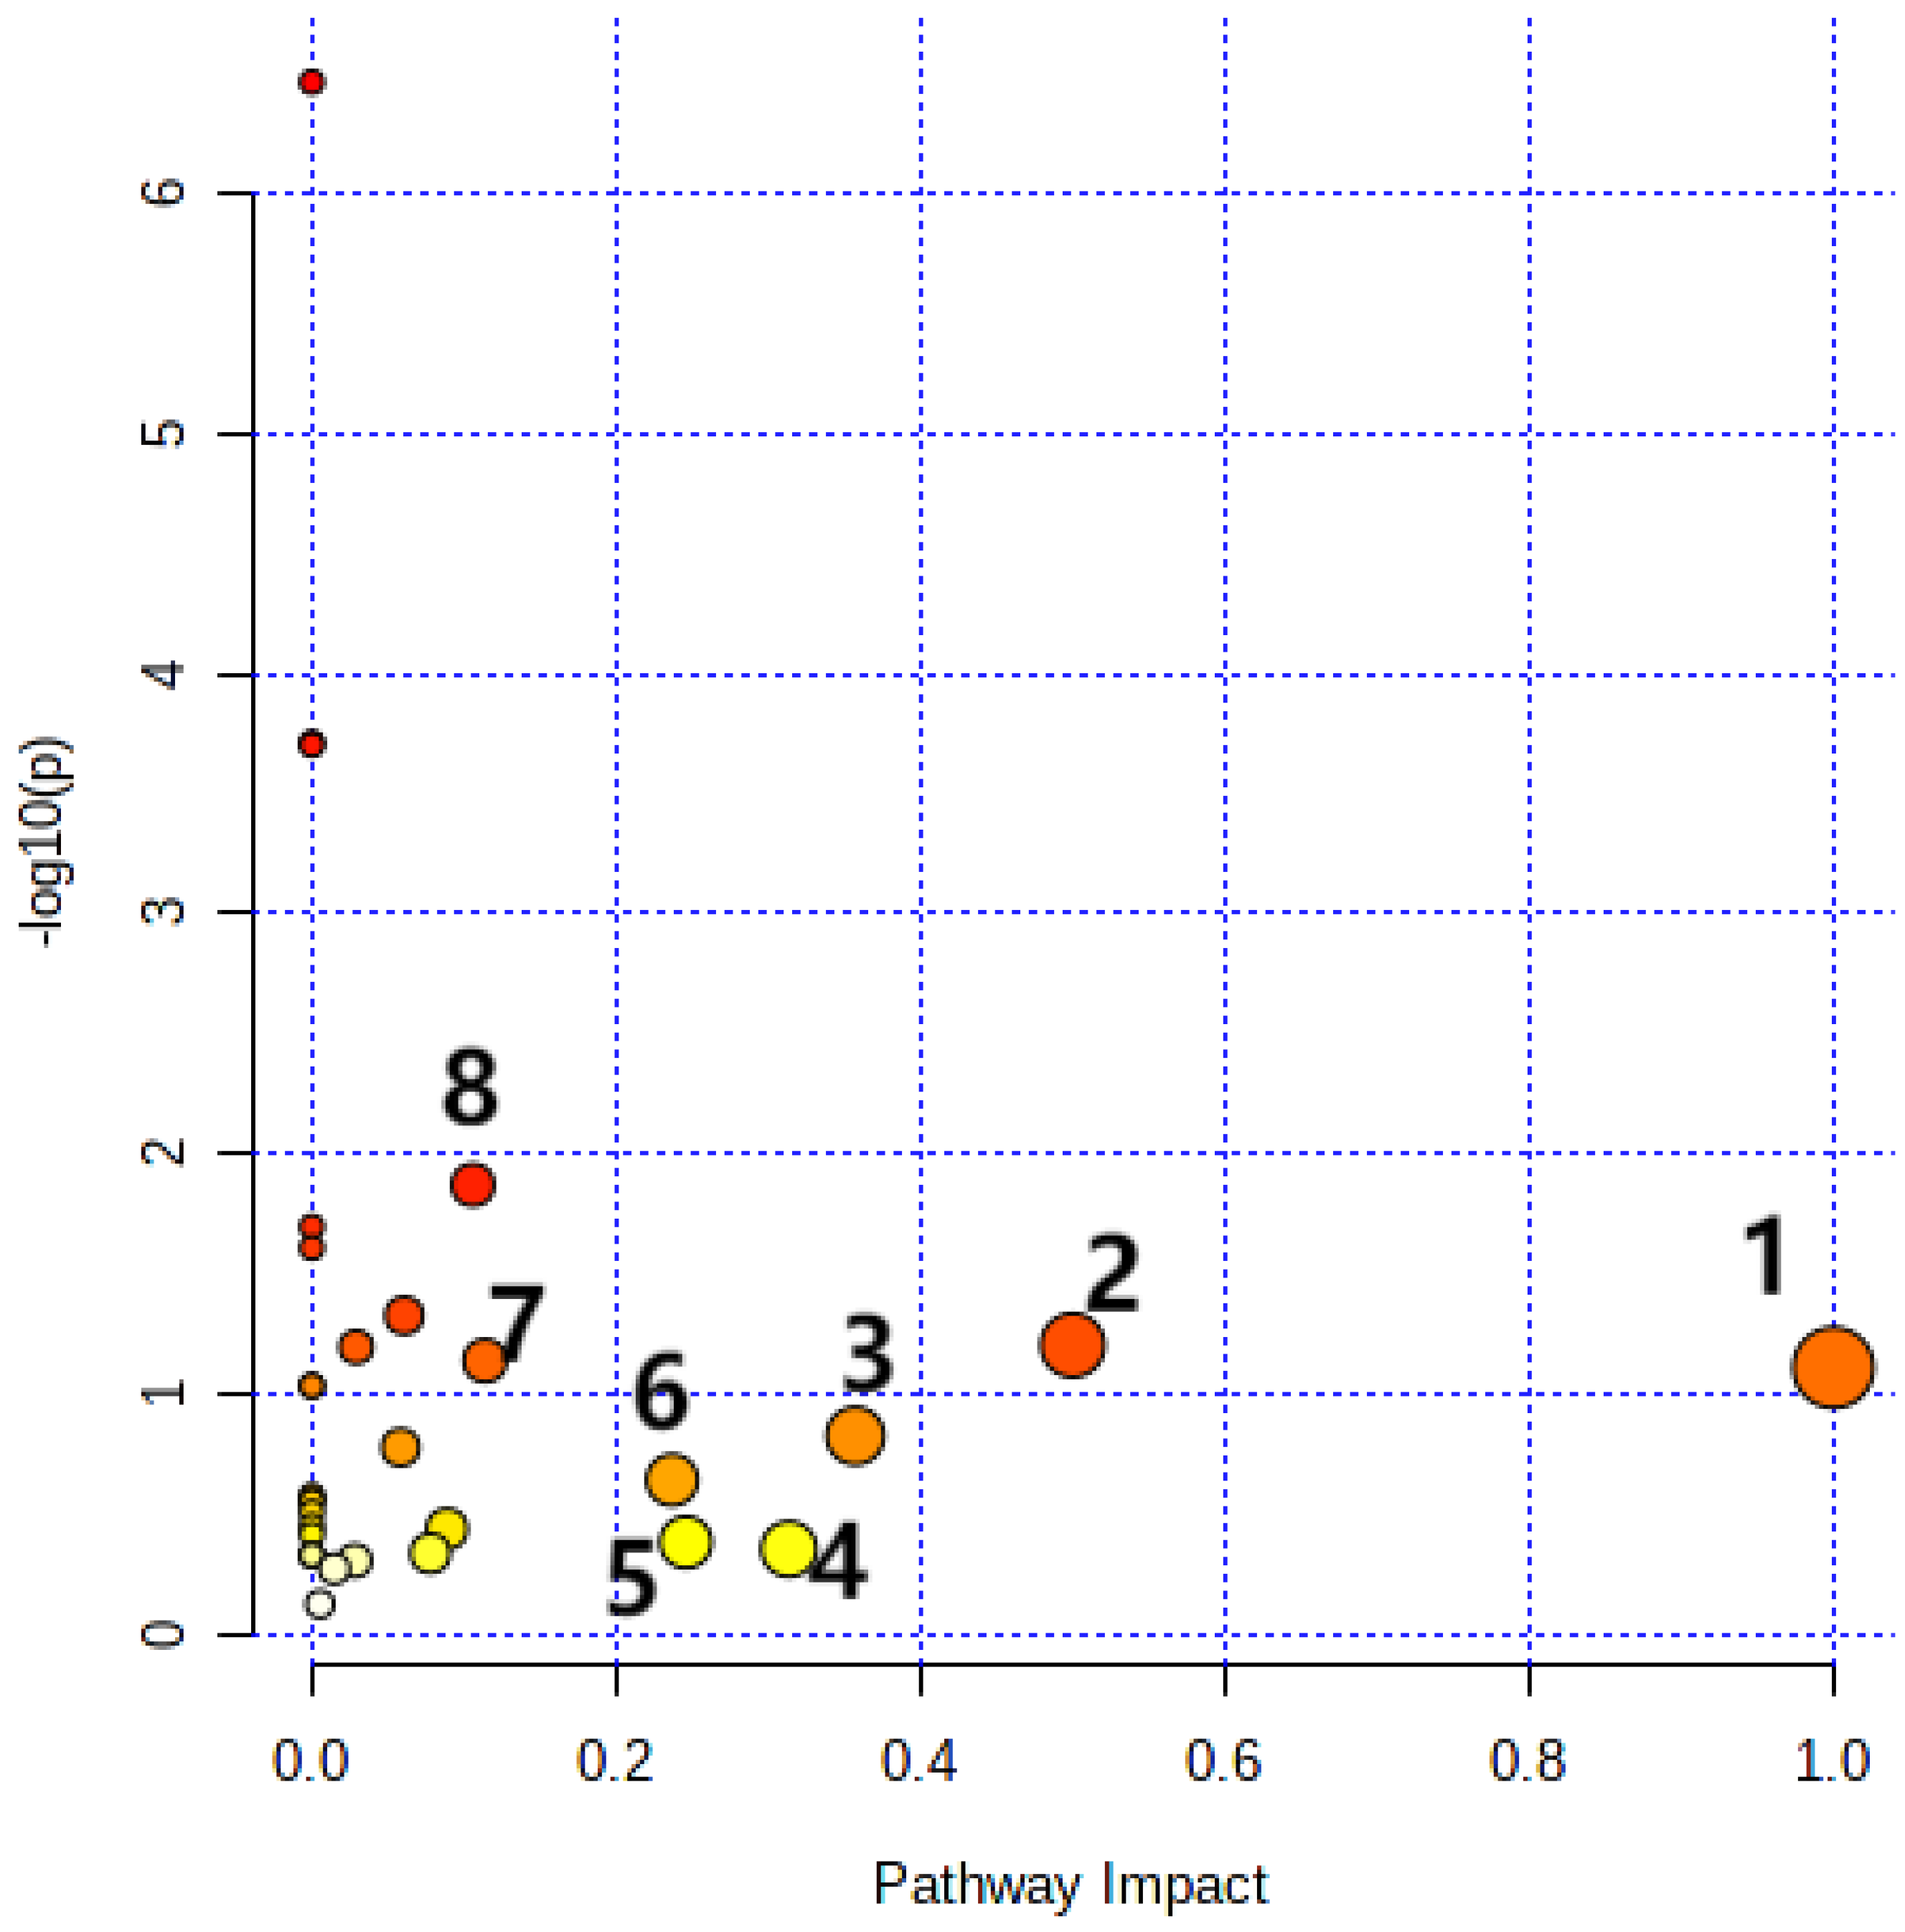
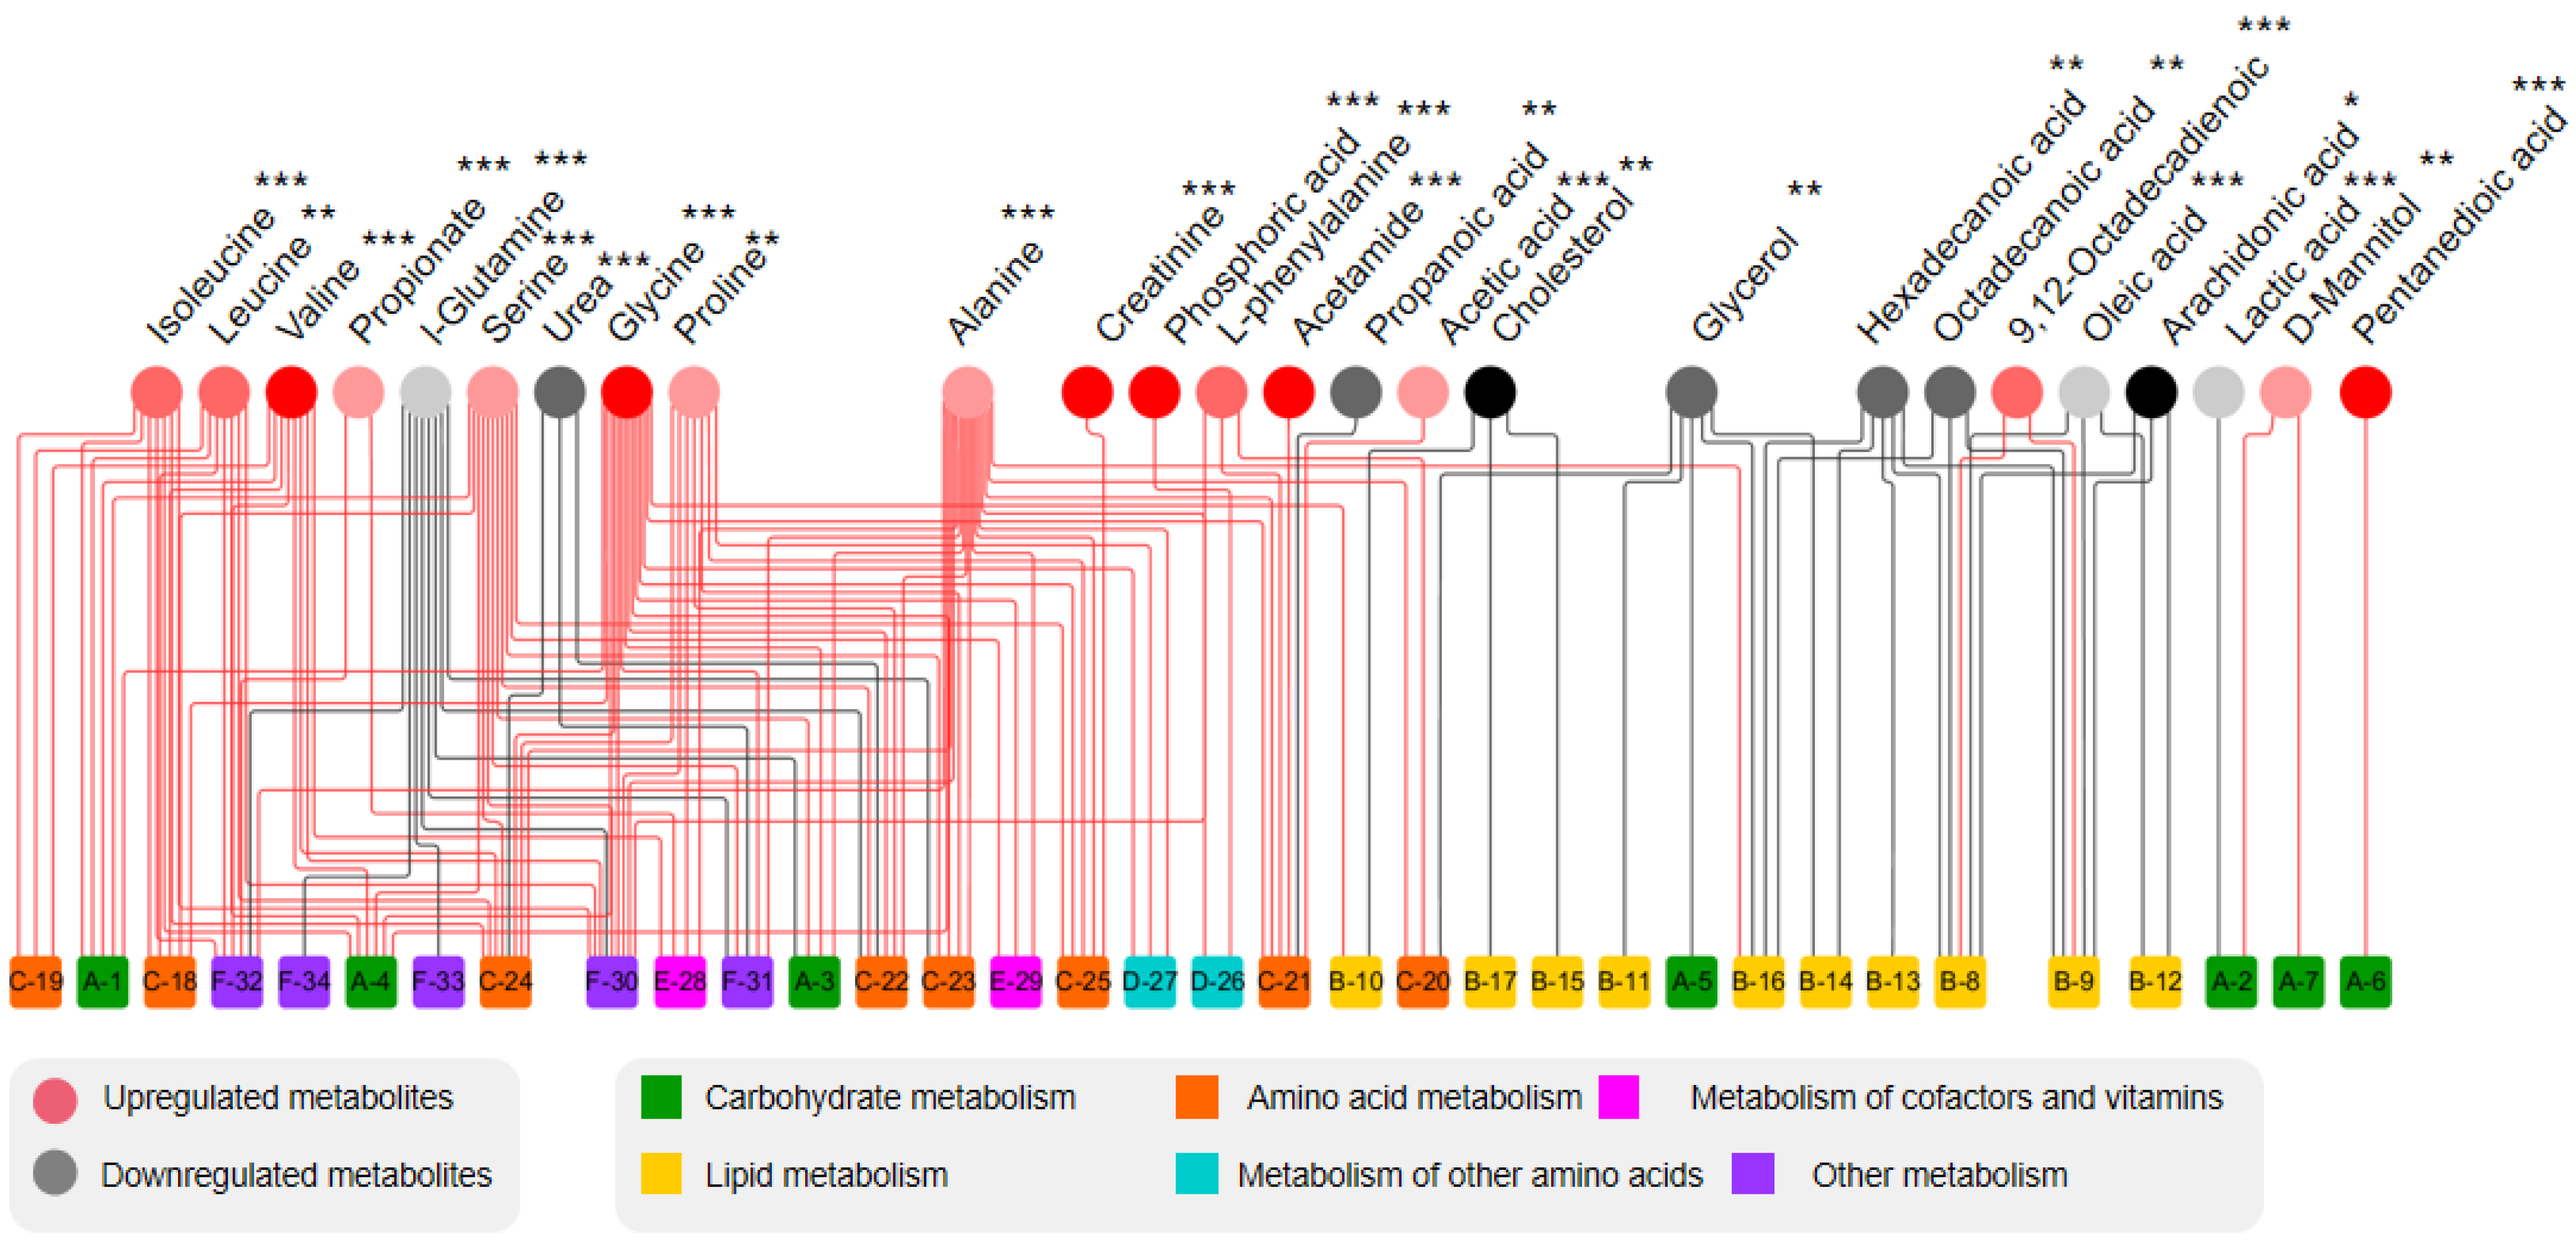
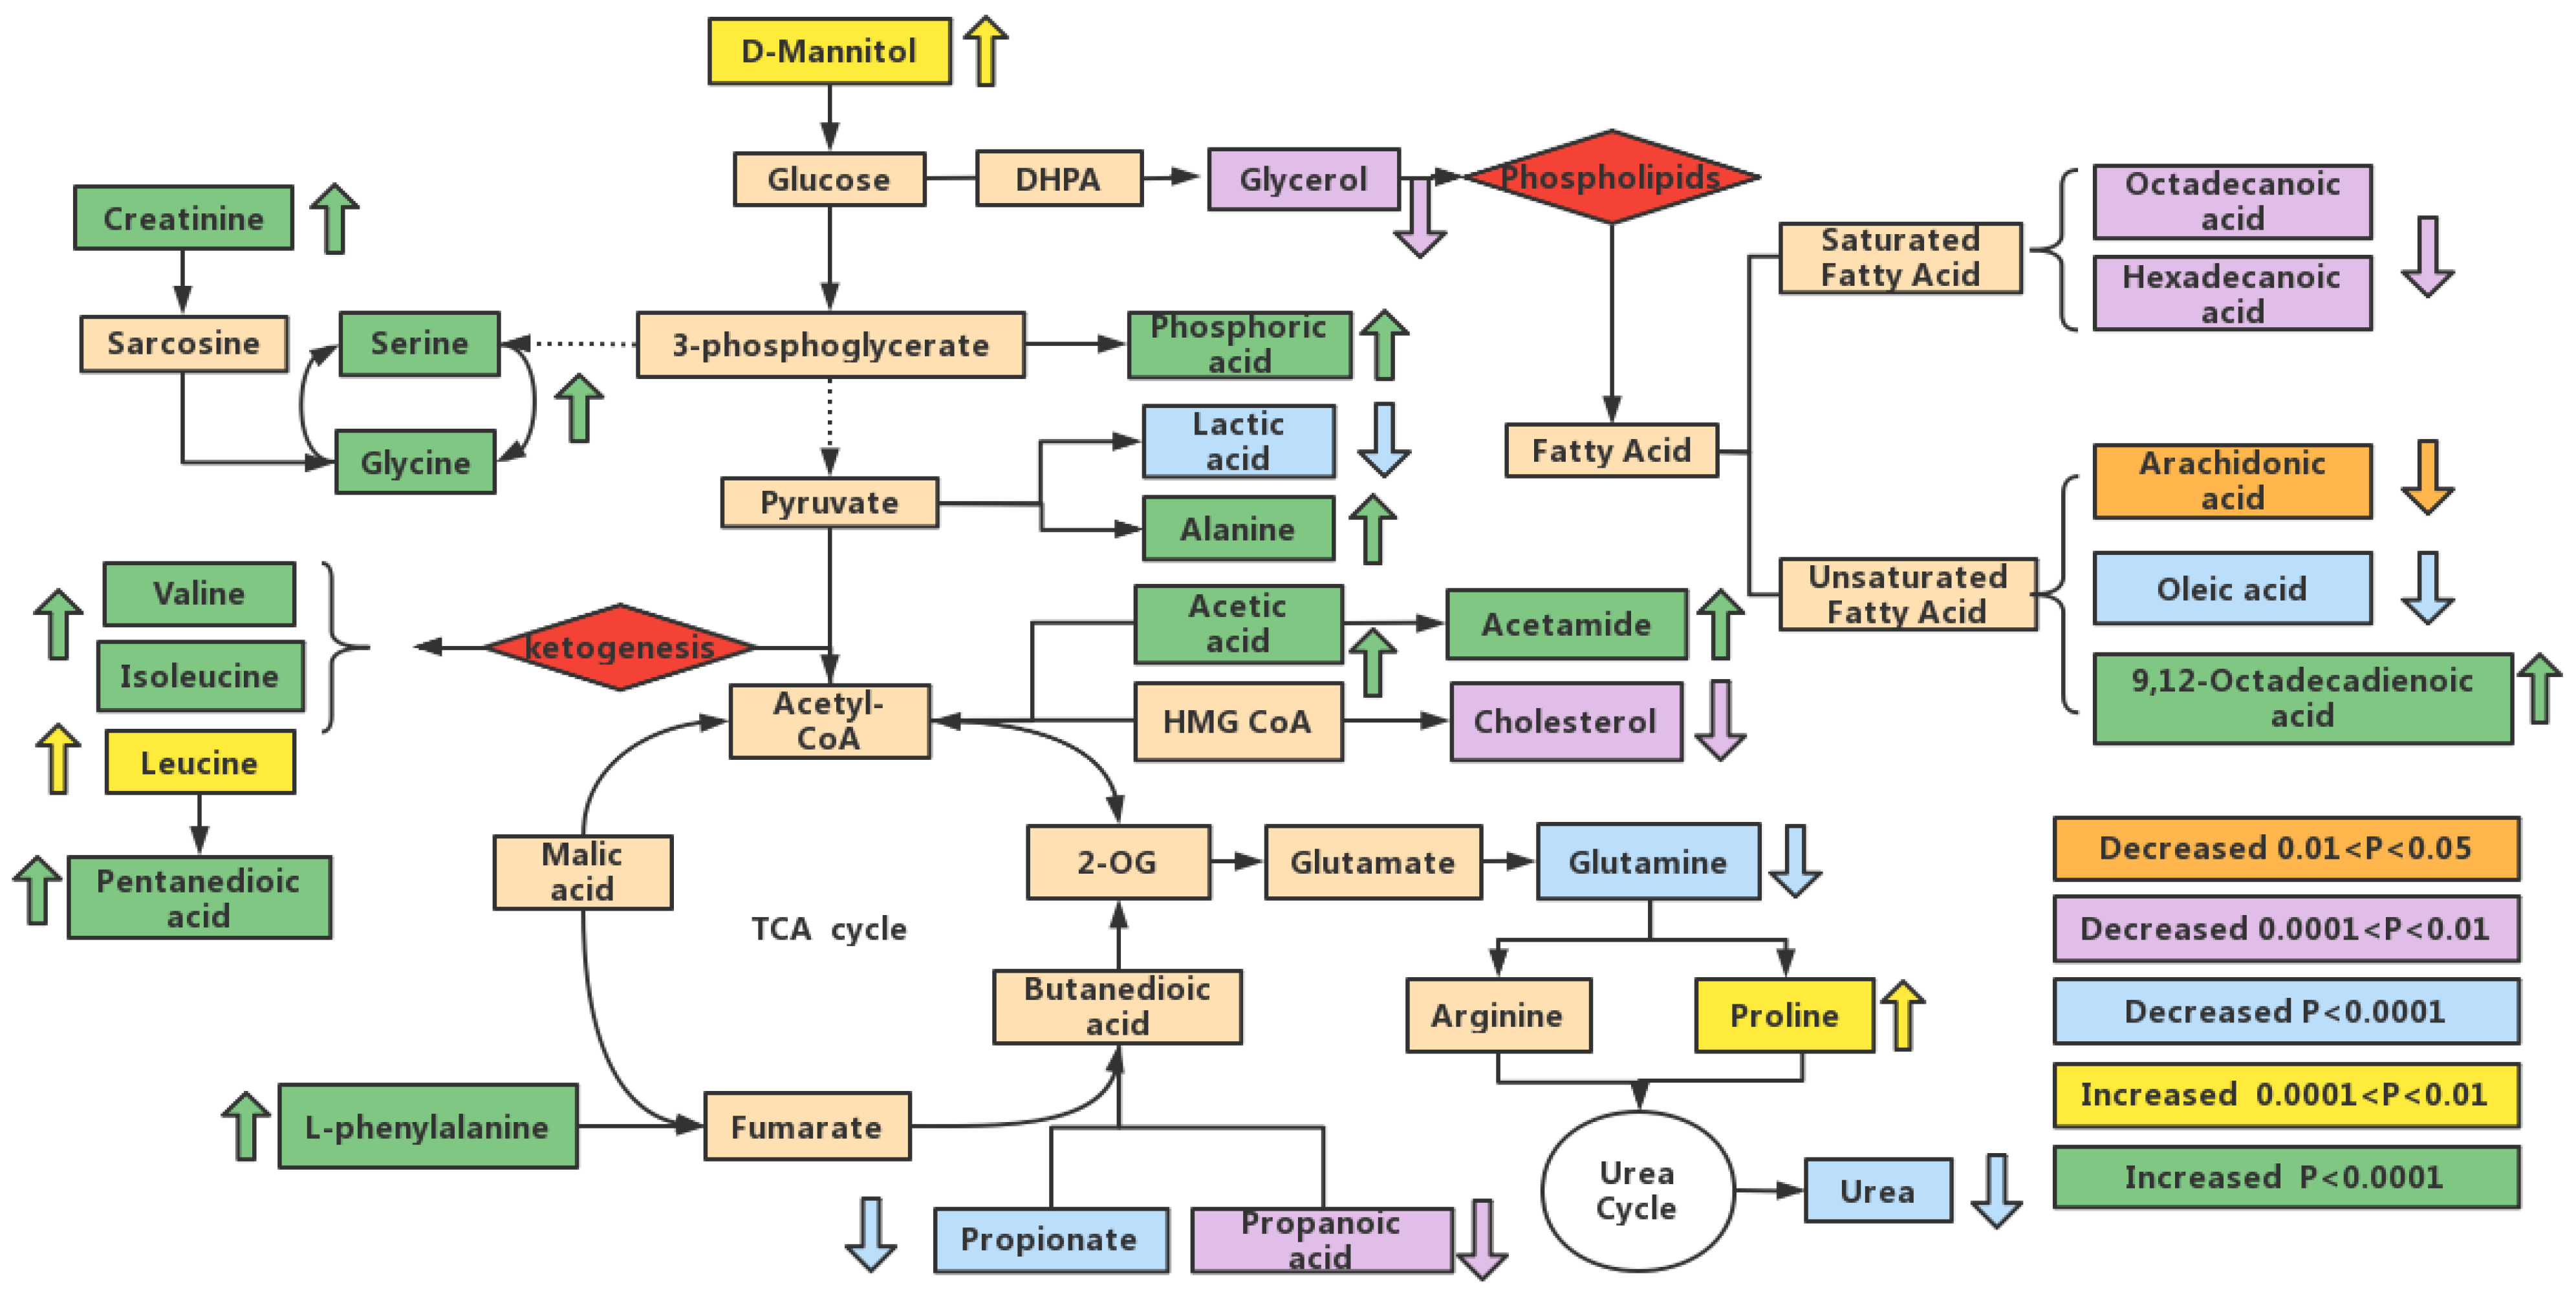
3.6. Metabolic Pathway Analysis

Twenty-six differential metabolites are imported into MetaboAnalyst 5.0 for visualization. Pathway analysis was performed by the Rattus norvegicus (rat, 81 pathways) pathway library and the compound name of differential metabolites. The impact-value threshold obtained from pathway topology analysis was 0.10. Metabolic pathways with an impact value greater than 0.10 are linoleic acid metabolism, Phenylalanine, tyrosine, and tryptophan biosynthesis, phenylalanine metabolism, arachidonic acid metabolism, Glycine, serine, and threonine metabolism, glycerolipid metabolism, Alanine, aspartate, and glutamate metabolism, and glyoxylate and dicarboxylate metabolism. A summary of the pathway analysis was shown in Figure 4 and Table 2. Linoleic acid metabolism is an important metabolic pathway with the highest impact value (Figure S2).
KEGG database were used for analyzing metabolic networks related to differential metabolites. Metabolic network was formed in MetaMapp with integrating biochemical networks and chemical relationships. Metabolomics datasets were efficiently visualized as network graphs in Cytoscape using MetaMapp. In Figure 5, levels of all carbohydrates and amino acids are upregulated. Among all the differential metabolites, acetamide has the largest change. The blue-, green-, and pink-dotted boxes represent fatty acid metabolism, amino acid metabolism, and carbohydrate metabolism, respectively. In Figure 6, there are more upregulated metabolic pathways in the Mep-exposed groups, especially carbohydrate metabolism and amino acid metabolism. For example, propionate metabolism, pyruvate metabolism, and valine, leucine, and isoleucine biosynthesis are enriched in various upregulated metabolites. In Mep-exposed groups, there are 16 upregulated and 10 downregulated differential metabolites. The key upregulated metabolite alanine participated in 16 metabolic pathways, which are mainly involved in alanine metabolism, aminoacyl-tRNA biosynthesis, and glutathione metabolism. The key downregulated metabolite is glutamine, which is mainly assigned to D-glutamine and D-glutamate metabolism, purine metabolism, and pyrimidine metabolism. Results showed that Mep-induced metabolic pathways of energy, lipids, and amino acids in adipose tissue were disturbed (Figure 7).

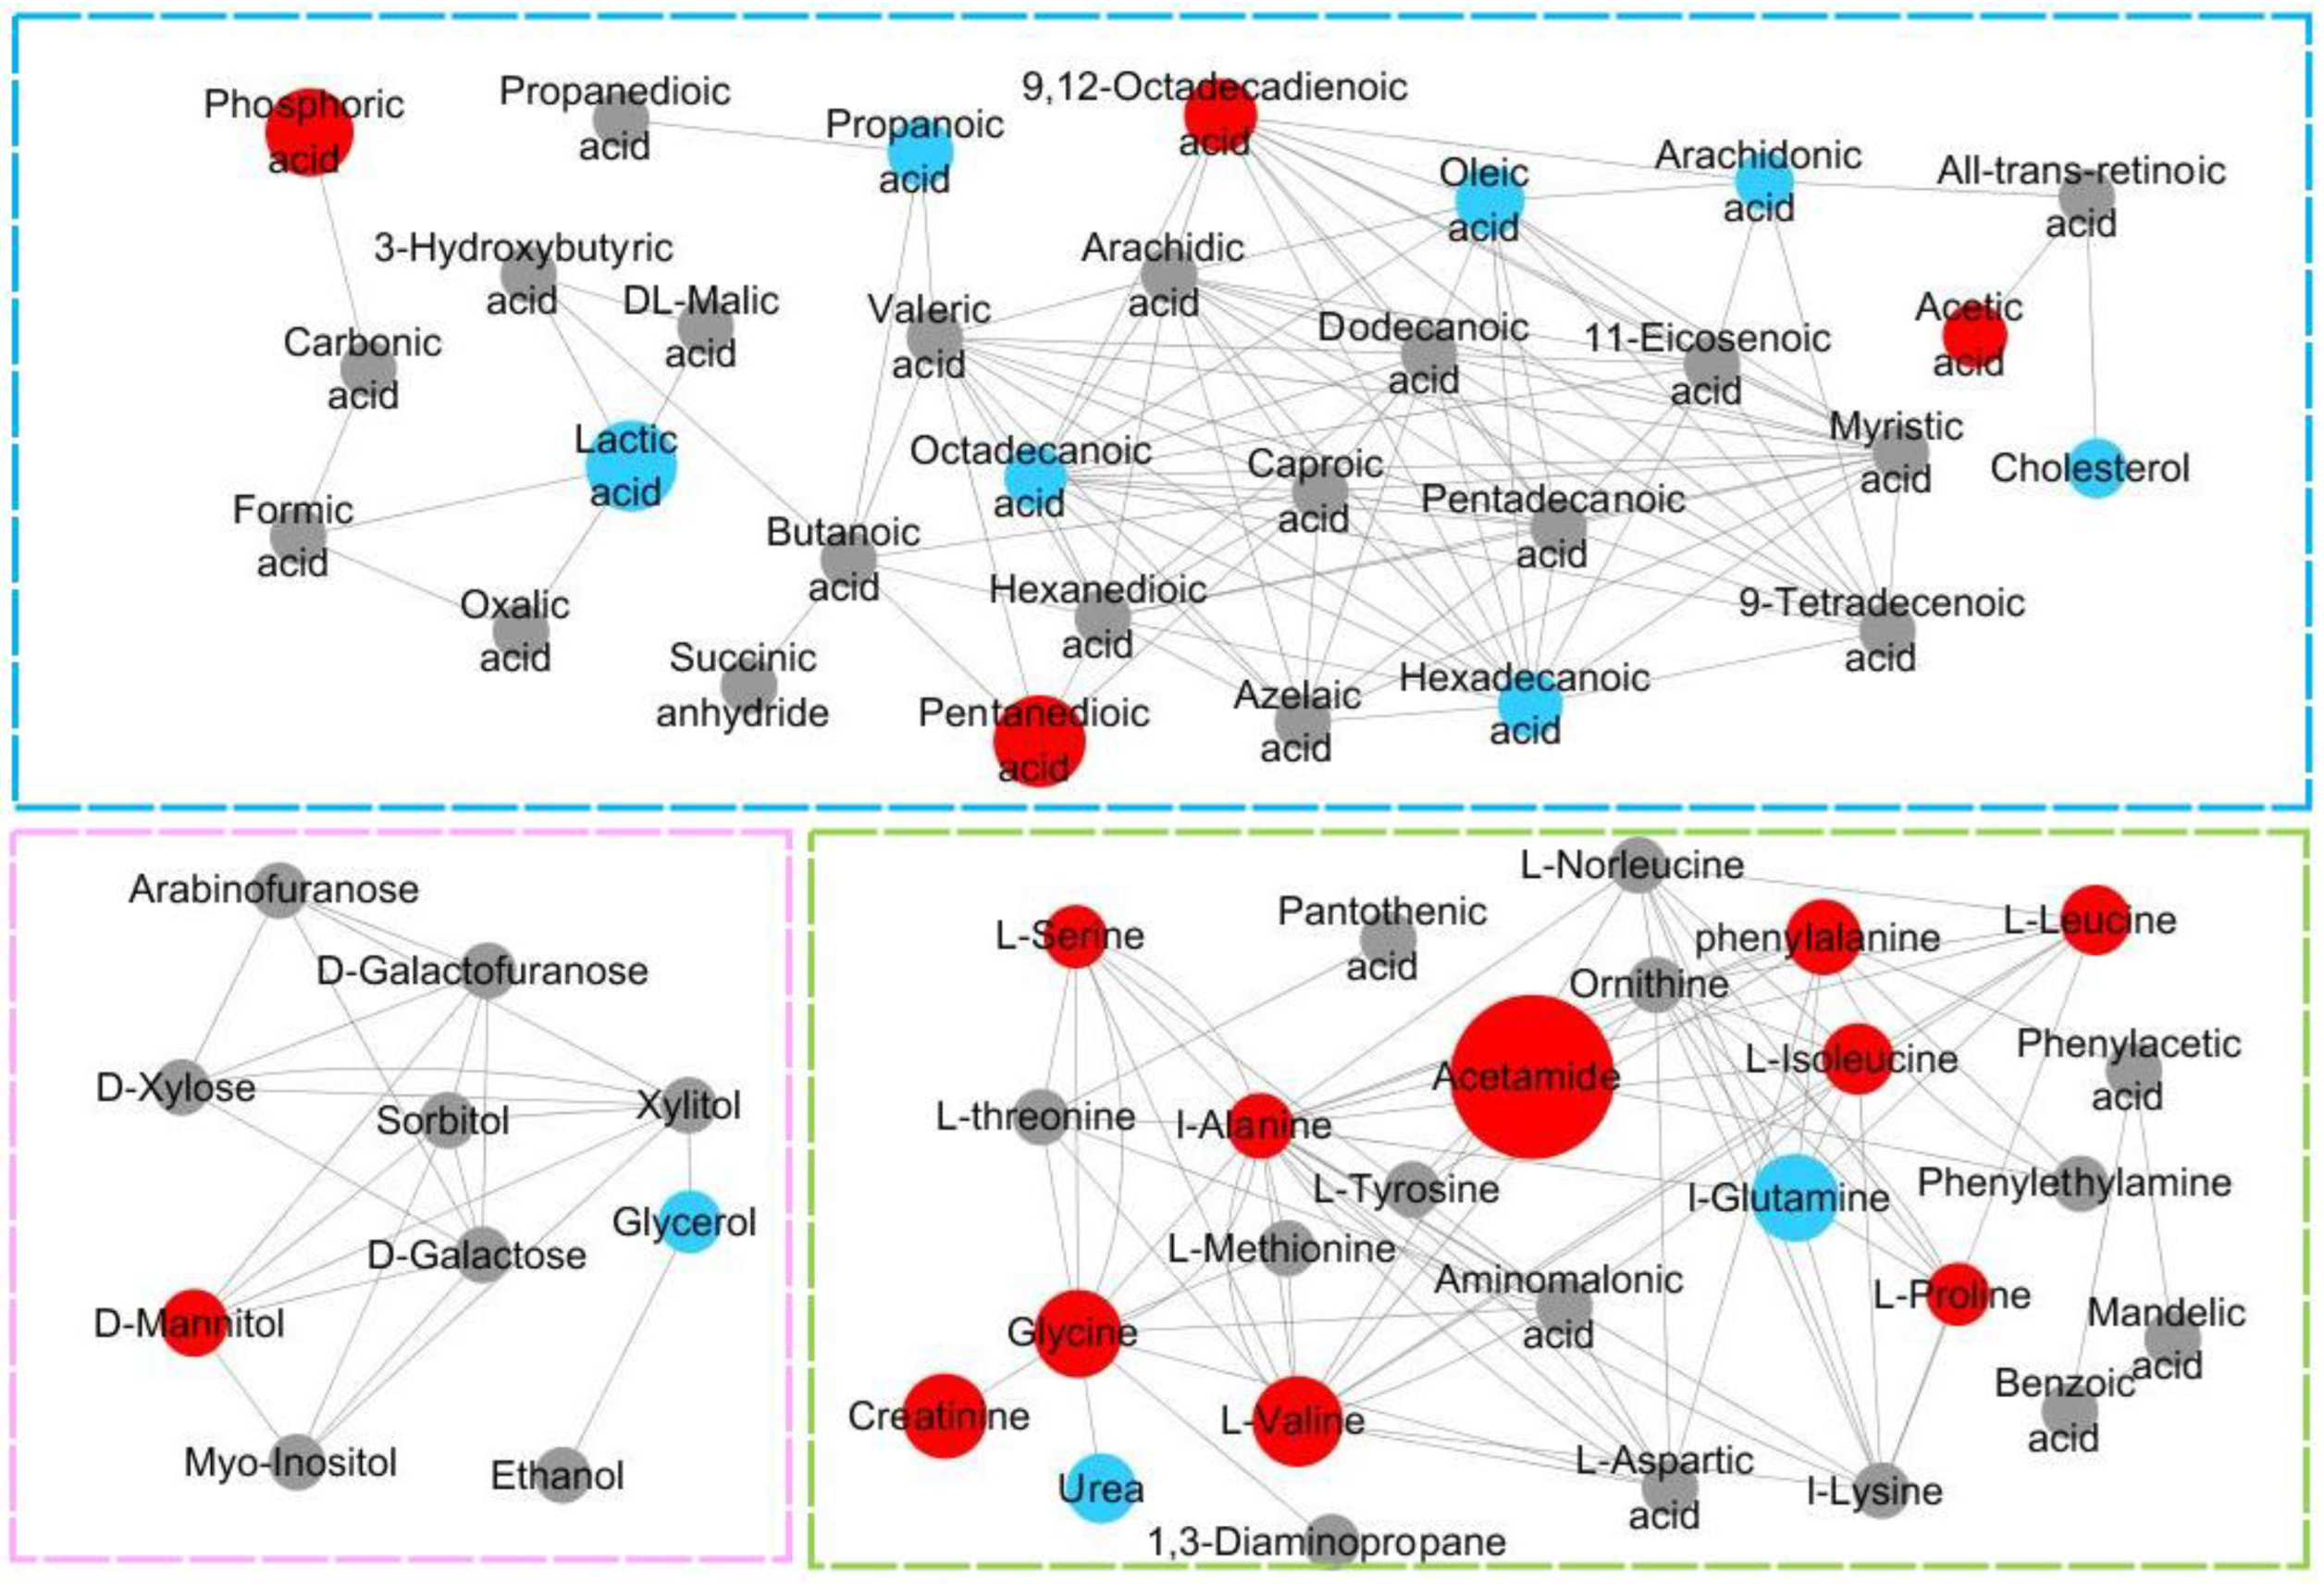
3.7. Analysis of the Metabolic Function of Adipose Tissue in Rats of ND, LD, and HD Groups

Leucine, isoleucine, and valine are three common branched-chain amino acids (BCAAs) in proteins. Elevated levels of BCAAs in adipose tissue may be due to decreased expression of BCAAs catabolic enzymes [15,16]. In addition, BCAAs help to activate NADPH oxidase and produce mitochondrial reactive oxygen species (ROS), which in turn assists cellular inflammation and oxidative stress [17]. Therefore, elevated content of BCAAs may be related to the oxidative stress response induced by Mep in rats. Glutamine is helpful to tricarboxylic acid (TCA) anaplerosis, glutathione biosynthesis, and amino acid biosynthesis [18]. Decreased glutamine indicates abnormalities in the glutamate and glutamine cycle [19]. It has been shown that glutamine is involved in signal transduction, apoptosis, and autophagy of tumor cells [20]. Serine is a main methyl donor, which is necessary for the growth of cells and tissues. It has a strong effect on the catalytic activity of many enzymes [21,22,23]. Glycine is an intermediate in metabolism of serine and threonine, which is also involved in immune functions, anti-inflammatory processes, and antioxidant responses [24]. Glycine can decrease protein carbonylation and lipid peroxidation by lowering the release of superoxide radicals [25]. The glycine, serine, and threonine pathway plays a vital role in metabolic changes. It may also provide a valuable precursor for energy metabolism in TCA cycle [26]. Compared with the ND group, an increase of glycine and serine in the HD group may cause TCA cycle disorders. Proline is one of the most important amino acids for protein synthesis in the human body. Proline metabolism plays a main role in tumor development [27]. Arginine underwent hydrolysis, the formed ornithine can be changed into polyamines and proline, and the urea from its metabolism is drained by kidneys [28]. Proline was disturbed in Mep-exposed groups, and its upregulation may be related to the decrease of metabolic level [29]. Hepatocytes deal with toxic ammonia by some biochemical reactions to produce urea. The urea cycle is closely related to other metabolic pathways, indicating that abnormal expression of almost all enzymes may alter urea cycle metabolites to help tumor growth [30]. Under normal conditions, almost all urea is filtered by the kidneys. The levels of urea in adipose tissues were significantly increased in Mep-exposed groups. The reason may be that Mep provides more raw materials for the synthesis of urea, so that urea cannot be excreted in time. It may also be because Mep induced kidney damage. Creatinine is one metabolite of glycine in the body [31]. The level of creatinine is a significant indicator for studying renal function [32]. Creatinine levels were elevated in the study, indicating insufficiency of kidney function because of exposure to Mep [33].
Fatty acids affect the physiology of cells and tissues [34]. Compared with ND group, contents of glycerol, hexadecanoic acid, octadecanoic acid, arachidonic acid, and oleic acid in HD group decreased, and the level of 9, 12-octadecadienoic acid increased. Most fatty acid metabolites were significantly reduced, suggesting an increased metabolic rate of fatty acids broken down by β-oxidation. The result may be related to the enhancement of fatty acid metabolism caused by insufficient glucose metabolic energy. Stearoyl-CoA desaturase 1(SCD1) is one rate-limiting enzyme that promotes the formation of monounsaturated fatty acids [35]. We believed that the increase in 9, 12-octadecadienoic acid and the decrease in most fatty acids in Mep-exposed groups were closely related to SCD1 enzymatic activity. Excessive consumption of fat results in increased production of ROS [36]. ROS can lead to expression and secretion of inflammatory adipokines, inducing oxidative stress [37]. Arachidonic acid (AA) is the precursor of inflammatory response factors and an important second messenger in various cell signal transduction pathways [38]. When inflammatory substances invade the organism, AA is broken down into free forms and enters the cell fluid. Therefore, it is speculated that the decrease of AA content may be due to the production of inflammatory factors after Mep exposure. Changes in hexadecanoic acid contents may be related to lipid homeostasis regulation. Hexadecanoic acid has been shown to be related to insulin response [39]. In addition, hexadecanoic acid also contributes to lipoapoptosis by producing the hazardous metabolite lysophospholipid-choline [40]. In comparison with other saturated fatty acids, octadecanoic acid lowers LDL cholesterol. Octadecanoic acid inhibits growth below a specific concentration, and higher concentrations may cause cytotoxicity. Oleic acid inhibits the increase of octadecanoic acid in expression of the intercellular adhesion molecule (ICAM-1) [41]. Cholesterol is mainly formed in the liver, which is the precursor of some steroid hormones and vitamin D3. Cholesterol is indispensable for keeping life activities of cell membranes [42]. Mep-exposed groups may have lower cholesterol levels as a result of abnormal hepatic metabolism.
Pyruvate can produce lactic acid by pyruvate dehydrogenase complex [43]. The lactic acid level of adipose tissue was trending downward, which is an indication that Mep can inhibit anaerobic glycolysis. The level of D-mannitol in HD group increased significantly. D-mannitol can alter the osmotic pressure in body, but it is not utilized by the body; it is all filtered out by the glomerulus [44]. Propionic acid has function of immunosuppressive, decreasing fatty acids level and increasing insulin sensitivity [45]. Acetic acid is a vital product of fatty acid β-oxidation, which was significantly elevated in HD group rats. It increased fatty acid β-oxidation [46]. Moreover, propionate may play important physiological functions in adipogenesis by influencing G protein-coupled receptor activity [47]. Phosphoric acid is essential for bones and kidneys [48]. Imbalances in phosphate levels can bring about bone and kidney damage.
Pentanedioic acid and acetamide showed good sensitivity and specificity. In the metabolism of amino acids, pentanedioic acid is naturally generated in the body. Defects in metabolic network of pentanedioic acid result in pentanedioic aciduria, along with accumulation of toxic by-products. It may induce severe encephalopathy [49]. The massive accumulation of pentanedioic acid in Mep-exposed groups may be due to the obstacle of amino acid metabolism. Acetic acid is the source of acetamide, which primarily influences glutamate and glutamine metabolism. The acetamide content has increased in Mep-exposed groups, which is consistent with abovementioned results. In addition, acetamide can also lead to hepatoma [50].

4. Conclusions

To our knowledge, this is the first time that untargeted metabolomics study has been performed to investigate differential metabolites and possible toxic mechanism of Mep on adipose tissue. Twenty-six differential metabolites were screened. Levels of amino acids, such as glycine, valine, leucine, isoleucine, serine, proline, phenylalanine and alanine were higher in HD group than those in ND group. By contrast, contents of fatty acids including propanoic acid, hexadecanoic acid, octadecanoic acid, arachidonic acid, and oleic acid decreased in rats exposed to Mep. In comparison with ND group, levels of propionate, phosphoric acid, acetamide, creatinine, D-mannitol, pentanedioic acid, and acetic acid increased, while contents of lactic acid, urea, cholesterol, and glycerol decreased in the HD group. Eight major perturbed metabolic pathways were found with the exposure of Mep, which were linoleic acid metabolism, phenylalanine, tyrosine, and tryptophan biosynthesis, phenylalanine metabolism, arachidonic acid metabolism, glycine, serine, and threonine metabolism, glycerolipid metabolism, alanine, aspartate, and glutamate metabolism, and glyoxylate and dicarboxylic acid metabolism. This study lays a solid foundation for clarifying the mechanism of Mep toxicity.

Supplementary Materials

The following supporting information can be downloaded at: https://www.mdpi.com/article/10.3390/foods12040867/s1, Figure S1: Changes in body weight of rats in ND, LD, and HD groups. Figure S2: Linoleic acid metabolic pathway in rats among different groups. Table S1. ROC curve and its statistical parameters. Table S2. Metabolic pathways list.

Author Contributions

Conceptualization, J.W.; data curation, C.H.; formal analysis, C.H. and X.S.; methodology, C.H., X.S., Z.S., Y.L., and J.W.; project administration, J.W.; resources, B.S.; software, X.S.; supervision, J.W. and B.S.; visualization, C.H.; writing—original draft, C.H.; writing—review and editing, J.W. funding acquisition, C.H. and J.W. All authors have read and agreed to the published version of the manuscript.

Funding

This research was funded by the National Natural Science Foundation of China (No. 31901808, 31972111), the Beijing Municipal Education Commission common project (KM201810011012), the Project of Cultivate in Natural and Social Funding of Beijing Technology and Business University (No. 19008001272), and the Project of High-level Teacher in Beijing Municipal Universities (IDHT20180506).

Institutional Review Board Statement

All experimental treatments were carried out according to the European Community guidelines for experimental animals use. The study plan was approved by the Animal Care and Use Committee of Peking University Health Science Center.

Data Availability Statement

The data supporting the results of the study are included in the article.

Acknowledgments

The authors gratefully acknowledge their school colleagues for their help.

Conflicts of Interest

The authors declare no conflict of interest.

References

  1. Li, X.; Zhang, X.; Tan, L.; Yan, H.; Yuan, Y. Heat-induced formation of N,N-dimethylpiperidinium (mepiquat) in Arabica and Robusta coffee. J. Food Sci. 2020, 85, 2754–2761. [Google Scholar] [CrossRef] [PubMed]
  2. Wermann, S.; Theurillat, V.; Verzegnassi, L.; Hofmann, J.; Kuchenbecker, R.; Constable, A.; Delatour, T.; Stadler, R.H. N, N-dimethylpiperidinium (mepiquat) Part 2. Formation in roasted coffee and barley during thermal processing. Food Addit. Contam. Part A 2014, 31, 234–241. [Google Scholar] [CrossRef] [PubMed]
  3. Li, X.; Pang, Y.; Wang, S.; Liu, H.; Yan, H.; Yuan, Y. Effects of thermal processing on N,N-dimethylpiperidinium (mepiquat) formation in meat and vegetable products. Food Res. Int. 2021, 150, 110771. [Google Scholar] [CrossRef] [PubMed]
  4. Yuan, Y.; Li, X.; Liu, H.; Qu, Y.; Zhang, W.; Yu, H.; Zhang, J.; Zhuang, H. Carnitine, a New Precursor in the Formation of the Plant Growth Regulator Mepiquat. J. Agric. Food Chem. 2018, 66, 5907–5912. [Google Scholar] [CrossRef]
  5. European Food Safety Authority. Conclusion regarding the peer review of the pesticide risk assessment of the active substance mepiquat. EFSA J. 2008, 146, 1–73. [Google Scholar]
  6. Mo, J.; Ma, Z.; Yan, S.; Cheung, N.K.M.; Yang, F.; Yao, X.; Guo, J. Metabolomic profiles in a green alga (Raphidocelis subcapitata) following erythromycin treatment: ABC transporters and energy metabolism. J. Environ. Sci. 2023, 124, 591–601. [Google Scholar] [CrossRef]
  7. Grech, O.; Seneviratne, S.Y.; Alimajstorovic, Z.; Yiangou, A.; Mitchell, J.L.; Smith, T.B.; Mollan, S.P.; Lavery, G.G.; Ludwig, C.; Sinclair, A.J. Nuclear Magnetic Resonance Spectroscopy Metabolomics in Idiopathic Intracranial Hypertension to Identify Markers of Disease and Headache. Neurology 2022, 99, e1702–e1714. [Google Scholar] [CrossRef]
  8. Li, J.; Luu, L.D.W.; Wang, X.; Cui, X.; Huang, X.; Fu, J.; Zhu, X.; Li, Z.; Wang, Y.; Tai, J. Metabolomic analysis reveals potential biomarkers and the underlying pathogenesis involved in Mycoplasma pneumoniae pneumonia. Emerg. Microbes Infect. 2022, 11, 593–605. [Google Scholar] [CrossRef]
  9. Wang, Y.; Wang, Q.; Zhou, L.; Zeng, Z.; Zhao, C.; You, L.; Lu, X.; Liu, X.; Ouyang, R.; Wang, Y.; et al. Metabolomics insights into the prenatal exposure effects of polybrominated diphenyl ethers on neonatal birth outcomes. Sci. Total Environ. 2022, 836, 155601. [Google Scholar] [CrossRef]
  10. Zhang, Q.; Deng, X.; Wang, J. The effects of mepiquat chloride (DPC) on the soluble protein content and the activities of protective enzymes in cotton in response to aphid feeding and on the activities of detoxifying enzymes in aphids. BMC Plant Biol. 2022, 22, 213. [Google Scholar] [CrossRef]
  11. van Dam, A.D.; Boon, M.R.; Berbee, J.F.P.; Rensen, P.C.N.; van Harmelen, V. Targeting white, brown and perivascular adipose tissue in atherosclerosis development. Eur. J. Pharmacol. 2017, 816, 82–92. [Google Scholar] [CrossRef]
  12. Jones, O.A.H.; Murfitt, S.; Svendsen, C.; Turk, A.; Turk, H.; Spurgeon, D.J.; Walker, L.A.; Shore, R.F.; Long, S.M.; Griffin, J.L. Comparisons of metabolic and physiological changes in rats following short term oral dosing with pesticides commonly found in food. Food Chem. Toxicol. 2013, 59, 438–445. [Google Scholar] [CrossRef] [Green Version]
  13. Hu, C.; Zhang, Y.; Liu, G.; Liu, Y.; Wang, J.; Sun, B. Untargeted metabolite profiling of adipose tissue in hyperlipidemia rats exposed to hawthorn ethanol extracts. J. Food Sci. 2019, 84, 717–725. [Google Scholar] [CrossRef]
  14. Hu, C.; Li, R.; Wang, J.; Liu, Y.; Wang, J.; Sun, B. Untargeted metabolite profiling of liver in mice exposed to 2-methylfuran. J. Food Sci. 2021, 86, 242–250. [Google Scholar] [CrossRef]
  15. Rossmeislova, L.; Gojda, J.; Smolkova, K. Pancreatic cancer: Branched-chain amino acids as putative key metabolic regulators? Cancer Metastasis Rev. 2021, 40, 1115–1139. [Google Scholar] [CrossRef]
  16. Shou, J.; Chen, P.; Xiao, W. The effects of BCAAs on insulin resistance in athletes. J. Nutr. Sci. Vitaminol. 2019, 65, 383–389. [Google Scholar] [CrossRef] [Green Version]
  17. Zhenyukh, O.; Gonzalez-Amor, M.; Rodrigues-Diez, R.R.; Esteban, V.; Ruiz-Ortega, M.; Salaices, M.; Mas, S.; Briones, A.M.; Egido, J. Branched-chain amino acids promote endothelial dysfunction through increased reactive oxygen species generation and inflammation. J. Cell. Mol. Med. 2018, 22, 4948–4962. [Google Scholar] [CrossRef]
  18. Bispo, D.S.C.; Jesus, C.S.H.; Correia, M.; Ferreira, F.; Bonifazio, G.; Goodfellow, B.J.; Oliveira, M.B.; Mano, J.F.; Gil, A.M. NMR Metabolomics Assessment of Osteogenic Differentiation of Adipose-Tissue-Derived Mesenchymal Stem Cells. J. Proteome Res. 2022, 21, 654–670. [Google Scholar] [CrossRef]
  19. Parihar, R.; Shukla, R.; Baishya, B.; Kalita, J.; Haldar, R.; Misra, U.K. NMR based CSF metabolomics in tuberculous meningitis: Correlation with clinical and MRI findings. Metab. Brain Dis. 2022, 37, 773–785. [Google Scholar] [CrossRef]
  20. Altman, B.J.; Stine, Z.E.; Dang, C.V. From Krebs to clinic: Glutamine metabolism to cancer therapy. Nat. Rev. Cancer 2016, 16, 619–634. [Google Scholar] [CrossRef] [Green Version]
  21. McFadden, J.W.; Girard, C.L.; Tao, S.; Zhou, Z.; Bernard, J.K.; Duplessis, M.; White, H.M. Symposium review: One-carbon metabolism and methyl donor nutrition in the dairy cow. J. Dairy Sci. 2020, 103, 5668–5683. [Google Scholar] [CrossRef]
  22. Metcalf, J.S.; Dunlop, R.A.; Powell, J.T.; Banack, S.A.; Cox, P.A. L-Serine: A Naturally-Occurring Amino Acid with Therapeutic Potential. Neurotox. Res. 2018, 33, 213–221. [Google Scholar] [CrossRef] [PubMed]
  23. Ovrehus, M.A.; Bruheim, P.; Ju, W.; Zelnick, L.R.; Langlo, K.A.; Sharma, K.; de Boer, I.H.; Hallan, S.I. Gene Expression Studies and Targeted Metabolomics Reveal Disturbed Serine, Methionine, and Tyrosine Metabolism in Early Hypertensive Nephrosclerosis. Kidney Int. 2019, 4, 321–333. [Google Scholar]
  24. Imenshahidi, M.; Hossenzadeh, H. Effects of glycine on metabolic syndrome components: A review. J. Endocrinol. Investig. 2022, 45, 927–939. [Google Scholar] [CrossRef] [PubMed]
  25. Wang, T.; Li, S.; Wu, Y.; Yan, X.; Zhu, Y.; Jiang, Y.; Jiang, F.; Liu, W. Mechanistic Investigation of Xuebijing for Treatment of Paraquat-Induced Pulmonary Fibrosis by Metabolomics and Network Pharmacology. ACS Omega 2021, 6, 19717–19730. [Google Scholar] [CrossRef]
  26. Ye, J.; Lin, X.; Cheng, Z.; Su, Y.; Li, W.; Ali, F.; Zheng, J.; Peng, B. Identification and efficacy of glycine, serine and threonine metabolism in potentiating kanamycin-mediated killing of Edwardsiella piscicida. J. Proteom. 2018, 183, 34–44. [Google Scholar] [CrossRef]
  27. Sawicka, M.M.; Sawicki, K.; Lyson, T.; Politynska, B.; Miltyk, W. Proline Metabolism in Malignant Gliomas: A Systematic Literature Review. Cancers 2022, 14, 2030. [Google Scholar] [CrossRef]
  28. Xie, Y.; Feng, W.; Liu, M.; Xie, J.; Yu, L.; Gong, X.; Li, Y.; Peng, C. Investigation of Efficacy Enhancing and Toxicity Reducing Mechanism of Combination of Aconiti Lateralis Radix Praeparata and Paeoniae Radix Alba in Adjuvant-Induced Arthritis Rats by Metabolomics. Evid.-Based Complement. Alternat. Med. 2019, 2019, 9864841. [Google Scholar] [CrossRef] [Green Version]
  29. Dong, M.; Du, H.; Li, X.; Zhang, L.; Wang, X.; Wang, Z.; Jiang, H. Discovery of Biomarkers and Potential Mechanisms of Agarwood Incense Smoke Intervention by Untargeted Metabolomics and Network Pharmacology. Drug Des. Dev. Ther. 2022, 16, 265–278. [Google Scholar] [CrossRef]
  30. Liu, Y.; Mei, B.; Chen, D.; Cai, L. GC-MS metabolomics identifies novel biomarkers to distinguish tuberculosis pleural effusion from malignant pleural effusion. J. Clin. Lab. Anal. 2021, 35, e23706. [Google Scholar] [CrossRef]
  31. Guo, B.; Li, Y.; Huang, G.; Yu, L. Fatty acid esters of 3-monochloropropanediol: A review. Annu. Rev. Food Sci. Technol. 2019, 10, 259–284. [Google Scholar] [CrossRef]
  32. Stanimirova, I.; Banasik, M.; Zabek, A.; Dawiskiba, T.; Koscielska-Kasprzak, K.; Wojtowicz, W.; Krajewska, M.; Janczak, D.; Mlynarz, P. Serum metabolomics approach to monitor the changes in metabolite profiles following renal transplantation. Sci. Rep. 2020, 10, 17223. [Google Scholar] [CrossRef]
  33. Gill, S.S.; Kavanagh, M.; Cherry, W.; Barker, M.; Weld, M.; Cooke, G.M. A 28-day Gavage Toxicity Study in Male Fischer 344 Rats with 2-methylfuran. Toxicol. Pathol. 2014, 42, 352–360. [Google Scholar] [CrossRef] [Green Version]
  34. Deng, F.; Pan, J.; Zheng, P.; Xia, J.; Yin, B.; Liang, W.; Li, Y.; Wu, J.; Xu, F.; Wu, Q.; et al. Metabonomics reveals peripheral and central short-chain fatty acid and amino acid dysfunction in a naturally occurring depressive model of macaques. Neuropsychiatr. Dis. Treat. 2019, 15, 1077–1088. [Google Scholar] [CrossRef] [Green Version]
  35. Yan, X.; Li, L.; Liu, P.; Xu, J.; Wang, Z.; Ding, L.; Yang, L. Targeted metabolomics profiles serum fatty acids by HFD induced non-alcoholic fatty liver in mice based on GC-MS. J. Pharm. Biomed. Anal. 2022, 211, 114620. [Google Scholar] [CrossRef]
  36. Li, X.; Shen, Y.; Wu, G.; Qi, X.; Zhang, H.; Wang, L.; Qian, H. Determination of key active components in different edible oils affecting lipid accumulation and reactive oxygen species production in HepG2 cells. J. Agric. Food Chem. 2018, 66, 11943–11956. [Google Scholar] [CrossRef]
  37. Annie, M.A.S.; Prem, S.S.; Jayasuriya, R.; Ganesh, G.; Ramkumar, K.M.; Sarada, D.V.L. The pivotal role of Nrf2 activators in adipocyte biology. Pharmacol. Res. 2021, 173, 105853. [Google Scholar] [CrossRef]
  38. Li, Y.; Liu, J.; Zhou, H.; Liu, J.; Xue, X.; Wang, L.; Ren, S. Liquid chromatography-mass spectrometry method for discovering the metabolic markers to reveal the potential therapeutic effects of naringin on osteoporosis. J. Chromatogr. B Anal. Technol. Biomed. Life Sci. 2022, 1194, 123170. [Google Scholar] [CrossRef]
  39. Nguyen, H.T.; Li, L.; Eguchi, A.; Agusa, T.; Yamamoto, K.; Kannan, K.; Kim, E.Y.; Iwata, H. Effects of gestational exposure to bisphenol A on the hepatic transcriptome and lipidome of rat dams: Intergenerational comparison of effects in the offspring. Sci. Total Environ. 2022, 826, 153990. [Google Scholar] [CrossRef]
  40. Kakisaka, K.; Cazanave, S.C.; Fingas, C.D.; Guicciardi, M.E.; Bronk, S.F.; Werneburg, N.W.; Mott, J.L.; Gores, G.J. Mechanisms of lysophosphatidylcholine-induced hepatocyte lipoapoptosis. Am. J. Physiol. 2012, 302, G77–G84. [Google Scholar] [CrossRef] [Green Version]
  41. Banan, A.; Harvey, K.A.; Whitley, P.; Xu, Z.; Walker, C.; Pavlina, T.M.; Zaloga, G.P.; Siddiqui, R.A. Oleic acid prevents stearic acid-induced inhibition of cell growth and pro-inflammatory responses in human aortic endothelial cells. FASEB J. 2010, 24, 3470–3480. [Google Scholar] [CrossRef]
  42. Subczynski, W.K.; Pasenkiewicz, G.M.; Widomska, J.; Mainali, L.; Raguz, M. High Cholesterol/Low Cholesterol: Effects in Biological Membranes: A Review. Cell Biochem. Biophys. 2017, 75, 369–385. [Google Scholar] [CrossRef] [PubMed]
  43. Su, Z.; Ling, X.; Ji, K.; Huang, H.; Liu, X.; Yin, C.; Zhu, H.; Guo, Y.; Mo, Y.; Lu, Y.; et al. H-1 NMR-based urinary metabonomic study of the antidiabetic effects of Rubus Suavissimus, S. Lee in STZ-induced T1DM rats. J. Chromatogr. B Anal. Technol. Biomed. Life Sci. 2020, 1158, 122347. [Google Scholar] [CrossRef] [PubMed]
  44. Polderman, K.H.; van de Kraats, G.; Dixon, J.M.; Vandertop, W.P.; Girbes, A.R.J. Increases in spinal fluid osmolarity induced by mannitol. Crit. Care Med. 2003, 31, 584–590. [Google Scholar] [CrossRef]
  45. Al-Lahham, S.H.; Peppelenbosch, M.P.; Roelofsen, H.; Vonk, R.J.; Venema, K. Biological effects of propionic acid in humans; metabolism, potential applications and underlying mechanisms. Biochim. Biophys. Acta (BBA)-Mol. Cell Biol. Lipids 2010, 1801, 1175–1183. [Google Scholar] [CrossRef] [PubMed]
  46. Chen, R.; Liao, C.; Guo, Q.; Wu, L.; Zhang, L.; Wang, X. Combined systems pharmacology and fecal metabonomics to study the biomarkers and therapeutic mechanism of type 2 diabetic nephropathy treated with Astragalus and Leech. RSC Adv. 2018, 8, 27448–27463. [Google Scholar] [CrossRef] [Green Version]
  47. Al Mahri, S.; Malik, S.S.; Al Ibrahim, M.; Haji, E.; Dairi, G.; Mohammad, S. Free Fatty Acid Receptors (FFARs) in Adipose: Physiological Role and Therapeutic Outlook. Cells 2022, 11, 750. [Google Scholar] [CrossRef]
  48. Alasmari, F.; Assiri, M.A.; Ahamad, S.R.; Aljumayi, S.R.; Alotaibi, W.H.; Alhamdan, M.M.; Alhazzani, K.; Alharbi, M.; Alqahtani, F.; Alasmari, A.F. Serum Metabolomic Analysis of Male Patients with Cannabis or Amphetamine Use Disorder. Metabolites 2022, 12, 179. [Google Scholar] [CrossRef]
  49. Wen, C.; Wang, Z.; Zhang, M.; Wang, S.; Geng, P.; Sun, F.; Chen, M.; Lin, G.; Hu, L.; Ma, J.; et al. Metabolic changes in rat urine after acute paraquat poisoning and discriminated by support vector machine. Biomed. Chromatogr. 2016, 30, 75–80. [Google Scholar] [CrossRef]
  50. Dybing, E.; Soderlund, E.J.; Gordon, W.P.; Holme, J.A.; Christensen, T.; Becher, G.; Rivedal, E.; Thorgeirsson, S.S. Studies on the mechanism of acetamide hepatocarcinogenicity. Pharmacol. Toxicol. 1987, 60, 9–16. [Google Scholar] [CrossRef]
Figure 1. HE staining of adipose tissues from different groups (original magnification: 400×) (ND group: Normal Diet group, n = 10; LD group: Low-dose Diet group, n = 10; HD group: High-dose Diet group, n = 10).
Foods 12 00867 g001
Figure 2. PCA and PLS-DA score plot derived from the GC-MS analysis of adipose tissue from the ND, LD, and HD groups (A) PCA score map (R2X = 77.7%, Q2 = 56.6%); (B) PLS-DA score map (R2X = 76.7%, R2Y = 84 %, Q2 = 73.3%); (C) Permutation experiment of PLS-DA model (n = 999) R2 = (0.0, 0.175), Q2 = (0.0, −0.403) (PCA: Principal Component Analysis; PLS-DA: Partial Least Squares Discrimination Analysis; ND group: Normal Diet group, n = 10; LD group: Low-dose Diet group, n = 10; HD group: High-dose Diet group, n = 10).
Foods 12 00867 g002
Figure 3. Boxplots of differential metabolites in adipose tissue of rats in HD, LD, and ND groups: (a) Glycine; (b) Isoleucine; (c) Octadecanoic acid; (d) Glutamine (“**” means p < 0.01, “***” means p < 0.001. ND group: Normal Diet group, n = 10; LD group: Low-dose Diet group, n = 10; HD group: High-dose Diet group, n = 10).
Foods 12 00867 g003
Figure 4. Disturbed metabolic pathways in adipose tissue of rats from three groups. (1) Linoleic acid metabolism; (2) Phenylalanine, tyrosine, and tryptophan biosynthesis; (3) Phenylalanine metabolism; (4) Arachidonic acid metabolism; (5) Glycine, serine, and threonine metabolism; (6) Glycerolipid metabolism; (7) Alanine, aspartate, and glutamate metabolism; (8) Glyoxylate and dicarboxylate metabolism.
Foods 12 00867 g004
Figure 5. Metabolic pathways associated with Mep exposure when comparing with ND group. The depicted networks revealed red nodes represent significantly upregulated metabolites, blue nodes represent significantly downregulated metabolites that were involved in the affected metabolites, and gray nodes represent no significant changes in metabolites. The size of the node was positively correlated with the fold change between the HD group and ND group (Mep: Mepiquat; ND group: Normal Diet group, n = 10; LD group: Low-dose Diet group, n = 10; HD group: High-dose Diet group, n = 10).
Foods 12 00867 g005
Figure 6. Network analysis of differential metabolites and metabolic pathways at Mep-exposed groups shows that there are twenty-six differential metabolites. “*” means p < 0.05, “**” means p < 0.001, “***” means p < 0.0001. The red circles and black circles show upregulation and downregulation of metabolites, respectively. Intensity of the color displays the metabolite fold change. A total of thirty-four metabolic pathways (squares) were classified as six metabolic pathways (Table S2), with different metabolites connected by the red line (upregulation) and black line (downregulation).
Foods 12 00867 g006
Figure 7. Potential metabolic pathways disturbed in rats after Mep exposure.
Foods 12 00867 g007
Table 1. Differential metabolites detected in adipose tissue of rats in the high-dose group by metabolomic analysis based on GC-MS.
MetaboliteRT (min)p-ValueVIPFold Change (HD-ND)FDRTrendMetabolic Pathways
Lactic acid5.301.90 × 10−52.130.253.53 × 10−5Glycolysis/Gluconeogenesis
Propanoic acid8.947.00 × 10−33.310.697.28 × 10−3Propionic acid metabolism
Alanine10.031.30 × 10−51.111.722.60 × 10−5Alanine, aspartate, and glutamate metabolism
Glycine10.519.80 × 10−91.073.283.64 × 10−8Glycine, serine, and threonine metabolism
Valine13.164.00 × 10−91.033.481.73 × 10−8Valine, leucine and isoleucine biosynthesis
Urea14.191.20 × 10−81.990.503.90 × 10−8Urea cycle
Leucine14.711.50 × 10−41.902.052.17 × 10−4Valine, leucine and isoleucine biosynthesis
Glycerol14.93.00 × 10−32.290.673.39 × 10−3Glycerolipid metabolism
Isoleucine15.283.50 × 10−91.192.151.82 × 10−8Valine, leucine and isoleucine biosynthesis
Serine17.165.40 × 10−51.121.528.78 × 10−5Glycine, serine, and threonine metabolism
Propionate18.881.70 × 10−91.051.691.11 × 10−8Pantothenate and CoA biosynthesis
Acetic acid20.701.70 × 10−91.041.582.74 × 10−4TCA cycle
Proline21.071.40 × 10−41.701.522.14 × 10−4Arginine and proline metabolism
Pentanedioic acid21.303.60 × 10−101.673.644.68 × 10−9Pentose and glucuronate interconversions
Creatinine22.873.70 × 10−81.113.159.62 × 10−8Arginine and proline metabolism
Phenylalanine23.491.10 × 10−91.162.449.53 × 10−9Phenylalanine, tyrosine, and tryptophan biosynthesis
Acetamide26.142.30 × 10−101.828.905.98 × 10−9Phenylalanine metabolism
Phosphoric acid26.823.30 × 10−63.273.297.15 × 10−6Propionic acid metabolism
Glutamine27.142.30 × 10−81.010.306.64 × 10−8Alanine, aspartate, and glutamate metabolism
D-Mannitol30.442.70 × 10−41.161.843.51 × 10−4Fructose and mannose metabolism
Hexadecanoic acid32.017.40 × 10−44.060.618.75 × 10−4Fatty acid biosynthesis
9,12-Octadecadienoic acid35.169.70 × 10−83.282.202.29 × 10−7Fatty acid biosynthesis
Octadecanoic acid35.483.30 × 10−41.790.624.09 × 10−4Fatty acid biosynthesis
Arachidonic acid39.521.20 × 10−21.310.771.20 × 10−2Arachidonic acid metabolism
Oleic acid41.942.80 × 10−51.930.464.85 × 10−5Fatty acid biosynthesis
Cholesterol44.485.00 × 10−31.120.715.42 × 10−3Steroid hormone biosynthesis
“↑” represents an increase in content of high-dose group compared to normal group; “↓” represents a decrease in high dose group compared to normal group.
Table 2. Pathway analysis result with MetaboAnalyst 5.0.
TotalExpectedHitsRaw p−log(p)Holm pFDR
Glyoxylate and dicarboxylate metabolism320.5161330.0135081.869410.28367
Phenylalanine, tyrosine, and tryptophan biosynthesis40.06451610.0630321.200410.59703
Alanine, aspartate, and glutamate metabolism280.4516120.0731131.13610.59703
Linoleic acid metabolism50.08064510.0781831.106910.59703
Phenylalanine metabolism100.1612910.150480.8225210.90288
Glycerolipid metabolism160.2580610.230060.6381511
Glycine, serine, and threonine metabolism330.5322610.418570.3782311
Arachidonic acid metabolism360.5806510.446860.3498311
Disclaimer/Publisher’s Note: The statements, opinions and data contained in all publications are solely those of the individual author(s) and contributor(s) and not of MDPI and/or the editor(s). MDPI and/or the editor(s) disclaim responsibility for any injury to people or property resulting from any ideas, methods, instructions or products referred to in the content.

