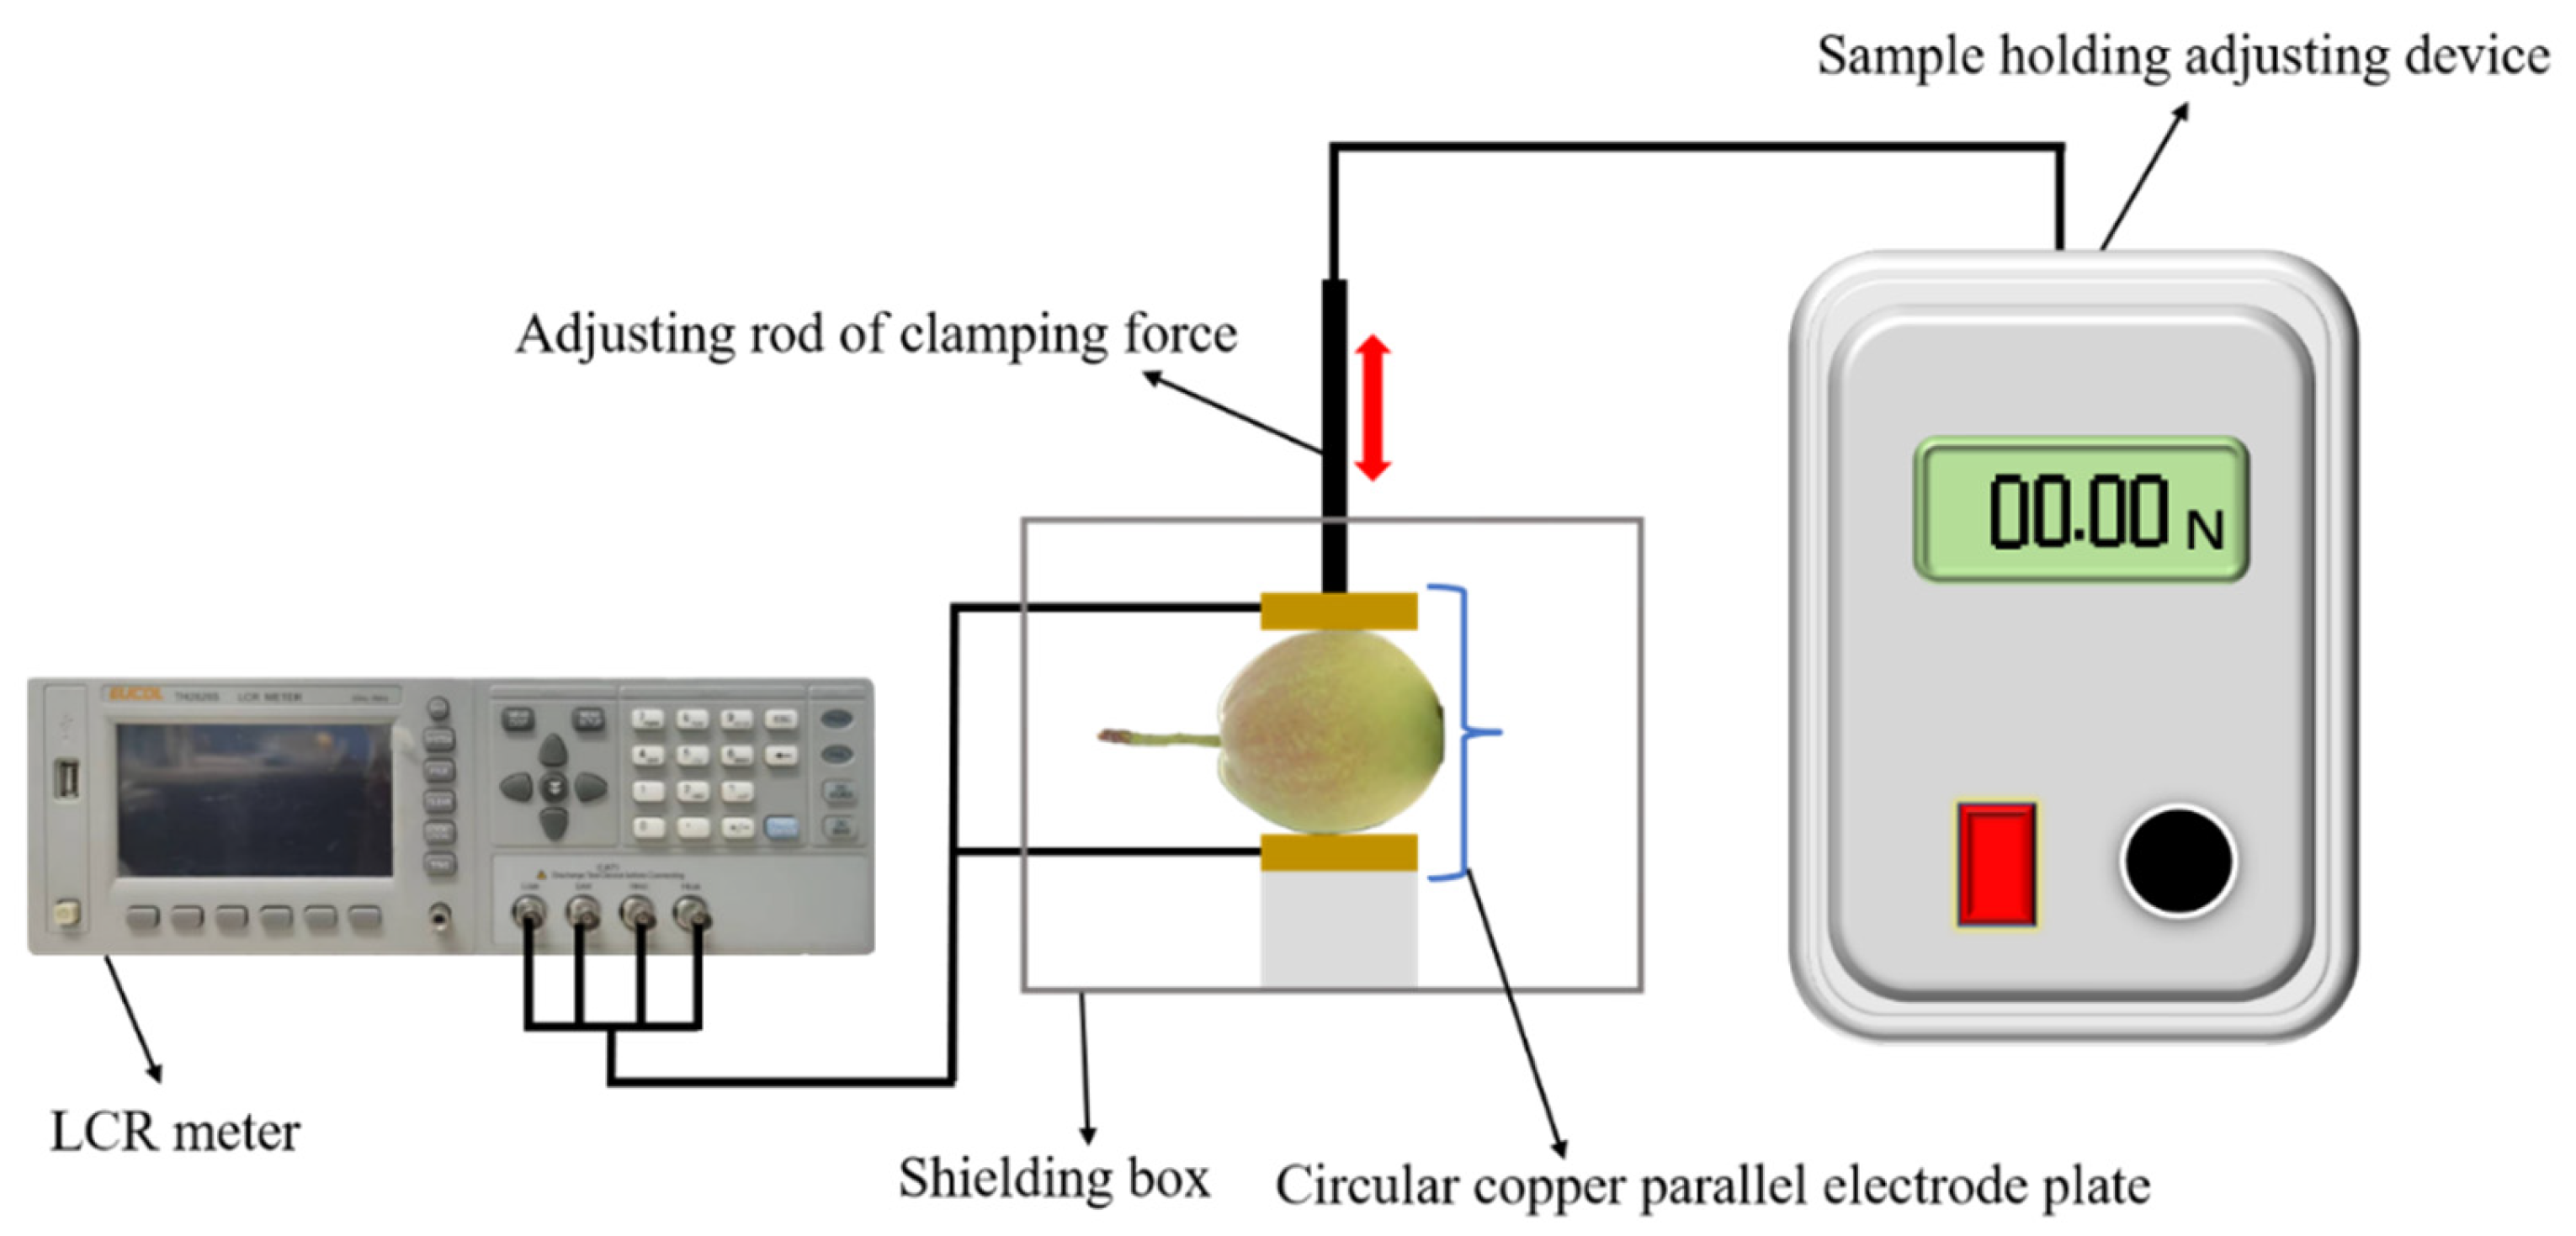
3.1. Electrical Parameters
The electrical parameters of the samples at three frequencies are shown in
Table 1,
Table 2 and
Table 3. Taking
Table 1 as an example, at the measuring frequency of 10 kHz, there was no discernible difference between inner injury and normal fragrant pears in terms of parallel equivalent capacitance, parallel equivalent inductance, or complex impedance. There was no discernible difference in the group of inner-injury degrees for the parallel equivalent capacitance, parallel equivalent inductance, and complex impedance. For inner injury and normal fragrant pears, there were considerable changes in the quality factor, parallel equivalent resistance, and phase angle. The quality factor, parallel equivalent resistance, and phase angle among the various levels of inner injury in fragrant pears varied significantly.
The parallel equivalent capacitance and parallel equivalent inductance of inner-injury fragrant pears were comparable to those of normal pears at all measurement frequencies (
Table 1,
Table 2 and
Table 3). The findings demonstrated that the deformation causing the inner injury to fragrant pear would not result in an obvious change in capacitor capacitance in a parallel circuit. In this study, the detection circuit was capacitive; the inductance measured with a capacitive circuit was negative and had no practical significance. It was improper to use these two parameters to identify the inner injury of fragrant pear. The differences in quality factor, parallel equivalent resistance, and phase angle between the inner injury and normal pear were obvious. The inner-injury fragrant pear had larger quality factors, parallel equivalent resistance, and phase angles than the normal fragrant pear did. The values of the quality factors, parallel equivalent resistance, and phase angles increased with the degree of inner injury. This may be the result of alterations in fragrant pear pulp tissue brought on by recessive injury [
2].
The complex impedance of the inner-injury pear was different from that of the non-destructive pear. The complex impedance value of the inner-injury pear measured at 10 kHz was greater than that of the non-destructive pear (
Table 1), while that of the inner-injury pear measured at 100 kHz and 1 MHz was less than that of the non-destructive pear (
Table 2 and
Table 3). The measurement frequency had a significant impact on the complex impedance [
38]. The influence of measurement frequency should be considered when complex impedance is used as a characteristic parameter.
3.2. Correlation Analysis
The correlation coefficient between electrical parameters and category labels was determined by the Spearman correlation analysis method was displayed in
Figure 2a. Strongly correlated factors may be used as classification feature parameters. The correlation coefficients between the parallel equivalent capacitance, complex impedance, and parallel equivalent inductance, measured at three frequencies, were all less than 0.3 in absolute terms (
Figure 2a), indicating that there was little relationship between these three parameters and the classification labels [
33]. The absolute values of the correlation coefficients between the quality factor, parallel equivalent resistance, phase angle, and classification labels were mostly greater than 0.5 (
Figure 2a), indicating that these three parameters had a certain correlation with classification labels of non-destructive and inner-injury fragrant pears, and could be used as characteristic electrical parameters to distinguish normal fragrant pears from inner-injury pears.
Figure 2b–d show the correlation coefficients between electrical parameters obtained using the Pearson correlation analysis method. The electrical parameters measured at 10 kHz and 100 kHz had strong correlations (
Figure 2b,c). The correlations between quality factor, parallel equivalent resistance, and phase angle were strong, as were the correlations between parallel equivalent capacitance, complex impedance, and parallel equivalent inductance, while the correlations between the two groups of parameters were weaker. At the measurement frequency of 1 MHz, there was a high correlation among the quality factor, parallel equivalent resistance, and phase angle (
Figure 2d). There was also a significant correlation between parallel equivalent resistance and parallel equivalent capacitance, complex impedance, and parallel equivalent inductance. Principal component analysis was used to reduce the dimension because there was information redundancy between electrical parameters.
3.3. Principal Component Analysis
Principal component analysis was performed on parallel equivalent capacitance, quality factor, parallel equivalent resistance, complex impedance, parallel equivalent inductance, and phase angle.
At the measurement frequencies of 10 kHz and 100 kHz, the characteristic values of the first two principal components were both greater than 1 (
Figure 3a), and the variance cumulative contribution rate of the first two principal components exceeded 91% (
Figure 3b).
The more information the principal component retained about the original variable, the larger the load value [
39]. The absolute values of the characteristic load of the first principal component (PC1) and the second principal component (PC2) were similar in
Table 4, indicating that PC1 and PC2 represented the information of various electrical parameters in a balanced manner [
32], and the first two principal components could be used as characteristic parameters to establish classification models.
3.4. Modeling and Model Validation
Classification models were established using NB, KNN, and SVM to classify the inner injury and normal fragrant pears using the quality factor, parallel equivalent resistance, phase angle, and the first two principal components as characteristic parameters at three measurement frequencies. To improve the prediction performance of the models, especially the performance of the trained models on new data, 10-fold cross-validation was used to reduce the possibility of overfitting. The aim of 10-fold cross-validation was to divide the training dataset into 10 parts, taking turns to train 9 parts of them and validate 1 part of them. The average of the 10 results was used as an estimate of the algorithm’s accuracy. All the training data were involved in modeling, which could well estimate the training accuracy of the models [
40].
The performance of the NB, SVM, and KNN classification models for recognition was assessed using accuracy, precision, recall, and F1 score. In actual production, the loss caused by inner-injury pears during storage is immeasurable. All of the inner-injury pears are expected to be identified correctly, so the effect of recall is more important.
The quality factor, parallel equivalent resistance, and phase angle were used as the characteristic electrical parameters at the three measurement frequencies for the classification models. The recognition accuracy of the SVM and KNN discrimination models was superior to that of the NB model. This may be because NB is founded on the assumption that the feature parameters are independent of one another and that the redundant attributes of the feature electrical parameters will lower the prediction performance [
41]. The classification models established at 10 kHz and 100 kHz were better than those of the models established at 1 MHz to identify the inner-injury pears. The SVM model, when evaluated with the confusion matrix, precision, and recall, had the best classification effect at 100 kHz, correctly identifying 19 of 25 normal pears and 73 of 75 inner-injury pears (
Table 5); the recognition accuracy was 92.00%, the precision was 92.41%, the recall was 97.33%, and the F
1 score was 0.95 (
Figure 4a).
The first two principal components were used as characteristic parameters to establish classification models. The recognition accuracies of SVM classification models were superior to those of NB and KNN models at the three measurement frequencies, and the effectiveness of discriminant models established at 10 kHz and 100 kHz was superior to that established at 1 MHz in identifying the inner-injury pears. When the measurement frequencies were 10 kHz and 100 kHz, the recognition accuracy was 90.00% (
Table 6). The SVM discriminant model correctly identified 70 of 75 inner-injury pears at the measurement frequency of 10 kHz, and the precision and recall were both 93.33% (
Figure 4b). Under 100 kHz, the SVM discriminant model correctly identified 72 of 75 inner-injury pears (
Table 6), with a precision of 91.14%, a recall of 96.00%, and an F
1 score of 0.94 (
Figure 4b). Taking into account the confusion matrix, precision, recall, and F
1 score, the SVM model established with the measurement frequency of 100 kHz had the best discriminant effect when the first two principal components were used as the characteristic parameters.
When the measurement frequency was set to 100 kHz, the quality factor, parallel equivalent resistance, and phase angle were used as input parameters, and the constructed SVM classification model produced the best discrimination result for identifying the inner injury of fragrant pears. The quality factor, parallel equivalent resistance, and phase angle are three recommended electrical metrics for identifying inner-injury pears.


