Article

Rare Earth Element Variability in Italian Extra Virgin Olive Oils from Abruzzo Region

1
Department of Innovative Technologies in Medicine and Dentistry, University “G. d’Annunzio” of Chieti-Pescara, 66100 Chieti, Italy
2
Center for Advanced Studies and Technology (CAST), “G. d’Annunzio” University of Chieti-Pescara, 66100 Chieti, Italy
3
Istituto Zooprofilattico Sperimentale dell’Abruzzo e del Molise “G. Caporale”, Campo Boario, 64100 Teramo, Italy
4
Department of Engineering and Geology, University “G. d’Annunzio” of Chieti-Pescara, 66100 Chieti, Italy
5
Department of Philosophical, Pedagogical and Economic-Quantitative Sciences, University “G. d’Annunzio” of Chieti-Pescara, 65127 Pescara, Italy
*
Author to whom correspondence should be addressed.
Foods 2024, 13(1), 141; https://doi.org/10.3390/foods13010141
Submission received: 21 November 2023 / Revised: 21 December 2023 / Accepted: 27 December 2023 / Published: 30 December 2023
(This article belongs to the Special Issue Advances in Research on Olive Oil Quality, Production and Consumption)

Abstract

:
Extra virgin olive oil is a food product from the Mediterranean area that is particularly and continuously experiencing to increasing instances of fraudulent geographical labeling. Therefore, origin protection must be improved, mainly based on its intrinsic chemical composition. This study aimed to perform a preliminary chemical characterization of Abruzzo extra virgin olive oils (EVOOs) using rare earth elements (REEs). REEs were evaluated in EVOO samples of different varieties produced in different geographical origins within the Abruzzo region (Italy) in three harvest years using ICP-MS chemometric techniques. Principal component, discriminant, and hierarchical cluster analyses were conducted to verify the influence of the variety, origin, and vintage of the REE composition. The results of a three-year study showed a uniform REE pattern and a strong correlation in most EVOOs, in particular for Y, La, Ce, and Nd. However, europium and erbium were also found in some oil samples. Compared with cultivar and origin, only the harvest year slightly influenced the REE composition, highlighting the interactions of the olive system with the climate and soil chemistry that could affect the multielement composition of EVOOs.

1. Introduction

Extra virgin olive oil (EVOO) is an important agricultural product. Its consumption is common in everyday cooking [1,2]. It represents the main fat source of the “Mediterranean diet”, providing a special aroma and taste due to the contribution of its phytochemical compounds [3]. Its high contents of monounsaturated fatty acid and antioxidant compounds has beneficial health effects [4,5,6] in preventing coronary diseases, cancer types, diabetes, and autoimmune illness [7,8,9]. Worldwide, olive oil production was estimated as almost 3 million tons for the period from 2021 to 2022, with about 2 million tons produced in Europe (Spain, 1400 t; Italy, 329 t; Greece, 232 t; and Portugal, 206 t) and about 1 million tons in non-European countries (Tunisia, 240 t; Turkey, 235 t; Morocco, 200 t; Algeria, 91 t; Egypt, 20 t; and Argentina, 3 t) [10].
The Abruzzo region produces the fifth largest EVOO volume in Italy, at about 144,000 tons in 2021 [11]. Owing to local varieties and the specific pedoclimatic conditions in the Abruzzo region, it is possible to cultivate olive trees over the entire territory, starting from the sea to the foothills of Majella and the Gran Sasso mountains located 600–700 m above sea level [12]. Fifty percent of the annual regional EVOO production is concentrated in the Chieti district, and the Pescara province produces thirty percent. The rest of the production is distributed in Teramo and L’Aquila districts, with 16 and 4%, respectively. The EVOO produced in the country is appreciated all over the world as a very-high-quality product [13], and, for this reason, tracing the origin of EVOO to control product authenticity or adulteration is fundamental [14,15,16,17,18]. In fact, the adulteration of EVOO with other vegetable oils is relatively easy to recognize. Conversely, it is difficult to check extra virgin oils produced from foreign countries or those using imported olives and sold as local products, because the overall composition of the final product can be almost totally similar to that of local ones [19].
Here, the focus is not only on food safety and quality control but also on the assessment of the authenticity of the declared geographical origin. Indeed, frauds can have a significant impact on customer health, confidence in the product, and, consequently, e final consumption behavior, causing significant economic losses [20,21]. For these reasons, EC Regulation 1151/2012 provides rules on marketing standards for olive oil and states the mandatory nature of origin labeling [22]. It introduces discrimination based on geographical indicators, highlighting that the characteristics of the product are also related to the geographical origin [23]. The Protected Designation of Origin (PDO) label on olive oil has become a motivating choice criterion for customers, since olive oil quality and flavor are linked to the origin of the olives, and they are associated with specific production practices [24,25].
Even though a method for certifying EVOOs’ geographical origin has not yet been established in the scientific literature, the discrimination of olive oil production on a geographic basis, also called geographical authentication, is becoming an important trend in scientific research, with different analytical chemistry approaches being applied, including elemental/isotopic, nuclear magnetic resonance (NMR), mass spectroscopy (MS), and energy-dispersive X-ray fluorescence (XRF), as well as organic analytical methods and organoleptic evaluation [22,26,27,28]. The organic analytical methods are based on the determination of fatty acids and triacylglycerols [29], but minor metabolites such as phenols [30], aliphatic and terpene alcohols, sesquiterpene hydrocarbons [31], sterols [32,33], and pigments are also considered. The isotopic profile analysis method is mostly based on the detection of stable isotope (H, C, and O) ratios, since the isotopic fractionation is correlated with geographical and climatic parameters [33,34]. The isotopic composition of strontium (Sr) is also useful, since it reflects local soil and geology [35,36,37],and, in particular, the geogenic soil formation that overlies the geological substrate [38,39].
Alternatively, authentication can be realized by evaluating the mineral composition of olive oils, which gives information regarding the biological demand of the plant, the bioavailability and mobility of mineral compounds from the soil, and the influence of agronomic practices such as the use of fertilizers and pesticides. Since olive trees of the same cultivar, characterized by the same genetics but planted in different countries, produce different oils, the analysis of their elemental profiles reflects the effect of their interaction with pedoclimatic conditions and agricultural practices [40,41,42]. For this reason, to achieve precise authentication, it is necessary to identify elements acting as natural markers that are not influenced by secondary sources such as farming practices and anthropic sources and are suitable for the determination of the origin of EVOO [26,43].
Trace elements concentration in the Earth’s crust do not exceed 1 g/kg, while, in olive oil, their concentrations, except for Ca, do not exceed a few hundred micrograms per kilogram (µg/kg) [27]. The concentrations in olive oil may differ according to several parameters such as olive cultivar [44], irrigation of olive trees [45], use of fertilizers [46], fluctuation in annual climatic parameters [47], and the positive fractionation that occurs during the active absorption from the soil and the translocation to the fruits [19]. For these reasons, no consensus has been reached with regard to a direct and clear correlation between their concentration in the soil and in the related olive oils [19,47,48,49].
Ultra-trace elements, also called rare earth elements (REEs), show wide soil concentration variability around the world, ranging from 0.1 to 700 mg kg−1 [50,51]. Conversely, several authors have found REE concentrations in olive oils as ranging from 0.002 to 7 ng g−1 [52]. Ultra-trace elements are not essential for the growth and development of olive tree and are passively absorbed without active fractionation. Therefore, the REE composition can provide a representative fingerprint of the olive oil since REEs more proportionally reflect their less-abundant concentrations in soils. Conversely, fractionation from the original distribution in soil occurs when a certain element is assumed in a preferential way because it is a nutrient, or it is excluded from absorption because it is toxic [19,26,36,41,53,54,55,56,57].
For these reasons, REEs are suitable for discriminating foodstuffs on a geographic basis, acting as geochemical markers as well [58], while major, minor, and trace elements are useful in authentication schemes based on varietal or technological discrimination [19,26]. Joebstl and coauthors used REEs to identify the geographical origin of pumpkin seed oil [59] and, lately, some studies deepened the understanding of the relationship among the production chain and EVOO characteristics [19,57]. Barbera et al. confirmed that the relationship between the soil and olive fruits depends exclusively on the soil REE composition [56] and identified an excellent marker to identify the geographical fingerprint of EVOOs [57].
REEs include ultra-trace elements (yttrium) and lanthanides with an atomic number ranging from 57 and 71, such as La (lanthanum), Ce (cerium), Pr (praseodymium), Nd (neodymium), Pm (promethium), Sm (samarium), Eu (europium), Gd (gadolinium), Tb (terbium), Dy (dysprosium), Ho (holmium), Er (erbium), Tm (thulium), Yb (ytterbium), and lutetium (Lu). Ordering elements by increasing atomic number, the REEs from La to Gd are considered light rare earth elements (LREEs), with more basic behavior and higher solubility, whereas the REEs from Tb to Lu are considered heavy rare earth elements (HREEs), with more acid behavior and lower solubility [51,60,61]. Additionally, middle rare earth elements (MREEs), which overlap the two groups, include Sm (samarium) and Eu (europium). Typically, in soils, the LREE concentrations are generally greater than the HREE concentrations [51].
Based on the previous assumptions, the aim of this study was to evaluate, for the first time, the REE contents of EVOOs from the Abruzzo region, mainly from Chieti and Pescara provinces, which produce 80% of the total EVOO in the region. In particular, 29 EVOOs produced during three harvest years (2019, 2020, and 2021) were fingerprinted with inductively coupled plasma mass spectrometry (ICP-MS). The dataset was analyzed using chemometric tools, in particular, using principal component analysis (PCA), linear discriminant analysis (LDA), and hierarchical clustering analysis (HCA), with the aim of discriminating between olive oil groups.

2. Materials and Methods

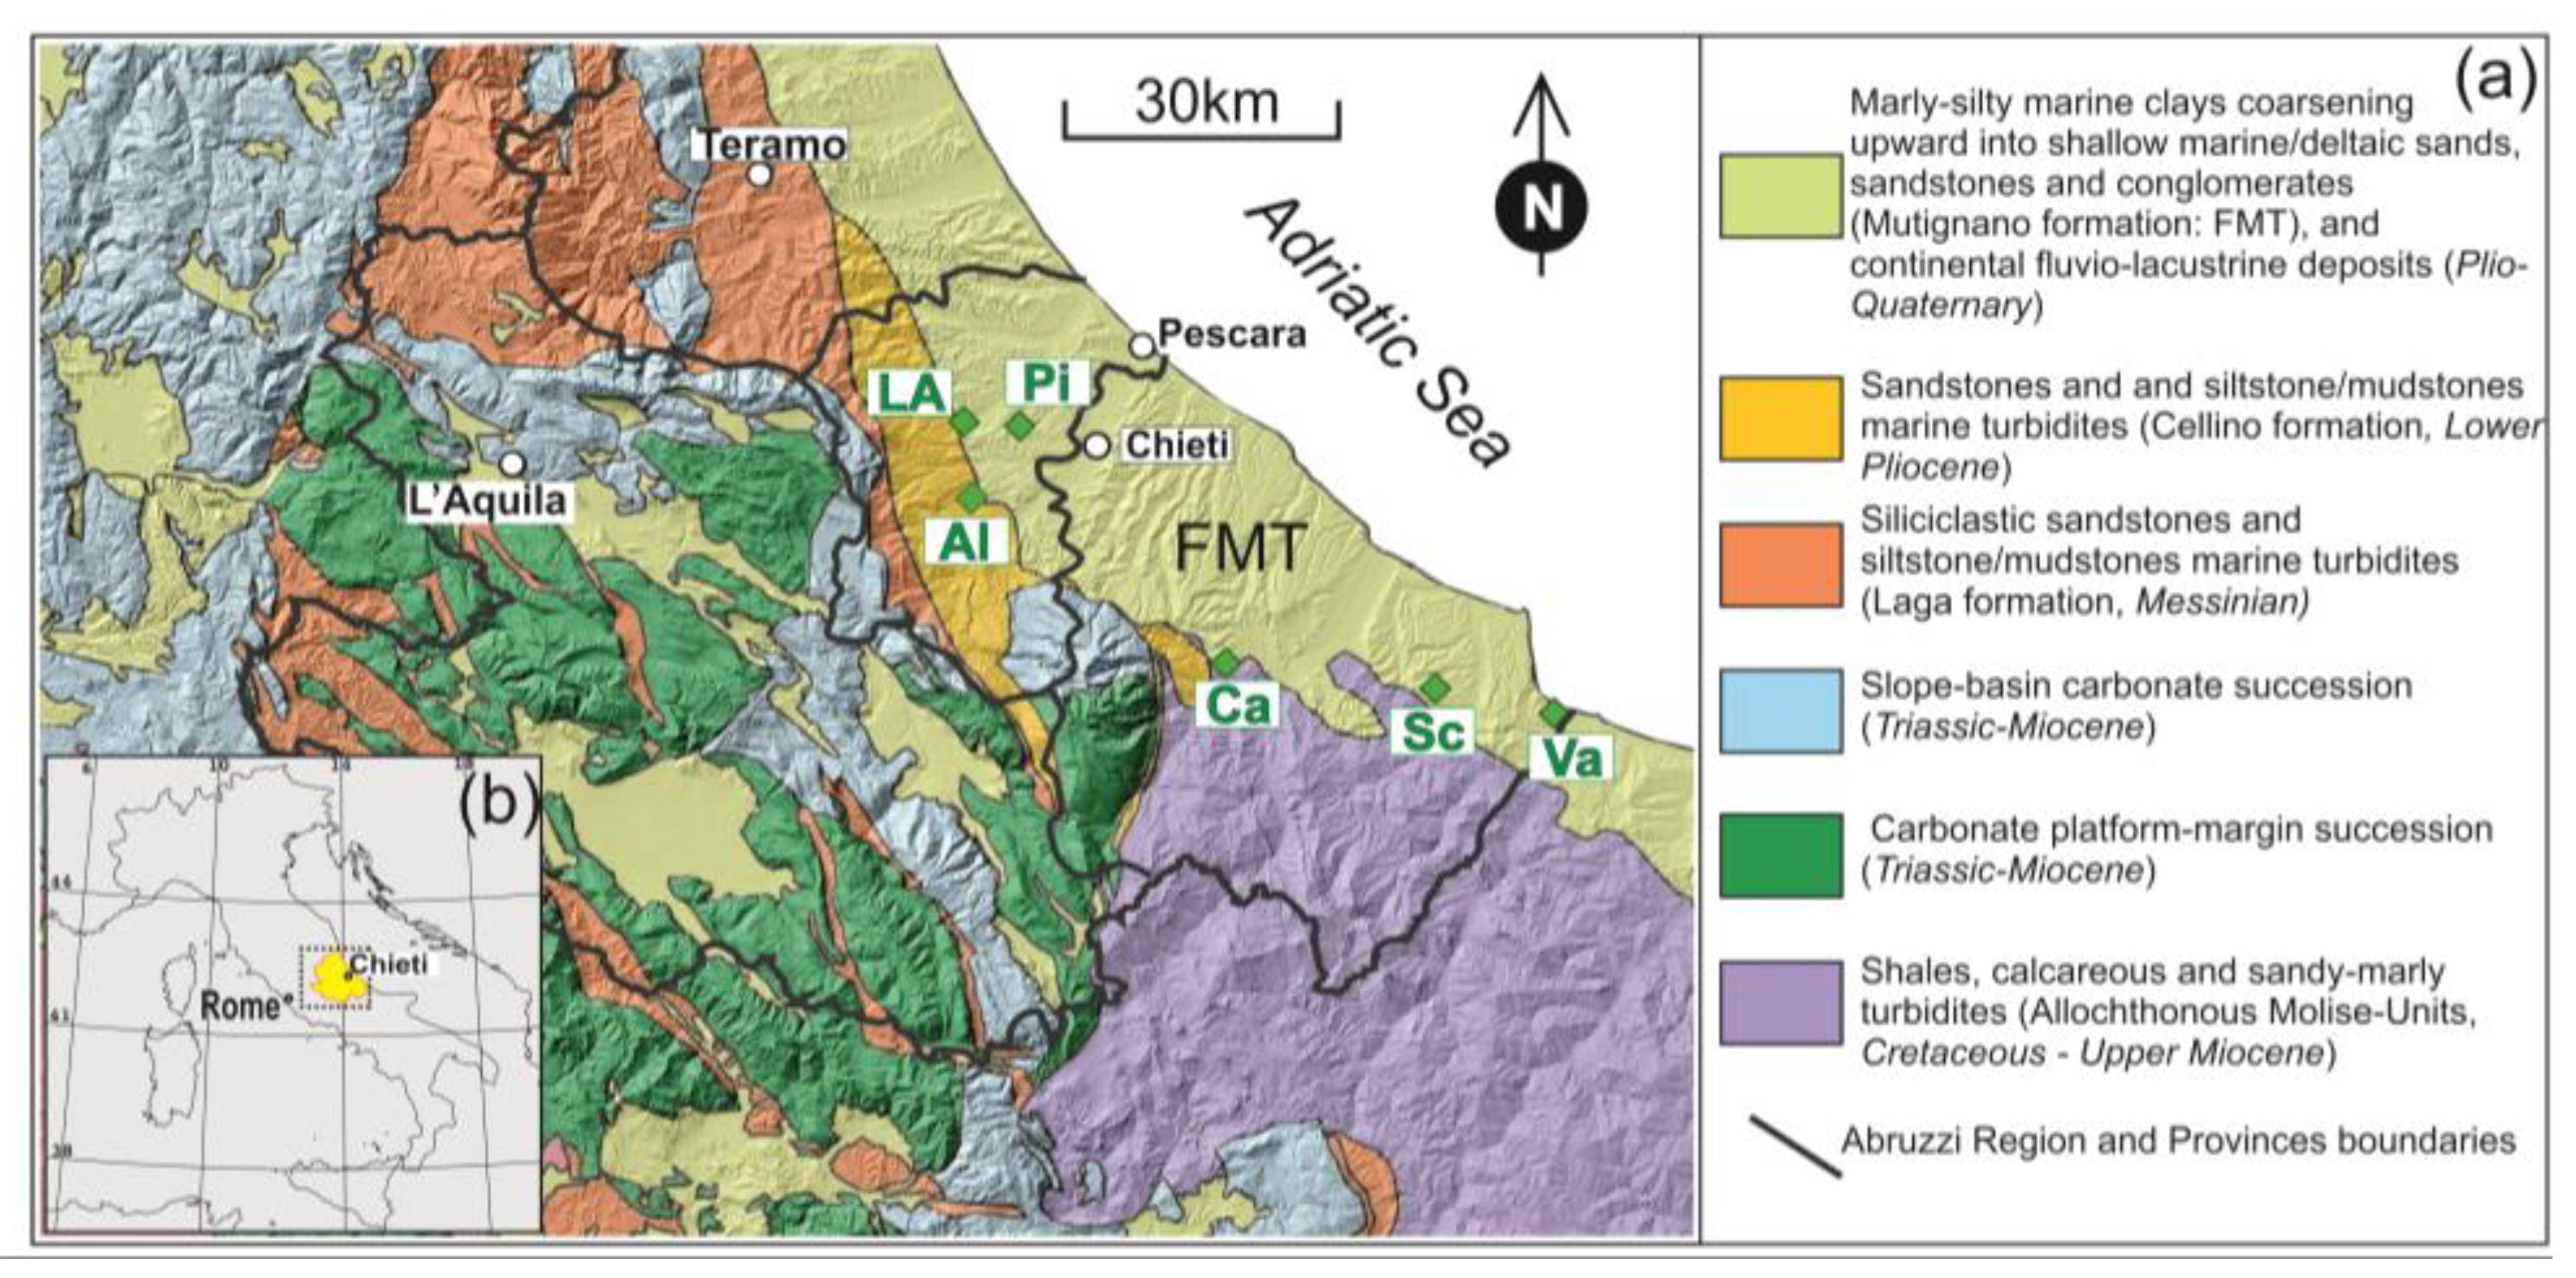
2.1. Area Sampled, Local Geology, and Sample Collection

Olive harvest and EVOO extraction were conducted during the 2019, 2020, and 2021 harvesting years. The locations of the olive orchards where the drupes were collected are reported in Figure 1, which shows a simplified geological map of the Abruzzo region and its position in the coastal Adriatic region (i.e., the outer (eastern) portion of the Apennines orogenic belt (geological map of Italy: 1:50,000 scale, 361 sheets). In this region, carbonate rocks in the mountain range are exposed and sandstones alternate with marls in the adjacent low-lying mountain-foot domains. The soils of the Adriatic coastal region have developed above a common sedimentary substrate made by clayey–sandy–conglomerate shallow marine deposits of the Mutignano Formation (Late Pliocene–Lower Pleistocene). Locally, the soil is featured by silty–clayey eluvial–colluvial, alluvial, and slope Quaternary continental deposits. All the investigated olive orchards, therefore, were located on soils that had pedogenized the areas of the Mutignano Formation (FMT), with the exception of the Alanno site, which, however, developed on lithologies very similar to those of the FMT.
Olives were mechanically harvested in October from nonexperimental orchards, from 20 plants for each cultivar. Olive fruits were at a medium level of ripening, which is specific for each variety and defined by each producer. EVOOs were extracted within 12–24 h of harvest in an olive mill located in the same municipality as the olive orchard, with industrial, three-phase, continuous extraction systems. Oils were collected during the extraction, packaged in dark 750 mL glass bottles, and stored in dark conditions at about 18 °C until analysis. Oil samples were coded with alphanumeric codes based on the harvest year (Table 1); “A”, “B”, and “C” corresponded to 2019, 2020, and 2021, respectively. The trees and industrial olive mills were the same during the three years of the research. Information about the geographical location of the orchards, sample coding, and cultivars are presented in Table 1.

2.2. Olive Oil Preparation

Prior to inductively coupled plasma mass spectrometry (ICP-MS) analysis, the organic matter contained in the olive oils was destroyed via mineralization. The EVOO mineralization was carried out based on the EN 13805:2014 protocol adopted by the Istituto Zooprofilattico Sperimentale dell’Abruzzo e del Molise “G. Caporale” (Teramo, Italy). Briefly, a microwave digestion system, Milestone ultraWAVE ECR (Sorisole, Italy), equipped with temperature and pressure control was used to digest samples. About 300 mg of each EVOO sample was weighed directly into disposable glass vessels. The vessels were then filled with 4 mL of HNO3 (60%) for trace analysis (Merck KGaA, Darmstadt, Germany) and prepared for digestion. Each digestion cycle was programmed according to the protocol: step 1—ramp to temperature 230 °C and pressure 150 bar in 25 min, at 1500 W power; step 2—the same conditions maintained for 10 min; step 3—cooling cycle. Each sample resulting from acid digestion was then diluted to 15 mL with high-purity water (18.2 MΩ cm−1 resistivity) obtained from an ELGA LabWater PURELAB Option-Q water purification system (High Wycombe, UK).

2.3. ICP-MS Analysis

Digested samples (2 mL) were diluted to 5 mL with ultra-pure water (18 MΩ cm−1) and subjected to analysis via ICP-MS for major (Na, Mg, K), trace (Ca, Mn, Fe, Zn, Rb, Sr, Ba), ultra-trace (Al, Ga, V, Cr, Pb), and rare earth elements.
The instrument used was an Agilent 7900 ICP-MS (Agilent Technologies, Tokyo, Japan), which was used in the Laboratory of Newborn Screening, Proteomics and Endocrinology of CAST, University of Chieti. Detailed operating conditions and instrumental parameters are given in Table S1. The 4th-generation Octopole Reaction System (ORS) was used to measure, at the same time, some elements (Na, Mg, K, Ca, Fe, Zn, Rb, Al, Ga, Cr, Pb) in helium (He) mode to reduce spectral interference and noise effects; other elements (V, Mn, Sr, Ba, and REE) were measured in no-gas mode due to the lack of interference [63].
The optimization of ICP-MS was carried out to obtain the maximum signal intensities for 7Li, 89Y, 140Ce, and 205Tl using a 1 μg L−1 tuning solution containing Li, Y, Co, Ce, Mg, and Tl (Agilent Technologies, Palo Alto, CA, USA), while keeping the formation of oxides 140 CeO+/140Ce+ and doubly charged species Ce2+/Ce+ ratios below 1% and 2%, respectively. The sample-introduction system was washed between analyses with 2% HNO3. Two multielement mixtures at 10 μg mL−1 were used in acid solution: (A) Ag, Ba, Be, Cd, Co, Cr, Cu, Fe, Mn, Ni, Pb, Rb, Se, Sr, Tl, U, V, and Zn in 5% HNO3; (B) Ce, Dy, Er, Eu, Ga, Gd, Ho, In, La, Lu, Nb, Nd, Pr, Sm, Th, Tb, Tm, Y, and Yb in 5% HNO3. These mixtures were employed to prepare diluted calibration solutions daily, and three calibration curves were prepared using these multielement mixtures. An internal standard correction was performed via the online addition of an internal standard solution of Rh (20 μg L−1) in a T piece. Ultra-pure water (18 MΩ cm−1) was obtained from a Milli-Q system (Millipore, Bedford, MA, USA). Nitric acid (69% v/v) and an internal standard solution of Rh were bought from Merk (Darmstadt, Germany) and were ultrapure-grade. Duplicate analysis was performed for each sample. The full data were recorded with Agilent MassHunter Data Acquisition software (version 4.2) and processed with Agilent MassHunter Data Analysis software (version 4.2).
The limit of detection (LOD) and limit of quantification (LOQ) were calculated for the REEs by analyzing ten experimental blanks. The LOD and LOQ were initially calculated as signals by employing Equations (1) and (2), respectively:
yLOD = yb + 2tsb
yLOD = yb + 10sb
where t is the constant from a one-sided Student’s t-test at the 95% confidence level for n − 1 degrees of freedom, yb is the average blank signal, and sb is the corresponding standard deviation. The corresponding LOD and LOQ concentration values (Table S2) were obtained by using an appropriate calibration curve satisfying the following relationship: 0.5x1 < LOD < x1, where x1 is the concentration of the first calibration level [64]. Data below the LOD and LOQ values were excluded from the analysis.

2.4. Data Analysis

Empirical analyses were conducted to study the characteristics of the REEs according to some variables of interest, and the main features of the observed data were summarized by performing an overall descriptive analysis. The differences between mean REE concentrations related to year, variety, and origin were evaluated via analysis of variance (ANOVA) and Kruskal–Wallis tests. Where the ANOVA test assumptions were not satisfied (normality and homoscedasticity of residues), the Kruskal–Wallis nonparametric test was used. Significant differences were established at the level of p = 0.05.
In the second step, commonly used foodomics chemometric techniques such as PCA and HCA were used as exploratory methods, without any a priori knowledge of groups present in the population [22]. To reduce collinearity among data, PCA was applied to REE concentrations, and, based on the first two principal components, the LDA, an a priori knowledge of group membership technique, was performed [65]. Finally, the HCA method, revealing groups of similarity (clusters), was conducted using Euclidean distances and Ward’s linkage methods. The graphical output of the analysis was a heatmap, a tree-like plot, where both rows and columns were clustered [66,67].
The statistical analysis was performed with XLSTAT using the Addinsoft program and ClustVis, a web tool freely available at http://biit.cs.ut.ee/clustvis/ [68] (accessed on 1 August 2023).

3. Results and Discussion

3.1. Elemental Profile of Olive Oils

The mean REE concentrations detected in the EVOOs are shown in Figure 2a, while the mean REE contents (≥LOQ) of each olive oil sample during the 2019–2021 period from different geographical origins are reported in Table 2. Despite the limited data on REE contents available in the literature, the concentration range that we detected ranged between 0.09 and 4.22 ng g−1, in accordance with the results of different authors, which were well summarized in a recent study [69], who reported ranges varying between 0.002 and 7 ng g−1 in olive oils from costal region. Our values also agree with those described by other authors in other areas [2,70,71,72]. In descending order, the most abundant REEs were Ce, Y, La, and Nd, which had mean values of 3.27, 2.18, 1.53, and 1.36 ng g−1, respectively. The levels of the remaining elements, such as Pr, Sm, Gd, Dy, Er, Yb, and Eu ranged from 0.38 to 0.13 ng g−1. Table S3 provides a detailed list of the REE concentrations found in the literature. To better study and visualize the REE patterns, chondrite-normalized values were used [73], which provide a reference for the normalization of rare earth elements, since they are assumed to reflect the original composition of the Earth’s crust [74,75]. Except for Eu and Er, which presented slight positive and negative anomalies, respectively, all the oil samples showed very similar chondrite normalized patterns, confirming the above-mentioned hypothesis regarding the limited fractionation that occurs when passing from soil to fruits and to the final EVO [19]. It is evident that the homogeneous lithological and geomorphological context (Figure 1) strongly affected the distribution patterns of the REEs in soils and, therefore, the general uniform REE pattern observed in the EVOOs. Slight content variations, moreover, could reflect the local influence of bedrock-weathering and soil-leaching processes.
The behavior of REE distributions strictly followed the Oddo–Harkins rule, which states how elements with an even atomic numbers are more abundant than elements with immediately adjacent atomic numbers [76,77]. The REE concentration patterns of the EVOOs (Figure 2b) therefore proportionally reflect the distribution of REEs in soils, pointing out that different vintages, varieties, and locations seem did not affect the patterns. This aspect represents one of the prerequisites for a reliable chemical marker of geographical origin, and so it would be useful to further investigate the potential of REEs in this sense.
To evaluate the strength of the relationships among the REEs, Pearson correlation coefficients were calculated and are reported in a correlation matrix (Table 3). A strong correlation (p < 0.001) was found among Y, La, Ce, Pr, Nd, Gd, and Dy; five of them were grouped in the light fraction (LREEs). Conversely, the weakly correlated REEs were Eu–Er (−0.04) and Eu–Yb (0.03). It was evident that similar chondrite patterns corresponded to stronger concentration correlations.

3.2. ANOVA and Kruskal–Wallis Test

The one-way ANOVA was conducted to evaluate the differences between mean REE concentrations related to the three vintages (2019, 2020, and 2021). The parametric test assumptions were verified for all REEs, except for Eu (failed both normality and Levene’s test) and Er (failed normality test). Ten out of eleven REEs did not exhibit any significant differences (p > 0.05) since there was no variation in the mean REE concentrations among the vintages. Eu exhibited significant differences between the 2019 and 2020 vintages (according on Tukey’s HSD test).
The nonparametric Kruskal–Wallis test was conducted to evaluate the differences between median REE concentrations related to the 12 varieties or cultivars (CVs) and 6 origins. No variation in the REE concentrations was found regardless of origin and the (p > 0.05), confirming the homogenous pattern distribution that we previously observed.

3.3. PCA

According to the values reported in Table 3, to reduce the collinearity among the data, principal component analysis (PCA) of the REE concentrations was conducted, and the results are shown in Table 4. The first two principal components (F1 and F2) explained 75.77% of the total variance (specifically, F1 explained 65.37% and F2 explained 10.4%). The main variables that influenced the first component were the concentrations of Y, La, Ce, and Nd (F1 eigenvectors > 0.35), while the variables Eu and Er mainly affected the second component, with eigenvector values of 0.76 and −0.54, respectively.
According to the loading plot (Figure S1), the vector lengths of Y, La, Ce, and Nd represented the largest contribution of the variance in the first component. They were located close to each other, with a small angle in between; out toward the same periphery, they covariation was strongly positive (very similar patterns) and proportional to the degree distance from the PC origin. On the other side, europium (Eu), especially, and erbium (Er), mainly contributed to the second component. The large angle between Eu and Er highlighted the weak correlation. Sm and Yb, with the shortest vector and being closest to the origin, presented the lowest absolute variances, and might be better explained by other factors [57].
The first component represented elements with strong associations, reflecting similar behavior or bioavailability in the soil, belonging to the same geochemical groups on the periodic table, being able to form clusters [47,49,78]. Consequently, according to Goldshmidt’s geochemical classification, La, Ce, and Nd (LREEs), which have more basic behavior and higher solubility, were grouped together [47]. In addition to this grouping of elements, yttrium (HREE), which also characterizes the elemental profile of olive oils, was shaped by the geochemical processes in the study territory.
A PCA biplot (Figure 3) highlights that samples C4 and C5 presented the highest concentrations of REEs and were the most positively correlated with F1. Conversely, EVOOs A4, B5, and B8 presented the lowest concentrations of REEs and were negatively correlated with F1. With respect to F2, the A samples, belonging to the 2019 vintage, specifically A4, A9, and A5, presented a highly positive correlation with europium and a negative one with erbium. Finally, the B and C samples, representing the 2020 and 2021 vintages, respectively, were mostly grouped together.
Based on the PCA assumptions, a preliminary comparison analysis was performed including the REE data of three different Italian monocultivar oils: Pisciottana (Calabria region, D1), Frantoio (Piemonte region, D2), and Taggiasca (Liguria region, D3), as well as the data from one EU/extra EU EVOO blend (D4). The PCA score plot (Figure S2) shows the main separation of the samples along F1. EVOOs D1 and D3 were found to be similar to C4 and C5. EVOO D2 was comparable to A2 and opposite from D1 and D3. Sample D4 was positioned close to the origin. This result highlighted the better characterization of Abruzzo EVOOs and Liguria, Calabria, and Piemonte oils compared with the EVOO blend.

3.4. Discriminant Analysis

Linear discriminant analysis (LDA) was performed as a further unsupervised data elaboration, according to year, variety, and origin. It was applied to the first two principal component factors (F1 and F2), and results are depicted in confusion matrices (Table 5 and Tables S4 and S5, Supplementary Materials). The mean correct classification rates were 78.6% for vintage class (Table 5), 46.4% for geographical location (Table S4), and 32.1% (Table S5) for the cultivar class.
The vintage discrimination supported the previous PCA evaluations, identifying the A samples’ distribution in the F1 direction, which were opposite to the compact B grouping, in the observation plot (Figure 4). Furthermore, samples C4 and C5 were spatially separated as evident C outliers along the F2 direction.
According to Table 5, the 2020 vintage samples were more accurately classified (91.7%) than those from 2019 and 2021 (75% and 62.5%, respectively). Indeed, from a graphical point of view (Figure 4), they were located closer to the reference centroid (B) compared with the A and C samples, where the distance between samples and their respective centroids was higher.
Concerning cultivar (Table S5), Don Carlo, FS17, Oliana, and Peranzana were correctly classified (100%), while Koroneiki, Lecciana, Leccino, and Dritta were completely misclassified (0%). Finally, the geographical locations correctly classified were Alanno, Casoli, and Loreto, while Pianella, Scerni and Vasto were misclassified (Table S4).
It is important to note that the low rate of LDA results related to the geographical location and the cultivar agree with the pairwise Kruskal–Wallis comparison outcomes, which did not identify significant differences among the EVOOs.

3.5. Cluster Analysis

Aggregative hierarchical cluster analysis (HCA), using Euclidean distances and Ward’s linkage method, was implemented to interpret the chemometric data based on an input matrix consisting of 11 chemical variables (REEs) and 28 oil samples. The results of HCA are shown in a heatmap plot (Figure 5).
The column clustering highlights the correspondence of the graphical heatmap output information with a PCA loading plot (Figure S1). Eu, Er, Sm and Yb showed independent behavior and did not group with the two main clusters of La/Ce/Nd/Y and Gd/Dy/Pr.
The row clustering analysis identified four main groups, also highlighted in the score plots (Figure 3 and Figure 4), where C4 and C5 presented the highest concentrations of REEs, while EVOOs A4, B8, and B5, were characterized by the lowest concentrations of REEs. Moreover, EVOOs A5, A6, A7, and A9 presented the highest concentrations of Eu, while B1, B2, B10, B11, and A2 had the highest concentrations of Er.
HCA also confirmed that only the vintage influenced the REE concentrations’ tendency to form groupings, while geographical location and cultivar did not, as previously highlighted by the corresponding confusion matrices. Since the average annual temperature and cumulative precipitation were similar in the three considered years (data not shown), climate discrimination should be studied considering intrayearly (monthly and seasonal) climate trends, which could influence the specific phenological stages of olive tree development. Edaphic factors, such as the bioavailability of inorganic elements in soil and its chemical characteristics (pH, electrical conductivity, organic matter and inorganic carbon (CaCO3), should also be considered [71].

4. Conclusions

The overall results of this preliminary study show that in the high-EVOO-producing region of Abruzzo, the REE concentration patterns of olive oil, among different varieties, origins, and vintages, were almost homogeneous, showing the potential to be used as a marker of geographical origin. Among these three factors, only vintage slightly influenced REE concentrations, suggesting the possible effect of interactions among soil geochemistry, edaphic, and climatic characteristics. Some REEs are more effective and useful than others in representing the transfer of soil geochemistry to olive oil, in particular, Y, La, Ce, Nd, because of their larger contribution to the overall variance, having the strongest correlations, and the most similar patterns. The research outcomes add useful data to the scarce literature on the REE concentrations in olive oils, which are important for assessing food quality, especially in Mediterranean countries, where EVOO represents the main fat source, which is consumed daily. The use of the information gathered in this study can be a useful starting point for producing a reliable discrimination model that allows the verification and certification of the geographical origin of EVOOs produced in the Chieti and Pescara districts of Abruzzo Region. Future use of the developed procedure with larger data sets will verify its value. Furthermore, the relationships between EVOO samples originating from different areas and the effects of biogeochemical drivers on the geographical distribution of the elements require further exploration.

Supplementary Materials

The following supporting information can be downloaded at: https://www.mdpi.com/article/10.3390/foods13010141/s1, Figure S1: PCA loading plot; Figure S2. Score plot of EVOO samples and foreign oils from Pisciottana, (Calabria region, D1), Frantoio (Piemonte region, D2), Taggiasca (Liguria region, D3), and EVOO blend (D4); Table S1. ICP-MS instrumentation and operating conditions; Table S2. LOD and LOQ values of elements in olive oils; Table S3. Range of REE concentrations in EVOO samples and those found in the literature (ng g-1); Table S4. Confusion matrix for the training samples based on geographical location; Table S5. Confusion matrix for the training samples based on cultivar.

Author Contributions

Conceptualization, A.C. (Angelo Cichelli), A.C. (Alessandro Chiaudani) and F.F.; methodology, A.C. (Angelo Cichelli), A.C. (Alessandro Chiaudani) and F.F.; formal analysis A.C. (Alessandro Chiaudani), F.F. and C.P.; investigation, A.C. (Ada Consalvo) and M.B.; data curation, A.C. (Alessandro Chiaudani), F.F. and C.P.; writing—original draft preparation, A.C. (Alessandro Chiaudani) and F.F.; writing—review and editing, A.C. (Alessandro Chiaudani), F.F., A.C. (Angelo Cichelli) and A.P.; visualization, A.C. (Alessandro Chiaudani) and F.F.; supervision, A.C. (Angelo Cichelli), A.C. (Alessandro Chiaudani) and F.F.; project administration, A.C. (Angelo Cichelli); funding acquisition, A.C. (Angelo Cichelli). All authors have read and agreed to the published version of the manuscript.

Funding

This research was conducted within the activities of the RTDA contract cofunded by PON “Ricerca e innovazione” 2014–2020 (PON R&I FSE-REACT EU), Azione IV.6 “Contratti di ricercar su tematiche Green”.

Institutional Review Board Statement

Not applicable.

Informed Consent Statement

Not applicable.

Data Availability Statement

Data is contained within the article.

Acknowledgments

The authors are grateful for Valeria Melai, Marco Di Marzio and Stefania Fensore for their help.

Conflicts of Interest

The authors declare no conflicts of interest.

References

  1. García-González, D.L.; Luna, G.; Morales, M.T.; Aparicio, R. Stepwise geographical traceability of virgin olive oils by chemical profiles using artificial neural network models. Eur. J. Lipid Sci. Technol. 2009, 111, 1003–1013. [Google Scholar] [CrossRef]
  2. Farmaki, E.G.; Thomaidis, N.S.; Minioti, K.S.; Ioannou, E.; Georgiou, C.A.; Efstathiou, C.E. Geographical Characterization of Greek Olive Oils Using Rare Earth Elements Content and Supervised Chemometric Techniques. Anal. Lett. 2012, 45, 920–932. [Google Scholar] [CrossRef]
  3. Cajka, T.; Riddellova, K.; Klimankova, E.; Cerna, M.; Pudil, F.; Hajslova, J. Traceability of olive oil based on volatiles pattern and multivariate analysis. Food Chem. 2010, 121, 282–289. [Google Scholar] [CrossRef]
  4. Barbera, M. Reuse of food waste and wastewater as a source of polyphenolic compounds to use as food additives. J. AOAC Int. 2020, 103, 906–914. [Google Scholar] [CrossRef] [PubMed]
  5. Tripoli, E.; Giammanco, M.; Tabacchi, G.; Di Majo, D.; Giammanco, S.; La Guardia, M. The phenolic compounds of olive oil: Structure, biological activity and beneficial effects on human health. Nutr. Res. Rev. 2005, 18, 98–112. [Google Scholar] [CrossRef] [PubMed]
  6. Issaoui, M.; Delgado, A.M.; Caruso, G.; Micali, M.; Barbera, M.; Atrous, H.; Ouslati, A.; Chammem, N. Phenols, flavors, and the mediterranean diet. J. AOAC Int. 2021, 103, 915–924. [Google Scholar] [CrossRef] [PubMed]
  7. Aguilera, Y.; Martin-Cabrejas, M.A.; González de Mejia, E. Phenolic compounds in fruits and beverages consumed as part of the mediterranean diet: Their role in prevention of chronic diseases. Phytochem. Rev. 2016, 15, 405–423. [Google Scholar] [CrossRef]
  8. Martinez-González, M.Á.; Sánchez-Villegas, A. The emerging role of Mediterranean diets in cardiovascular epidemiology: Monounsaturated fats, olive oil, red wine or the whole pattern? Eur. J. Epidemiol. 2004, 19, 9–13. [Google Scholar] [CrossRef]
  9. Visioli, F.; Davalos, A.; López de las Hazas, M.C.; Crespo, M.C.; Tomé-Carneiro, J. An overview of the pharmacology of olive oil and its active ingredients. Br. J. Pharmacol. 2020, 177, 1316–1330. [Google Scholar] [CrossRef]
  10. International Olive Oil Council. Production of Olive Oil. Available online: https://www.internationaloliveoil.org/wp-content/uploads/2022/12/IOC-Olive-Oil-Dashboard-2.html#production-1 (accessed on 4 July 2023).
  11. ISTAT. Coltivazioni: Superfici e Produzione—Dati in Complesso—Prov. Available online: http://dati.istat.it/Index.aspx?QueryId=37850 (accessed on 4 July 2023).
  12. Flamminii, F.; Marone, E.; Neri, L.; Pollastri, L.; Cichelli, A.; Di Mattia, C.D. The Effect of Harvesting Time on Olive Fruits and Oils Quality Parameters of Tortiglione and Dritta Olive Cultivars. Eur. J. Lipid Sci. Technol. 2021, 123, 2000382. [Google Scholar] [CrossRef]
  13. NYIOOC. Yearly Stats for 2022—Best Olive Oils. 2022. Available online: https://bestoliveoils.org/statistics/2022 (accessed on 4 July 2023).
  14. Bryla, P. The impact of obtaining a European quality sign on origin food producers. Qual. Assur. Saf. Crops Foods 2018, 10, 155–164. [Google Scholar] [CrossRef]
  15. Camin, F.; Larcher, R.; Perini, M.; Bontempo, L.; Bertoldi, D.; Gagliano, G.; Nicolini, G.; Versini, G. Characterisation of authentic Italian extra-virgin olive oils by stable isotope ratios of C, O and H and mineral composition. Food Chem. 2010, 118, 901–909. [Google Scholar] [CrossRef]
  16. Chiocchini, F.; Portarena, S.; Ciolfi, M.; Brugnoli, E.; Lauteri, M. Isoscapes of carbon and oxygen stable isotope compositions in tracing authenticity and geographical origin of Italian extra-virgin olive oils. Food Chem. 2016, 202, 291–301. [Google Scholar] [CrossRef] [PubMed]
  17. Medini, S.; Janin, M.; Verdoux, P.; Techer, I. Methodological development for 87Sr/86Sr measurement in olive oil and preliminary discussion of its use for geographical traceability of PDO Nîmes (France). Food Chem. 2015, 171, 78–83. [Google Scholar] [CrossRef] [PubMed]
  18. Tescione, I.; Marchionni, S.; Casalini, M.; Vignozzi, N.; Mattei, M.; Conticelli, S. 87Sr/86Sr isotopes in grapes of different cultivars: A geochemical tool for geographic traceability of agriculture products. Food Chem. 2018, 258, 374–380. [Google Scholar] [CrossRef]
  19. Aceto, M.; Calà, E.; Musso, D.; Regalli, N.; Oddone, M. A preliminary study on the authentication and traceability of extra virgin olive oil made from Taggiasca olives by means of trace and ultra-trace elements distribution. Food Chem. 2019, 298, 125047. [Google Scholar] [CrossRef]
  20. Bimbo, F.; Bonanno, A.; Viscecchia, R. An empirical framework to study food labelling fraud: An application to the Italian extra-virgin olive oil market. Aust. J. Agric. Resour. Econ. 2019, 63, 701–725. [Google Scholar] [CrossRef]
  21. Mendez, J.; Mendoza, L.; Cruz-Tirado, J.P.; Quevedo, R.; Siche, R. Trends in application of NIR and hyperspectral imaging for food authentication. Sci. Agropecu. 2019, 10, 143–161. Available online: http://www.scielo.org.pe/scielo.php?script=sci_arttext&pid=S2077-99172019000100016&lng=es&nrm=iso&tlng=en (accessed on 4 July 2023). [CrossRef]
  22. Calò, F.; Girelli, C.R.; Wang, S.C.; Fanizzi, F.P. Geographical Origin Assessment of Extra Virgin Olive Oil via NMR and MS Combined with Chemometrics as Analytical Approaches. Foods 2022, 11, 113. [Google Scholar] [CrossRef]
  23. European Commission. Regulation (EU) No 1151/2012 of the European Parliament and of the Council of 21 November 2012 on Quality Schemes for Agricultural Products and Foodstuffs. Off. J. Eur. Union 2012, 343, 1–29. [Google Scholar]
  24. Dekhili, S.; Sirieix, L.; Cohen, E. How consumers choose olive oil: The importance of origin cues. Food Qual. Prefer. 2011, 22, 757–762. [Google Scholar] [CrossRef]
  25. Menapace, L.; Colson, G.; Grebitus, C.; Facendola, M. Consumers’ preferences for geographical origin labels: Evidence from the Canadian olive oil market. Eur. Rev. Agric. Econ. 2011, 38, 193–212. [Google Scholar] [CrossRef]
  26. Aceto, M. The Use of ICP-MS in Food Traceability. In Advances in Food Traceability Techniques and Technologies: Improving Quality Throughout the Food Chain; Woodhead Publishing: Cambridge, UK, 2016; pp. 137–164. [Google Scholar]
  27. Nasr, E.G.; Epova, E.N.; Sebilo, M.; Larivière, D.; Hammami, M.; Souissi, R.; Abderrazak, H.; Donard, O.F. Olive Oil Traceability Studies Using Inorganic and Isotopic Signatures: A Review. Molecules 2022, 27, 2014. [Google Scholar] [CrossRef] [PubMed]
  28. Scatigno, C.; Festa, G. A first elemental pattern and geo-discrimination of Italian EVOO by energy dispersive X-ray fluorescence and chemometrics. Microchem. J. 2021, 171, 106863. [Google Scholar] [CrossRef]
  29. Gertz, C.; Gertz, A.; Matthäus, B.; Willenberg, I. A Systematic Chemometric Approach to Identify the Geographical Origin of Olive Oils. Eur. J. Lipid Sci. Technol. 2019, 121, 1900281. [Google Scholar] [CrossRef]
  30. Bajoub, A.; Hurtado-Fernández, E.; Ajal, E.A.; Ouazzani, N.; Fernández-Gutiérrez, A.; Carrasco-Pancorbo, A. Comprehensive 3-year study of the phenolic profile of Moroccan monovarietal virgin olive oils from the meknès region. J. Agric. Food Chem. 2015, 63, 4376–4385. [Google Scholar] [CrossRef]
  31. Quintanilla-Casas, B.; Bertin, S.; Leik, K.; Bustamante, J.; Guardiola, F.; Valli, E.; Bendini, A.; Toschi, T.G.; Tres, A.; Vichi, S. Profiling versus fingerprinting analysis of sesquiterpene hydrocarbons for the geographical authentication of extra virgin olive oils. Food Chem. 2020, 307, 125556. [Google Scholar] [CrossRef]
  32. Youseff, R.; Soubh, L.; Alassaf, Z. Detection of Vegetable Oils Adulteration Using Desmethylsterols Composition. Int. J. Pharm. Sci. 2014, 28, 229–233. [Google Scholar]
  33. Noorali, M.; Barzegar, M.; Sahari, M.A. Sterol and Fatty Acid Compositions of Olive Oil as an Indicator of Cultivar and Growing Area. J. Am. Oil Chem. Soc. 2014, 91, 1571–1581. [Google Scholar] [CrossRef]
  34. Camin, F.; Pavone, A.; Bontempo, L.; Wehrens, R.; Paolini, M.; Faberi, A.; Marianella, R.M.; Capitani, D.; Vista, S.; Mannina, L. The use of IRMS, 1H NMR and chemical analysis to characterise Italian and imported Tunisian olive oils. Food Chem. 2016, 196, 98–105. [Google Scholar] [CrossRef]
  35. Danezis, G.P.; Tsagkaris, A.S.; Camin, F.; Brusic, V.; Georgiou, C.A. Food authentication: Techniques, trends & emerging approaches. TrAC Trends Anal. Chem. 2016, 85, 123–132. [Google Scholar]
  36. Gupta, N.; Yadav, K.K.; Kumar, V.; Kumar, S.; Chadd, R.P.; Kumar, A. Trace elements in soil-vegetables interface: Translocation, bioaccumulation, toxicity and amelioration—A review. Sci. Total Environ. 2019, 651, 2927–2942. [Google Scholar] [CrossRef] [PubMed]
  37. Wadood, S.A.; Boli, G.; Xiaowen, Z.; Hussain, I.; Yimin, W. Recent development in the application of analytical techniques for the traceability and authenticity of food of plant origin. Microchem. J. 2020, 152, 104295. [Google Scholar] [CrossRef]
  38. Capo, R.C.; Stewart, B.W.; Chadwick, O.A. Strontium isotopes as tracers of ecosystem processes: Theory and methods. Geoderma 1998, 82, 197–225. [Google Scholar] [CrossRef]
  39. Voerkelius, S.; Lorenz, G.D.; Rummel, S.; Quétel, C.R.; Heiss, G.; Baxter, M.; Brach-Papa, C.; Deters-Itzelsberger, P.; Hoelzl, S.; Hoogewerff, J.; et al. Strontium isotopic signatures of natural mineral waters, the reference to a simple geological map and its potential for authentication of food. Food Chem. 2010, 118, 933–940. [Google Scholar] [CrossRef]
  40. Dais, P.; Hatzakis, E. Quality assessment and authentication of virgin olive oil by NMR spectroscopy: A critical review. Anal. Chim. Acta 2013, 765, 1–27. [Google Scholar] [CrossRef] [PubMed]
  41. Muzzalupo, I. Olive Germplasm—The Olive Cultivation, Table Olive and Olive Oil Industry in Italy. 2012. Available online: https://www.intechopen.com/books/2986 (accessed on 4 July 2023).
  42. Sanmartin, C.; Venturi, F.; Sgherri, C.; Nari, A.; Macaluso, M.; Flamini, G.; Quartacci, M.F.; Taglieri, I.; Andrich, G.; Zinnai, A. The effects of packaging and storage temperature on the shelf-life of extra virgin olive oil. Heliyon 2018, 4, e00888. [Google Scholar] [CrossRef]
  43. Aceto, M. Metals in wine. In Reviews in Food and Nutrition Toxicity; CRCC Press: Boca Raton, FL, USA, 2003. [Google Scholar]
  44. Angioni, A.; Cabitza, M.; Russo, M.T.; Caboni, P. Influence of olive cultivars and period of harvest on the contents of Cu, Cd, Pb, and Zn in virgin olive oils. Food Chem. 2006, 99, 525–529. [Google Scholar] [CrossRef]
  45. Benincasa, C.; Gharsallaoui, M.; Perri, E.; Briccoli Bati, C.; Ayadi, M.; Khlif, M.; Gabsi, S. Quality and trace element profile of tunisian olive oils obtained from plants irrigated with treated wastewater. Sci. World J. 2012, 2012, 535781. [Google Scholar] [CrossRef]
  46. Khan, M.A.; Khan, S.; Khan, A.; Alam, M. Soil contamination with cadmium, consequences and remediation using organic amendments. Sci. Total Environ. 2017, 601–602, 1591–1605. [Google Scholar] [CrossRef]
  47. Greenough, J.D.; Fryer, B.J.; Mallory-Greenough, L. Trace element geochemistry of Nova Scotia (Canada) maple syrup. Can. J. Earth Sci. 2010, 47, 1093–1110. [Google Scholar] [CrossRef]
  48. Gouvinhas, I.; Domínguez-Perles, R.; Machado, N.; Carvalho, T.; Matos, C.; Barros, A.I.R.N.A. Effect of Agro-Environmental Factors on the Mineral Content of Olive Oils: Categorization of the Three Major Portuguese Cultivars. J. Am. Oil Chem. Soc. 2016, 93, 813–822. [Google Scholar] [CrossRef]
  49. Damak, F.; Asano, M.; Baba, K.; Suda, A.; Araoka, D.; Wali, A.; Isoda, H.; Nakajima, M.; Ksibi, M.; Tamura, K. Interregional traceability of Tunisian olive oils to the provenance soil by multielemental fingerprinting and chemometrics. Food Chem. 2019, 283, 656–664. [Google Scholar] [CrossRef]
  50. Turra, C. Sustainability of rare earth elements chain: From production to food—A review. Int. J. Environ. Health Res. 2018, 28, 23–42. [Google Scholar] [CrossRef] [PubMed]
  51. Aide, M. Lanthanide Soil Chemistry and Its Importance in Understanding Soil Pathways: Mobility, Plant Uptake, and Soil Health. In Lanthanides; IntechOpen: Rijeka, Croatia, 2018; Available online: https://www.intechopen.com/state.item.id (accessed on 20 July 2023).
  52. Pošćić, F.; Furdek Turk, M.; Bačić, N.; Mikac, N.; Bertoldi, D.; Camin, F.; Špika, M.J.; Žanetić, M.; Rengel, Z.; Perica, S. Removal of pomace residues is critical in quantification of element concentrations in extra virgin olive oil. J. Food Compos. Anal. 2019, 77, 39–46. [Google Scholar] [CrossRef]
  53. Liang, T.; Ding, S.; Somg, W.; Chong, Z.; Zhang, C.; Li, H. A review of fractionations of rare earth elements in plants. J. Rare Earths 2008, 26, 7–15. [Google Scholar] [CrossRef]
  54. Valentin, J.L.; Watling, R.J. Provenance establishment of coffee using solution ICP-MS and ICP-AES. Food Chem. 2013, 141, 98–104. [Google Scholar] [CrossRef]
  55. Aceto, M.; Bonello, F.; Musso, D.; Tsolakis, C.; Cassino, C.; Osella, D. Wine Traceability with Rare Earth Elements. Beverages 2018, 4, 23. [Google Scholar] [CrossRef]
  56. Barbera, M.; Saiano, F.; Tutone, L.; Massenti, R.; Pisciotta, A. The Pattern of Rare Earth Elements Like a Possible Helpful Tool in Traceability and Geographical Characterization of the Soil-Olive System (Olea europaea L.). Plants 2022, 11, 2579. [Google Scholar] [CrossRef]
  57. Telloli, C.; Tagliavini, S.; Passarini, F.; Salvi, S.; Rizzo, A. ICP-MS triple quadrupole as analytical technique to define trace and ultra-trace fingerprint of extra virgin olive oil. Food Chem. 2023, 402, 134247. [Google Scholar] [CrossRef]
  58. Rollinson, H. Geochemistry by William M. White. Wiley-Blackwell, Chichester, 2013. No. of pages: Viii+660. Price: UK£42.50. ISBN 978-0-470-65668 (paperback). Geol. J. 2016, 51, 499–500. [Google Scholar] [CrossRef]
  59. Joebstl, D.; Bandoniene, D.; Meisel, T.; Chatzistathis, S. Identification of the geographical origin of pumpkin seed oil by the use of rare earth elements and discriminant analysis. Food Chem. 2010, 123, 1303–1309. [Google Scholar] [CrossRef]
  60. Aceto, M.; Baldizzone, M.; Oddone, M. Keeping the track of quality: Authentication and traceability studies on wine. In Red Wine and Health; Nova Science Publishers, Inc.: New York, NY, USA, 2009; pp. 429–466. [Google Scholar]
  61. Rare Earths Statistics and Information|U.S. Geological Survey. Available online: https://www.usgs.gov/centers/national-minerals-information-center/rare-earths-statistics-and-information#pubs (accessed on 20 July 2023).
  62. Tarquini, S.; Vinci, S.; Favalli, M.; Doumaz, F.; Fornaciai, A.; Nannipieri, L. Release of a 10-m-resolution DEM for the Italian territory: Comparison with global-coverage DEMs and anaglyph-mode exploration via the web. Comput. Geosci. 2012, 38, 168–170. [Google Scholar] [CrossRef]
  63. Balcaen, L.; Bolea-Fernandez, E.; Resano, M.; Vanhaecke, F. Inductively coupled plasma—Tandem mass spectrometry (ICP-MS/MS): A powerful and universal tool for the interference-free determination of (ultra)trace elements—A tutorial review. Anal. Chim. Acta 2015, 894, 7–19. [Google Scholar] [CrossRef] [PubMed]
  64. Magnusson, B.; Örnemark, U. Eurache Guide: The Fitness for Purpose of Analytical Methods—A Laboratory Guide to Method Validation and Related Topics, 2nd ed.; 2014; Available online: https://www.eurachem.org/images/stories/Guides/pdf/MV_guide_2nd_ed_EN.pdf (accessed on 15 November 2023).
  65. Šilarová, P.; Eslová, L.C.; Meloun, M. Fast gradient HPLC/MS separation of phenolics in green tea to monitor their degradation. Food Chem. 2017, 237, 471–480. [Google Scholar] [CrossRef] [PubMed]
  66. Trombetta, D.; Smeriglio, A.; Marcoccia, D.; Giofrè, S.; Toscano, G.; Mazzotti, F.; Giovanazzi, A.; Lorenzetti, S. Analytical Evaluation and Antioxidant Properties of Some Secondary Metabolites in Northern Italian Mono- and Multi-Varietal Extra Virgin Olive Oils (EVOOs) from Early and Late Harvested Olives. Int. J. Mol. Sci. 2017, 18, 797. [Google Scholar] [CrossRef] [PubMed]
  67. Płotka-Wasylka, J.; Simeonov, V.; Namieśnik, J. Characterization of home-made and regional fruit wines by evaluation of correlation between selected chemical parameters. Microchem. J. 2018, 140, 66–73. [Google Scholar] [CrossRef]
  68. Metsalu, T.; Vilo, J. ClustVis: A web tool for visualizing clustering of multivariate data using Principal Component Analysis and heatmap. Nucleic Acids Res. 2015, 43, W566–W570. [Google Scholar] [CrossRef]
  69. Pošćić, F.; Žanetić, M.; Fiket, Ž.; Furdek Turk, M.; Mikac, N.; Bačić, N.; Lučić, M.; Romić, M.; Bakić, H.; Jukić Špika, M.; et al. Accumulation and partitioning of rare earth elements in olive trees and extra virgin olive oil from Adriatic coastal region. Plant Soil 2020, 448, 133–151. [Google Scholar] [CrossRef]
  70. Astolfi, M.L.; Marini, F.; Frezzini, M.A.; Massimi, L.; Capriotti, A.L.; Montone, C.M.; Canepari, S. Multielement Characterization and Antioxidant Activity of Italian Extra-Virgin Olive Oils. Front. Chem. 2021, 9, 769620. [Google Scholar] [CrossRef]
  71. Damak, F.; Bougi, M.S.; Araoka, D.; Baba, K.; Furuya, M.; Ksibi, M.; Tamura, K. Soil geochemistry, edaphic and climatic characteristics as components of Tunisian olive terroirs: Relationship with the multielemental composition of olive oils for their geographical traceability. EuroMediterr. J. Environ. Integr. 2021, 3, 37. [Google Scholar] [CrossRef]
  72. Sayago, A.; González-Domínguez, R.; Beltrán, R.; Fernández-Recamales, Á. Combination of complementary data mining methods for geographical characterization of extra virgin olive oils based on mineral composition. Food Chem. 2018, 261, 42–50. [Google Scholar] [CrossRef] [PubMed]
  73. Anders, E.; Grevesse, N. Abundances of the elements: Meteoritic and solar. Geochim. Cosmochim. Acta 1989, 53, 197–214. [Google Scholar] [CrossRef]
  74. Masuda, A. Abundances of monoisotopic REE, consistent with the Leedey chondrite values. Geochem. J. 1975, 9, 183–184. [Google Scholar] [CrossRef]
  75. Squadrone, S.; Brizio, P.; Stella, C.; Pederiva, S.; Brusa, F.; Mogliotti, P.; Garrone, A.; Abete, M.C. Trace and rare earth elements in monofloral and multifloral honeys from Northwestern Italy; A first attempt of characterization by a multi-elemental profile. J. Trace Elem. Med. Biol. 2020, 61, 126556. [Google Scholar] [CrossRef]
  76. Oddo, G. Die Molekularstruktur der radioaktiven Atome. Z. Anorg. Chem. 1914, 87, 253–268. [Google Scholar] [CrossRef]
  77. Harkins, W.D. The evolution of the elements and the stability of complex atoms. I. A new periodic system which shows a relation between the abundance of the elements and the structure of the nuclei of atoms. J. Am. Chem. Soc. 1917, 39, 856–879. [Google Scholar] [CrossRef]
  78. Ariyama, K.; Nishida, T.; Noda, T.; Kadorura, M.; Yasui, A. Effects of fertilization, crop year, variety, and provenance factors on mineral concentrations in onions. J. Agric. Food Chem. 2006, 54, 3341–3350. [Google Scholar] [CrossRef]
Figure 1. (a) Simplified geological map showing the different lithologies characterizing the Abruzzo region (modified from a geological map of Italy on a 1:50,000 scale, sheets: 361; www.isprambiente.gov.it/Media/carg/note_illustrative/361_Chieti.pdf, accessed on 09 October 2023), processed using Q-GIS tools and overlaid on a 3D topographic digital elevation model of Italy with a 10 m cell size [62]. Green diamonds indicate the localization of the analyzed olive orchards: LA, Loreto Aprutino; Pi, Pianella; Al, Alanno; Ca, Casoli; Sc, Scerni; Va, Vasto. (b) Location of Abruzzo region in Italy.
Foods 13 00141 g001
Figure 2. Mean REE concentrations in oils: light La, Ce, Pr, Nd, Sm, Eu, Gd; heavy: Y, Dy, Er, Yb (a); REE concentration patterns normalized to chondrite values (b).
Foods 13 00141 g002aFoods 13 00141 g002b
Figure 3. Biplot of oil samples and REEs.
Foods 13 00141 g003
Figure 4. Observation plot of LDA.
Foods 13 00141 g004
Figure 5. Heatmap plot of REEs and olive oils.
Foods 13 00141 g005
Table 1. Olive oil samples: geographical location, sample coding, and cultivars.
Abruzzo ProvinceGeographical Location
(Number of Samples)
Sample CodeCultivar
Pescara
(n = 18)
Loreto Aprutino
(n = 2)
B2, C6Frantoio
Pianella
(n = 2)
B10, C11Leccino
Pianella
(n = 2)
A7, C7Arbequina
Pianella
(n = 1)
A8Arbosana
Pianella
(n = 1)
A3Koroneiki
Pianella
(n = 2)
A5, C10Dritta
Alanno
(n = 1)
A6FS17
Alanno
(n = 1)
A9Don Carlo
Loreto Aprutino
(n = 1)
B1Dritta
Pianella
(n = 1)
B7Arbequina
Pianella
(n = 1)
B8Peranzana
Pianella
(n = 1)
B9Koroneiki
Pianella
(n = 1)
B6Arbosana
Pianella
(n = 1)
C12Frantoio
Chieti
(n = 11)
Vasto
(n = 3)
A4, B3, C13Frantene
Vasto
(n = 2)
A2, B5Lecciana
Scerni
(n = 2)
B12, C5Lecciana
Scerni
(n = 2)
B13, C4Koroneiki
Casoli
(n = 1)
A1Arbequina
Scerni
(n = 1)
B11Oliana
Prefixes “A”, “B”, and “C” in the sample code correspond to 2019, 2020, and 2021, respectively. Numbers of samples are reported in brackets (n).
Table 2. REE concentrations (ng g−1) in olive oil samples. Mean and standard deviation (sd) of n = 3 replicates.
LightHeavy
Sample CodeLaCePrNdSmEuGdYDyErYb
A11.282.930.371.190.270.090.272.010.370.180.37
A21.713.690.451.440.360.180.362.430.360.360.36
A41.182.590.311.020.310.160.311.650.310.160.31
A51.593.470.401.290.300.200.402.280.400.200.30
A61.523.240.381.430.290.190.382.190.380.290.29
A71.423.090.331.340.330.170.332.090.330.250.33
A81.363.220.391.270.290.100.392.050.390.190.39
A91.463.280.361.370.360.180.362.190.360.180.36
B11.753.600.451.580.340.110.392.530.450.340.34
B21.683.420.361.440.360.120.362.340.360.360.36
B31.523.210.381.360.330.110.332.180.330.270.33
B51.242.600.251.050.250.120.251.800.310.250.25
B61.493.150.341.320.340.110.292.120.340.230.34
B71.573.260.351.400.290.120.352.270.350.230.35
B81.222.550.361.090.240.120.241.700.240.240.24
B91.433.070.331.320.270.110.332.080.330.330.33
B101.633.370.361.440.360.120.362.290.360.300.36
B111.653.350.401.480.340.110.342.330.400.340.34
B121.503.130.381.250.250.130.312.190.380.250.38
B131.432.970.341.310.290.110.342.000.340.230.34
C42.024.200.471.710.310.160.472.800.470.310.47
C52.034.220.471.720.390.160.472.820.470.310.47
C61.533.270.331.420.330.110.332.180.330.330.33
C71.412.940.351.290.230.120.352.000.350.230.35
C101.653.420.351.410.350.120.352.240.350.240.35
C111.623.750.371.370.250.120.372.120.370.250.25
C121.703.520.361.580.360.120.362.300.360.240.36
C131.372.980.371.240.250.120.251.990.370.250.25
Mean1.533.270.371.360.310.130.352.180.360.260.34
sd0.210.400.050.170.050.030.050.270.050.060.05
Table 3. Pearson correlation coefficients.
VariableYLaCePrNdSmEuGdDyErYb
Y1.00
La0.971.00
Ce0.940.961.00
Pr0.790.750.781.00
Nd0.940.950.910.711.00
Sm0.590.580.550.360.621.00
Eu0.230.220.270.270.140.231.00
Gd0.810.810.850.690.800.480.381.00
Dy0.830.770.810.760.750.340.210.781.00
Er0.580.600.490.400.600.33−0.040.290.291.00
Yb0.710.640.620.550.650.550.030.680.620.191.00
Table 4. Eigenvectors of PCA components F1 and F2.
F1F2
Y0.365−0.072
La0.360−0.092
Ce0.3580.021
Pr0.3070.102
Nd0.353−0.160
Sm0.236−0.028
Eu0.1030.761
Gd0.3280.242
Dy0.3160.127
Er0.202−0.544
Yb0.275−0.015
Table 5. Confusion matrix of samples grouped for vintage.
From\toABCTotal% Correct
A611875.00%
B01111291.67%
C035862.50%
Total61572878.57%
Disclaimer/Publisher’s Note: The statements, opinions and data contained in all publications are solely those of the individual author(s) and contributor(s) and not of MDPI and/or the editor(s). MDPI and/or the editor(s) disclaim responsibility for any injury to people or property resulting from any ideas, methods, instructions or products referred to in the content.

