
A Comprehensive View of Food Microbiota: Introducing FoodMicrobionet v5


Abstract
:1. Introduction
2. Materials and Methods
- Addition of data on fungi, with new samples and edges tables;
- Addition of two further accessory tables, abstracts and version history.
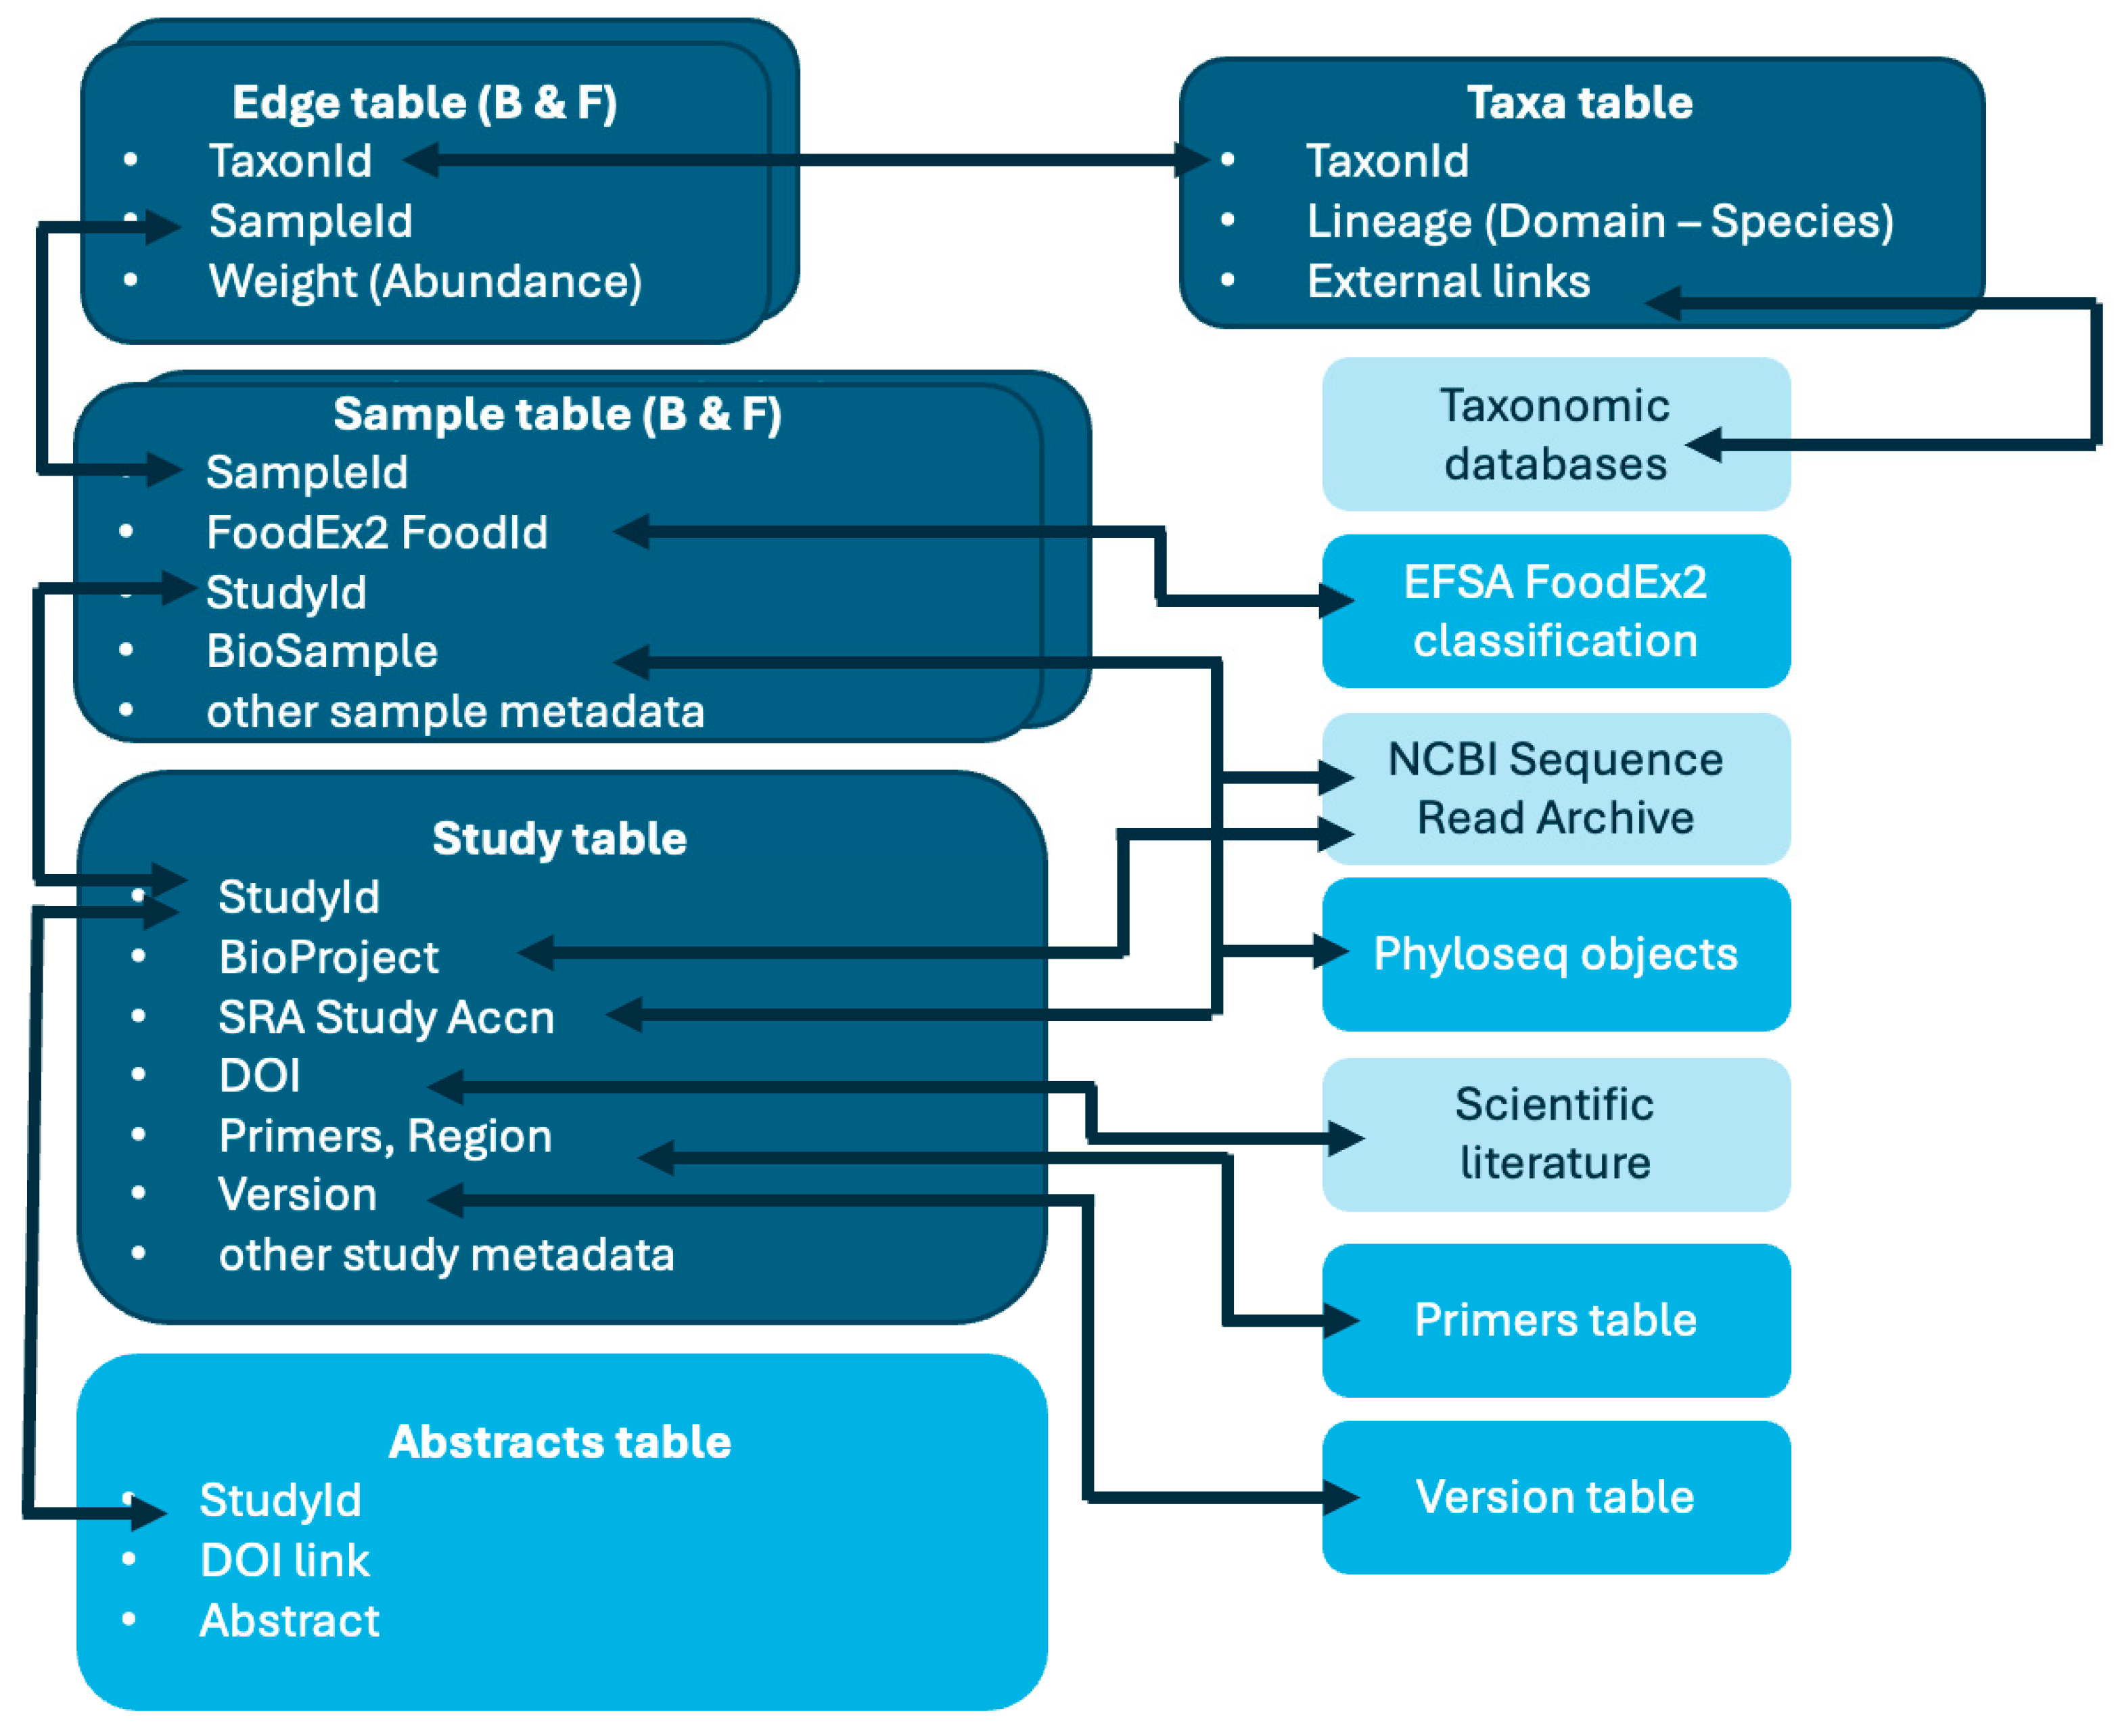
- Studies: study metadata, including NCBI SRA (https://www.ncbi.nlm.nih.gov/sra, last accessed on 18 April 2024) accession numbers for bioproject and study, references, nucleic acid targets, etc.; each study has a unique id and corresponds to a single NCBI project accession;
- Samples: sample description, FoodEx2 classification [30], NCBI SRA accession numbers for biosample and run (which are unique for each sample), etc.;
- Taxa: label and taxonomic lineage for taxa and links to external resources;
- Edges: relative abundance for each taxon found in a given sample
- Primers: with sequences of primers used for amplification and target regions;
- Abstracts: a text table with abstracts for each of the publications from which sequence data were obtained;
- Version history: change log and references for each FoodMicrobionet version;
- FoodEx2 classification.
- In some cases, data available in NCBI were deposited without fully adhering to SRA specifications (https://www.ncbi.nlm.nih.gov/sra/docs/submitmeta/, accessed on 18 April 2024): i.e., data for the same project were deposited within different bioproject accessions; data for the same biological sample were deposited with different biosample accessions;
- Metataxonomic taxa abundance data are, in their essence, compositional: no absolute quantification of target for bacteria and fungi is typically available and runs targeting, for example, the V3-V4 region of the 16S rRNA gene for bacteria and Internal Trasncribed Spacer 1 region (ITS1) for fungi are separate. In FoodMicrobionet, for both types of runs, the total number of sequences (which differ in the two runs) and the proportion for each taxon as relative abundance (%) is stored in sample and edges tables, respectively.
3. Results and Discussion
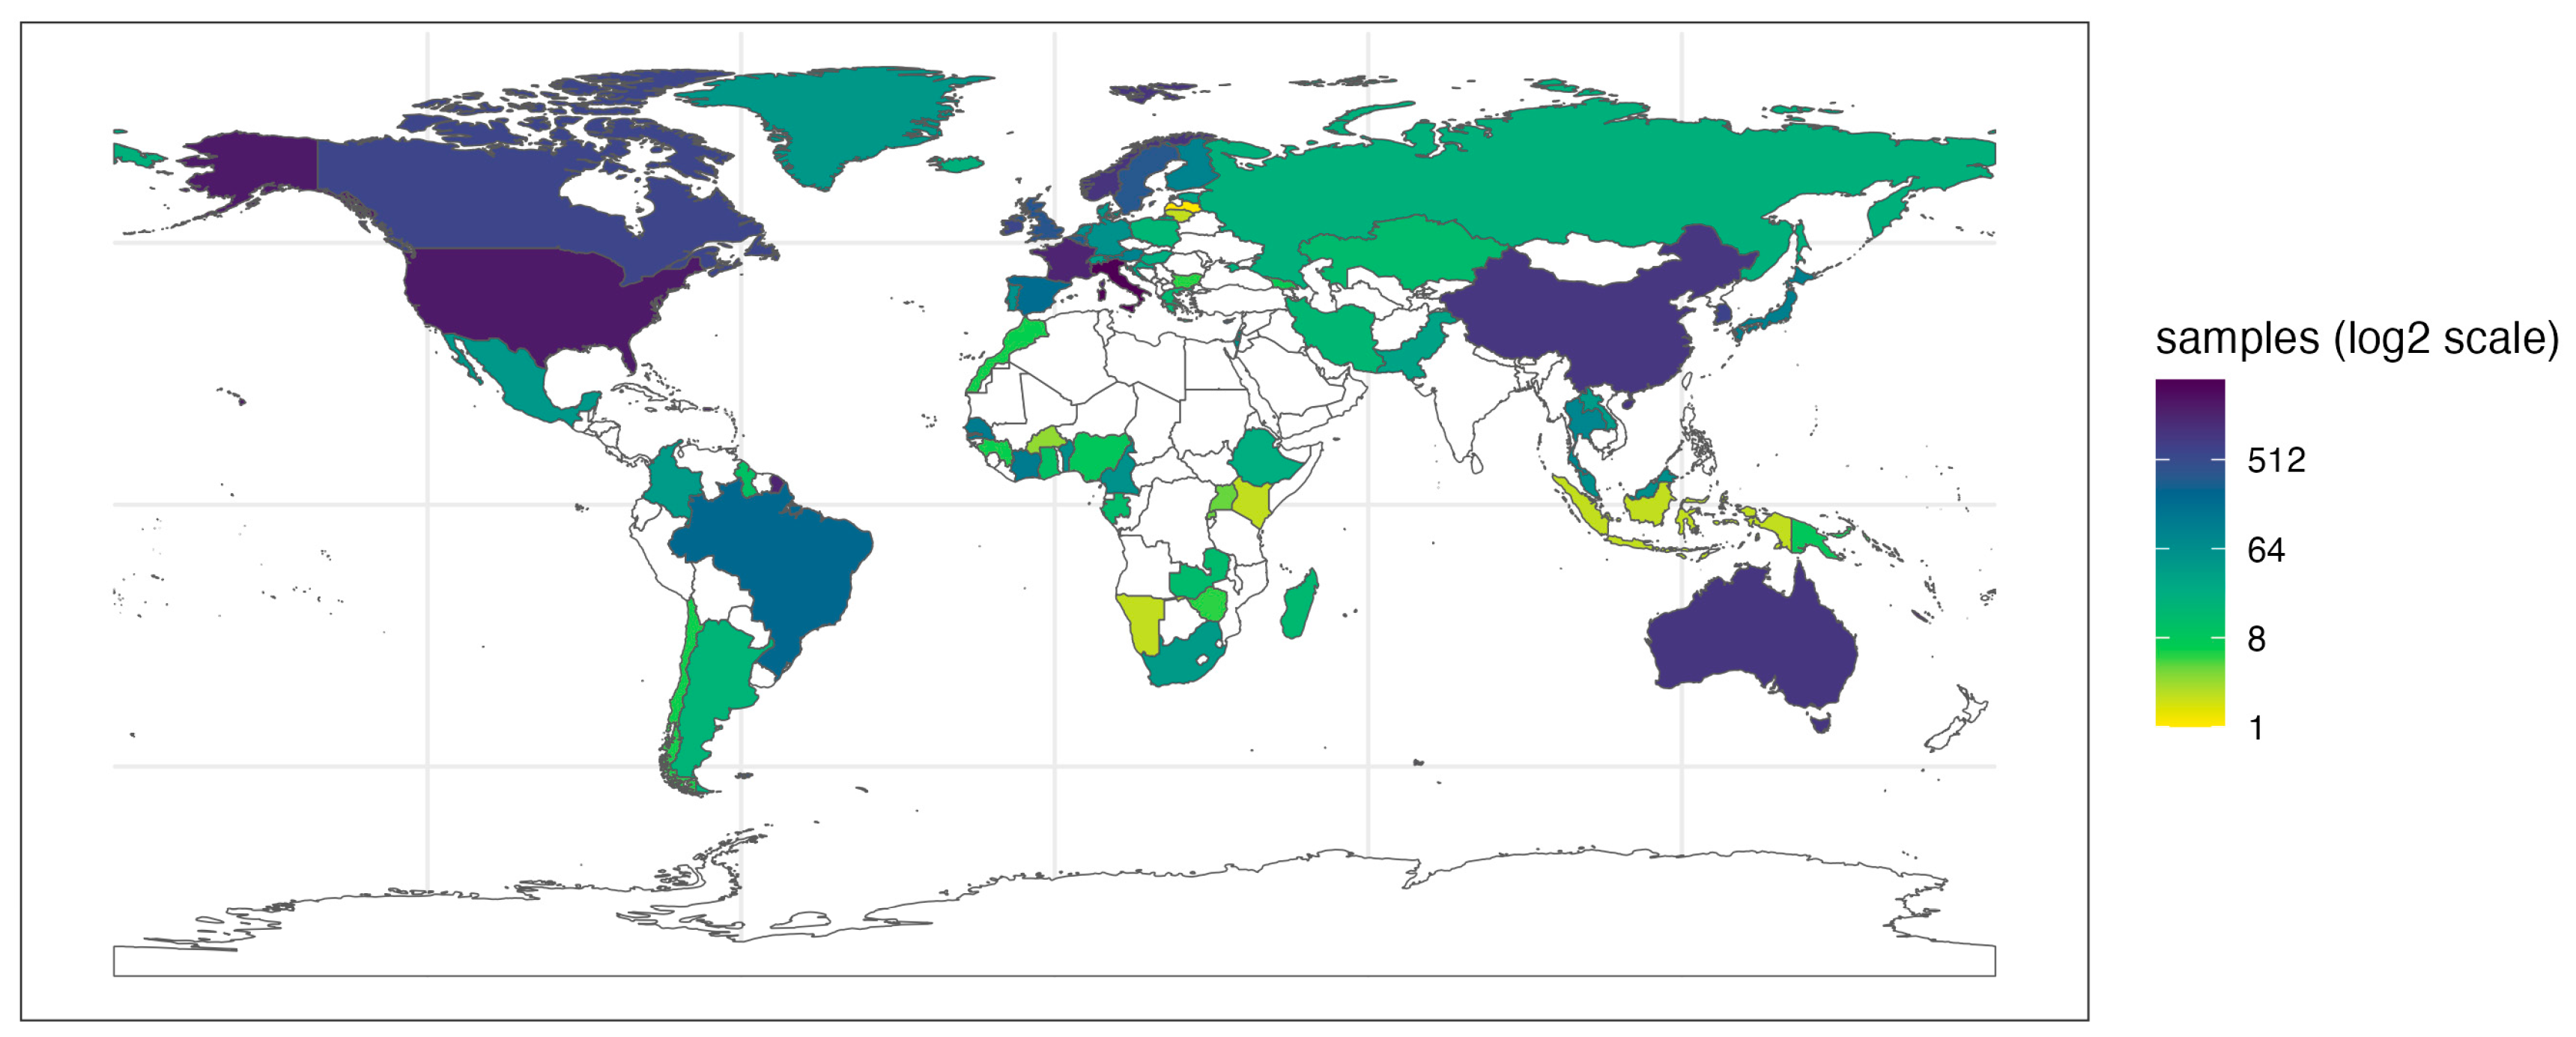
3.1. FoodMicrobionet, a Global Database
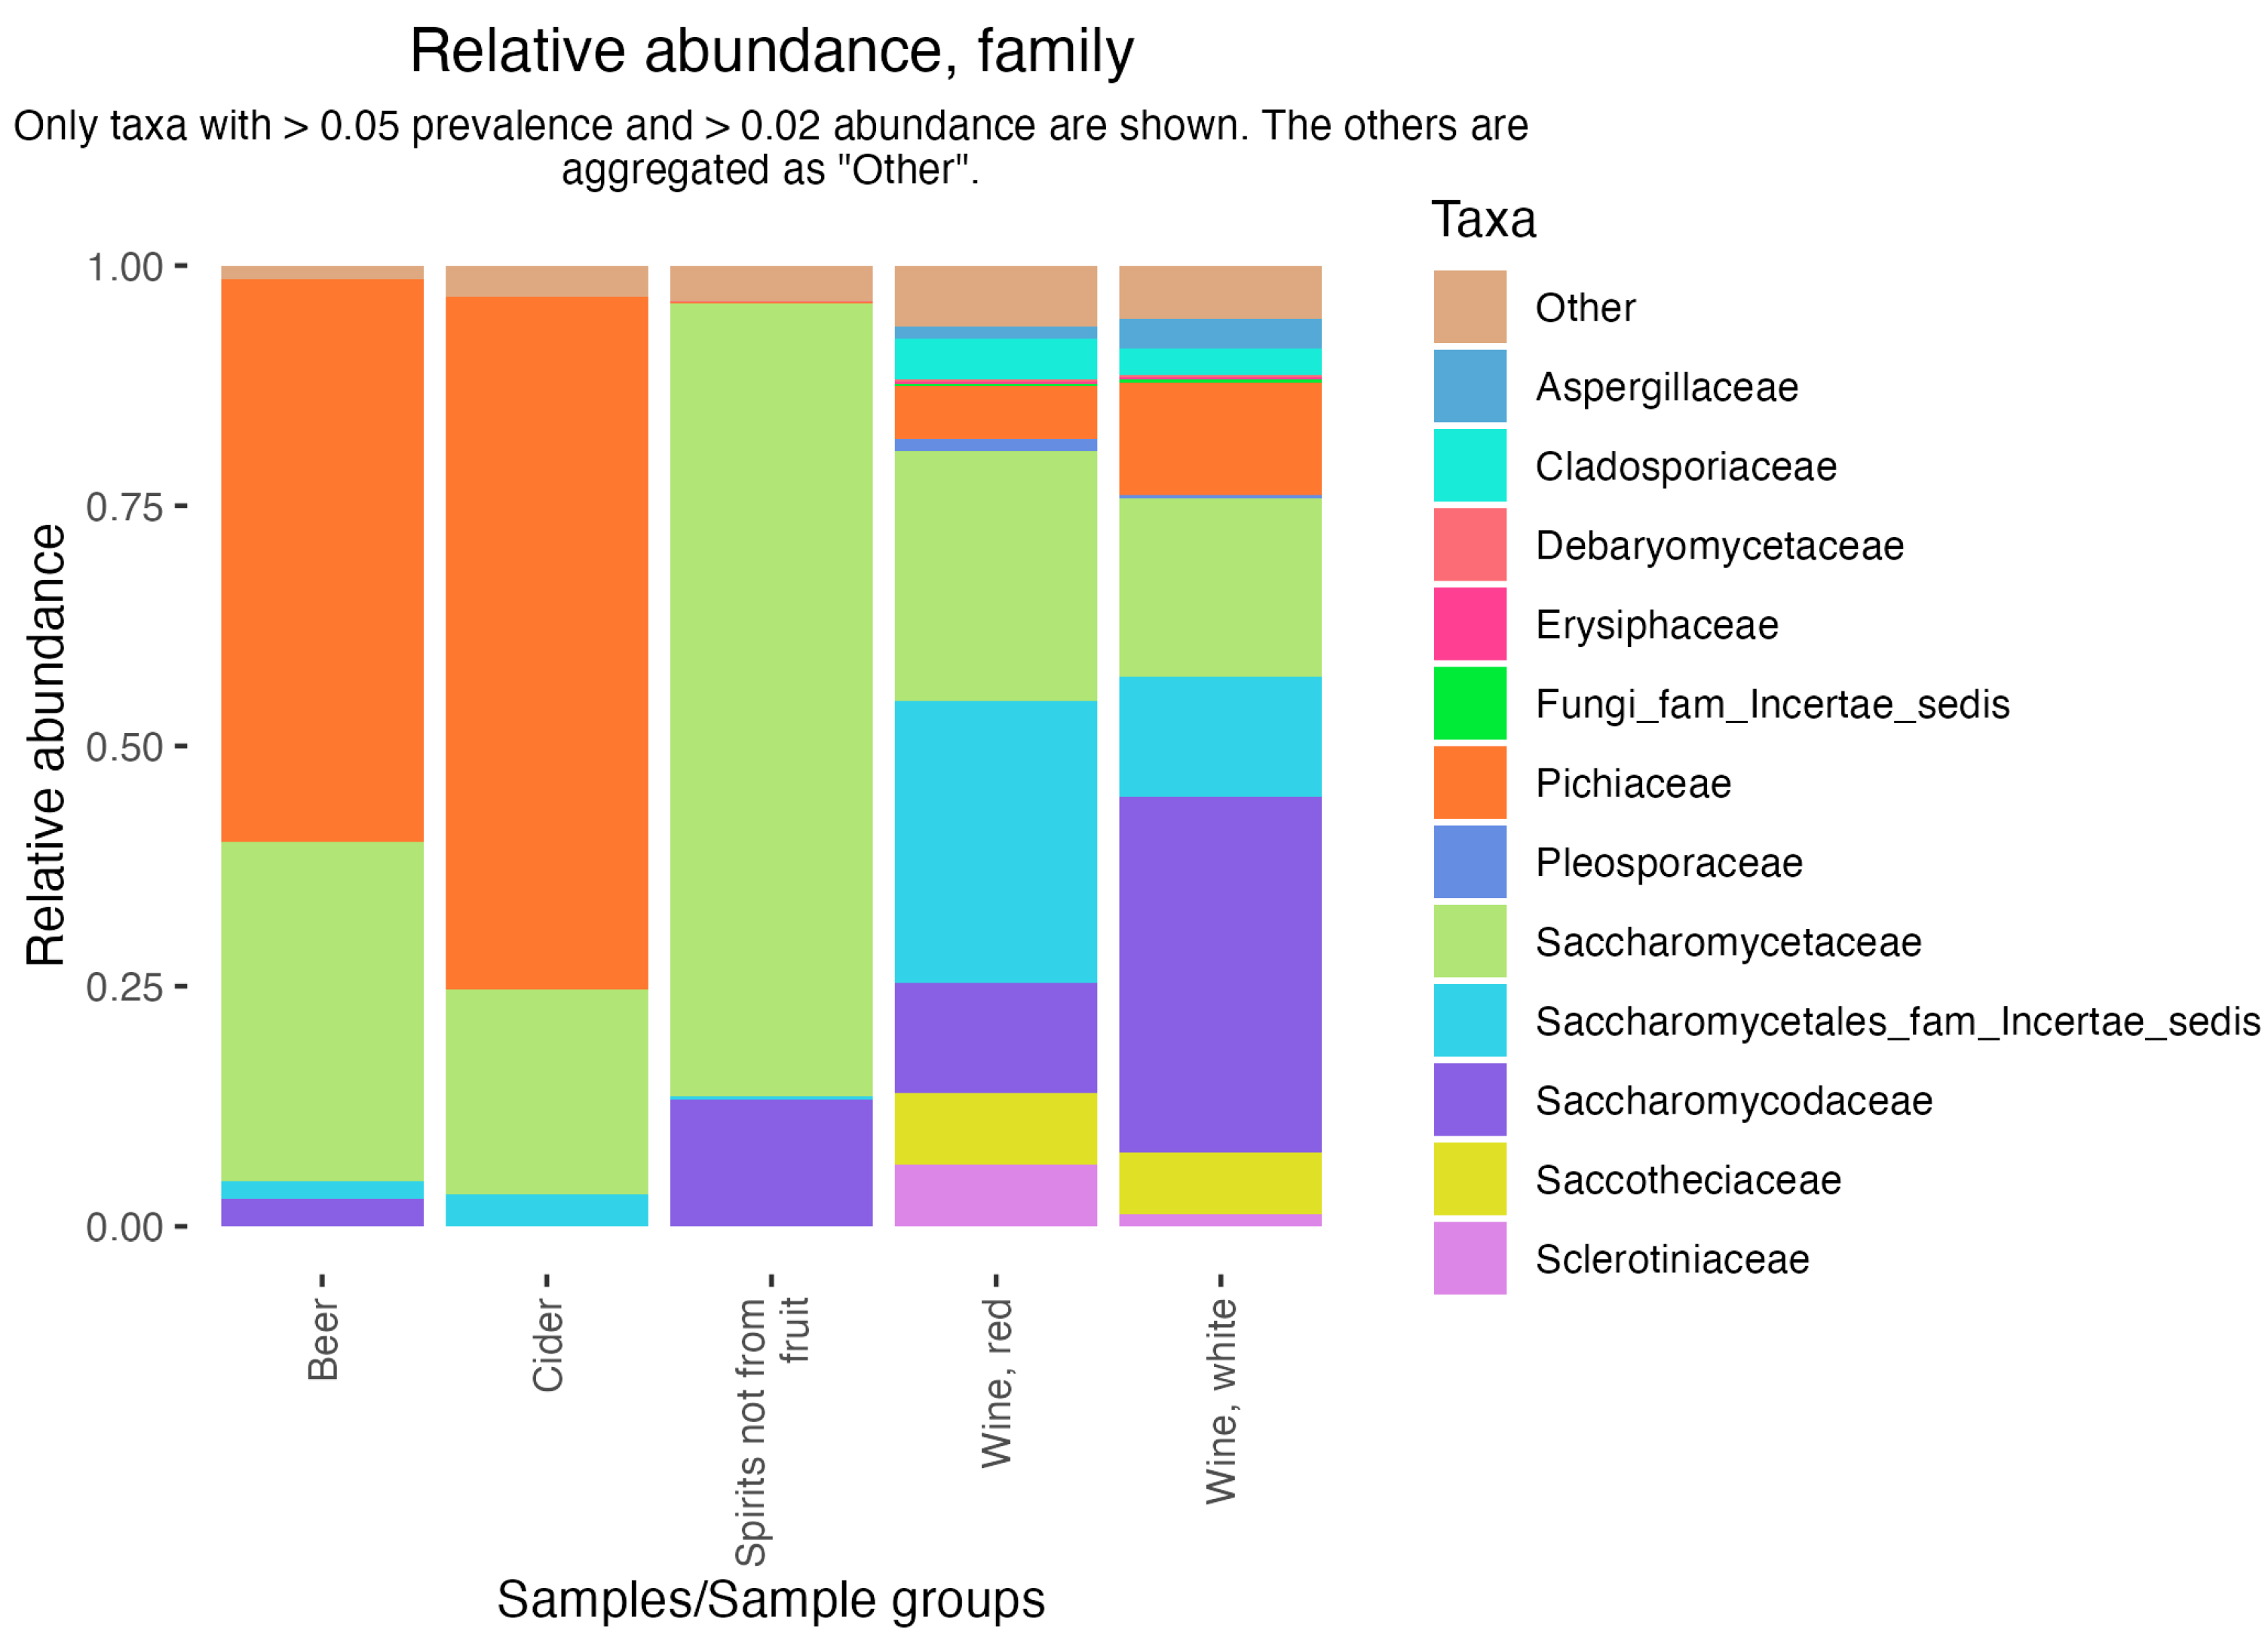
3.2. Diversity of Samples
3.3. Accessibility of FoodMicrobionet Data
3.3.1. FMBN Made Simple: Accessing Data Using the ShinyFMBN App
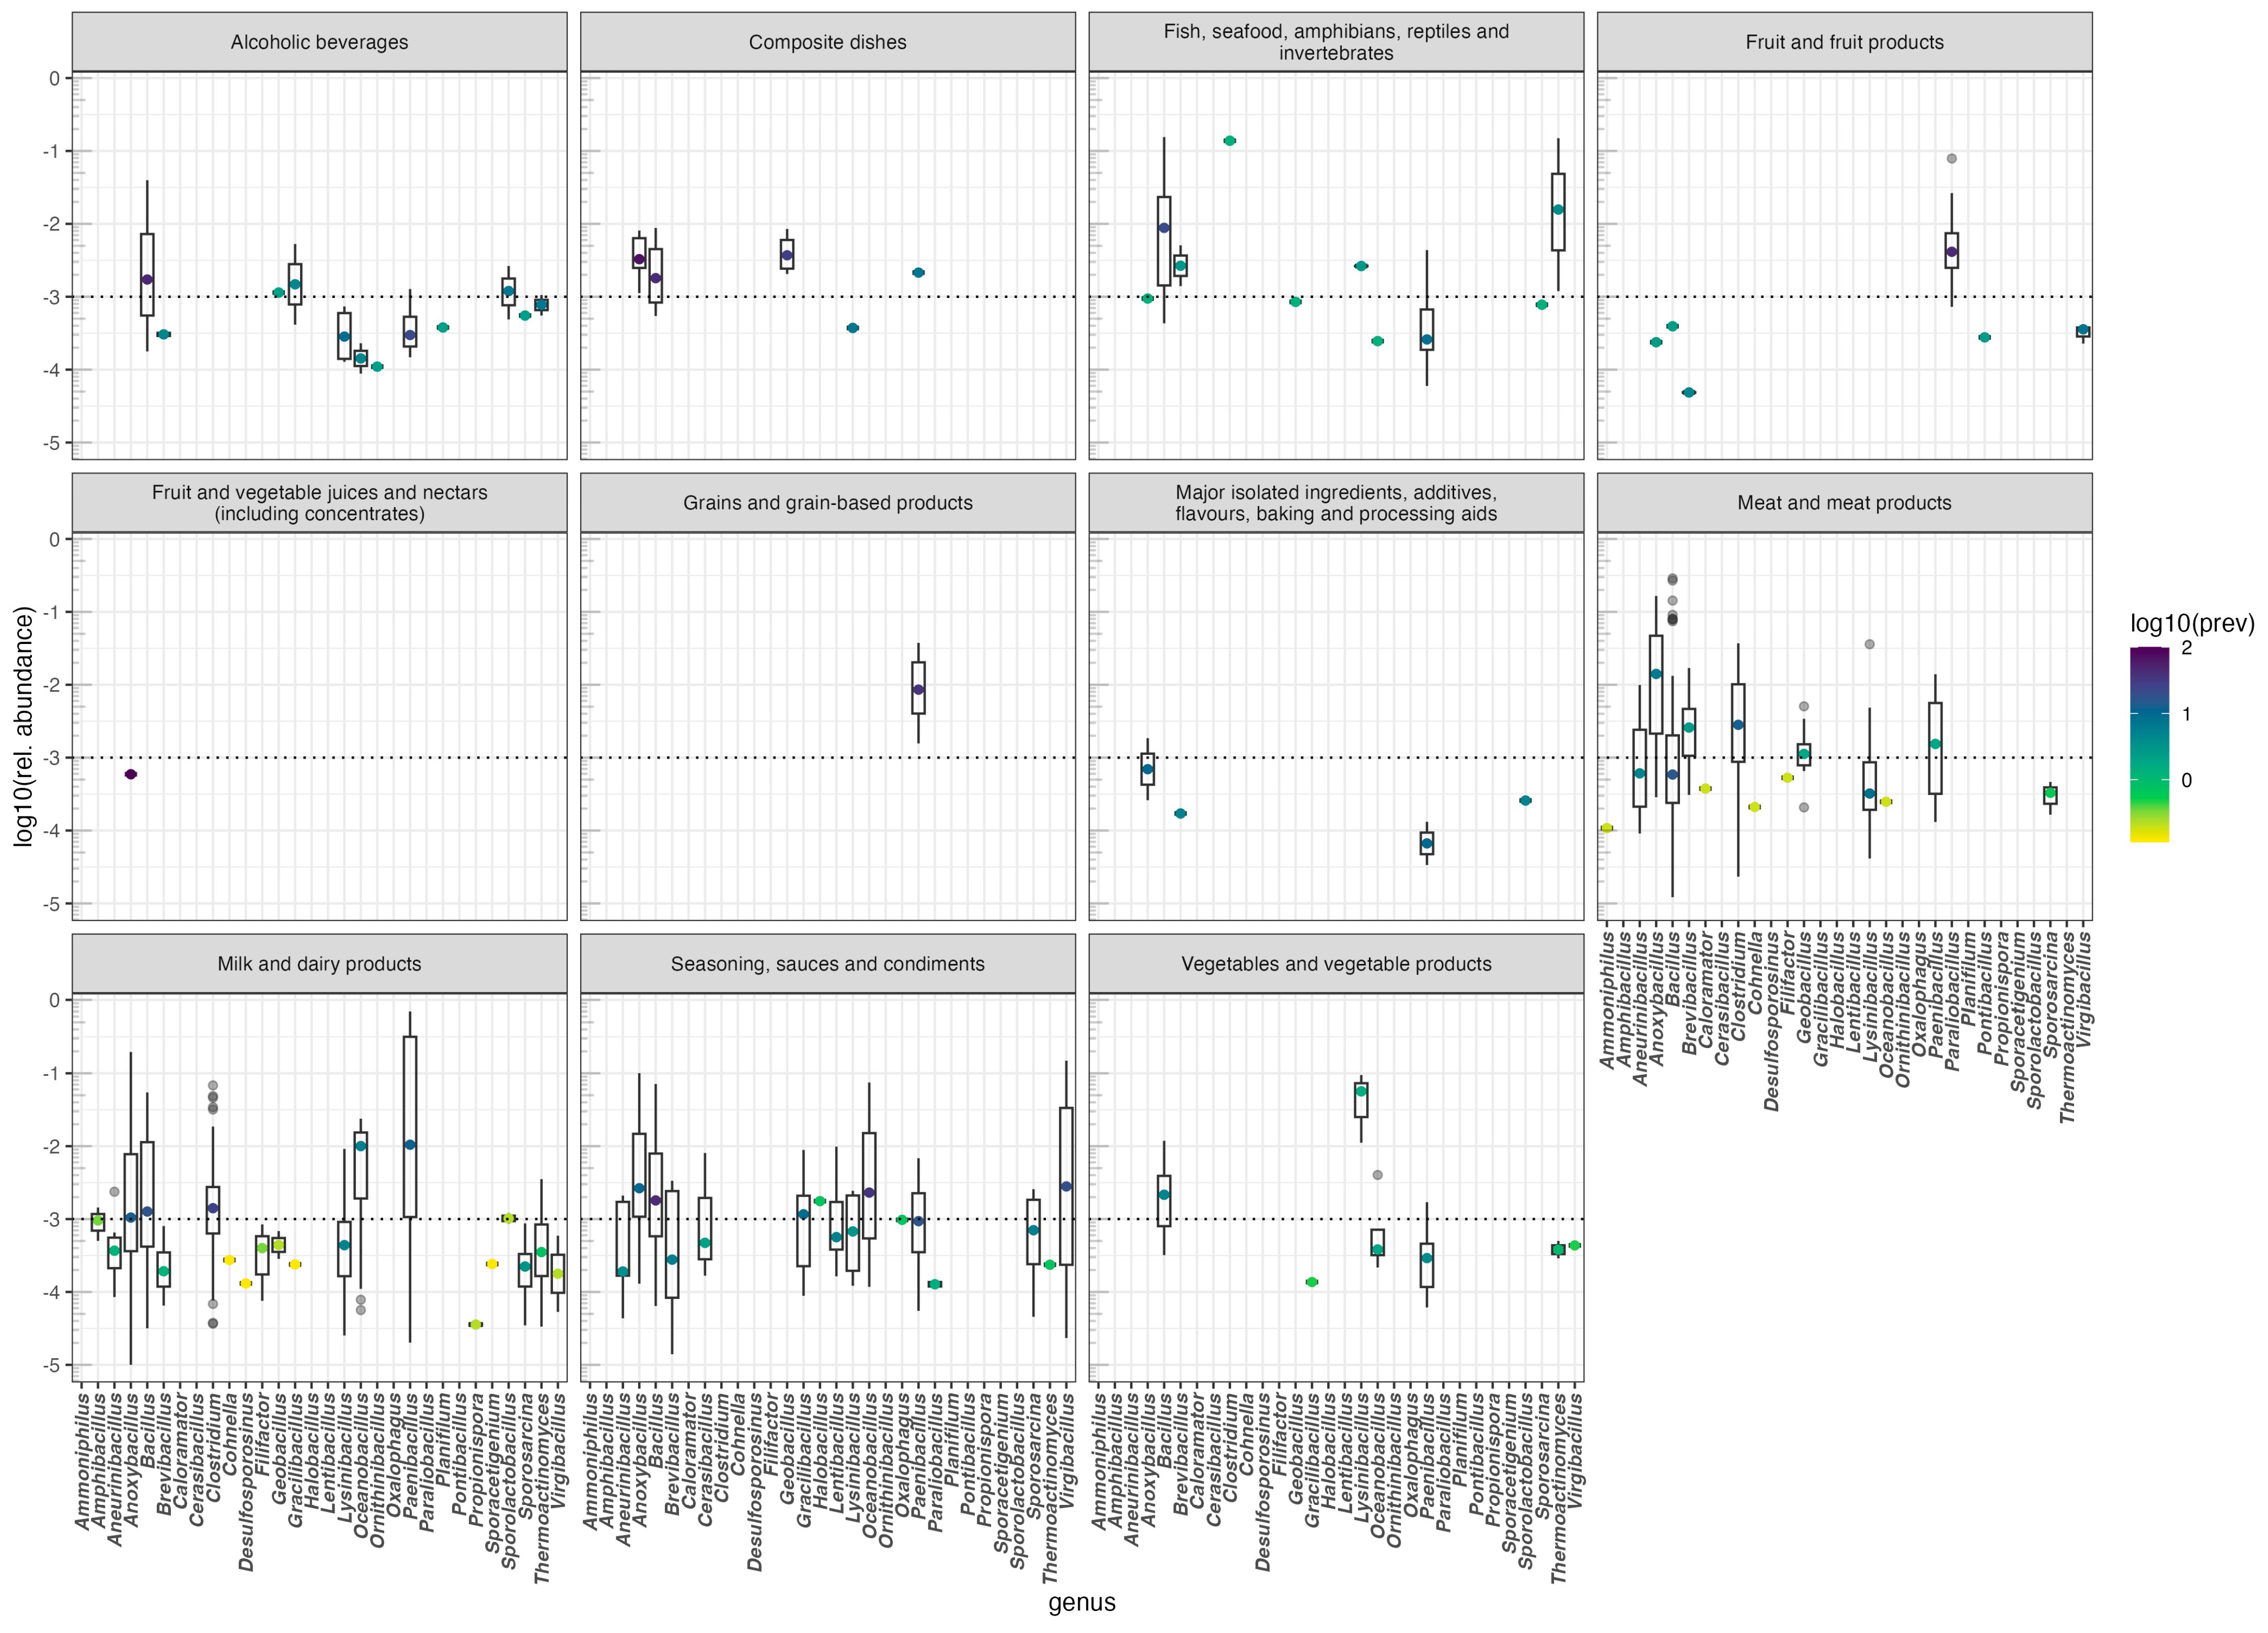
3.3.2. Using FoodMicrobionet to Explore the Distribution of Microbial Groups in Foods: The Case of Endospore-Forming Bacillota
4. Conclusions
Supplementary Materials
Author Contributions
Funding
Data Availability Statement
Conflicts of Interest
References
- Humblot, C.; Guyot, J.P. Pyrosequencing of tagged 16S rRNA gene amplicons for rapid deciphering of the microbiomes of fermented foods such as pearl millet slurries. Appl. Environ. Microbiol. 2009, 75, 4354–4361. [Google Scholar] [CrossRef] [PubMed]
- Pollock, J.; Glendinning, L.; Wisedchanwet, T.; Watson, M. The madness of microbiome: Attempting to find consensus “best practice” for 16S microbiome studies. Appl. Environ. Microbiol. 2018, 84, 3225. [Google Scholar] [CrossRef] [PubMed]
- Vos, M.; Quince, C.; Pijl, A.S.; de Hollander, M.; Kowalchuk, G.A. A comparison of rpoB and 16S rRNA as markers in pyrosequencing studies of bacterial diversity. PLoS ONE 2012, 7, e30600. [Google Scholar] [CrossRef] [PubMed]
- Fouhy, F.; Clooney, A.G.; Stanton, C.; Claesson, M.J.; Cotter, P.D. 16S rRNA gene sequencing of mock microbial populations- impact of DNA extraction method, primer choice and sequencing platform. BMC Microbiol. 2016, 16, 123. [Google Scholar] [CrossRef] [PubMed]
- Yang, R.-H.; Su, J.-H.; Shang, J.-J.; Wu, Y.-Y.; Li, Y.; Bao, D.-P.; Yao, Y.-J. Evaluation of the ribosomal DNA internal transcribed spacer (ITS), specifically ITS1 and ITS2, for the analysis of fungal diversity by deep sequencing. PLoS ONE 2018, 13, e0206428. [Google Scholar] [CrossRef] [PubMed]
- Karkouri, K.E.; Murat, C.; Zampieri, E.; Bonfante, P. Identification of internal transcribed spacer sequence motifs in truffles: A first step toward their DNA bar coding. Appl. Environ. Microbiol. 2007, 73, 5320–5330. [Google Scholar] [CrossRef] [PubMed]
- Bokulich, N.A.; Mills, D.A. Improved selection of internal transcribed spacer-specific primers enables quantitative, ultra-high-throughput profiling of fungal communities. Appl. Environ. Microbiol. 2013, 79, 2519–2526. [Google Scholar] [CrossRef]
- Filippis, F.D.; Parente, E.; Ercolini, D. Metagenomics insights into food fermentations. Microb. Biotechnol. 2017, 10, 91–102. [Google Scholar] [CrossRef] [PubMed]
- Filippis, F.D.; Parente, E.; Ercolini, D. Recent past, present, and future of the food microbiome. Annu. Rev. Food Sci. T 2018, 9, 589–608. [Google Scholar] [CrossRef]
- Ferrocino, I.; Rantsiou, K.; Cocolin, L. Microbiome and -omics application in food industry. Int. J. Food Microbiol. 2022, 377, 109781. [Google Scholar] [CrossRef]
- Yeluri Jonnala, B.R.; McSweeney, P.L.H.; Sheehan, J.J.; Cotter, P.D. Sequencing of the cheese microbiome and its relevance to industry. Front. Microbiol. 2018, 9, 1020. [Google Scholar] [CrossRef] [PubMed]
- Bokulich, N.A.; Ziemski, M.; Robeson, M.S.; Kaehler, B.D. Measuring the microbiome: Best practices for developing and benchmarking microbiomics methods. Comput. Struct. Biotechnol. J. 2020, 18, 4048–4062. [Google Scholar] [CrossRef] [PubMed]
- Hakimzadeh, A.; Asbun, A.A.; Albanese, D.; Bernard, M.; Buchner, D.; Callahan, B.; Caporaso, J.G.; Curd, E.; Djemiel, C.; Durling, M.B.; et al. A pile of pipelines: An overview of the bioinformatics software for metabarcoding data analyses. Mol. Ecol. Resour. 2023; early review. [Google Scholar] [CrossRef]
- Walsh, L.H.; Coakley, M.; Walsh, A.M.; O’Toole, P.W.; Cotter, P.D. Bioinformatic approaches for studying the microbiome of fermented food. Crit. Rev. Microbiol. 2022, 49, 693–725. [Google Scholar] [CrossRef] [PubMed]
- Wen, T.; Niu, G.; Chen, T.; Shen, Q.; Yuan, J.; Liu, Y.-X. The best practice for microbiome analysis using R. Protein Cell 2023, 14, 713–725. [Google Scholar] [CrossRef] [PubMed]
- Tedersoo, L.; Albertsen, M.; Anslan, S.; Callahan, B. Perspectives and benefits of high-throughput long-read sequencing in microbial ecology. Appl. Environ. Microbiol. 2021, 87, e00626-21. [Google Scholar] [CrossRef] [PubMed]
- Matsuo, Y.; Komiya, S.; Yasumizu, Y.; Yasuoka, Y.; Mizushima, K.; Takagi, T.; Kryukov, K.; Fukuda, A.; Morimoto, Y.; Naito, Y.; et al. Full-length 16S rRNA gene amplicon analysis of human gut microbiota using MINIONtm Nanopore sequencing confers species-level resolution. BMC Microbiol. 2021, 21, 35. [Google Scholar] [CrossRef] [PubMed]
- Rubiola, S.; Macori, G.; Civera, T.; Fanning, S.; Mitchell, M.; Chiesa, F. Comparison between full-length 16S rRNA metabarcoding and whole metagenome sequencing suggests the use of either is suitable for large-scale microbiome studies. Foodborne Pathog. Dis. 2022, 19, 495–504. [Google Scholar] [CrossRef] [PubMed]
- Baloğlu, B.; Chen, Z.; Elbrecht, V.; Braukmann, T.; MacDonald, S.; Steinke, D. A Workflow for accurate metabarcoding using Nanopore MinION sequencing. Methods Ecol. Evol. 2021, 12, 794–804. [Google Scholar] [CrossRef]
- Rué, O.; Coton, M.; Dugat-Bony, E.; Howell, K.; Irlinger, F.; Legras, J.-L.; Loux, V.; Michel, E.; Mounier, J.; Neuvéglise, C.; et al. Comparison of metabarcoding taxonomic markers to describe fungal communities in fermented foods. Peer Community J. 2023, 3, e97. [Google Scholar] [CrossRef]
- Callahan, B.J.; Wong, J.; Heiner, C.; Oh, S.; Theriot, C.M.; Gulati, A.S.; McGill, S.K.; Dougherty, M.K. High-Throughput amplicon sequencing of the full-length 16S rRNA gene with single-nucleotide resolution. Nucleic Acids Res. 2019, 47, e103. [Google Scholar] [CrossRef]
- Lobanov, V.; Gobet, A.; Joyce, A. Ecosystem-specific microbiota and microbiome databases in the era of big data. Environ. Microbiome 2022, 17, 37. [Google Scholar] [CrossRef] [PubMed]
- Gonzalez, A.; Navas-Molina, J.A.; Kosciolek, T.; McDonald, D.; Vázquez-Baeza, Y.; Ackermann, G.; DeReus, J.; Janssen, S.; Swafford, A.D.; Orchanian, S.B.; et al. Qiita: Rapid, web-enabled microbiome meta-analysis. Nat. Methods 2018, 15, 796–798. [Google Scholar] [CrossRef] [PubMed]
- Mitchell, A.L.; Almeida, A.; Beracochea, M.; Boland, M.; Burgin, J.; Cochrane, G.; Crusoe, M.R.; Kale, V.; Potter, S.C.; Richardson, L.J.; et al. MGnify: The microbiome analysis resource in 2020. Nucleic Acids Res. 2019, 48, D570–D578. [Google Scholar] [CrossRef] [PubMed]
- Lagkouvardos, I.; Joseph, D.; Kapfhammer, M.; Giritli, S.; Horn, M.; Haller, D.; Clavel, T. IMNGS: A comprehensive open resource of processed 16S rRNA microbial profiles for ecology and diversity studies. Sci. Rep. 2016, 6, 33721. [Google Scholar] [CrossRef] [PubMed]
- Amir, A.; Ozel, E.; Haberman, Y.; Shental, N. Achieving pan-microbiome biological insights via the DbBact knowledge base. Nucleic Acids Res. 2023, 51, 6593–6608. [Google Scholar] [CrossRef] [PubMed]
- Rodrigues, J.F.M.; Schmidt, T.S.B.; Tackmann, J.; Mering, C. von MAPseq: Highly Efficient k-mer search with confidence estimates, for rRNA sequence analysis. Bioinformatics 2017, 33, 3808–3810. [Google Scholar] [CrossRef] [PubMed]
- Yilmaz, P.; Kottmann, R.; Field, D.; Knight, R.; Cole, J.R.; Amaral-Zettler, L.; Gilbert, J.A.; Karsch-Mizrachi, I.; Johnston, A.; Cochrane, G.; et al. Minimum information about a marker gene sequence (MIMARKS) and Minimum Information about Any (x) Sequence (MIxS) specifications. Nat. Biotechnol. 2011, 29, 415–420. [Google Scholar] [CrossRef] [PubMed]
- Dooley, D.M.; Griffiths, E.J.; Gosal, G.S.; Buttigieg, P.L.; Hoehndorf, R.; Lange, M.C.; Schriml, L.M.; Brinkman, F.S.L.; Hsiao, W.W.L. FoodOn: A harmonized food ontology to increase global food traceability, quality control and data integration. NPJ Sci. Food 2018, 2, 23. [Google Scholar] [CrossRef] [PubMed]
- EFSA. The Food Classification and Description System FoodEx 2 (Revision 2); EFSA Supporting Publications: Parma, Italy, 2015; pp. 1–90. [CrossRef]
- Parente, E.; Cocolin, L.; De Filippis, F.; Zotta, T.; Ferrocino, I.; O’Sullivan, O.; Neviani, E.; Angelis, M.D.; Cotter, P.D.; Ercolini, D. FoodMicrobionet: A database for the visualisation and exploration of food bacterial communities based on network analysis. Int. J. Food Microbiol. 2016, 219, 28–37. [Google Scholar] [CrossRef]
- Parente, E.; Zotta, T.; Ricciardi, A. FoodMicrobionet v4: A large, integrated, open and transparent database for food bacterial communities. Int. J. Food Microbiol. 2022, 372, 109696. [Google Scholar] [CrossRef]
- Parente, E.; De Filippis, F.; Ercolini, D.; Ricciardi, A.; Zotta, T. Advancing integration of data on food microbiome studies: Foodmicrobionet 3.1, a major upgrade of the FoodMicrobionet database. Int. J. Food Microbiol. 2019, 305, 108249. [Google Scholar] [CrossRef] [PubMed]
- Parente, E.; Zotta, T.; Giavalisco, M.; Ricciardi, A. Metataxonomic insights in the distribution of Lactobacillaceae in foods and food environments. Int. J. Food Microbiol. 2023, 391, 110124. [Google Scholar] [CrossRef] [PubMed]
- Parente, E.; Zotta, T.; Ricciardi, A. Microbial association networks in cheese: A meta-analysis. bioRxiv 2021. [Google Scholar] [CrossRef]
- Parente, E.; Ricciardi, A.; Zotta, T. The microbiota of dairy milk: A review. Int. Dairy. J. 2020, 107, 104714. [Google Scholar] [CrossRef]
- Zotta, T.; Ricciardi, A.; Condelli, N.; Parente, E. Metataxonomic and metagenomic approaches for the study of undefined strain starters for cheese manufacture. Crit. Rev. Food Sci. 2022, 62, 3898–3912. [Google Scholar] [CrossRef] [PubMed]
- Callahan, B.J.; Sankaran, K.; Fukuyama, J.A.; McMurdie, P.J.; Holmes, S.P. Bioconductor workflow for microbiome data analysis: From raw reads to community analyses. F1000Research 2016, 5, 1492. [Google Scholar] [CrossRef] [PubMed]
- Callahan, B.J.; McMurdie, P.J.; Rosen, M.J.; Han, A.W.; Johnson, A.J.A.; Holmes, S.P. DADA2: High-resolution sample inference from Illumina amplicon data. Nat. Methods 2016, 13, 581–583. [Google Scholar] [CrossRef] [PubMed]
- Martin, M. Cutadapt removes adapter sequences from high-throughput sequencing reads. EMBnet J. 2011, 17, 10–12. [Google Scholar] [CrossRef]
- Glöckner, F.O.; Yilmaz, P.; Quast, C.; Gerken, J.; Beccati, A.; Ciuprina, A.; Bruns, G.; Yarza, P.; Peplies, J.; Westram, R.; et al. 25 Years of serving the community with ribosomal RNA gene reference databases and tools. J. Biotechnol. 2017, 261, 169–176. [Google Scholar] [CrossRef]
- Abarenkov, K.; Nilsson, R.H.; Larsson, K.-H.; Taylor, A.F.S.; May, T.W.; Frøslev, T.G.; Pawlowska, J.; Lindahl, B.; Põldmaa, K.; Truong, C.; et al. The UNITE database for molecular identification and taxonomic communication of Fungi and other Eukaryotes: Sequences, taxa and classifications reconsidered. Nucleic Acids Res. 2023, 52, D791–D797. [Google Scholar] [CrossRef]
- Parente, E.; Zotta, T.; Ricciardi, A. A review of methods for the inference and experimental confirmation of microbial association networks in cheese. Int. J. Food Microbiol. 2022, 368, 109618. [Google Scholar] [CrossRef]
- Kauserud, H. ITS Alchemy: On the use of ITS as a DNA marker in fungal ecology. Fungal Ecol. 2023, 65, 101274. [Google Scholar] [CrossRef]
- Bokulich, N.A.; Thorngate, J.H.; Richardson, P.M.; Mills, D.A. Microbial biogeography of wine grapes is conditioned by cultivar, vintage, and climate. Proc. Natl. Acad. Sci. USA 2014, 111, E139–E148. [Google Scholar] [CrossRef]
- Bokulich, N.A.; Amiranashvili, L.; Amiranashvili, L.; Chitchyan, K.; Chitchyan, K.; Ghazanchyan, N.; Ghazanchyan, N.; Darbinyan, K.; Darbinyan, K.; Gagelidze, N.; et al. Microbial biogeography of the transnational fermented milk Matsoni. Food Microbiol. 2015, 50, 12–19. [Google Scholar] [CrossRef] [PubMed]
- Bokulich, N.A.; Lewis, Z.T.; Boundy-Mills, K.; Mills, D.A. A new perspective on microbial landscapes within food production. Curr. Opin. Biotechnol. 2016, 37, 182–189. [Google Scholar] [CrossRef]
- Filippis, F.D.; Valentino, V.; Alvarez-Ordóñez, A.; Cotter, P.D.; Ercolini, D. Environmental microbiome mapping as a strategy to improve quality and safety in the food industry. Curr. Opin. Food Sci. 2020, 38, 168–176. [Google Scholar] [CrossRef]
- Parente, E.; Zotta, T.; Faust, K.; Filippis, F.D.; Ercolini, D. Structure of association networks in food bacterial communities. Food Microbiol. 2018, 73, 49–60. [Google Scholar] [CrossRef] [PubMed]
- McMurdie, P.J.; Holmes, S. Phyloseq: An R package for reproducible interactive analysis and graphics of microbiome census data. PLoS ONE 2013, 8, e61217. [Google Scholar] [CrossRef] [PubMed]
- McMurdie, P.J.; Holmes, S. Shiny-Phyloseq: Web application for interactive microbiome analysis with provenance tracking. Bioinformatics 2015, 31, 282–283. [Google Scholar] [CrossRef]
- Tyakht, A.; Kopeliovich, A.; Klimenko, N.; Efimova, D.; Dovidchenko, N.; Odintsova, V.; Kleimenov, M.; Toshchakov, S.; Popova, A.; Khomyakova, M.; et al. Characteristics of bacterial and yeast microbiomes in spontaneous and mixed-fermentation beer and cider. Food Microbiol. 2021, 94, 103658. [Google Scholar] [CrossRef]
- Rocha-Arriaga, C.; Espinal-Centeno, A.; Martinez-Sánchez, S.; Caballero-Pérez, J.; Alcaraz, L.D.; Cruz-Ramírez, A. Deep Microbial community profiling along the fermentation process of Pulque, a biocultural resource of Mexico. Microbiol. Res. 2020, 241, 126593. [Google Scholar] [CrossRef]
- Kamilari, E.; Mina, M.; Karallis, C.; Tsaltas, D. Metataxonomic analysis of grape microbiota during wine fermentation reveals the distinction of Cyprus regional terroirs. Front. Microbiol. 2021, 12, 726483. [Google Scholar] [CrossRef] [PubMed]
- Kordowska-Wiater, M.; Pytka, M.; Stój, A.; Kubik-Komar, A.; Wyrostek, J.; Waśko, A. A Metagenetic insight into microbial diversity of spontaneously fermented Polish red wines and an analysis of selected physicochemical properties. Appl. Sci. 2022, 12, 4373. [Google Scholar] [CrossRef]
- Djeni, T.N.; Keisam, S.; Kouame, K.H.; Assohoun-Djeni, C.N.; Ake, F.D.M.; Amoikon, L.S.T.; Tuikhar, N.; Labala, R.K.; Dje, M.K.; Jeyaram, K. Dynamics of microbial populations and metabolites of fermenting saps throughout tapping process of ron and oil palm trees in Côte d’Ivoire. Front. Microbiol. 2022, 13, 954917. [Google Scholar] [CrossRef] [PubMed]
- Martiniuk, J.T.; Hamilton, J.; Dodsworth, T.; Measday, V. Grape-associated fungal community patterns persist from berry to wine on a fine geographical scale. FEMS Yeast Res. 2023, 23, foac067. [Google Scholar] [CrossRef] [PubMed]
- Li, Z.; Zheng, M.; Zheng, J.; Gänzle, M.G. Bacillus species in food fermentations: An underappreciated group of organisms for safe use in food fermentations. Curr. Opin. Food Sci. 2023, 50, 101007. [Google Scholar] [CrossRef]
- Kakagianni, M.; Koutsoumanis, K.P. Mapping the risk of evaporated milk spoilage in the Mediterranean region based on the effect of temperature conditions on Geobacillus stearothermophilus growth. Food Res. Int. 2018, 111, 104–110. [Google Scholar] [CrossRef] [PubMed]
- Burgess, S.A.; Lindsay, D.; Flint, S.H. Thermophilic bacilli and their importance in dairy processing. Int. J. Food Microbiol. 2010, 144, 215–225. [Google Scholar] [CrossRef]
- Postollec, F.; Mathot, A.-G.; Bernard, M.; Divanac’h, M.-L.; Pavan, S.; Sohier, D. Tracking spore-forming bacteria in food: From natural biodiversity to selection by processes. Int. J. Food Microbiol. 2012, 158, 1–8. [Google Scholar] [CrossRef]
- Chang, S.-S.; Kang, D.-H. Alicyclobacillus spp. in the fruit juice industry: History, characteristics, and current isolation/detection procedures. Crit. Rev. Microbiol. 2008, 30, 55–74. [Google Scholar] [CrossRef]
- Olajide, A.M.; LaPointe, G. Detection of spore forming Paenibacillus macerans in raw milk. J. Microbiol. Methods 2020, 177, 106048. [Google Scholar] [CrossRef] [PubMed]
- Langendries, S.; Goormachtig, S. Paenibacillus polymyxa, a jack of all trades. Environ. Microbiol. 2021, 23, 5659–5669. [Google Scholar] [CrossRef] [PubMed]
- Markland, S.M.; Farkas, D.F.; Kniel, K.E.; Hoover, D.G. Pathogenic psychrotolerant sporeformers: An emerging challenge for low-temperature storage of minimally processed foods. Foodborne Pathog. Dis. 2013, 10, 413–419. [Google Scholar] [CrossRef]
- Peck, M.W.; Stringer, S.C.; Carter, A.T. Clostridium botulinum in the post-genomic era. Food Microbiol. 2011, 28, 183–191. [Google Scholar] [CrossRef] [PubMed]

| L1 | n | Prop | Cum.Prop. |
|---|---|---|---|
| Milk and dairy products | 5807 | 0.3931 | 0.3931 |
| Meat and meat products | 3605 | 0.2440 | 0.6371 |
| Vegetables and vegetable products | 1508 | 0.1021 | 0.7391 |
| Fruit and fruit products | 1178 | 0.0797 | 0.8189 |
| Fish, seafood, amphibians, reptiles and invertebrates | 814 | 0.0551 | 0.8740 |
| Alcoholic beverages | 513 | 0.0347 | 0.9087 |
| Major isolated ingredients, additives, flavours, baking and processing aids | 339 | 0.0229 | 0.9316 |
| Seasoning, sauces and condiments | 202 | 0.0137 | 0.9453 |
| Grains and grain-based products | 155 | 0.0105 | 0.9558 |
| Composite dishes | 147 | 0.0099 | 0.9658 |
| Fruit and vegetable juices and nectars (including concentrates) | 82 | 0.0056 | 0.9713 |
| Legumes, nuts, oilseeds and spices | 81 | 0.0055 | 0.9768 |
| Generic food environments | 64 | 0.0043 | 0.9811 |
| Food products for young population | 61 | 0.0041 | 0.9852 |
| Eggs and egg products | 56 | 0.0038 | 0.9890 |
| Animal and vegetable fats and oils and primary derivatives thereof | 53 | 0.0036 | 0.9926 |
| Sugar and similar, confectionery and water-based sweet desserts | 42 | 0.0028 | 0.9955 |
| Starchy roots or tubers and products thereof, sugar plants | 17 | 0.0012 | 0.9983 |
| Coffee, cocoa, tea and infusions | 15 | 0.0010 | 0.9993 |
Disclaimer/Publisher’s Note: The statements, opinions and data contained in all publications are solely those of the individual author(s) and contributor(s) and not of MDPI and/or the editor(s). MDPI and/or the editor(s) disclaim responsibility for any injury to people or property resulting from any ideas, methods, instructions or products referred to in the content. |
© 2024 by the authors. Licensee MDPI, Basel, Switzerland. This article is an open access article distributed under the terms and conditions of the Creative Commons Attribution (CC BY) license (https://creativecommons.org/licenses/by/4.0/).
Share and Cite
Parente, E.; Ricciardi, A. A Comprehensive View of Food Microbiota: Introducing FoodMicrobionet v5. Foods 2024, 13, 1689. https://doi.org/10.3390/foods13111689
Parente E, Ricciardi A. A Comprehensive View of Food Microbiota: Introducing FoodMicrobionet v5. Foods. 2024; 13(11):1689. https://doi.org/10.3390/foods13111689
Chicago/Turabian StyleParente, Eugenio, and Annamaria Ricciardi. 2024. "A Comprehensive View of Food Microbiota: Introducing FoodMicrobionet v5" Foods 13, no. 11: 1689. https://doi.org/10.3390/foods13111689