
Glycogen Quantification and Gender Identification in Di-, Tri-, and Tetraploid Crassostrea gigas Using Portable Near-Infrared Spectroscopy
 and
and
Abstract
:1. Introduction
2. Materials and Methods
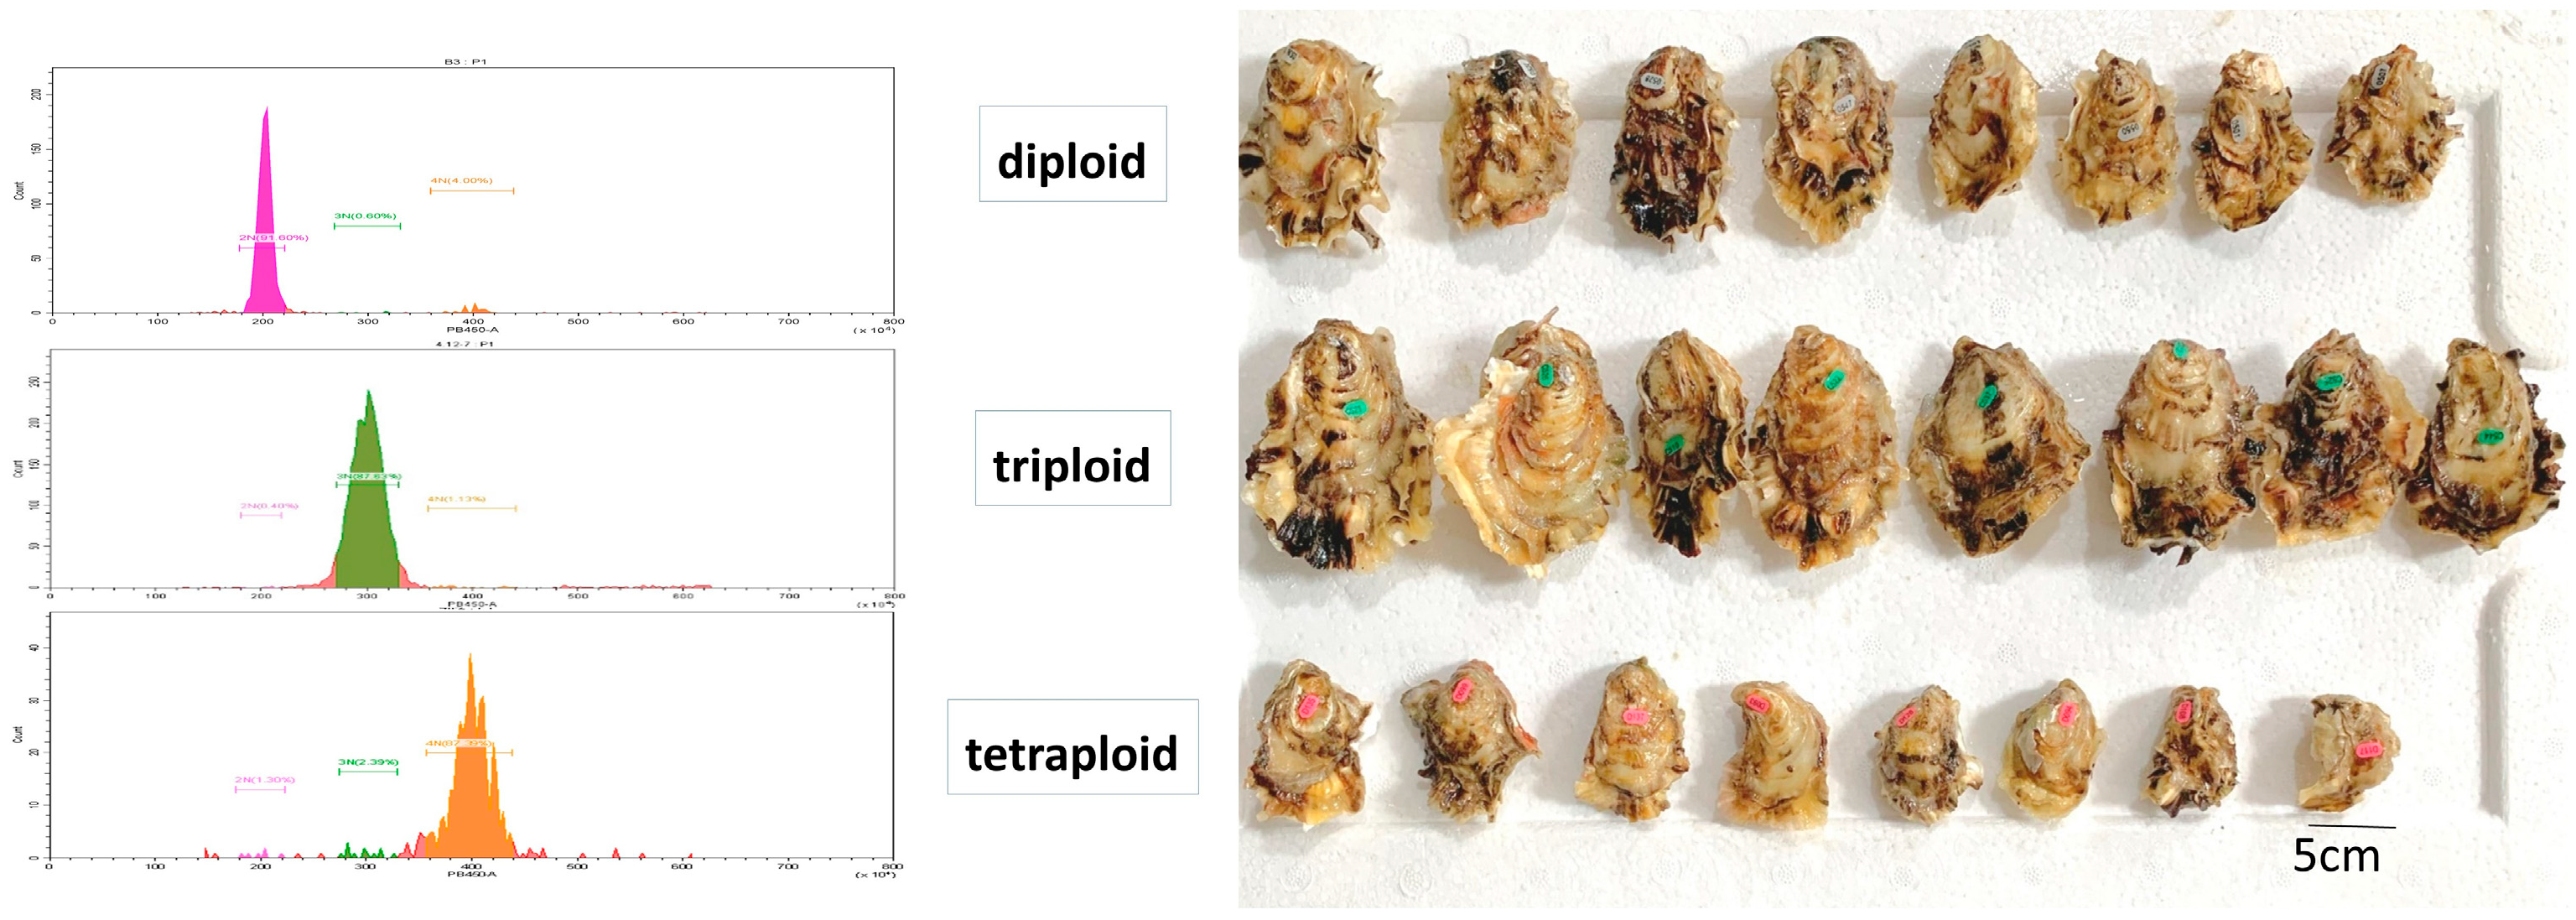
2.1. Sample Collection and Preparation
2.2. Determination of Glycogen Content
2.3. Portable NIR Spectroscopy System and Spectrum Collection
2.4. Spectral Data Preprocessing
2.5. Model Construction: Calibration and Validation
2.5.1. Qualitative Modeling
2.5.2. Quantitative Modeling
3. Results and Discussion
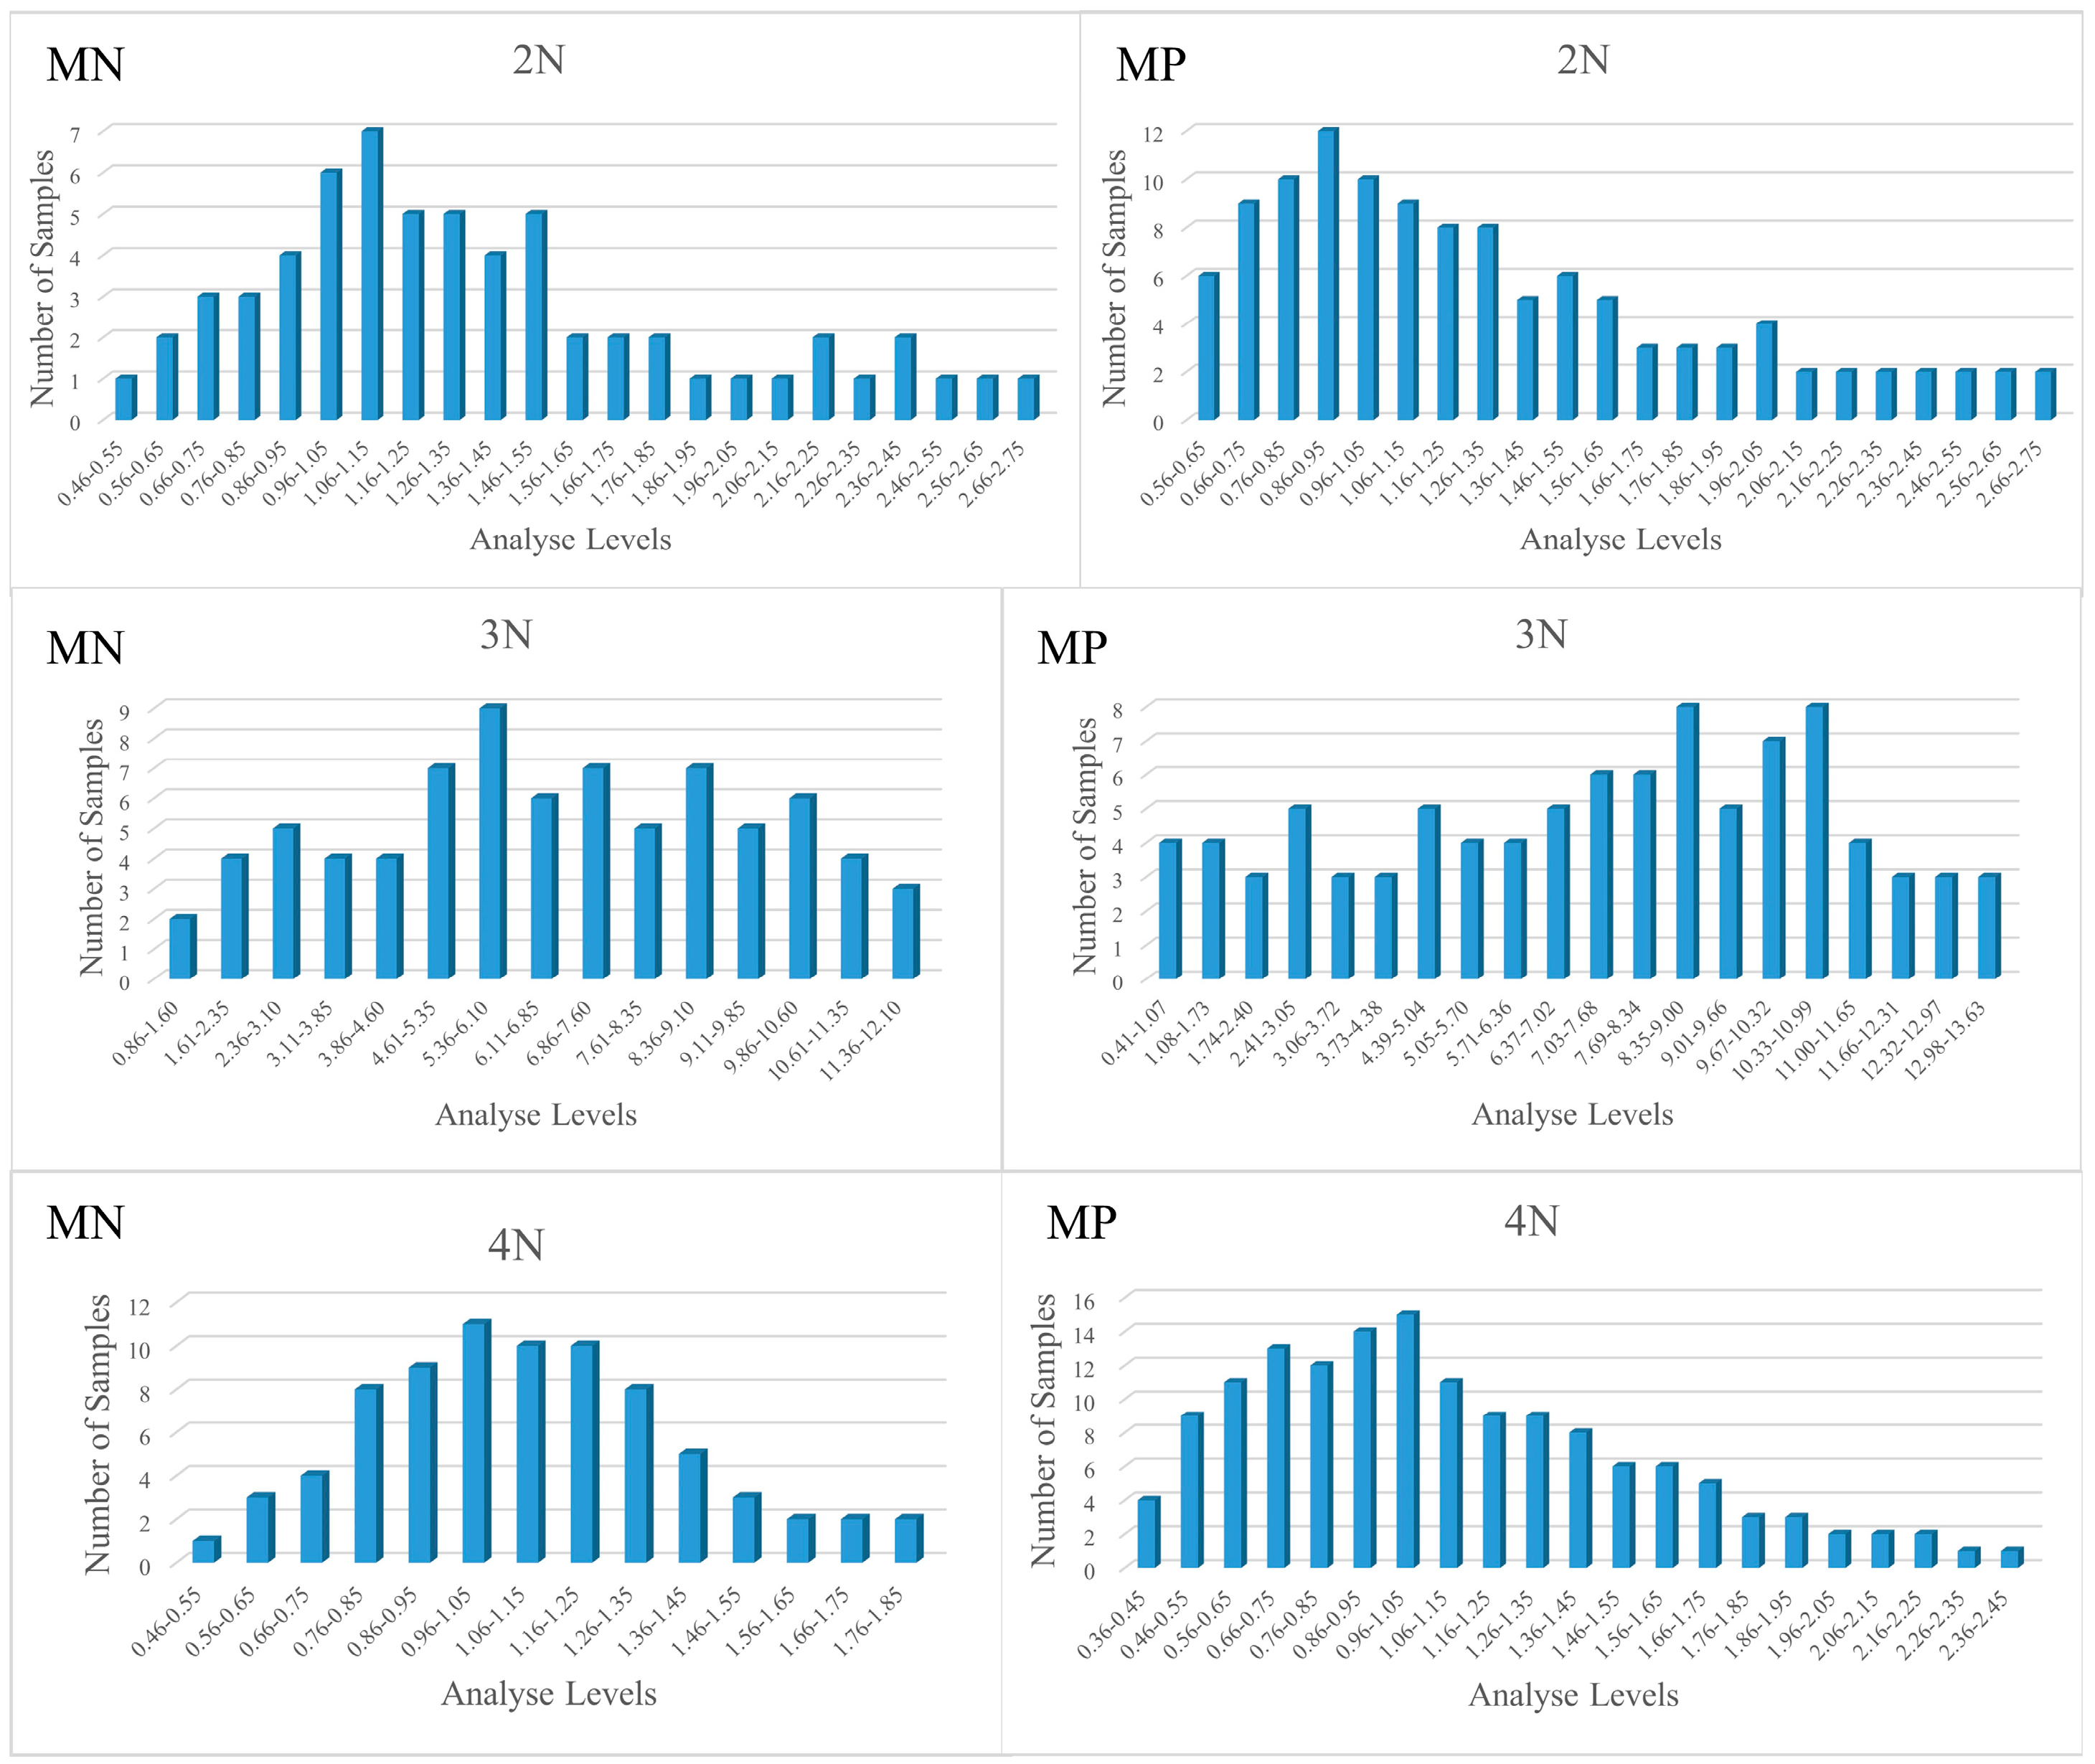
3.1. Descriptive Statistics of Glycogen Content Indicators
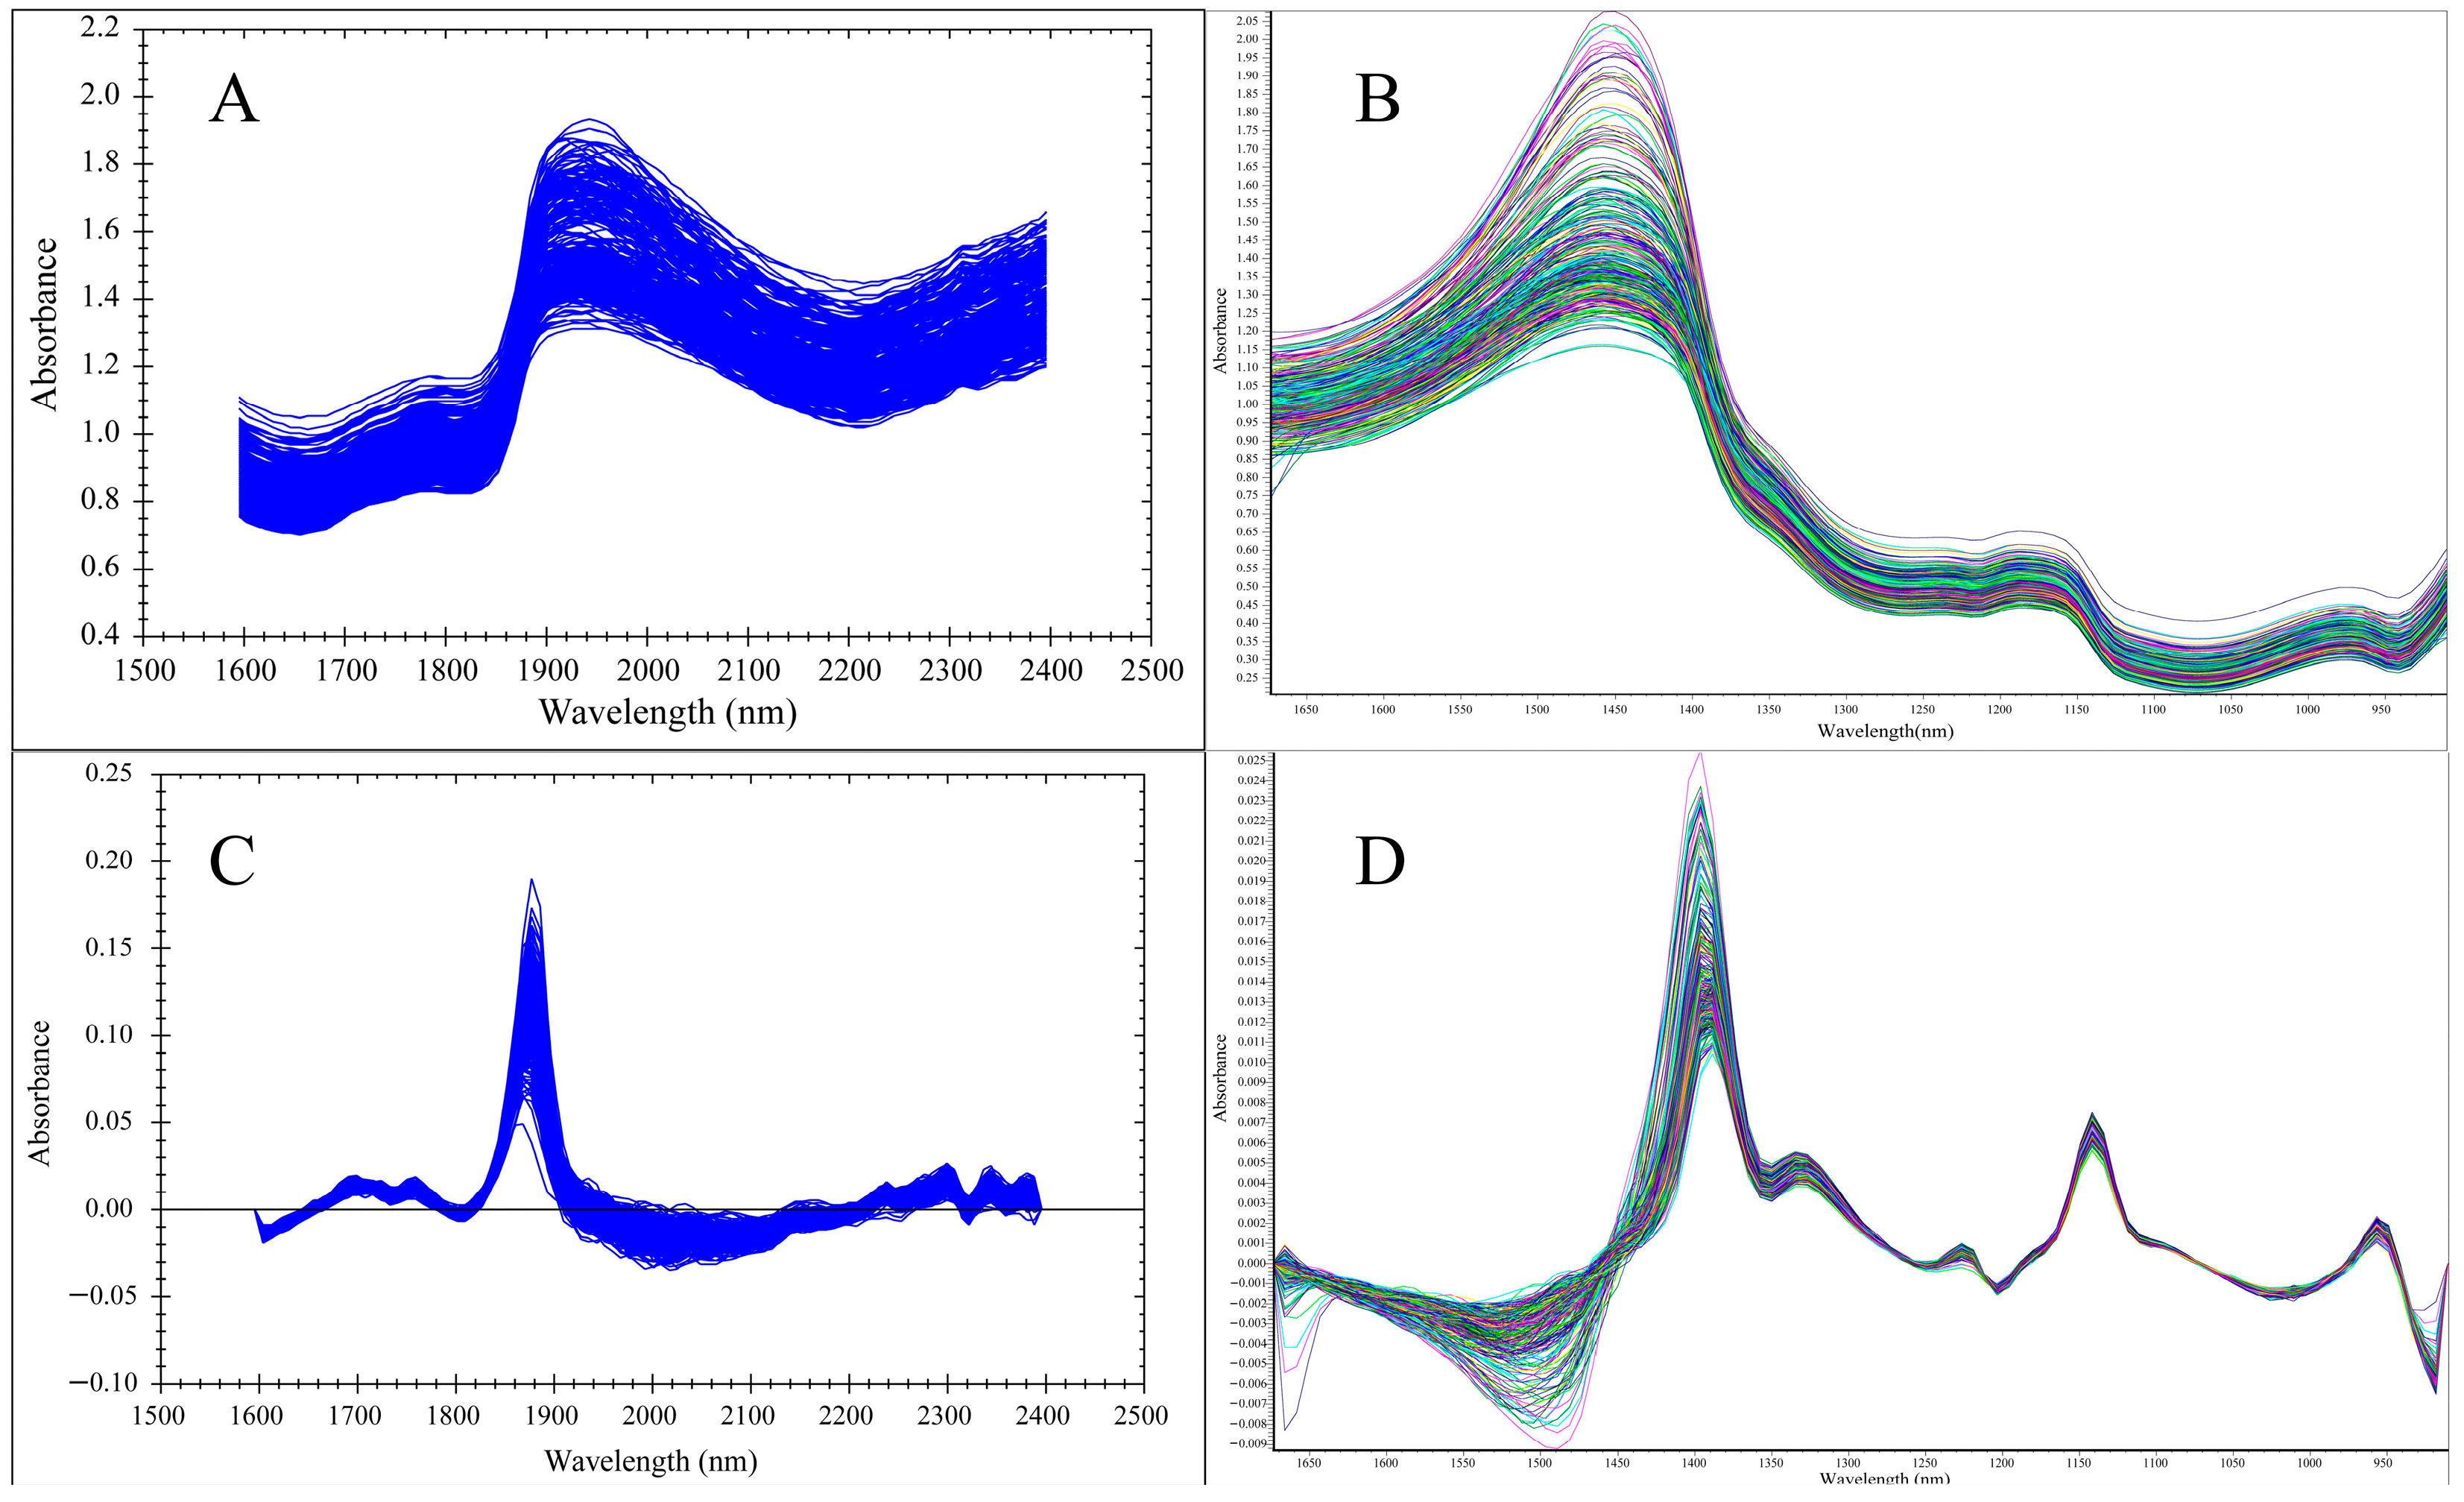
3.2. Spectral Analysis
3.3. Spectral Data Preprocessing
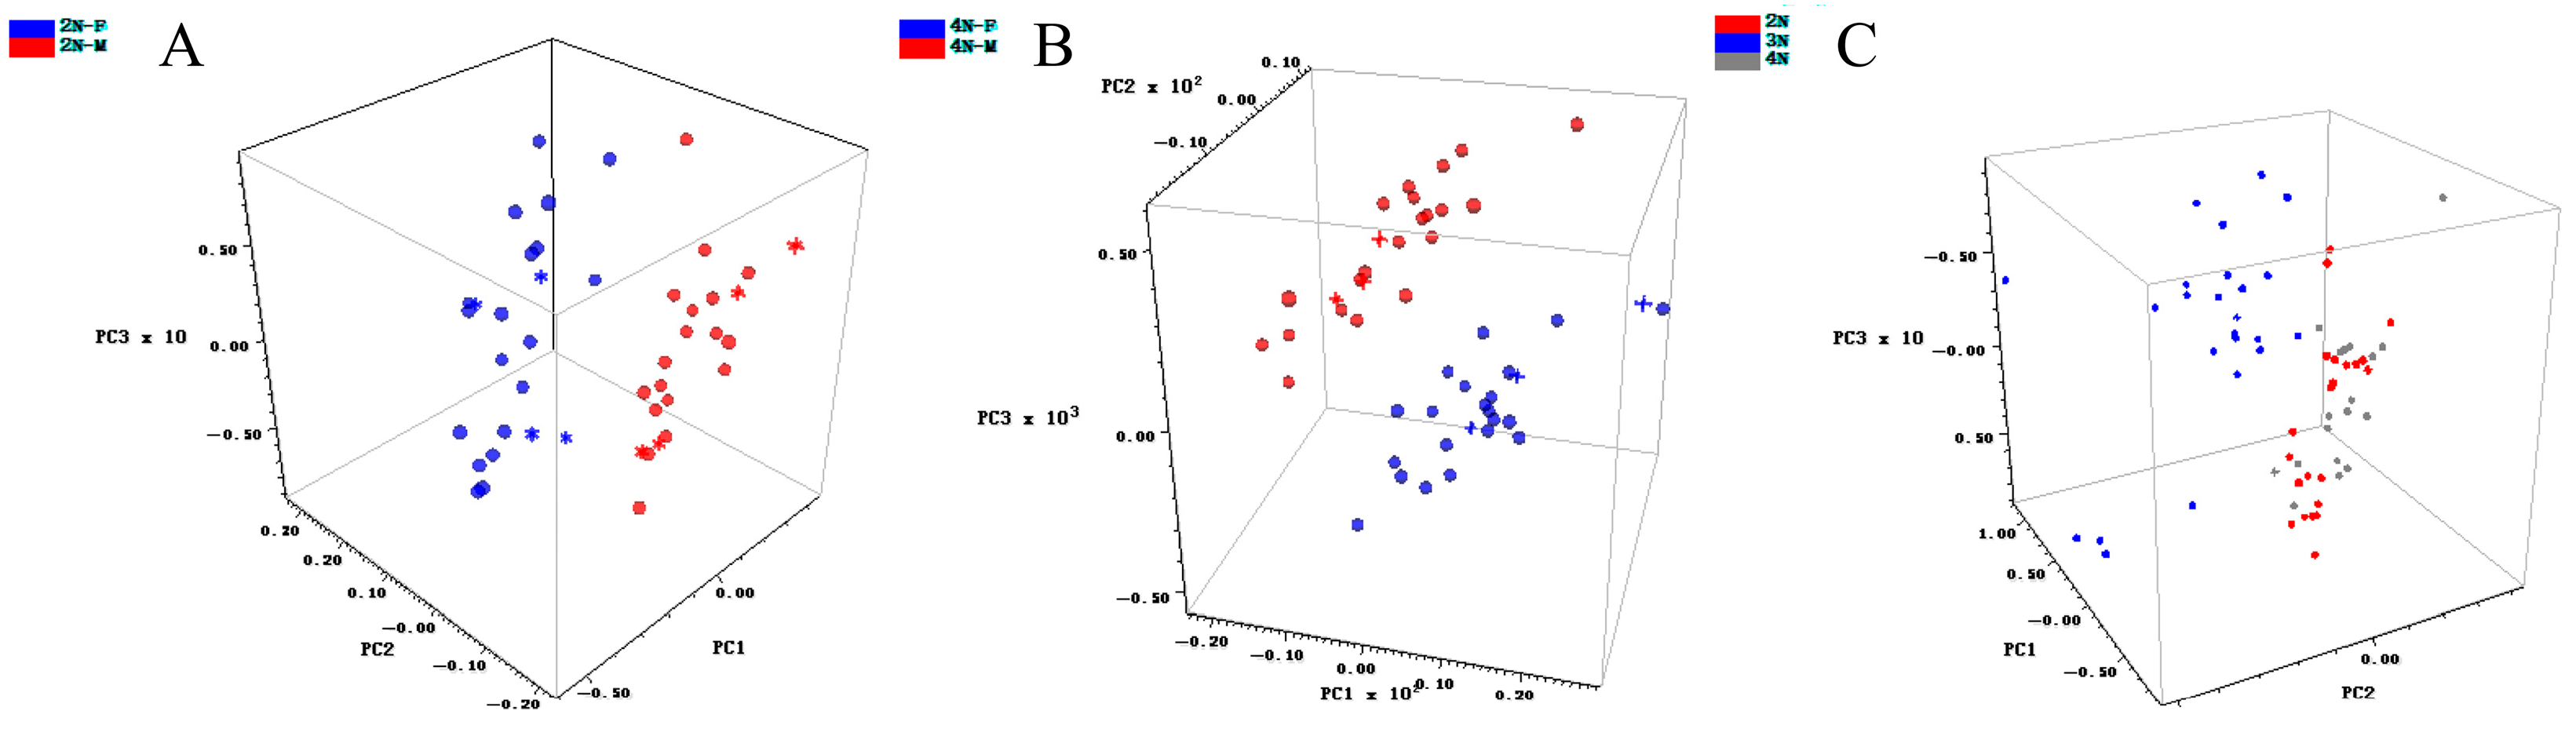
3.4. Qualitative Model Construction
3.5. Quantitative Model Construction and Optimization
3.5.1. Instrument Performance and Model Comparison
3.5.2. Spectral Characteristics and Instrument Differences
3.5.3. Biological Factors and Model Performance

| Instruments | Ploidies | Calibration Sets | Validation Sets | ||||||
|---|---|---|---|---|---|---|---|---|---|
| Internal Cross-Validation | External Validation | ||||||||
| RMSEC | RC | RMSECV | RCV | RPDCV | RMSEP | RP | RPDEV | ||
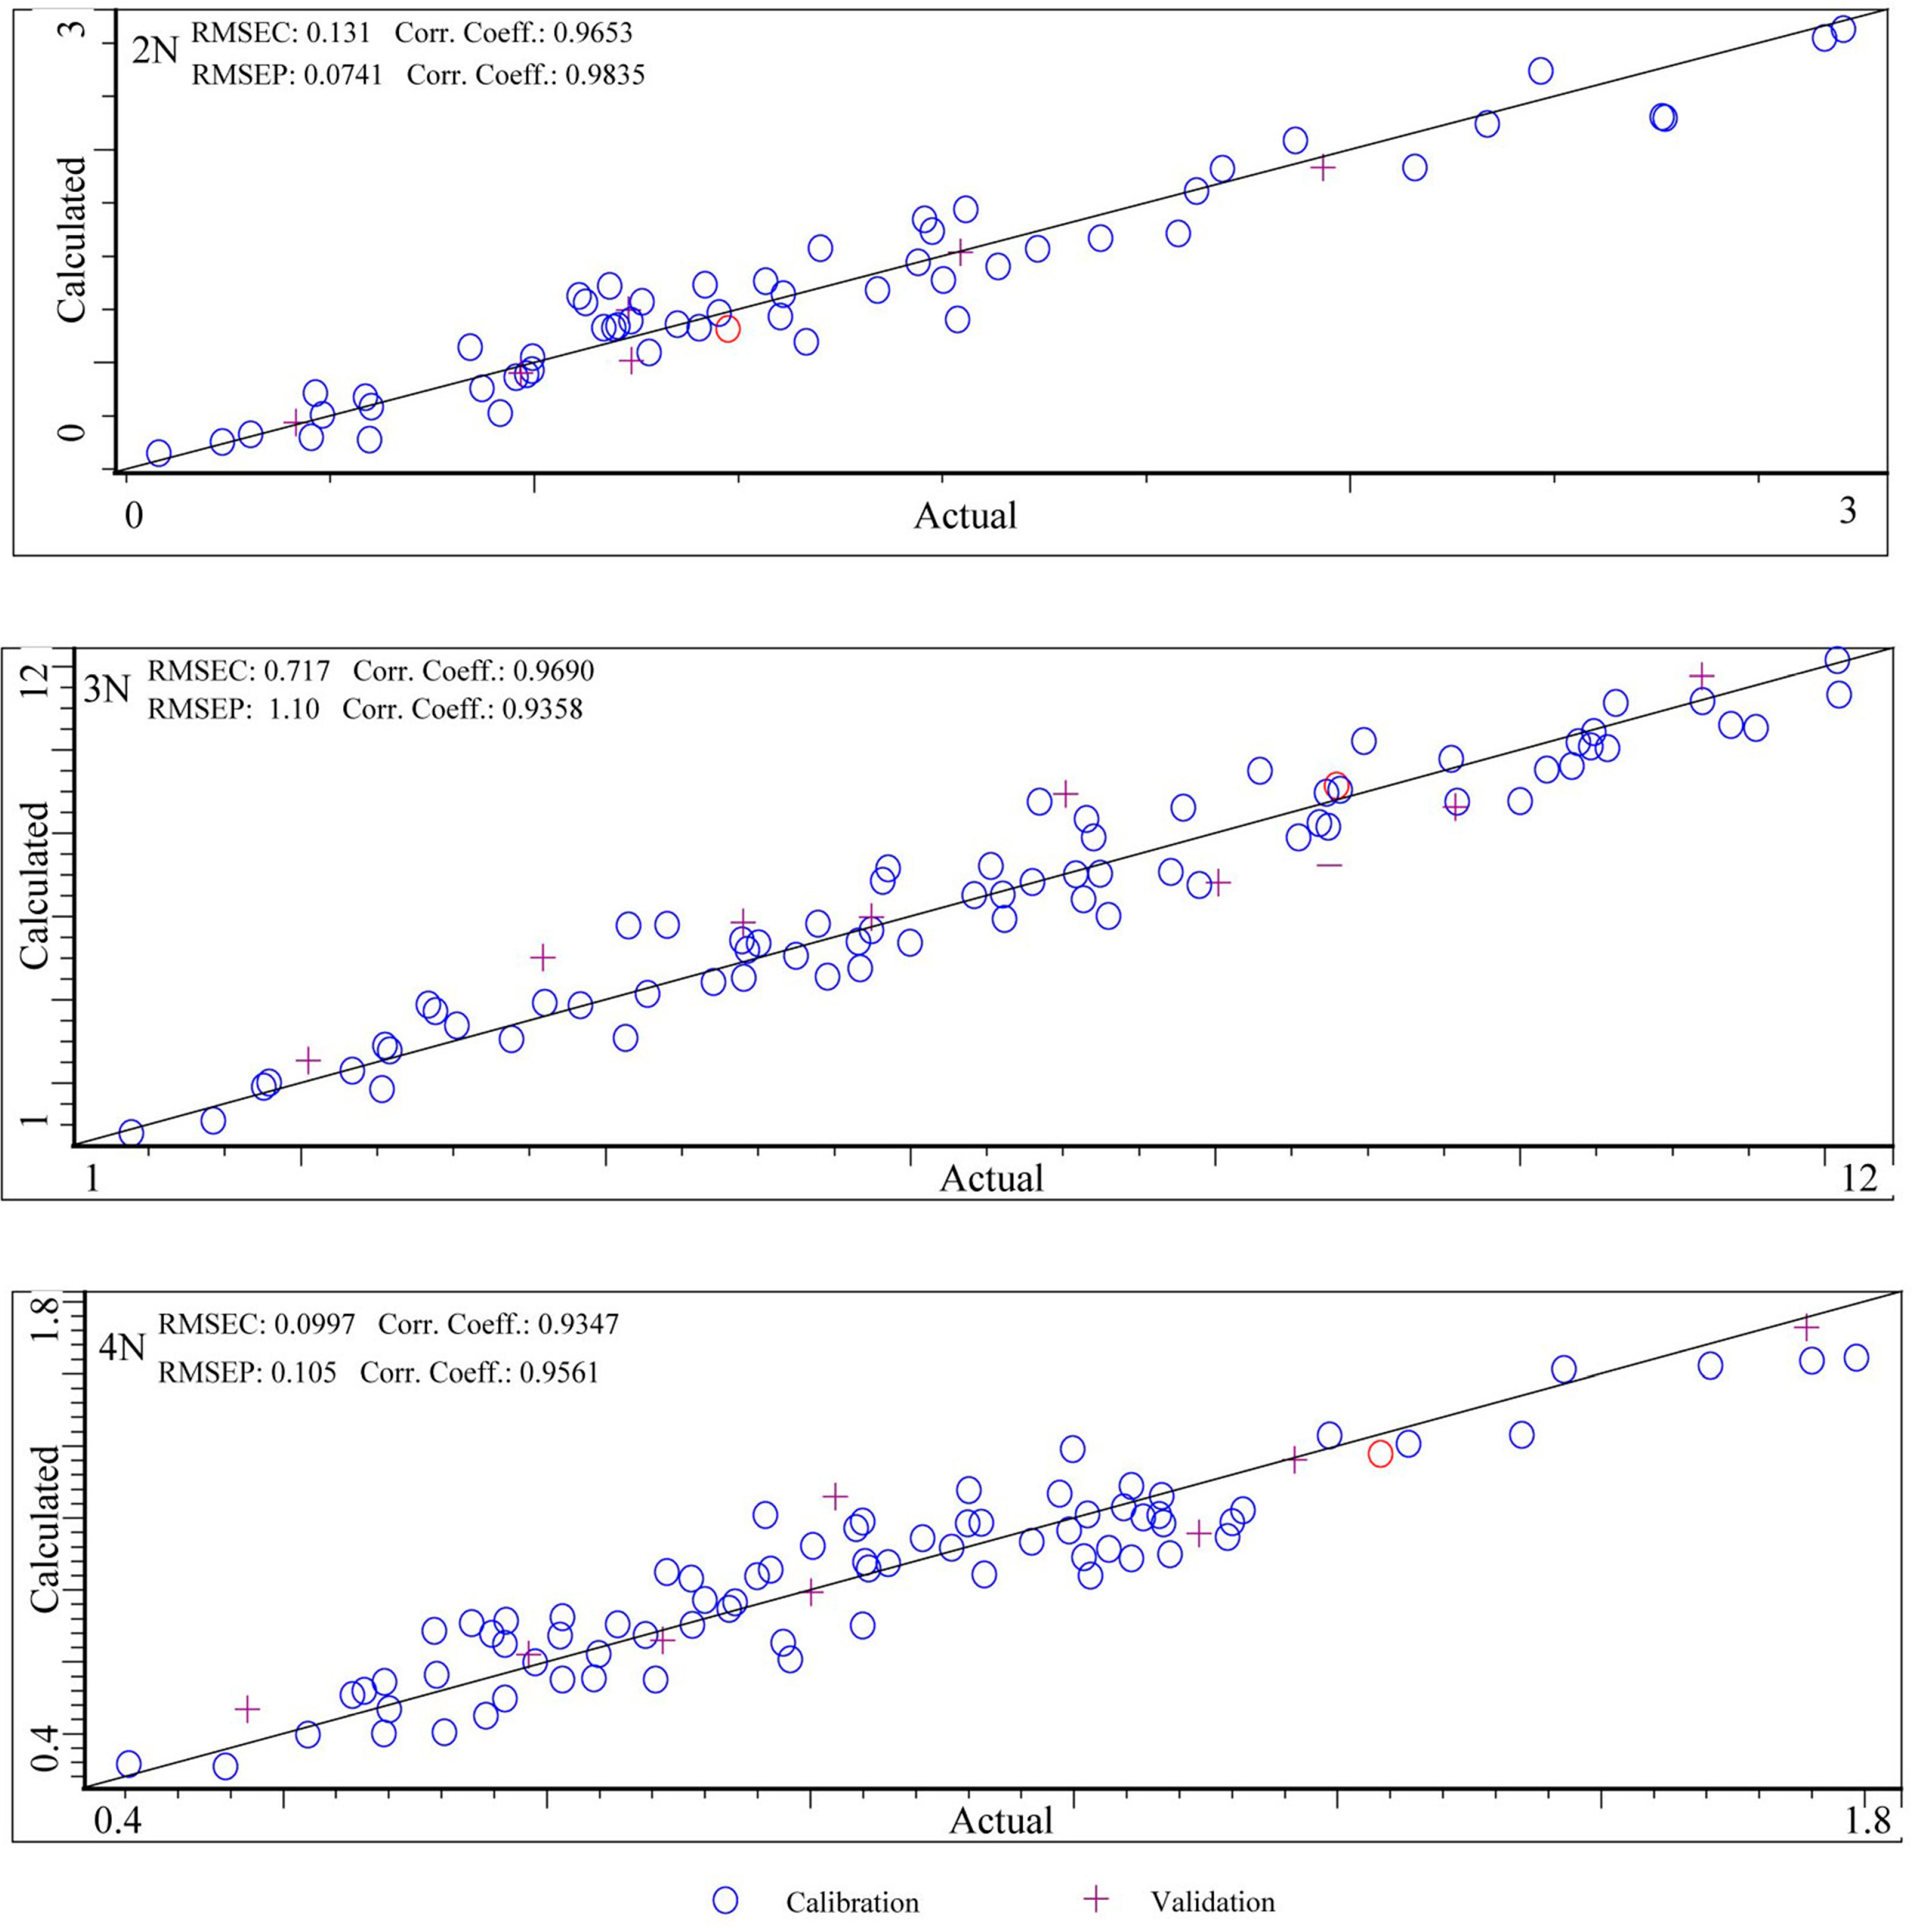
| MicroNIR 1700 | 2N | 0.131 | 0.965 | 0.158 | 0.949 | 3.191 | 0.074 | 0.984 | 2.240 |
| 3N | 0.717 | 0.969 | 1.170 | 0.915 | 2.498 | 1.100 | 0.936 | 2.780 | |
| 4N | 0.100 | 0.935 | 0.122 | 0.902 | 2.310 | 0.105 | 0.956 | 3.565 | |
| Micro PHAZIR RX | 2N | 0.075 | 0.979 | 0.241 | 0.781 | 2.240 | - | - | - |
| 3N | 0.413 | 0.986 | 1.106 | 0.839 | 2.504 | - | - | - | |
| 4N | 0.115 | 0.934 | 0.243 | 0.717 | 1.851 | - | - | - | |
4. Conclusions
Author Contributions
Funding
Institutional Review Board Statement
Informed Consent Statement
Data Availability Statement
Conflicts of Interest
References
- Allen, S.K.; Downing, S.L. Performance of triploid Pacific oysters, Crassostrea gigas (Thunberg). I. Survival, growth, glycogen content, and sexual maturation in yearlings. J. Exp. Mar. Biol. Ecol. 1986, 102, 197–208. [Google Scholar] [CrossRef]
- Benjamin, W.S.; Nancy, H.H.; Peter, R.K. Evaluating the Potential Growth Advantage of Triploid Eastern Oysters (Crassostrea virginica) in South Carolina Relative to Commercially Cultured Diploid Native Stocks. J. Shellfish. Res. 2013, 32, 647–655. [Google Scholar]
- Guo, X.; Allen, S. Viable tetraploid Pacific oyster (Crassostrea gigas Thunburg) produced by inhibiting polar body I in eggs of triploids. Mol. Mar. Biol. Biotechnol. 1994, 3, 42–50. [Google Scholar]
- Guo, X.; Wang, Y.; DeBrosse, G.; Bushek, D.; Ford, S.E. Building a superior oyster for aquaculture. Jersey Shorel 2008, 25, 7–9. [Google Scholar]
- Wadsworth, P.; Wilson, A.E.; Walton, W.C. A meta-analysis of growth rate in diploid and triploid oysters. Aquaculture 2019, 499, 9–16. [Google Scholar] [CrossRef]
- Mallia, J.V.; Muthiah, P.; Thomas, P.C. Growth of triploid oyster, Crassostrea madrasensis (Preston). Aquac. Res. 2006, 37, 718–724. [Google Scholar] [CrossRef]
- Liang, Y.; Xu, C.; Li, Q. Growth, survival and color segregation of F2 hybrids between selected “Haida no.1” and Orange-shell lines of the Pacific oyster. Aquaculture 2023, 574, 739626. [Google Scholar] [CrossRef]
- Zi, H.; Qi, L. Different responses between orange variant and cultured population of the Pacific oyster Crassostrea gigas at early life stage to temperature-salinity combinations. Aquac. Res. 2018, 49, 2233–2239. [Google Scholar]
- Sai, W.; Qi, L.; Hong, Y.; Shi, L.; Ling, K. Estimating heritability for meat composition traits in the golden shell strain of Pacific oyster (Crassostrea gigas). Aquaculture 2020, 516, 734532. [Google Scholar]
- Xu, C.; Li, Q.; Chong, J. Mass Selection for Growth Improvement in Black Shell Line of Pacific Oyster Crassostrea gigas. Ocean Univ. China 2019, 18, 1411–1416. [Google Scholar] [CrossRef]
- Fu, J.; Sun, Y.; Cui, M.; Zhang, E.; Dong, L.; Wang, Y.; Wang, W.; Li, Z.; Yang, J. Analysis of Volatile Compounds and Flavor Fingerprint Using Gas Chromatography-Ion Mobility Spectrometry (GC-IMS) on Crassostrea gigas with Different Ploidy and Gender. Molecules 2023, 28, 4475. [Google Scholar] [CrossRef] [PubMed]
- Zhang, G.; Li, L.; Que, H. An evolution of oyster mariculture industry in China: New knowledge, variety and products. Oceanol. Limnol. Sin. 2020, 51, 740–749. [Google Scholar]
- Han, Z.; Cai, S.; Zhang, X.; Qian, Q.; Huang, Y.; Dai, F.; Zhang, G. Development of predictive models for total phenolics and free p-coumaric acid contents in barley grain by near-infrared spectroscopy. Food Chem. 2017, 227, 342–348. [Google Scholar] [CrossRef] [PubMed]
- Li, Y.; Zheng, X.; Zhang, D.; Li, X.; Fang, F.; Chen, L. Rapid Nondestructive Simultaneous Detection for Physicochemical Properties of Different Types of Sheep Meat Cut Using Portable Vis/NIR Reflectance Spectroscopy System. Foods 2021, 10, 1975. [Google Scholar] [CrossRef] [PubMed]
- Pan, L.; Zhu, Q.; Lu, R.; McGrath, J.M. Determination of sucrose content in sugar beet by portable visible and near-infrared spectroscopy. Food Chem. 2015, 167, 264–271. [Google Scholar] [CrossRef] [PubMed]
- Turinek, M.; Bavec, M.; Repič, M.; Turinek, M.; Krajnc, A.U.; Möllers, C.; Tres, A.; Bavec, F. Effects of intensive and alternative production systems on the technological and quality parameters of rapeseed seed (Brassica napus L. ‘Siska’). J. Sci. Food Agric. 2017, 97, 2647–2656. [Google Scholar] [CrossRef]
- Fluckiger, M.; Brown, M.R.; Ward, L.R.; Moltschaniwskyj, N.A. Predicting glycogen concentration in the foot muscle of abalone using near infrared reflectance spectroscopy (NIRS). Food Chem. 2011, 126, 1817–1820. [Google Scholar] [CrossRef] [PubMed]
- Wang, X.; Wang, W.; Li, Z.; Sun, G.; Xu, X.; Feng, Y.; Luo, Q.; Li, B.; Zhang, Q.; Yang, J. Comprehensive analysis of differentially expressed ncRNA, mRNA, and their ceRNA networks in the regulation of glycogen content in the Pacific oyster, Crassostrea gigas. Aquaculture 2021, 531, 735895. [Google Scholar] [CrossRef]
- Chang, C.; Laird, D.A.; Mausbach, M.J.; Hurburgh, C.R. Near-Infrared Reflectance Spectroscopy–Principal Components Regression Analyses of Soil Properties. Soil Sci. Soc. Am. J. 2001, 65, 480–490. [Google Scholar] [CrossRef]
- Nell, J.A. Farming triploid oysters. Aquaculture 2002, 210, 69–88. [Google Scholar] [CrossRef]
- Kawano, S.; Fujiwara, T.; Iwamoto, M. Nondestructive Determination of Sugar Content in Satsuma Mandarin using Near Infrared (NIR) Transmittance. J. Jpn. Soc. Hortic. Sci. 1993, 62, 465–470. [Google Scholar] [CrossRef]
- Magwaza, L.; Naidoo, M.; Laurie, S.; Laing, M.; Shimelis, H. Development of NIRS models for rapid quantification of protein content in sweetpotato [Ipomoea batatas (L.) LAM.]. Food Sci. Technol. 2016, 72, 63–70. [Google Scholar] [CrossRef]
- Galasso, H.L.; Callier, M.D.; Bastianelli, D.; Blancheton, J.P.; Aliaume, C. The potential of near infrared spectroscopy (nirs) to measure the chemical composition of aquaculture solid waste. Aquaculture 2017, 476, 134–140. [Google Scholar] [CrossRef]
- Silva, S.d.; Braga, C.; Fook, M.; Raposo, C.; Carvalho, L.; Canedo, E. Application of Infrared Spectroscopy to Analysis of Chitosan/Clay Nanocomposites. In Infrared Spectroscopy—Materials Science, Engineering and Technology; Books on Demand: Norderstedt, Germany, 2012; p. 35522. [Google Scholar]
- Osborne, B.G.; Fearn, T.; Hindle, P.H. Practical NIR Spectroscopy with Applications in Food and Beverage Analysis, 2nd ed.; Longman Scientific & Technical: Harlow, UK, 1993. [Google Scholar]
- Rinnan, Å.; van den Berg, F.; Engelsen, S.B. Review of the most common pre-processing techniques for near-infrared spectra. TrAC Trends Anal. Chem. 2009, 28, 1201–1222. [Google Scholar] [CrossRef]
- Berrueta, L.A.; Alonso-Salces, R.M.; Héberger, K. Supervised pattern recognition in food analysis. J. Chromatogr. A 2007, 1158, 196–214. [Google Scholar] [CrossRef]
- Rodionova, O.; Kucheryavskiy, S.; Pomerantsev, A. Efficient tools for principal component analysis of complex data a tutorial. Chemom. Intell. Lab. Syst. 2021, 213, 104304. [Google Scholar] [CrossRef]
- Šimundić, A.M. Measures of Diagnostic Accuracy: Basic Definitions. EJIFCC 2009, 19, 203–211. [Google Scholar] [PubMed]
- Zhao, Y.R.; Yu, K.Q.; Li, X.; He, Y. Detection of Fungus Infection on Petals of Rapeseed (Brassica napus L.) Using NIR Hyperspectral Imaging. Sci. Rep. 2016, 6, 38878. [Google Scholar] [CrossRef] [PubMed]
- Hawkins, A.J.; Magoulas, A.; Héral, M.; Bougrier, S.; Naciri-Graven, Y.; Day, A.J.; Kotoulas, G. Separate effects of triploidy, parentage and genomic diversity upon feeding behaviour, metabolic efficiency and net energy balance in the Pacific oyster Crassostrea gigas. Genet. Res. 2000, 76, 273–284. [Google Scholar] [CrossRef] [PubMed]
- Haure, J.; François, C.; Dégremont, L.; Ledu, C.; Maurouard, É.; Girardin, F.; Benabdelmouna, A. Physiological comparisons of Pacific cupped oysters at different levels of ploidy and selection to OsHV-1 tolerance. Aquaculture 2021, 544, 737111. [Google Scholar] [CrossRef]
- Viscarra, R.; McGlynn, R.N.; McBratney, A.B. Determining the composition of mineral-organic mixes using UV–vis–NIR diffuse reflectance spectroscopy. Geoderma 2006, 137, 70–82. [Google Scholar] [CrossRef]
- Van der Meer, F. Analysis of spectral absorption features in hyperspectral imagery. Int. J. Appl. Earth Obs. Geoinf. 2004, 5, 55–68. [Google Scholar] [CrossRef]
- Wang, W.; Yang, J.; Dong, Y.; Zang, H.; Wang, Z.; Sun, G. Establishment of Near-Infrared (NIR) Models for Eight Components in Fresh Tissue of Pacific Oysters (Crassostrea gigas). Mar. Lake Sci. 2015, 46, 845–852. [Google Scholar]
- Huang, G.; Guo, X.; Qi, J.; Ning, Y.; Wu, Q.; Wang, X.; Zeng, Z.; Zhu, L. Establishment of Near-Infrared Quantitative Models for Six Chemical Components in Portuguese Oysters (Crassostrea angulata). Spectrosc. Spectr. Anal. 2020, 40, 1509–1513. [Google Scholar]


| NIR Instruments | Ploidy | Calibration Sets | External Validation Sets | ||||
|---|---|---|---|---|---|---|---|
| Average | Range | N | Average | Range | N a | ||
| MicroNIR 1700 | 2N | 1.34 ± 0.50 | 0.54–2.60 | 56 | 1.24 ± 0.45 | 0.71–1.97 | 6 |
| 3N | 6.63 ± 2.92 | 0.89–12.09 | 70 | 6.51 ± 3.06 | 2.05–11.19 | 8 | |
| 4N | 1.03 ± 0.28 | 0.48–1.79 | 78 | 1.08 ± 0.37 | 0.57–1.76 | 8 | |
| Micro PHAZIR RX | 2N | 1.25 ± 0.54 | 0.40–2.71 | 115 | - | - | - |
| 3N | 7.14 ± 3.52 | 0.41–13.63 | 93 | - | - | - | |
| 4N | 1.08 ± 0.45 | 0.43–2.41 | 145 | - | - | - | |
| NIR Instruments | 2N | 3N | 4N | |||
|---|---|---|---|---|---|---|
| Pretreatment b | Principal Component | Pretreatment | Principal Component | Pretreatment | Principal Component | |
| MicroNIR 1700 | SD, NDF (5, 5) | 8 | SD, NS | 8 | SP, SG (7, 3) | 9 |
| Micro PHAZIR RX | SG, NR | 20 | SG, NR | 20 | SG | 20 |
| Models c | Pretreatment | PC | Cumulative Contribution Rate | Performance Index | Accurately Judged or Not |
|---|---|---|---|---|---|
| 2N-M, 2N-F | SD, NDF (5, 5) | 10 | 99.90 | 91.6 | Yes |
| 2N, 3N, 4N | SG (7, 3) | 10 | 99.95 | 83.1 | No |
| 4N-M, 4N-F | FD | 10 | 99.97 | 95.0 | Yes |
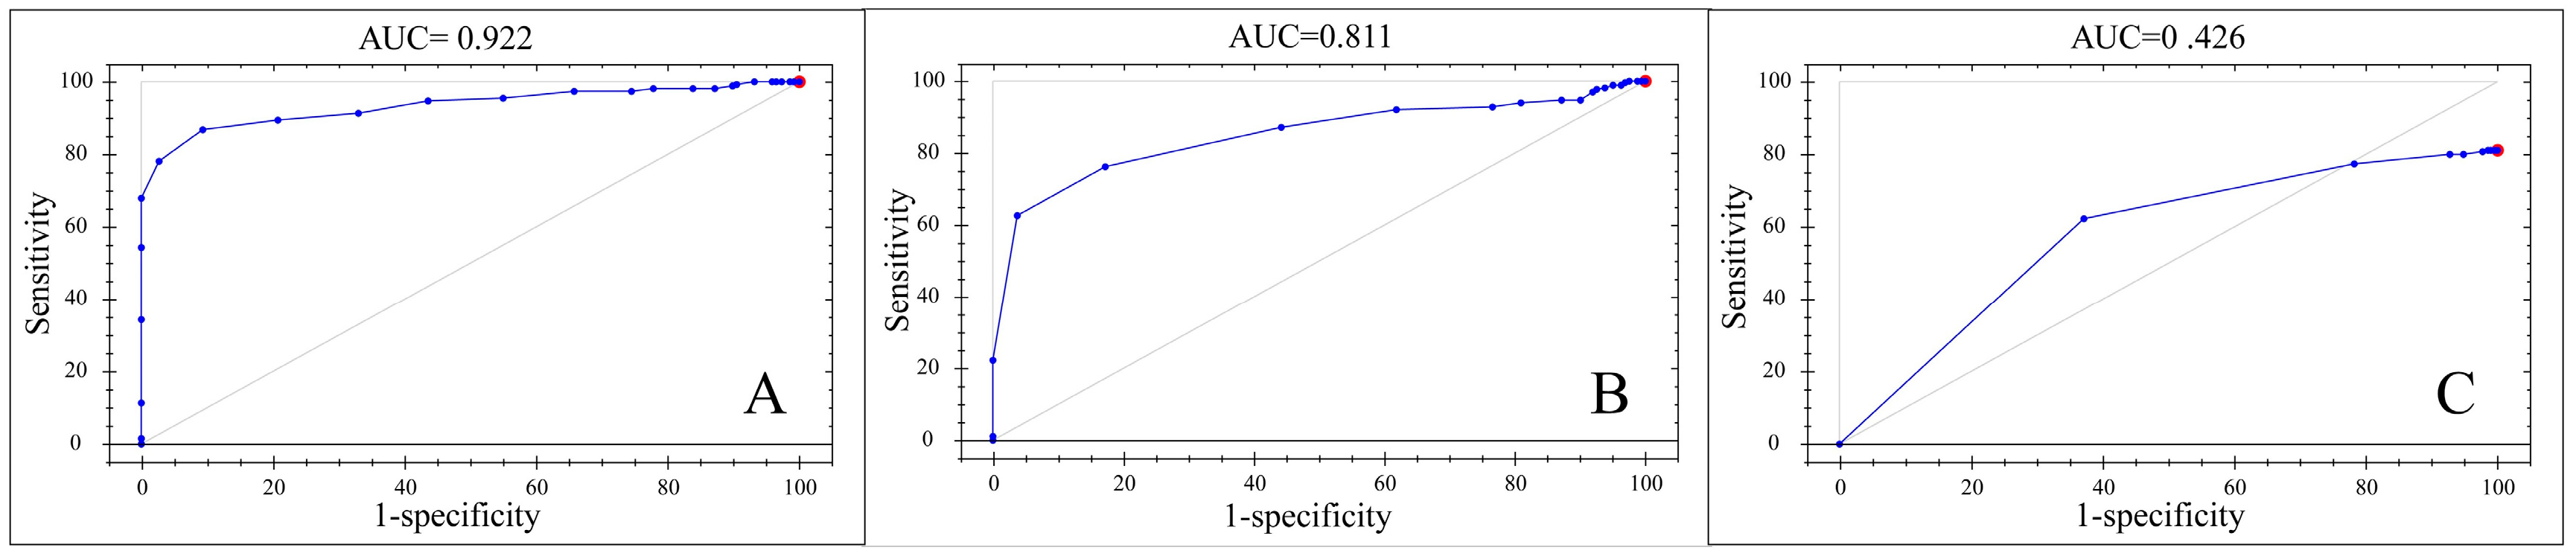
| Models | Pretreatment | Correctly Identified | AUC d | Accurately Judged or Not |
|---|---|---|---|---|
| 2N-M, 2N-F | SP | 100% | 0.922 | Yes |
| 2N, 3N, 4N | NR | 81.17% | 0.426 | No |
| 4N-M, 4N-F | SG, NR | 100% | 0.811 | Yes |
Disclaimer/Publisher’s Note: The statements, opinions and data contained in all publications are solely those of the individual author(s) and contributor(s) and not of MDPI and/or the editor(s). MDPI and/or the editor(s) disclaim responsibility for any injury to people or property resulting from any ideas, methods, instructions or products referred to in the content. |
© 2024 by the authors. Licensee MDPI, Basel, Switzerland. This article is an open access article distributed under the terms and conditions of the Creative Commons Attribution (CC BY) license (https://creativecommons.org/licenses/by/4.0/).
Share and Cite
Fu, J.; Wang, W.; Sun, Y.; Zhang, Y.; Luo, Q.; Wang, Z.; Wang, D.; Feng, Y.; Xu, X.; Cui, C.; et al. Glycogen Quantification and Gender Identification in Di-, Tri-, and Tetraploid Crassostrea gigas Using Portable Near-Infrared Spectroscopy. Foods 2024, 13, 2191. https://doi.org/10.3390/foods13142191
Fu J, Wang W, Sun Y, Zhang Y, Luo Q, Wang Z, Wang D, Feng Y, Xu X, Cui C, et al. Glycogen Quantification and Gender Identification in Di-, Tri-, and Tetraploid Crassostrea gigas Using Portable Near-Infrared Spectroscopy. Foods. 2024; 13(14):2191. https://doi.org/10.3390/foods13142191
Chicago/Turabian StyleFu, Jingjing, Weijun Wang, Youmei Sun, Yousen Zhang, Qihao Luo, Zhongping Wang, Degang Wang, Yanwei Feng, Xiaohui Xu, Cuiju Cui, and et al. 2024. "Glycogen Quantification and Gender Identification in Di-, Tri-, and Tetraploid Crassostrea gigas Using Portable Near-Infrared Spectroscopy" Foods 13, no. 14: 2191. https://doi.org/10.3390/foods13142191