
Risk Perception, Risk Preference, and Timing of Food Sales: New Insights into Farmers’ Negativity in China


Abstract
1. Introduction
2. Theoretical Framework
2.1. Theoretical Framework of Risk Perception and Farmers’ Timing of Food Sales
2.2. Analysis of the Moderating Mechanism of Risk Preference
3. Data, Modeling, and Variable Selection
3.1. Data
3.2. Measurement Modeling
3.3. Variable Selection and Descriptive Statistics
3.3.1. Dependent Variable
3.3.2. Core Independent Variable
The Solution of
The Solution of
3.3.3. Moderating Variable
3.3.4. Control Variables
3.3.5. Descriptive Statistics
4. Analysis of Empirical Results
4.1. Benchmark Regression
4.2. Endogenous Issues
4.3. Robustness Check
4.3.1. Replacement of the Dependent Variable
4.3.2. Replacement of the Estimation Model
4.3.3. Verification of Marginal Effects
4.4. Heterogeneity Analysis
4.4.1. Planting Scale
4.4.2. Percentage of Revenue from Food Sales
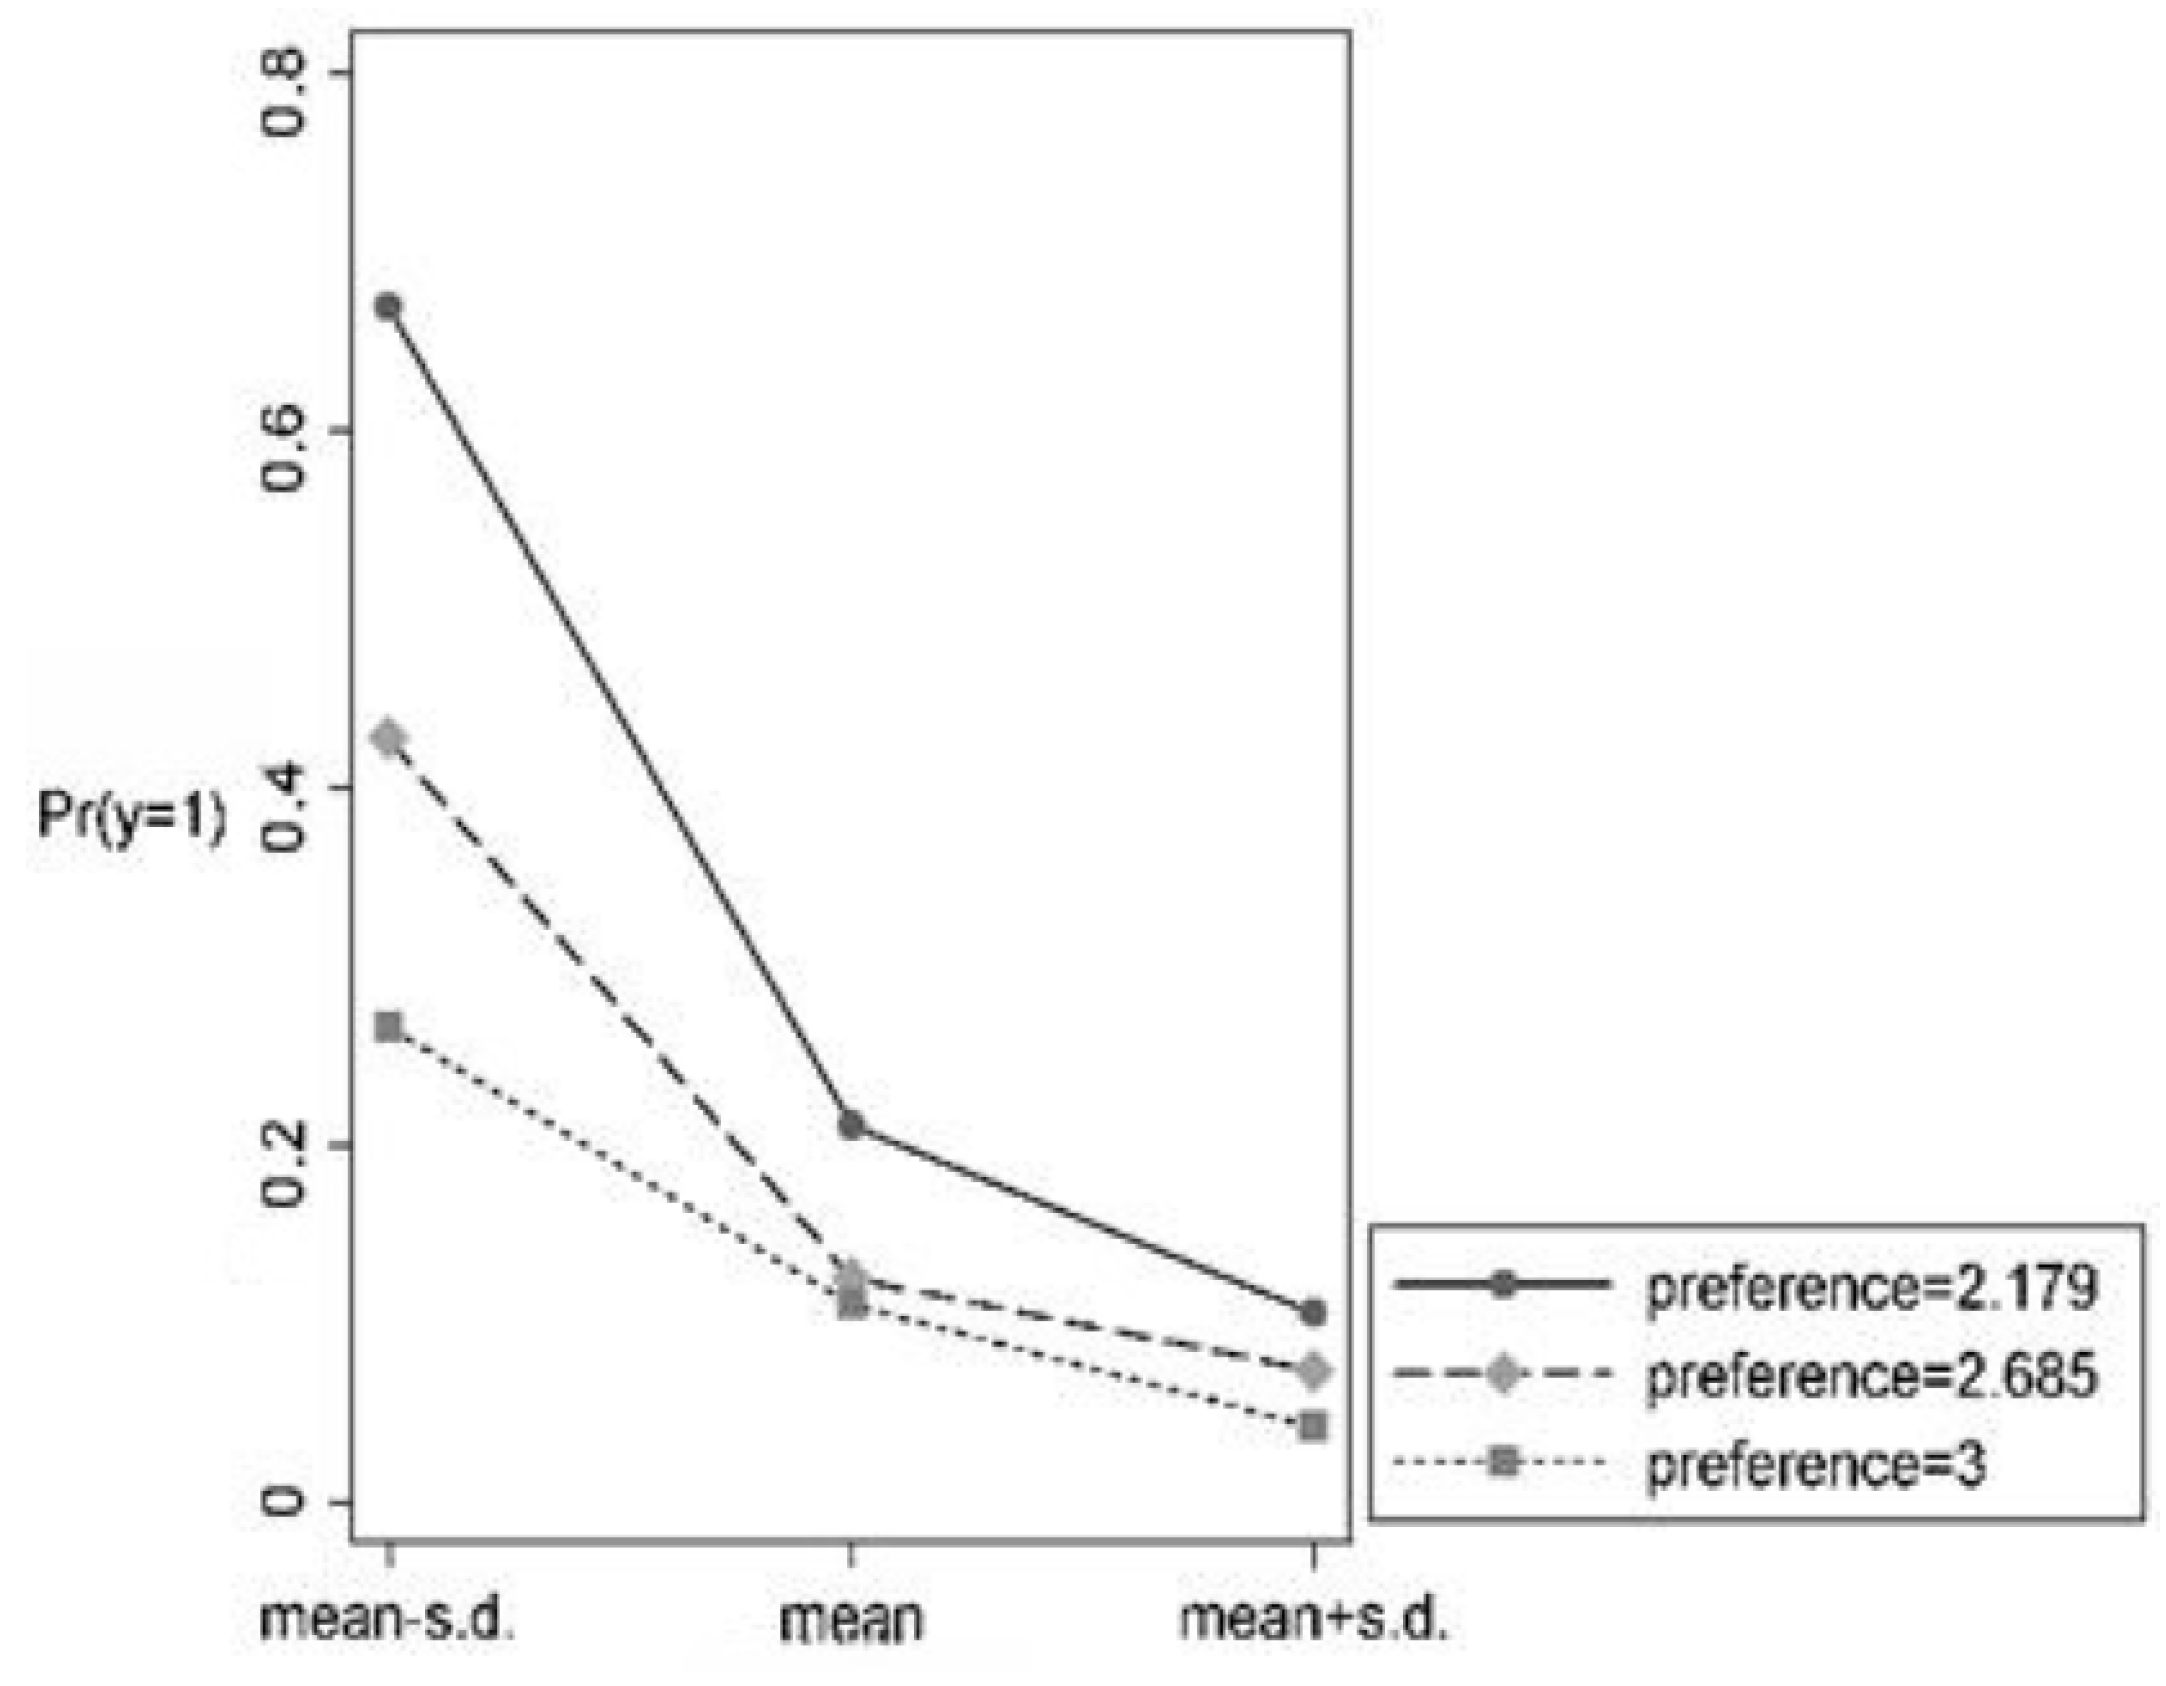
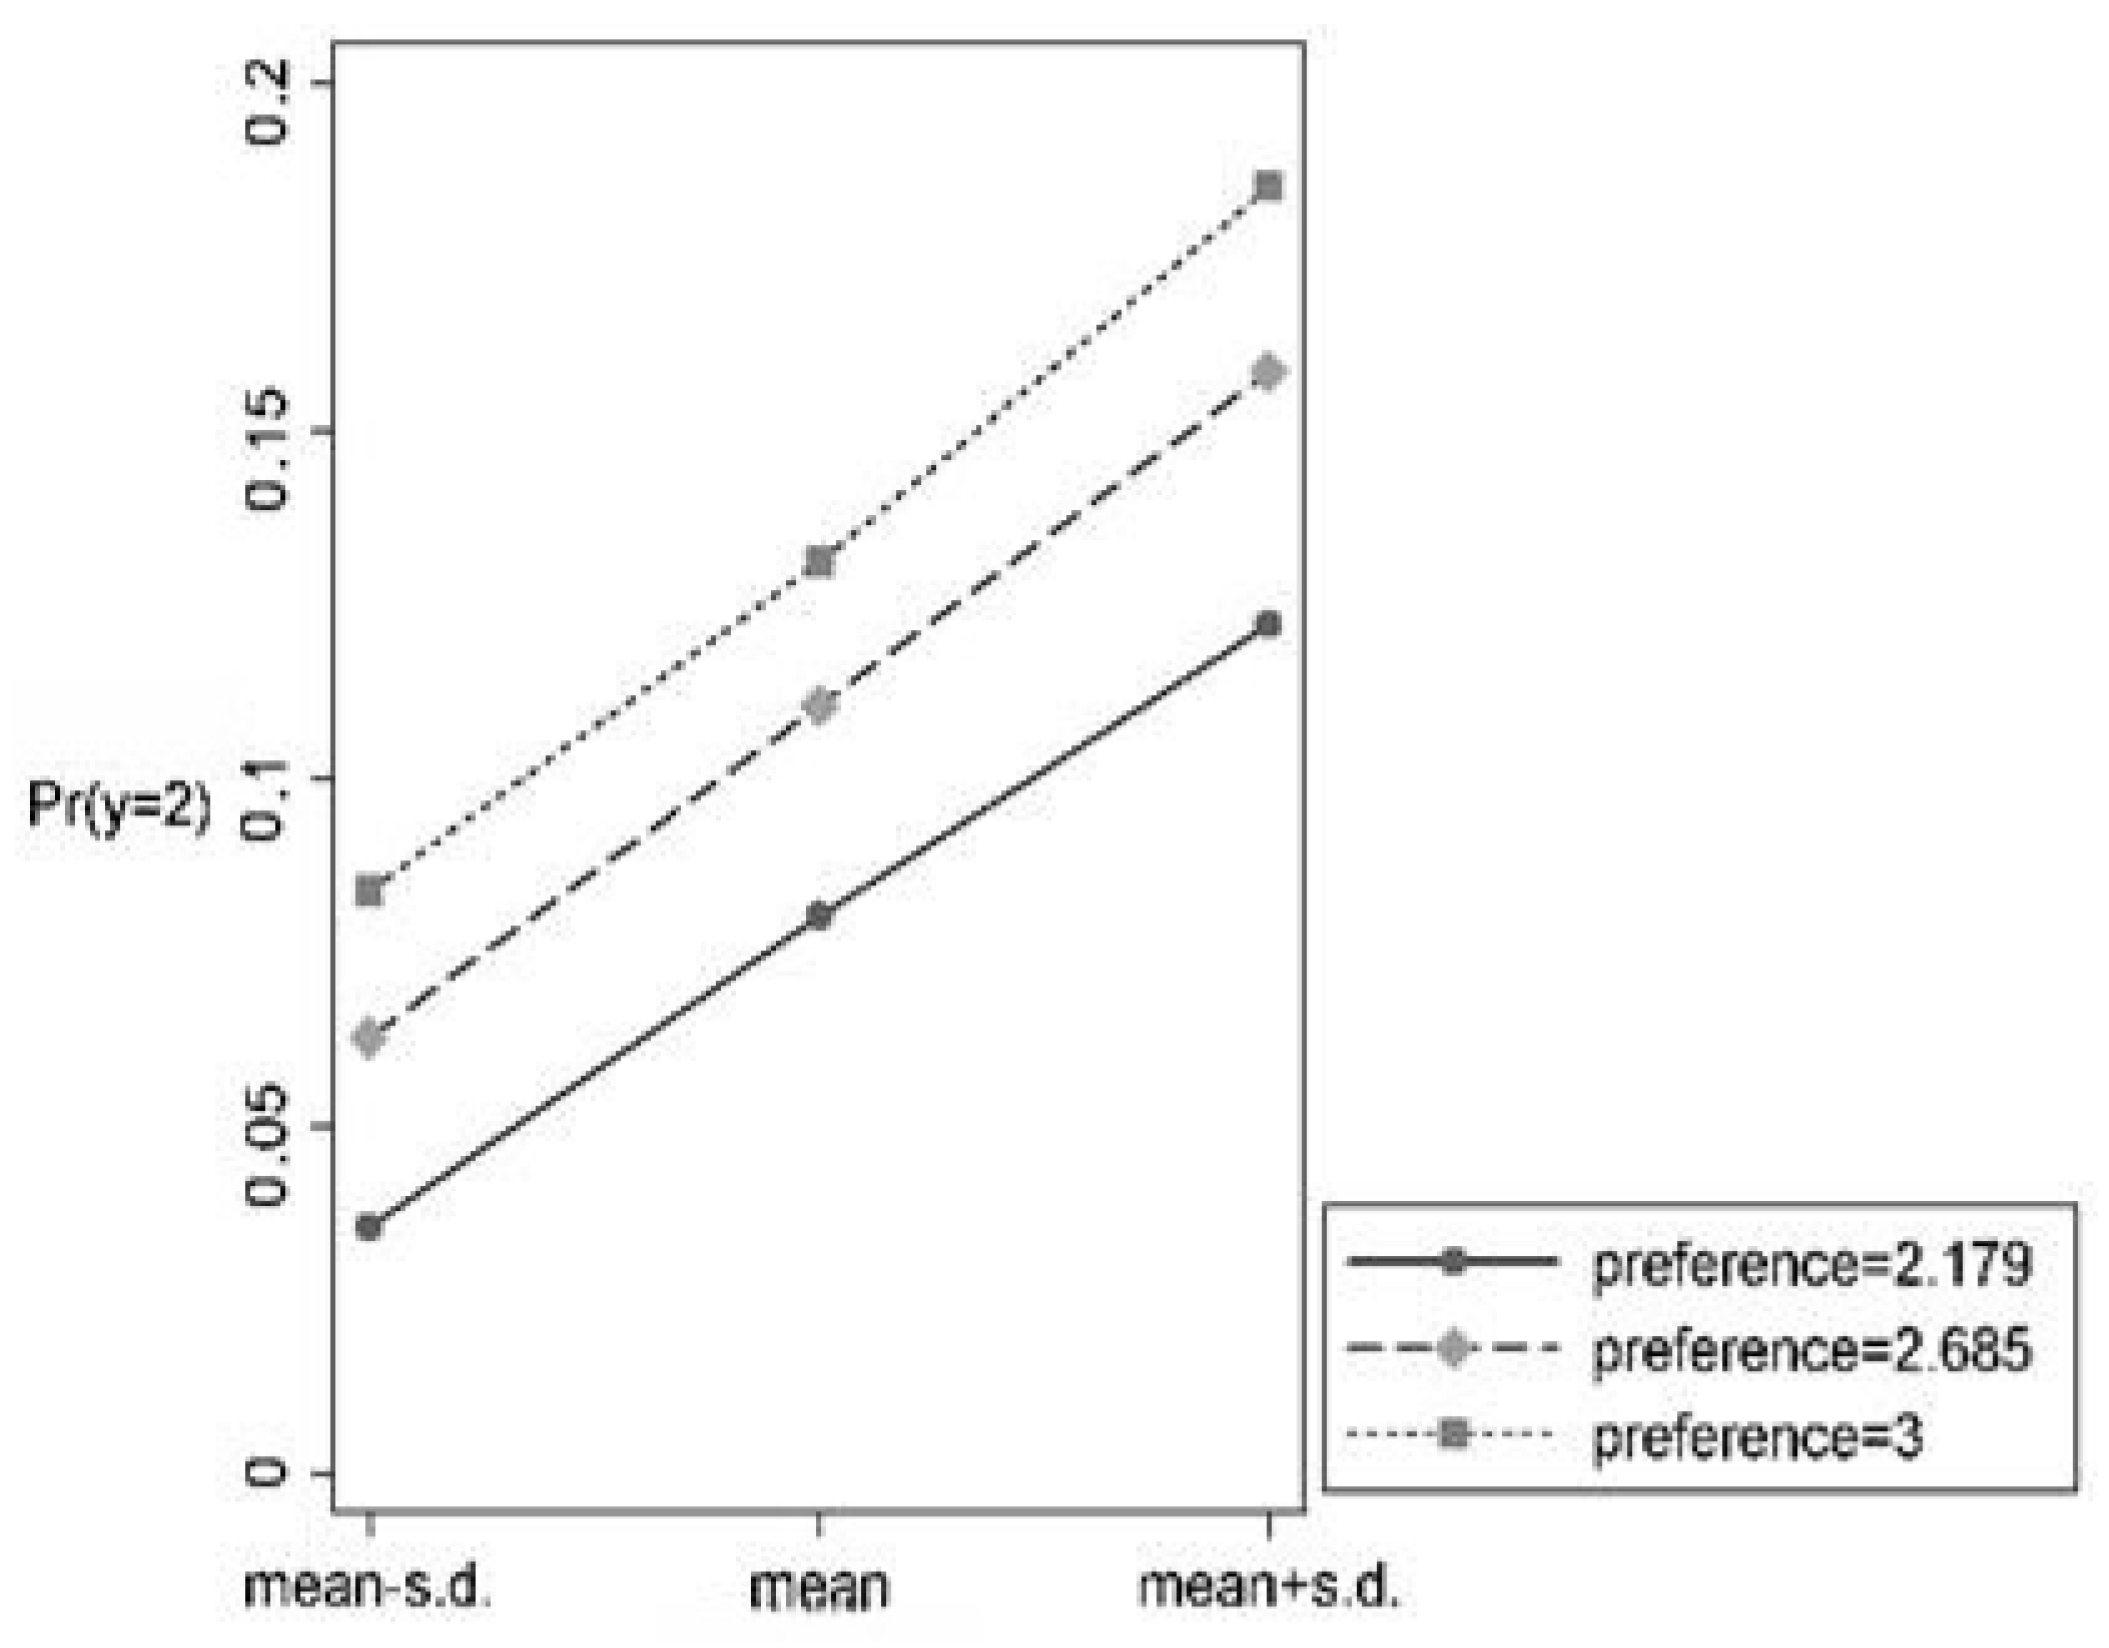
4.5. Test of the Moderating Mechanism of Risk Preference
5. Discussion
6. Conclusions
Author Contributions
Funding
Institutional Review Board Statement
Informed Consent Statement
Data Availability Statement
Conflicts of Interest
Appendix A

| Measurement Indicators | Description of Indicators | Data Sources |
|---|---|---|
| Harvest season prices/lean season prices for the last three years | The main factor in the perception of market risk is price volatility (Akhtar et al., 2019 [47]); we count the number of months with negative returns on storage in the last three years of the market cycle to indicate the price risk faced by farmers’ intertemporal sales. Wheat in the survey sample provinces is mainly winter wheat, of which the wheat harvest time in Hubei and Anhui is from mid to late May, and the wheat harvest time in Hebei, Shandong, Jiangsu, and Henan is basically at the end of May and the beginning of June. The time from harvesting to centralized entering the market is about 7 to 15 days. Considering that food merchants, processing plants, and storage enterprises at all levels continue to purchase new food for a period of time, trade market prices collected in the Bric Agricultural Database lag behind farmers’ selling prices, so we choose June, July, and August for the harvest season, and the rest of the months are for the lean season. We set the average of wheat prices for the months of June, July, and August as the harvest season prices Based on storage return r = we consider a month when the lean season price is lower than the harvest price as a price risk; otherwise, there is no price risk. The number of months with price risk is also counted to reflect the price risk of farmers’ food sales. The larger the ratio, the greater the market risk for farmers and the more they tend to sell their food for in the current period. | 2015~2018 Bric Agricultural Database |
| Price ratio for the same period | Due to the proximate cause–effect (Kahneman and Tversky, 1984 [48]), farmers have a deeper impression of last year’s prices, and the price ratio over the same period can truly reflect the farmers’ perception of market risk. As the farmers’ research data were collected in the first half of 2019, the farmers’ “last year’s” decision to sell food was for wheat harvested around June 2018. For the price risk, farmers mainly refer to last year’s market cycle, that is, the ratio of the purchase price in June 2018 to the purchase price in June 2017. The greater the ratio, the greater the market risk for farmers and the greater the tendency to sell food in the current period. | 2017~2018 National Food and Materials Reserve Administration weekly market monitoring reports |
| Level of market interest | According to the questionnaire “How much do you usually pay attention to economic and financial information”, the sample will be assigned the values 1, 2, and 3; the larger the value, the less attention to the market and the greater the market risk. | 2019 China Household Finance Survey |
| 1/amount of cash | According to the questionnaire question “How much cash do you currently hold in your household?”, the larger the ratio, the higher the liquidity risk for the farmer. | 2019 Chinese Family Database |
| Consumption expenditure/gross income | Find the ratio of the questionnaire’s “total consumption of last year’s surveyed households” to “total income of last year’s surveyed households”; the larger the ratio, the greater the liquidity risk of the farmers. | 2019 China Household Finance Survey |
| Revenue from food sales/total revenue | Find the ratio of the questionnaire’s “Income from the sale of food crops in your household last year” to the “Total income of the surveyed households last year”; the greater the ratio, the greater the risk of liquidity for the farmers. | 2019 China Household Finance Survey |
| 1/number of sales channels | According to the questionnaire question “What are the marketing channels for the agricultural products produced by your family?”, take the inverse; the larger the ratio, the higher the risk of transaction costs for farmers. | 2019 China Household Finance Survey |
| Whether to sell only to rural food merchants | According to the questionnaire question “What are the sales channels for the agricultural products produced by your family?”, only those farmers who chose rural food merchants were assigned a value of 1, with a higher risk of transaction costs. | 2019 China Household Finance Survey |
| Number of relatives and neighbors helping | According to the questionnaire question “How many relatives and neighbors helped your family with farm work during the last year’s farming season?”, the smaller the value, the higher the risk of transaction costs for the farmers. | 2019 China Household Finance Survey |
| Availability of agricultural guidance | According to the questionnaire question “Did your family get some guidance on agricultural technology last year?”, the value of choosing “no” is 1, and the risk of obtaining information is higher. | 2019 China Household Finance Survey |
| Whether to buy online | According to the questionnaire question “How much did your family spend on online shopping last year?”, farmers who chose zero had insufficient access to outside information and were at a greater risk of information loss. | 2019 China Household Finance Survey |
References
- FAO; IFAD; IMF; OECD; UNCTAD; WFP; the World Bank; the WTO; IFPRI; the UN HLTF. Price Volatility in Food and Agricultural Markets: Policy Responses; Policy Report for the G-20; Food and Agriculture Organization: Rome, Italy, 2011. [Google Scholar]
- Kaminski, J.; Christiaensen, L.; Gilbert, C.L. Seasonality in Local Food Markets and Consumption: Evidence from Tanzania. Oxf. Econ. Pap. 2016, 68, 736–757. [Google Scholar] [CrossRef]
- Liu, H.; Bai, J.; Qiu, H.; Xi, Y.; Xu, Z. The Impact of Warehouse Conditions and Liquidity Constraints on Farmers’ Food-selling Behavior: A Study Based on the Model of the Peasants who Sell Food in Two Periods. Manag. World 2011, 11, 66–75+187. [Google Scholar]
- Zhou, F. From Poverty Alleviation to Rural Revitalization: Towards an Integrated State-Farmer Relationship with Chinese Characteristics. Sociol. Stud. 2021, 36, 1–22+226. [Google Scholar]
- Xiong, J. The Logic and Change in Farmers’ Food Selling Behavior; Central China Normal University: Wuhan, China, 2008; pp. 2–3. [Google Scholar]
- Stephens, E.C.; Barrett, C.B. Incomplete Credit Markets and Commodity Marketing Behavior. J. Agric. Econ. 2011, 62, 1–24. [Google Scholar] [CrossRef]
- Aggarwal, S.; Francis, E.; Robinson, J. Food Today, Gain Tomorrow: Evidence from a Storage Experiment with Savings Clubs in Kenya. J. Dev. Econ. 2018, 134, 1–15. [Google Scholar] [CrossRef]
- Burke, M.; Bergquist, L.F.; Miguel, E. Sell Low and Buy High: Arbitrage and Local Price Effects in Kenyan Markets. Q. J. Econ. 2019, 134, 785–842. [Google Scholar] [CrossRef]
- Zulu, B.; Jayne, T.S.; Beaver, M. Smallholder Household Maize Production and Marketing Behavior in Zambia: Implications for Policy; Food Security Research Project Working Paper; Michigan State University: East Lansing, MI, USA, 2007. [Google Scholar]
- Channa, H.; Chen, A.Z.; Pina, P.; Gilbert, J.; Stein, D. What Drives Smallholder Farmers’ Willingness to Pay for a New Farm Technology? Evidence from an Experimental Auction in Kenya. Food Policy 2019, 85, 64–71. [Google Scholar] [CrossRef] [PubMed]
- Cotty, T.L.; Maître D’Hôtel, T.E.; Soubeyran, R.; Subervie, J. Inventory Credit as a Commitment Device to Save Food until the Hunger Season. Am. J. Agric. Econ. 2019, 101, 1115–1139. [Google Scholar] [CrossRef]
- Tian, T.; Zhao, X.; Cao, B. Risk perception, risk preference and farmers’ indifference in food sales. Appl. Econ. Lett. 2024. [Google Scholar] [CrossRef]
- Zhang, J.; Mishra, A.K.; Hirsch, S. Market-oriented agriculture and farm performance: Evidence from rural China. Food Policy 2021, 100, 102023. [Google Scholar] [CrossRef]
- Cardell, L.; Michelson, H. Price Risk and Small Farmer Maize Storage in Sub-Saharan Africa: New Insights into a Long-Standing Puzzle. Am. J. Agric. Econ. 2022, 105, 737–759. [Google Scholar] [CrossRef]
- Pratt, J.W. Risk Aversion in the Small and in the Large. Econometrica 1964, 32, 122–136. [Google Scholar] [CrossRef]
- Kahneman, D.; Tversky, A. Prospect Theory: An Analysis of Decision under Risk. Econometrica 1979, 47, 263–291. [Google Scholar] [CrossRef]
- Slovic, P. Perception of risk. Science 1987, 236, 280–285. [Google Scholar] [CrossRef] [PubMed]
- Kahneman, D.; Lovallo, D. Timid Choices and Bold Forecasts: A Cognitive Perspective on Risk Taking. Manag. Sci. 1993, 39, 17–31. [Google Scholar] [CrossRef]
- Sitkin, S.B.; Weingart, L.R. Determinants of risky decision-making behavior: A test of the mediating role of risk perceptions and propensity. Acad. Manag. J. 1995, 38, 1573–1592. [Google Scholar] [CrossRef]
- Lusk, J.L.; Coble, K.H. Risk Perceptions, Risk Preference, and Acceptance of Risky Food. Am. J. Agric. Econ. 2005, 87, 393–405. [Google Scholar] [CrossRef]
- Weber, E.U.; Blais, A.R.; Betz, N.E. A domain-specific risk-attitude scale: Measuring risk perceptions and risk behaviors. J. Behav. Decis. Mak. 2002, 15, 263–290. [Google Scholar] [CrossRef]
- Barrett, C.; Dorosh, P. Farmers’ Welfare and Changing Food Prices: Nonparametric Evidence from Rice in Madagascar. Am. J. Agric. Econ. 1996, 78, 656–669. [Google Scholar] [CrossRef]
- Tversky, A.; Kahneman, D. Rational Choice and the Framing of Decisions. J. Bus. 1986, 59, 251–278. [Google Scholar] [CrossRef]
- Roumasset, J.A. Rice and Risk: Decision-Making Among Low-Income Farmers. Econ. J. 1977, 87, 825–828. [Google Scholar]
- Yesuf, M.; Bluffstone, R.A. Poverty, Risk aversion, and Path Dependence in Low-Income Countries: Experimental Evidence from Ethiopia. Am. J. Agric. Econ. 2009, 91, 1022–1037. [Google Scholar] [CrossRef]
- Winterfeldt, D.V.; Edwards, W. Decision Analysis and Behavioral Research; Cambridge University Press: Cambridge, UK, 1986. [Google Scholar]
- Vlek, C.; Stallen, P.J. Rational and personal aspects of risk. Acta Psychol. 1980, 45, 273–300. [Google Scholar] [CrossRef]
- Wei, X.; Shi, Q. Household Food Storage and Food Security: An Analysis Based on Data from Shanxi, Zhejiang and Guizhou. Chin. Rural Econ. 2000, 9, 86–104. [Google Scholar]
- Bauer, R.A. Consumer Behavior as Risk Taking. In Marketing: Critical Perspectives on Business and Management; Hancock, R.S., Ed.; American Marketing Association: St. Petersburg, FL, USA, 1960; pp. 389–398. [Google Scholar]
- Cunningham, S.M. The Major Dimensions of Perceived Risk; Harvard University Press: Cambridge, MA, USA, 1967. [Google Scholar]
- Cox, D.F. Risk Taking and Information Handling in Consumer Behavior; Harvard University Press: Cambridge, MA, USA, 1967. [Google Scholar]
- Roselius, T. Consumer rankings of risk reduction methods. J. Mark. 1971, 35, 56–61. [Google Scholar] [CrossRef]
- Peter, J.P.; Ryan, M.J. An Investigation of Perceived Risk at the Brand Level. J. Mark. Res. 1976, 13, 184–188. [Google Scholar] [CrossRef]
- Derbaix, C. Perceived risk and risk relievers: An empirical investigation. J. Econ. Psychol. 1983, 3, 19–38. [Google Scholar] [CrossRef]
- Featherman, M.S.; Pavlou, P.A. Predicting e-Services Adoption: A Perceived Risk Facets Perspective. Int. J. Hum. Comput. Stud. 2003, 59, 451–474. [Google Scholar] [CrossRef]
- Yao, Z.; Zheng, S. Empirical Analysis of Influence Factors of Large-scale Grain-production Households’ Behavior of Choosing Grain Sales Way. J. Northwest AF Univ. 2013, 13, 39–45. [Google Scholar]
- Qiu, H.; Su, L.; Zhang, Y.; Tang, J. Risk Preference, Risk Perception and Farmers’ Adoption of Conservation Tillage. Chin. Rural Econ. 2020, 7, 59–79. [Google Scholar]
- Xu, F. The Formation and Guidance of Farmers’ Grain Selling and Storage Behavior. Rural Econ. 2002, 6, 56–57. [Google Scholar]
- Lv, D.; Zhang, Y.; Tan, Y. Analysis of farmers’ decision-making ability in grain sales in China: Based on the perspective of behavioral finance. Issues Agric. Econ. 2010, 32, 26–29. [Google Scholar]
- Ma, X. Risk Avoiding Behavior of Chinese Farmers: An Empirical Study in Shanxi. China Soft Sci. 2006, 2, 22–30. [Google Scholar]
- Qu, X.; Huo, X. The impact of transaction costs on farmers’ agricultural products marketing behavior. China Rural Econ. 2007, 8, 35–46. [Google Scholar]
- Zhu, Q.; Zhu, C.; Peng, C.; Bai, J. Can Informatization Boost Farmers’ Income Increase and Narrow the Income Gap in Rural China? China Econ. Q. 2002, 1, 237–256. [Google Scholar]
- Yu, L.; Zheng, K. Comparison and Consideration of Different Objective Weighting Methods in Journal Evaluation. J. Mod. Inf. 2021, 41, 21–130. [Google Scholar]
- Xu, J.; Chu, Y.; Feng, L. Analysis of Differences in Food Selling Behavior and Influencing Factors of Farm Households of Different Scales. Rural Econ. 2018, 11, 102–109. [Google Scholar]
- Abadie, A.; Imbens, G. Matching on the Estimated Propensity Score. Econometrica 2016, 84, 781–807. [Google Scholar] [CrossRef]
- Harrison, W.; Johnson, E.; Melayne, M.; Rutström, E. Risk Aversion and Incentive Effects: Comment. Am. Econ. Rev. 2005, 95, 897–901. [Google Scholar] [CrossRef]
- Akhtar, S.; Cheng, G.; Nazir, I.A. Maize Production under Risk: The Simultaneous Adoption of Off-Farm Income Diversification and Agricultural Credit to Manage Risk. J. Integr. Agric. 2019, 18, 460–470. [Google Scholar] [CrossRef]
- Kahneman, D.; Tversky, A. Choice, Values and Frames. Am. Psychol. 1984, 39, 341–350. [Google Scholar] [CrossRef]

| Timing of Farmers’ Food Sales | Sample Size | Proportions (%) |
|---|---|---|
| Intertemporal sales | 19 | 1.37 |
| Two-phase sales | 123 | 8.86 |
| Current sales | 1246 | 89.77 |
| Research Dimensions | Author [Ref.] |
|---|---|
| Financial, social, psychological | Cox [31] |
| Social, money, physical, time, products | Cunningham [30] |
| Social, intellectual, psychological | Slovic [17] |
| Risk Perception | Perceptual Factor | Measurement Indicators | Weights (%) |
|---|---|---|---|
| Market risk | Historical experience | Harvest season prices/off-season prices for the last three years | 47.22 |
| Current price | Price ratio for the same period | 42.15 | |
| Price expectations | Degree of market concern | 10.63 | |
| Fluid funds | Amount of cash | 54.12 | |
| Liquidity | Current ratio | Consumption expenditure/gross income | 28.16 |
| risk | Percentage of revenue from food sales | Revenue from food sales/total revenue | 17.72 |
| Sales channel | Number of sales channels | 65.24 | |
| Transaction | Sales objects | Whether to sell only to rural food merchants | 31.36 |
| cost risk | Costs of transportation, hired labor, etc. | Number of relatives and neighbors helping | 3.40 |
| Information risk | External information | Whether to buy online | 50.21 |
| Local information | Availability of agricultural guidance | 49.79 |
| Variable | Definitions | Mean | S.D. |
|---|---|---|---|
| Timing of food sales | Intertemporal, 1.37%; two phase, 8.86%; current, 89.77% | — | — |
| Risk preference | Risk pursuing, 2.02%; risk neutural, 27.45%; risk averse, 70.53% | — | — |
| Gender | Male, 66.5%; female, 33.5% | — | — |
| Education | Illiterate, 21.61%; primary, 34.87%; junior, 33.07%; middle, 15.63%; college, 0.6% | — | — |
| Physical condition | Very good, 9.08%; good, 16.35%; general, 35.73%; poor, 31.56%; very poor, 14.70% | — | — |
| Village officials | Yes, 5.5%; No, 94.5% | — | — |
| Risk perception (to avoid making the relative risk ratios too small for labeling, this paper multiplies the risk perception by 10) | Farmers’ perceived level of risk in food sales | 4.38 | 1.24 |
| Age | Age of head of household | 57.34 | 11.00 |
| Household size | Number of family members | 3.52 | 1.70 |
| Non-farm income | Income not from agriculture, unit: CNY ten thousand | 0.37 | 1.09 |
| (1) | (2) | (3) | (4) | |||||
|---|---|---|---|---|---|---|---|---|
| Coef. | RRR | Coef. | RRR | Coef. | RRR | Coef. | RRR | |
| Risk perception | −0.893 *** | 0.409 | −0.303 *** | 0.739 | −0.865 ** | 0.421 | −0.304 *** | 0.738 |
| (0.343) | (0.111) | (0.404) | (0.106) | |||||
| Gender | 0.357 | 1.430 | 0.409 * | 1.505 | ||||
| (0.595) | (0.237) | |||||||
| Age | −0.002 | 0.998 | 0.002 | 1.002 | ||||
| (0.029) | (0.011) | |||||||
| Education | 0.398 | 1.488 | −0.155 | 0.857 | ||||
| (0.249) | (0.115) | |||||||
| Physical condition | 0.216 | 1.241 | 0.019 | 1.019 | ||||
| (0.136) | (0.050) | |||||||
| Village officials | −0.241 | 0.786 | −0.278 | 0.758 | ||||
| (1.062) | (0.494) | |||||||
| Household size | 0.123 | 1.131 | −0.104 | 0.901 | ||||
| (0.126) | (0.065) | |||||||
| Non-farm income | −0.495 | 0.610 | 0.136 | 1.145 | ||||
| (0.433) | (0.085) | |||||||
| Region | Control | Control | ||||||
| Constant term | −0.661 | 0.517 | −1.037 | 0.355 | −3.571 | 0.028 | −1.073 | 0.342 |
| (1.248) | (0.459) | (2.354) | (1.057) | |||||
| Observations | 1388 | 1388 | ||||||
| Wald chi2 | 13.55 | 986.04 | ||||||
| Prob > chi2 | 0.0011 | 0.0000 | ||||||
| Pseudo R2 | 0.0228 | 0.0659 | ||||||
| (1) | (2) | (3) | |
|---|---|---|---|
| Risk perception | −0.011 ** | −0.023 *** | 0.034 *** |
| (0.006) | (0.008) | (0.010) | |
| Control variable | Control | Control | Control |
| Observations | 1388 | 1388 | 1388 |
| Intertemporal Sales | Two-Phase Sales | |||
|---|---|---|---|---|
| Low Perception | High Perception | Low Perception | High Perception | |
| Risk perception | −1.155 *** (0.341) | 49.193 *** (3.612) | −0.693 *** (0.203) | 0.346 (0.340) |
| Control variable | Control | Control | Control | Control |
| Region | Control | Control | Control | Control |
| Observations | 1388 | 1388 | ||
| Intergroup regression coefficients | 192.55 | 6.89 | ||
| difference-in-difference test | 0.0000 | 0.0087 | ||
| Parameters | Average Treatment Effect | “A-I” Robust Standard Errors | |
|---|---|---|---|
| k-nearest neighbor matching | k = 1 | 0.073 ** | 0.029 |
| k = 4 | 0.084 *** | 0.023 | |
| Caliper matching | Caliper = 0.1 | 0.084 *** | 0.021 |
| (1) | (2) | (3) | (4) | |
|---|---|---|---|---|
| Coef. | Coef. | AME | AME | |
| Risk perception | 0.111 *** | 0.367 *** | −0.009 ** | −0.022 *** |
| (0.043) | (0.111) | (0.005) | (0.007) | |
| Control variable | Control | Control | Control | Control |
| Region | Control | Control | Control | Control |
| Observations | 1388 | 1388 | 1388 | 1388 |
| Wald chi2 | 154.72 | 46.19 | —— | —— |
| Prob > chi2 | 0.0000 | 0.0000 | —— | —— |
| Pseudo R2 | 0.0482 | 0.0446 | —— | —— |
| Small-Scale Farmers | Medium-Scale Farmers | Large-Scale Farmers | ||||
|---|---|---|---|---|---|---|
| Intertemporal | Two Phase | Intertemporal | Two Phase | Intertemporal | Two Phase | |
| Risk perception | −0.820 ** | −0.106 | −0.992 | −0.461 ** | −0.703 | −0.363 ** |
| (0.411) | (0.160) | (1.093) | (0.208) | (0.677) | (0.174) | |
| Control variable | Control | Control | Control | |||
| Region | Control | Control | Control | |||
| Observations | 531 | 464 | 393 | |||
| Wald chi2 | 1740.49 | 29.37 | 2850.59 | |||
| Prob > chi2 | 0.0000 | 0.2945 | 0.0000 | |||
| Pseudo R2 | 0.1093 | 0.1018 | 0.1351 | |||
| Low Percentage of Income from Food Sales | High Percentage of Income from Food Sales | |||
|---|---|---|---|---|
| Intertemporal | Two Phase | Intertemporal | Two Phase | |
| Risk perception | −0.742 ** | −0.318 ** | −0.754 | −0.299 * |
| (0.304) | (0.147) | (0.672) | (0.153) | |
| Control variable | Control | Control | ||
| Region | Control | Control | ||
| Observations | 645 | 743 | ||
| Wald chi2 | 2105.14 | 1721.52 | ||
| Prob > chi2 | 0.0000 | 0.0000 | ||
| Pseudo R2 | 0.0863 | 0.1207 | ||
| (1) | (2) | (3) | (4) | |||||
|---|---|---|---|---|---|---|---|---|
| Coef. | RRR | Coef. | RRR | Coef. | RRR | Coef. | RRR | |
| Risk perception | −6.776 ** | 0.001 | −2.071 *** | 0.126 | −3.820 *** | 0.022 | 0.374 | 1.454 |
| (3.209) | (0.737) | (1.434) | (0.438) | |||||
| Risk preference | −1.476 * | 0.228 | −0.832 ** | 0.435 | −4.872 *** | 0.008 | 0.677 | 1.968 |
| (0.837) | (0.378) | (1.865) | (0.731) | |||||
| Interaction term | —— | —— | —— | —— | 1.172 ** | 3.228 | −0.269 | 0.764 |
| —— | —— | —— | —— | (0.531) | (0.171) | |||
| Controls | Control | Control | Control | Control | ||||
| Region | Control | Control | Control | Control | ||||
| Observations | 1388 | 1388 | ||||||
| Wald chi2 | 740.40 | 241.22 | ||||||
| Prob > chi2 | 0.0000 | 0.0000 | ||||||
Disclaimer/Publisher’s Note: The statements, opinions and data contained in all publications are solely those of the individual author(s) and contributor(s) and not of MDPI and/or the editor(s). MDPI and/or the editor(s) disclaim responsibility for any injury to people or property resulting from any ideas, methods, instructions or products referred to in the content. |
© 2024 by the authors. Licensee MDPI, Basel, Switzerland. This article is an open access article distributed under the terms and conditions of the Creative Commons Attribution (CC BY) license (https://creativecommons.org/licenses/by/4.0/).
Share and Cite
Tian, T.; Zhao, X. Risk Perception, Risk Preference, and Timing of Food Sales: New Insights into Farmers’ Negativity in China. Foods 2024, 13, 2243. https://doi.org/10.3390/foods13142243
Tian T, Zhao X. Risk Perception, Risk Preference, and Timing of Food Sales: New Insights into Farmers’ Negativity in China. Foods. 2024; 13(14):2243. https://doi.org/10.3390/foods13142243
Chicago/Turabian StyleTian, Tan, and Xia Zhao. 2024. "Risk Perception, Risk Preference, and Timing of Food Sales: New Insights into Farmers’ Negativity in China" Foods 13, no. 14: 2243. https://doi.org/10.3390/foods13142243
APA StyleTian, T., & Zhao, X. (2024). Risk Perception, Risk Preference, and Timing of Food Sales: New Insights into Farmers’ Negativity in China. Foods, 13(14), 2243. https://doi.org/10.3390/foods13142243