
Influence of EGCG (Epigallocatechin Gallate) on Physicochemical–Rheological Properties of Surimi Gel and Mechanism Based on Molecular Docking

Abstract
:1. Introduction
2. Materials and Methods
2.1. Materials
2.2. Preparation of Surimi Gel
2.3. Determination of Surimi Gel Texture
2.4. Determination of WHC of Surimi Gels
2.5. Rheological Measurement
2.6. Low-Field Nuclear Magnetic Resonance (LF-NMR)
2.7. Determination of Chemical Interaction
2.8. Fourier Transform Infrared Spectroscopy (FT-IR)
2.9. Scanning Electron Microscopy (SEM)
2.10. Homology Modeling of the SCMHC
2.11. Molecular Docking of EGCG and SCMHC
2.12. Statistical Analysis
3. Results
3.1. TPA and Gel Strength of Surimi Gels
3.2. Water-Holding Capacity (WHC) of Surimi Gels
3.3. Rheological Properties
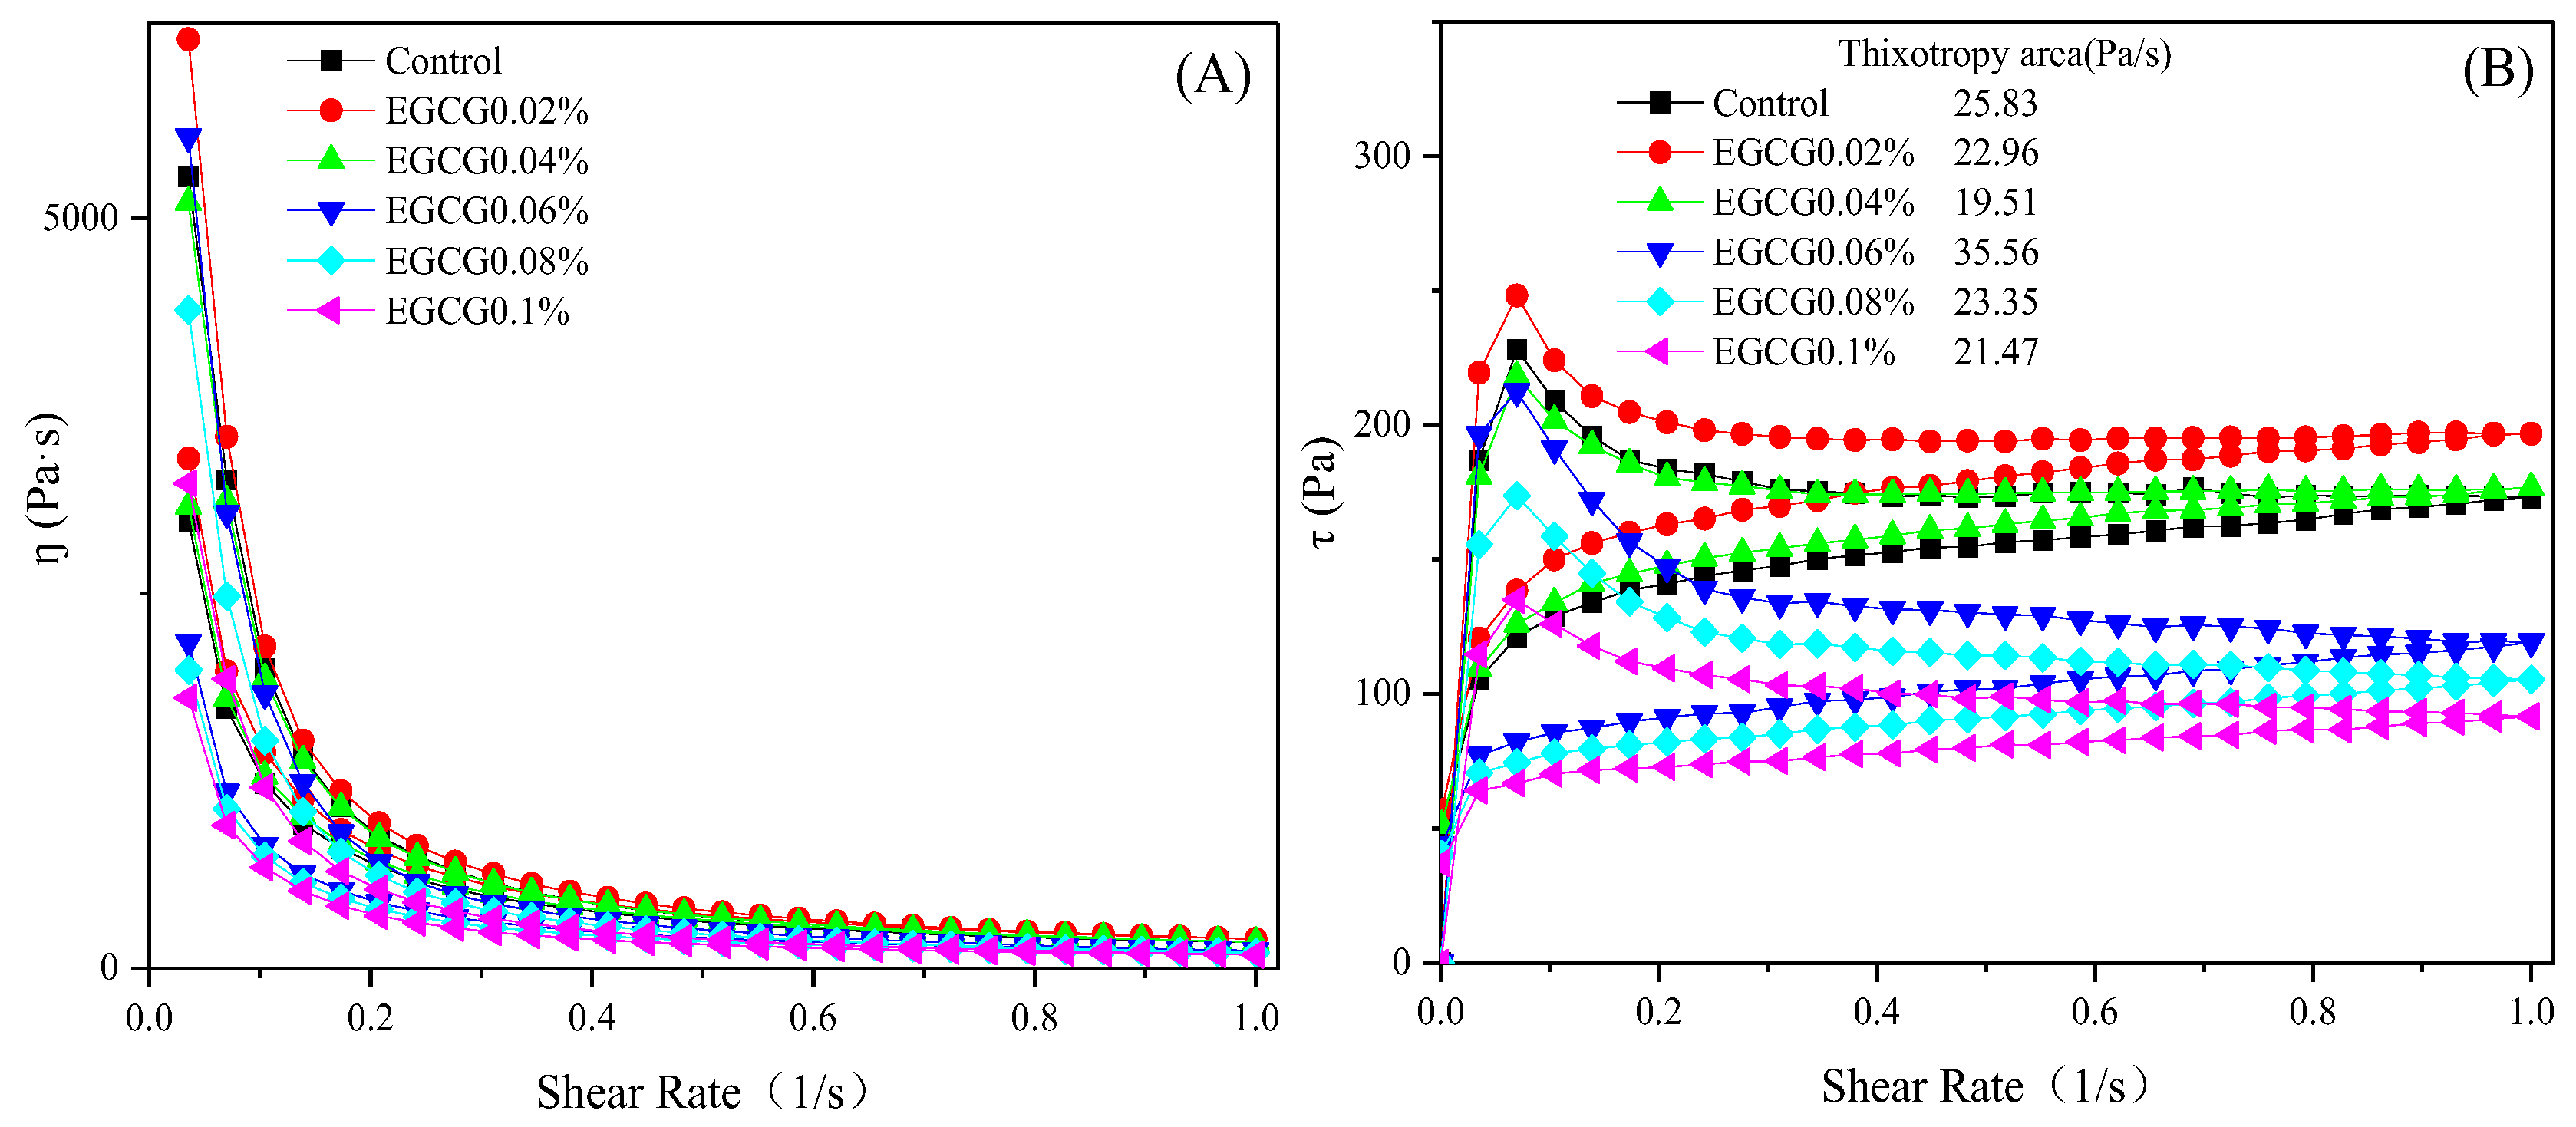
3.3.1. Static Rheological Properties
3.3.2. Dynamic Rheological Properties
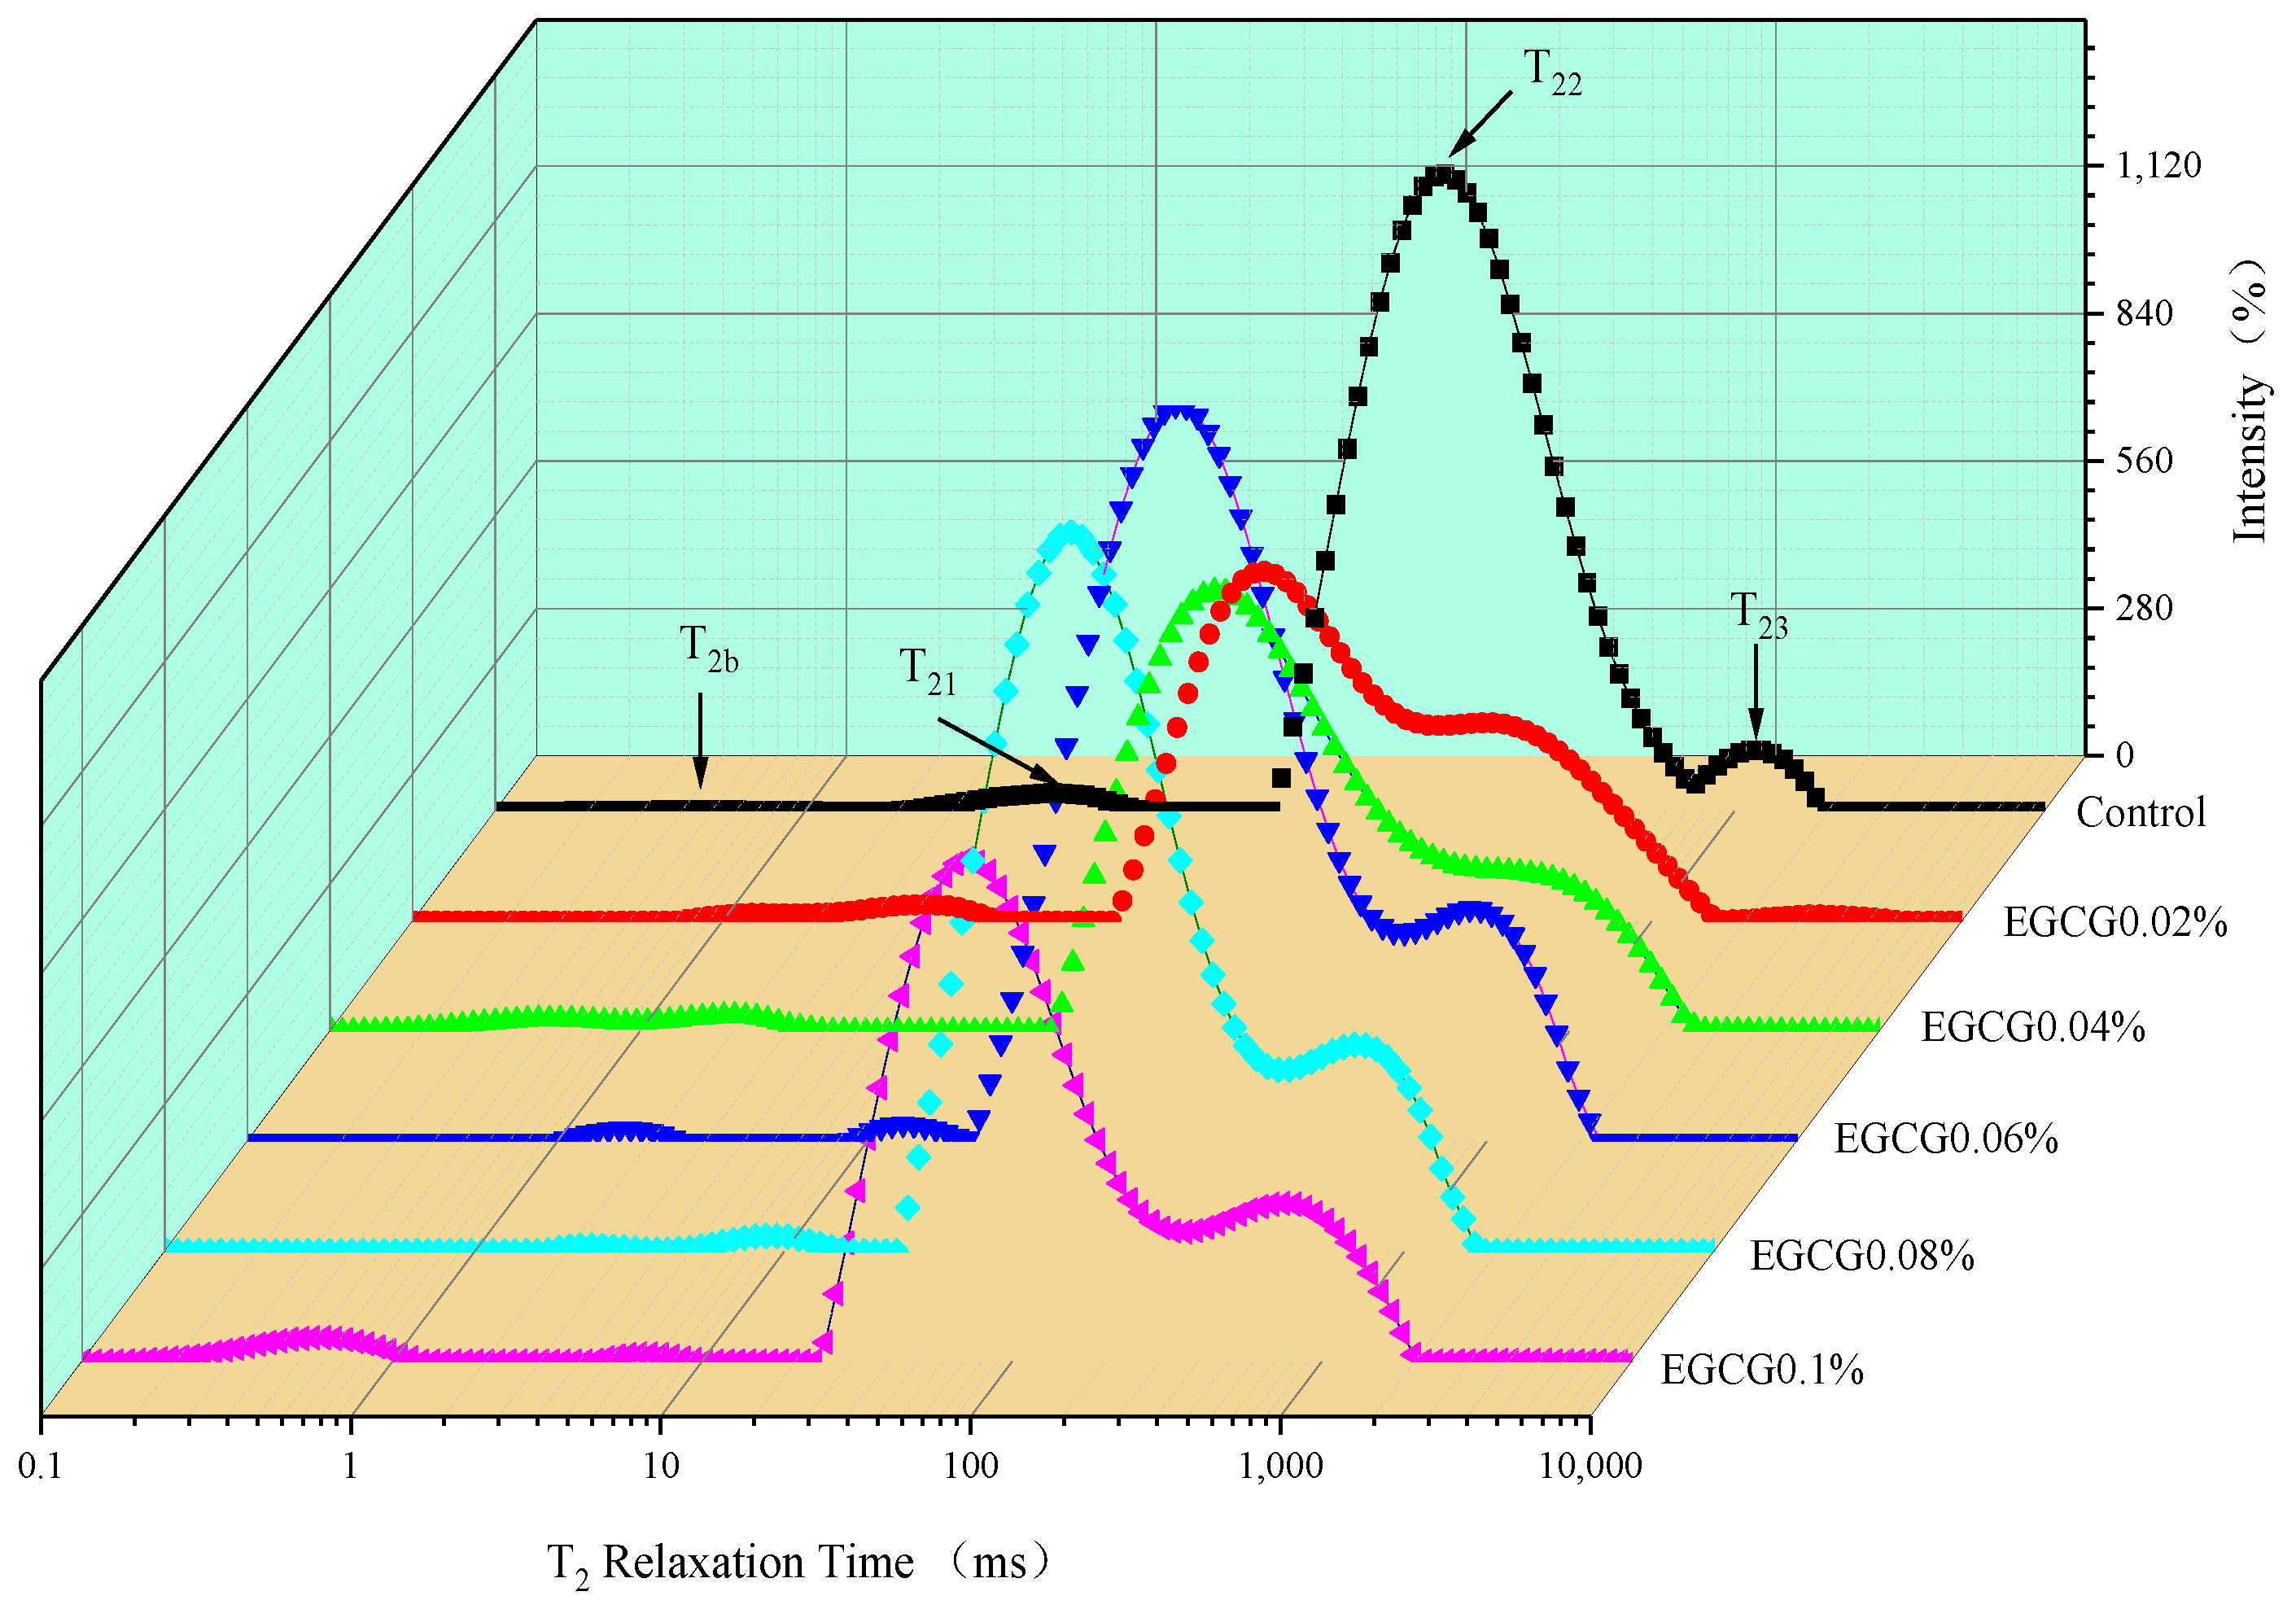
3.4. Moisture Mobility of Surimi Gels
3.5. Determination of Chemical Interaction
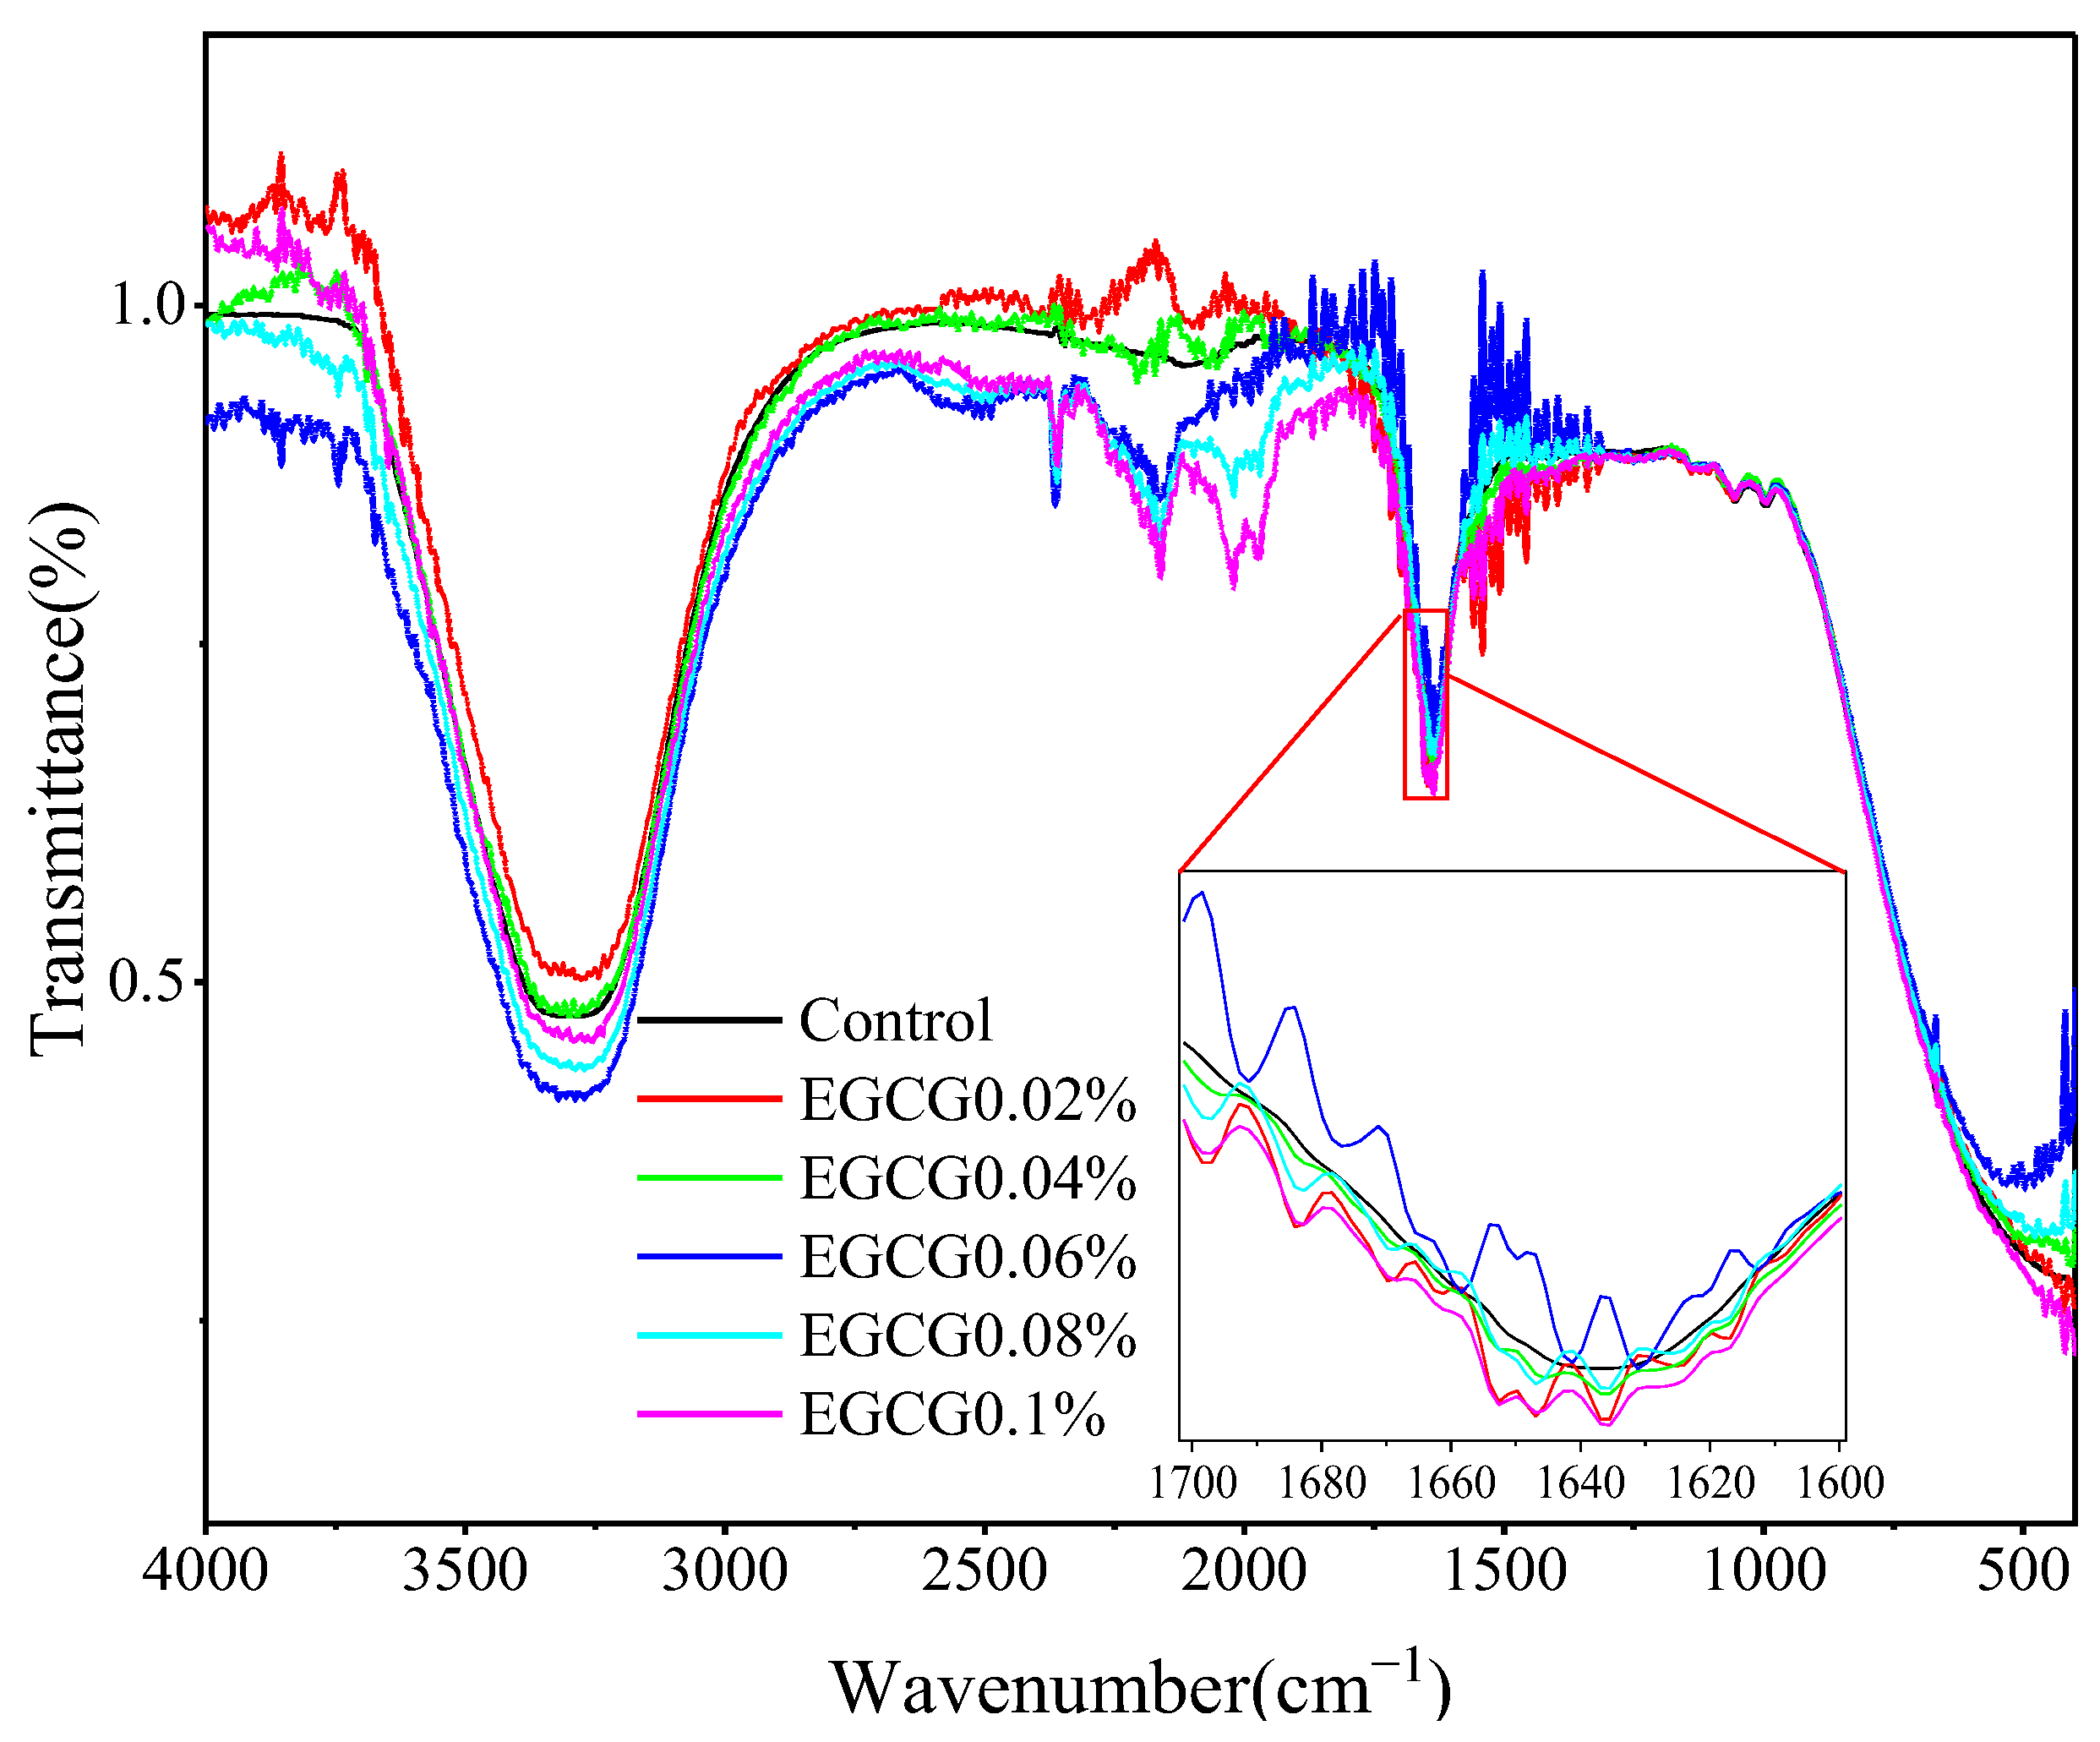
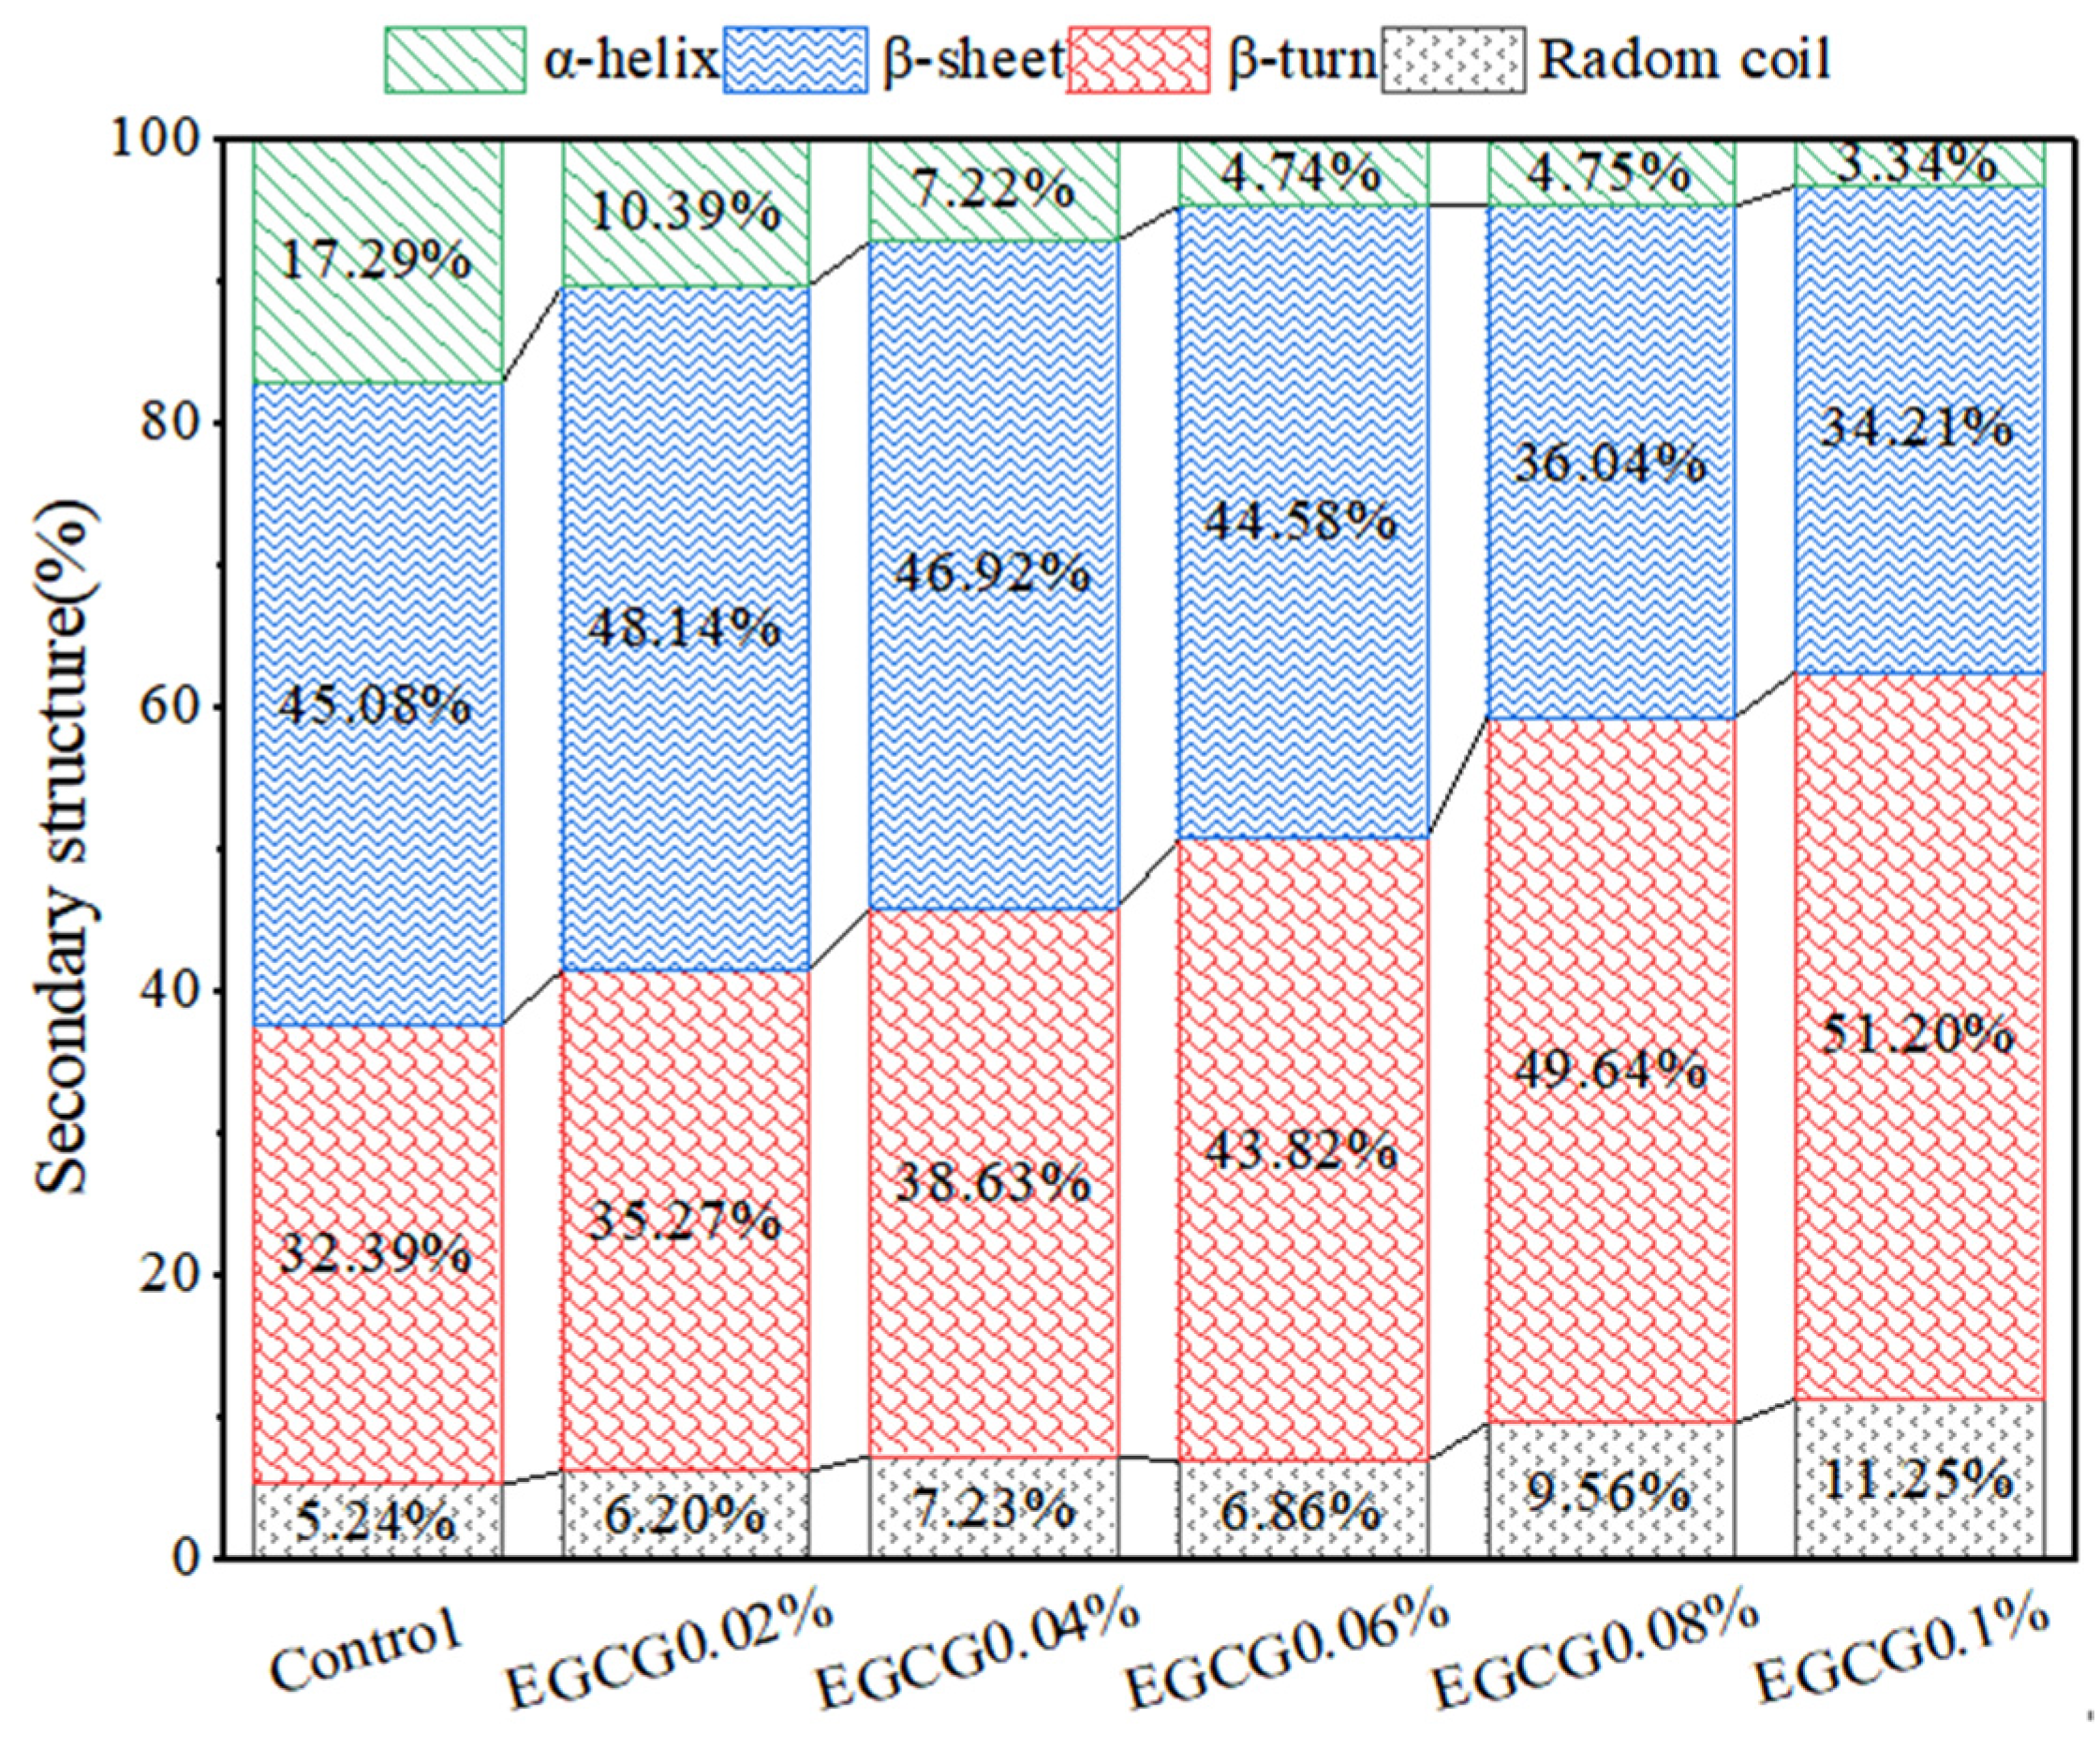
3.6. FT-IR Analysis
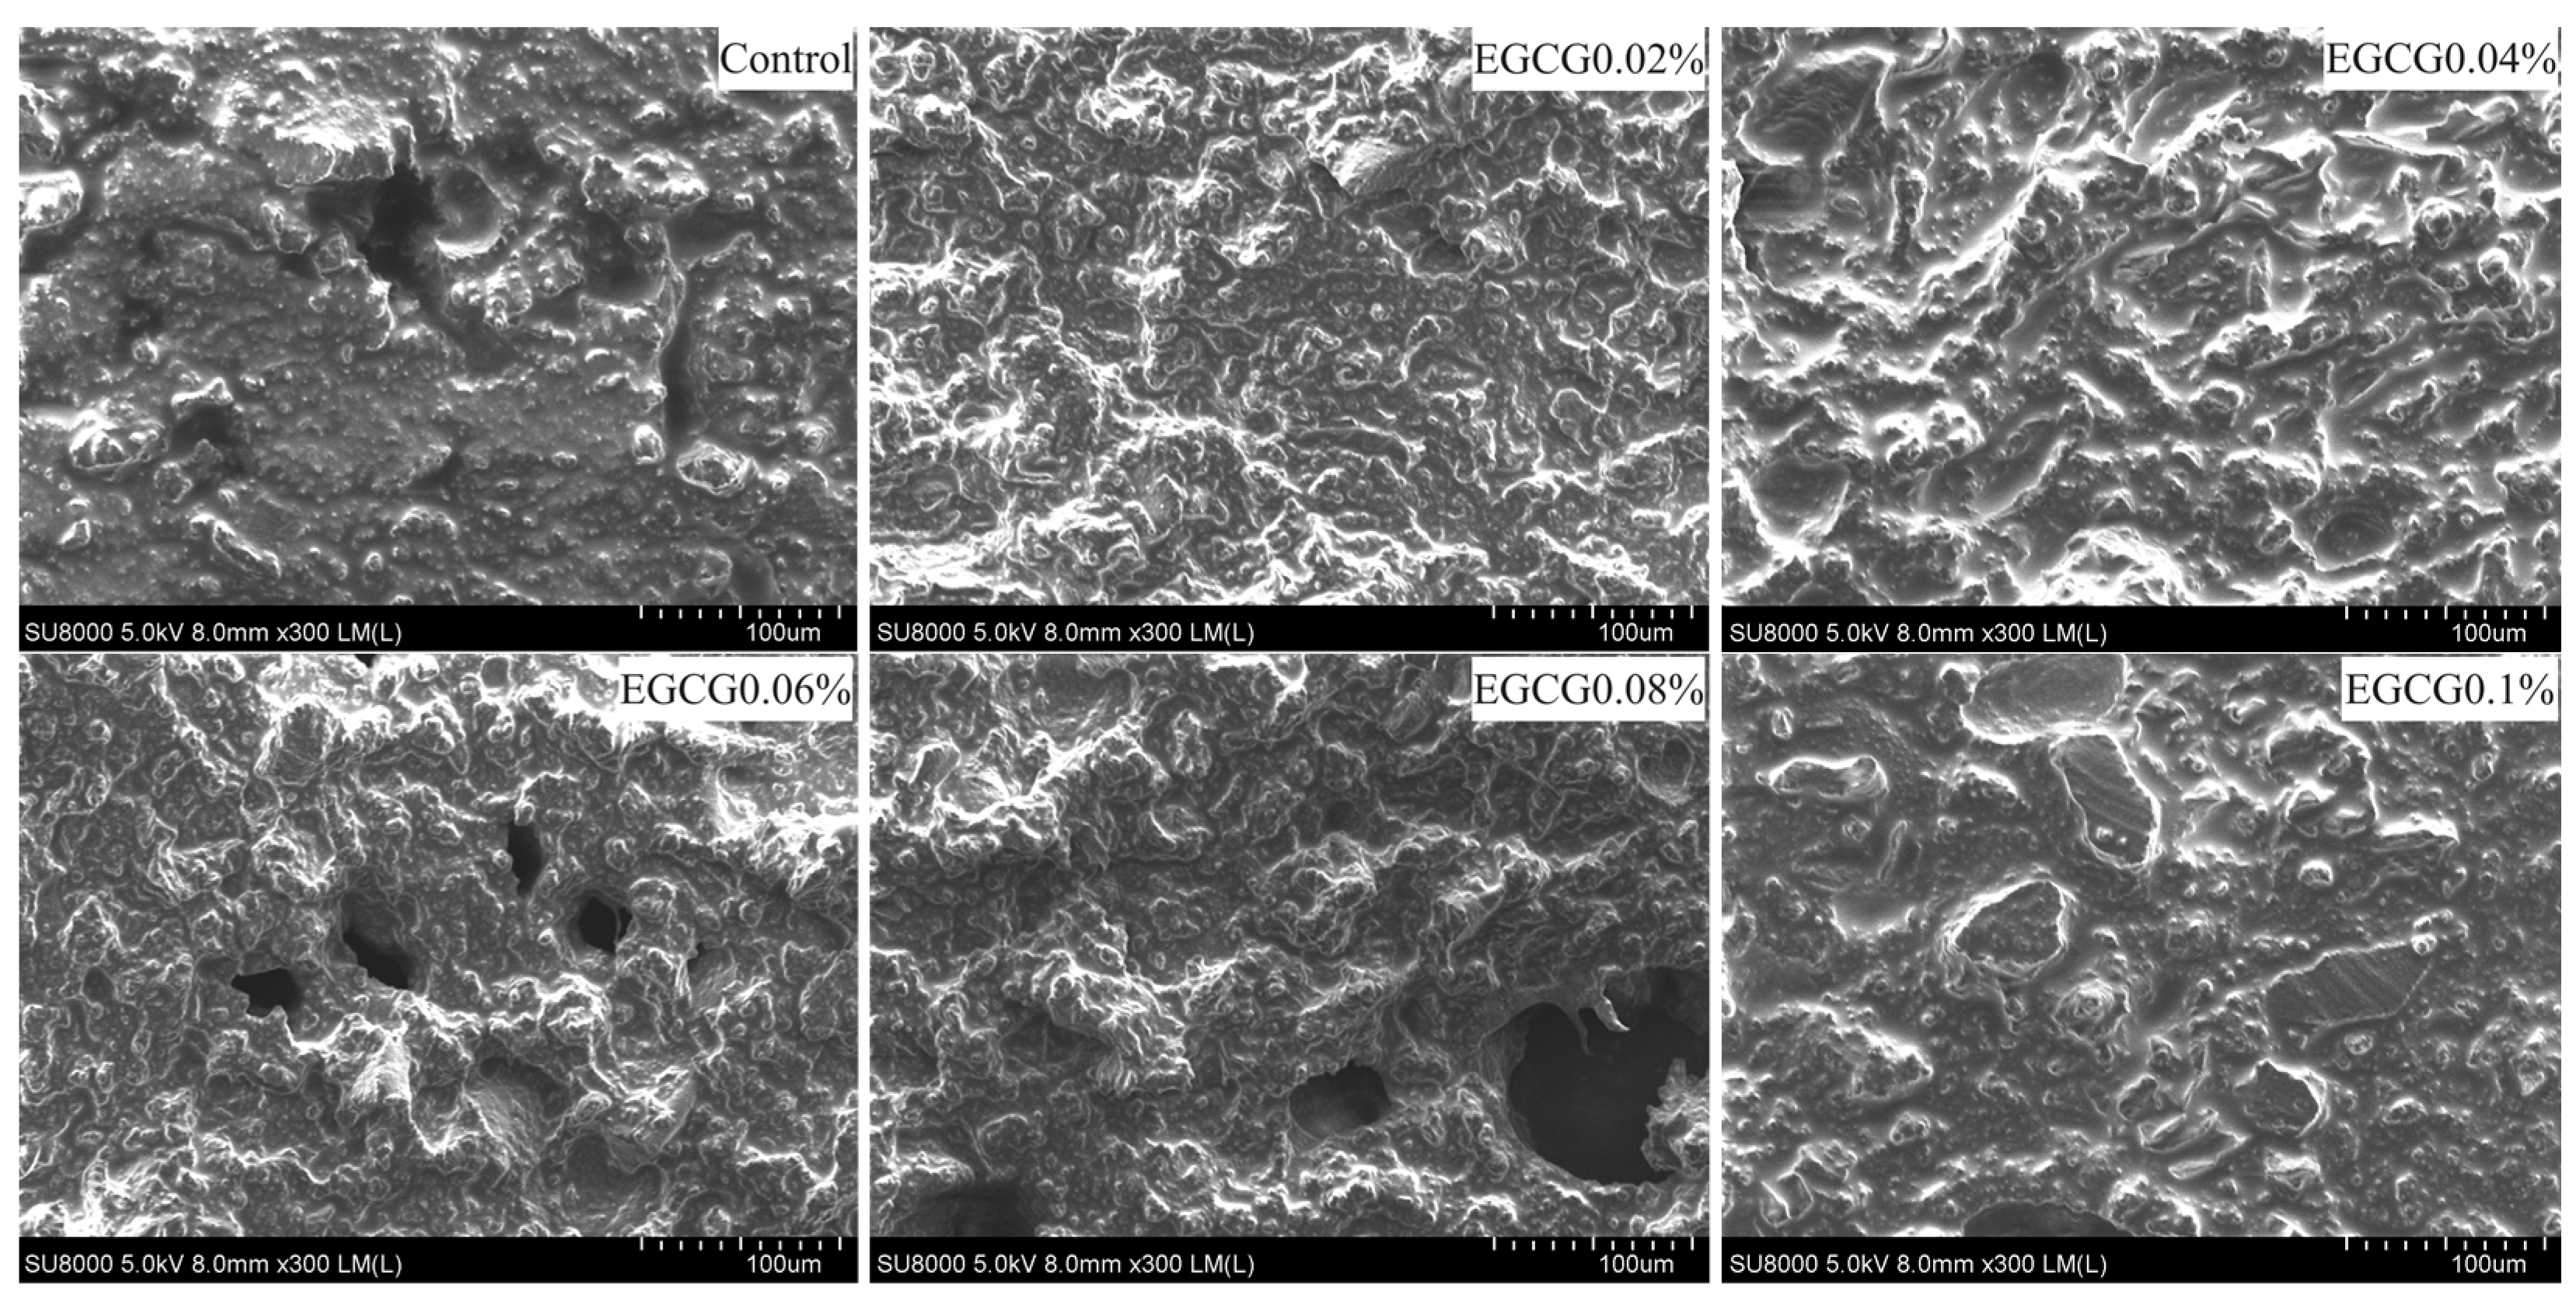
3.7. Microstructure
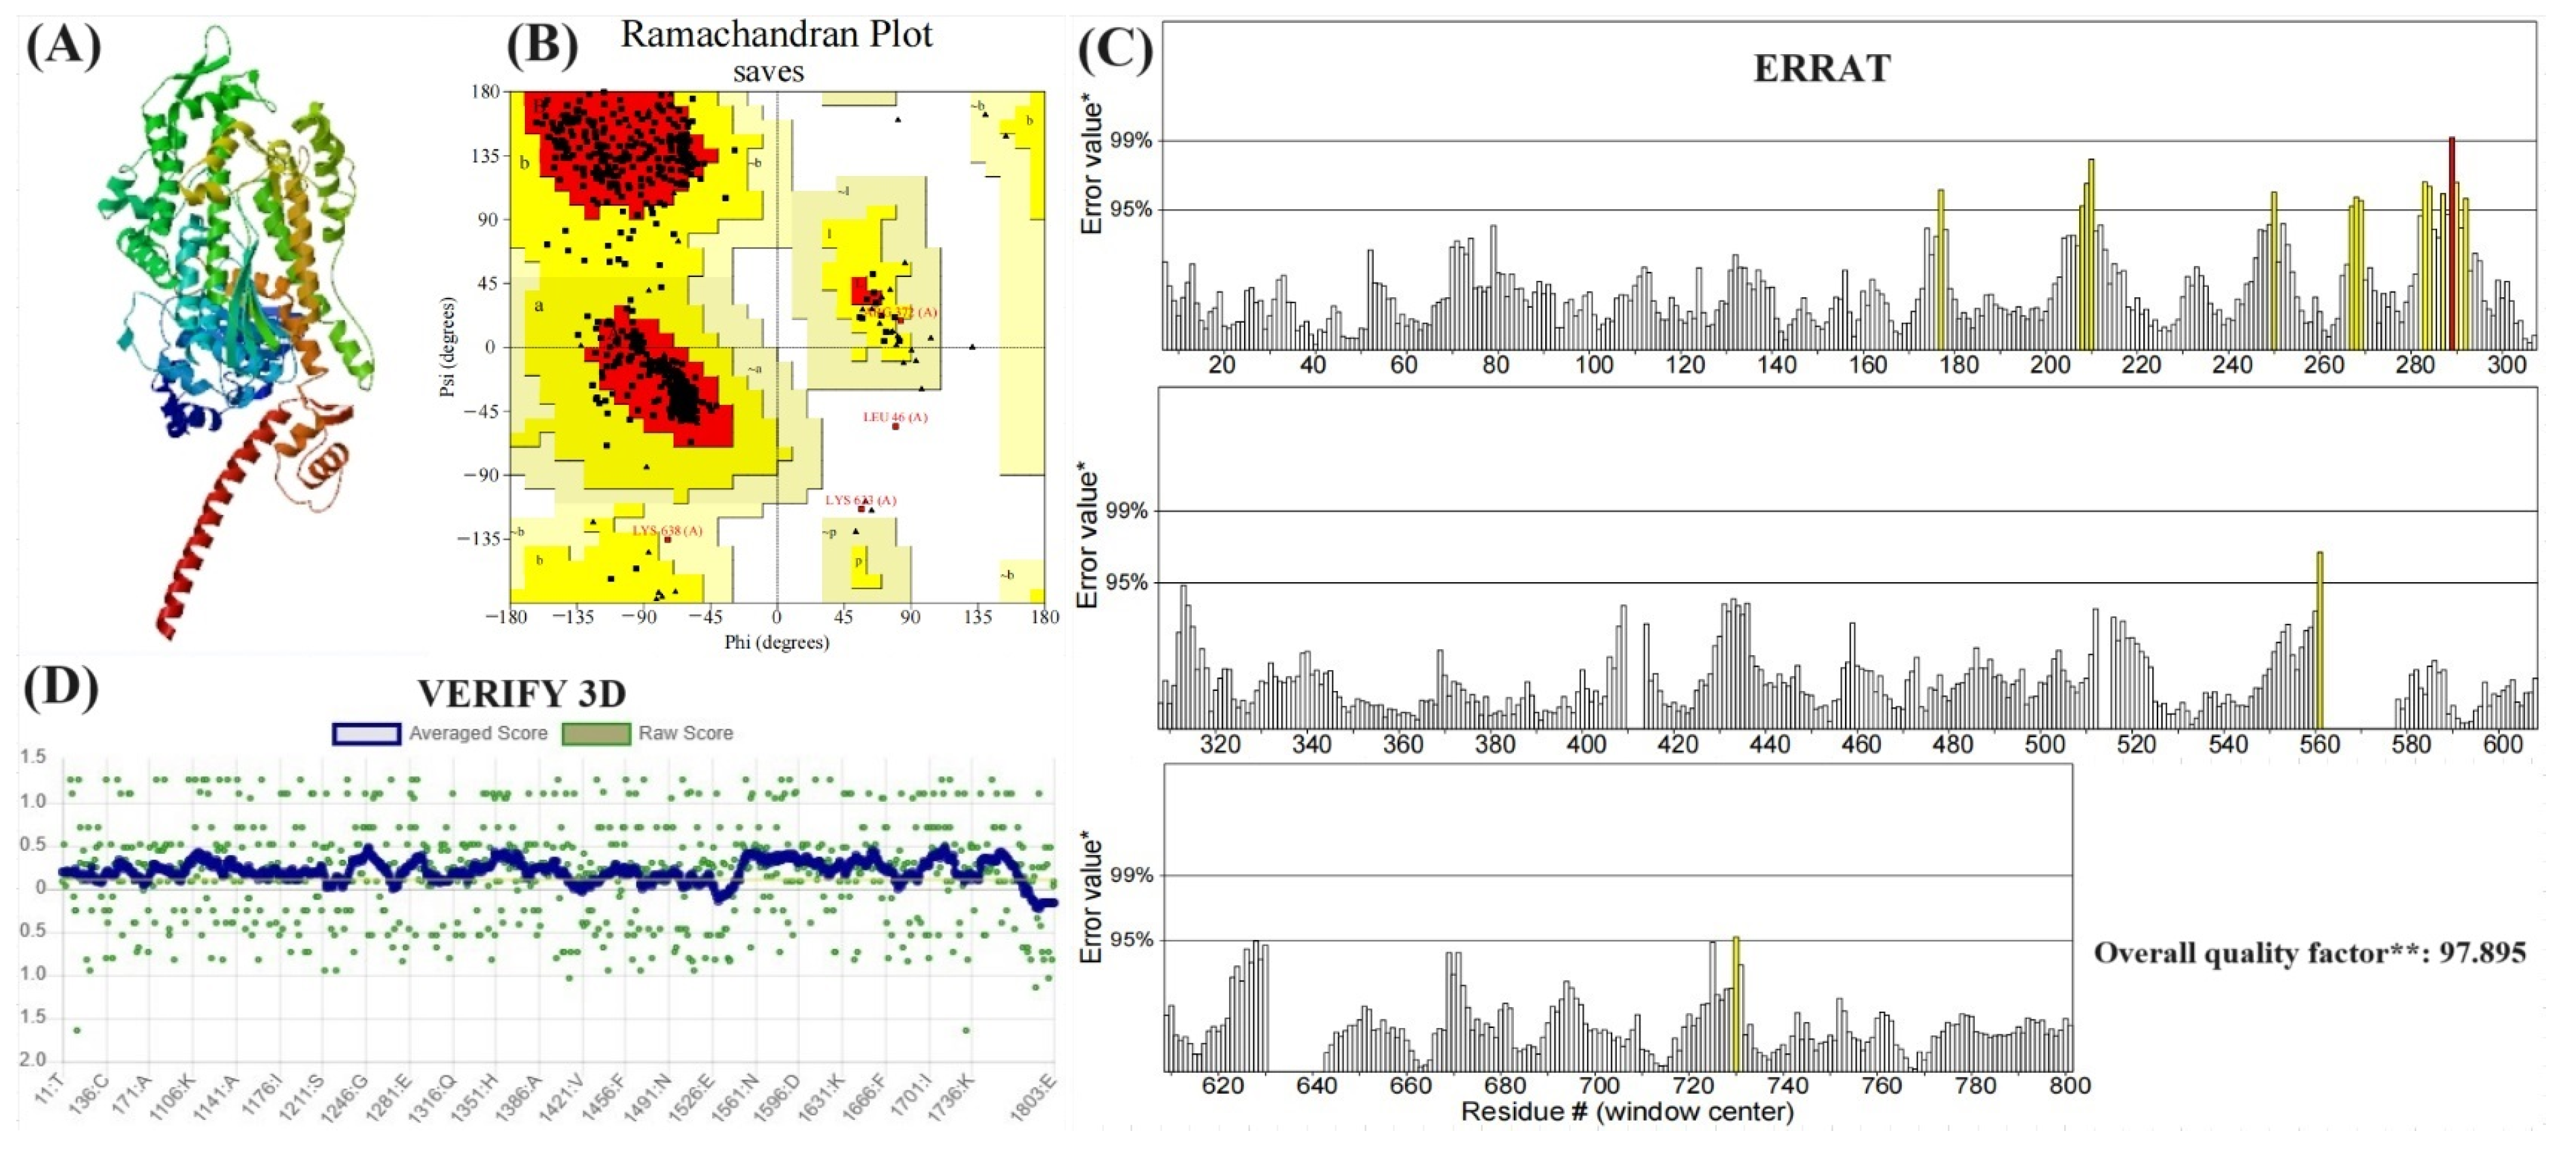
3.8. Evaluation of Modeling Results
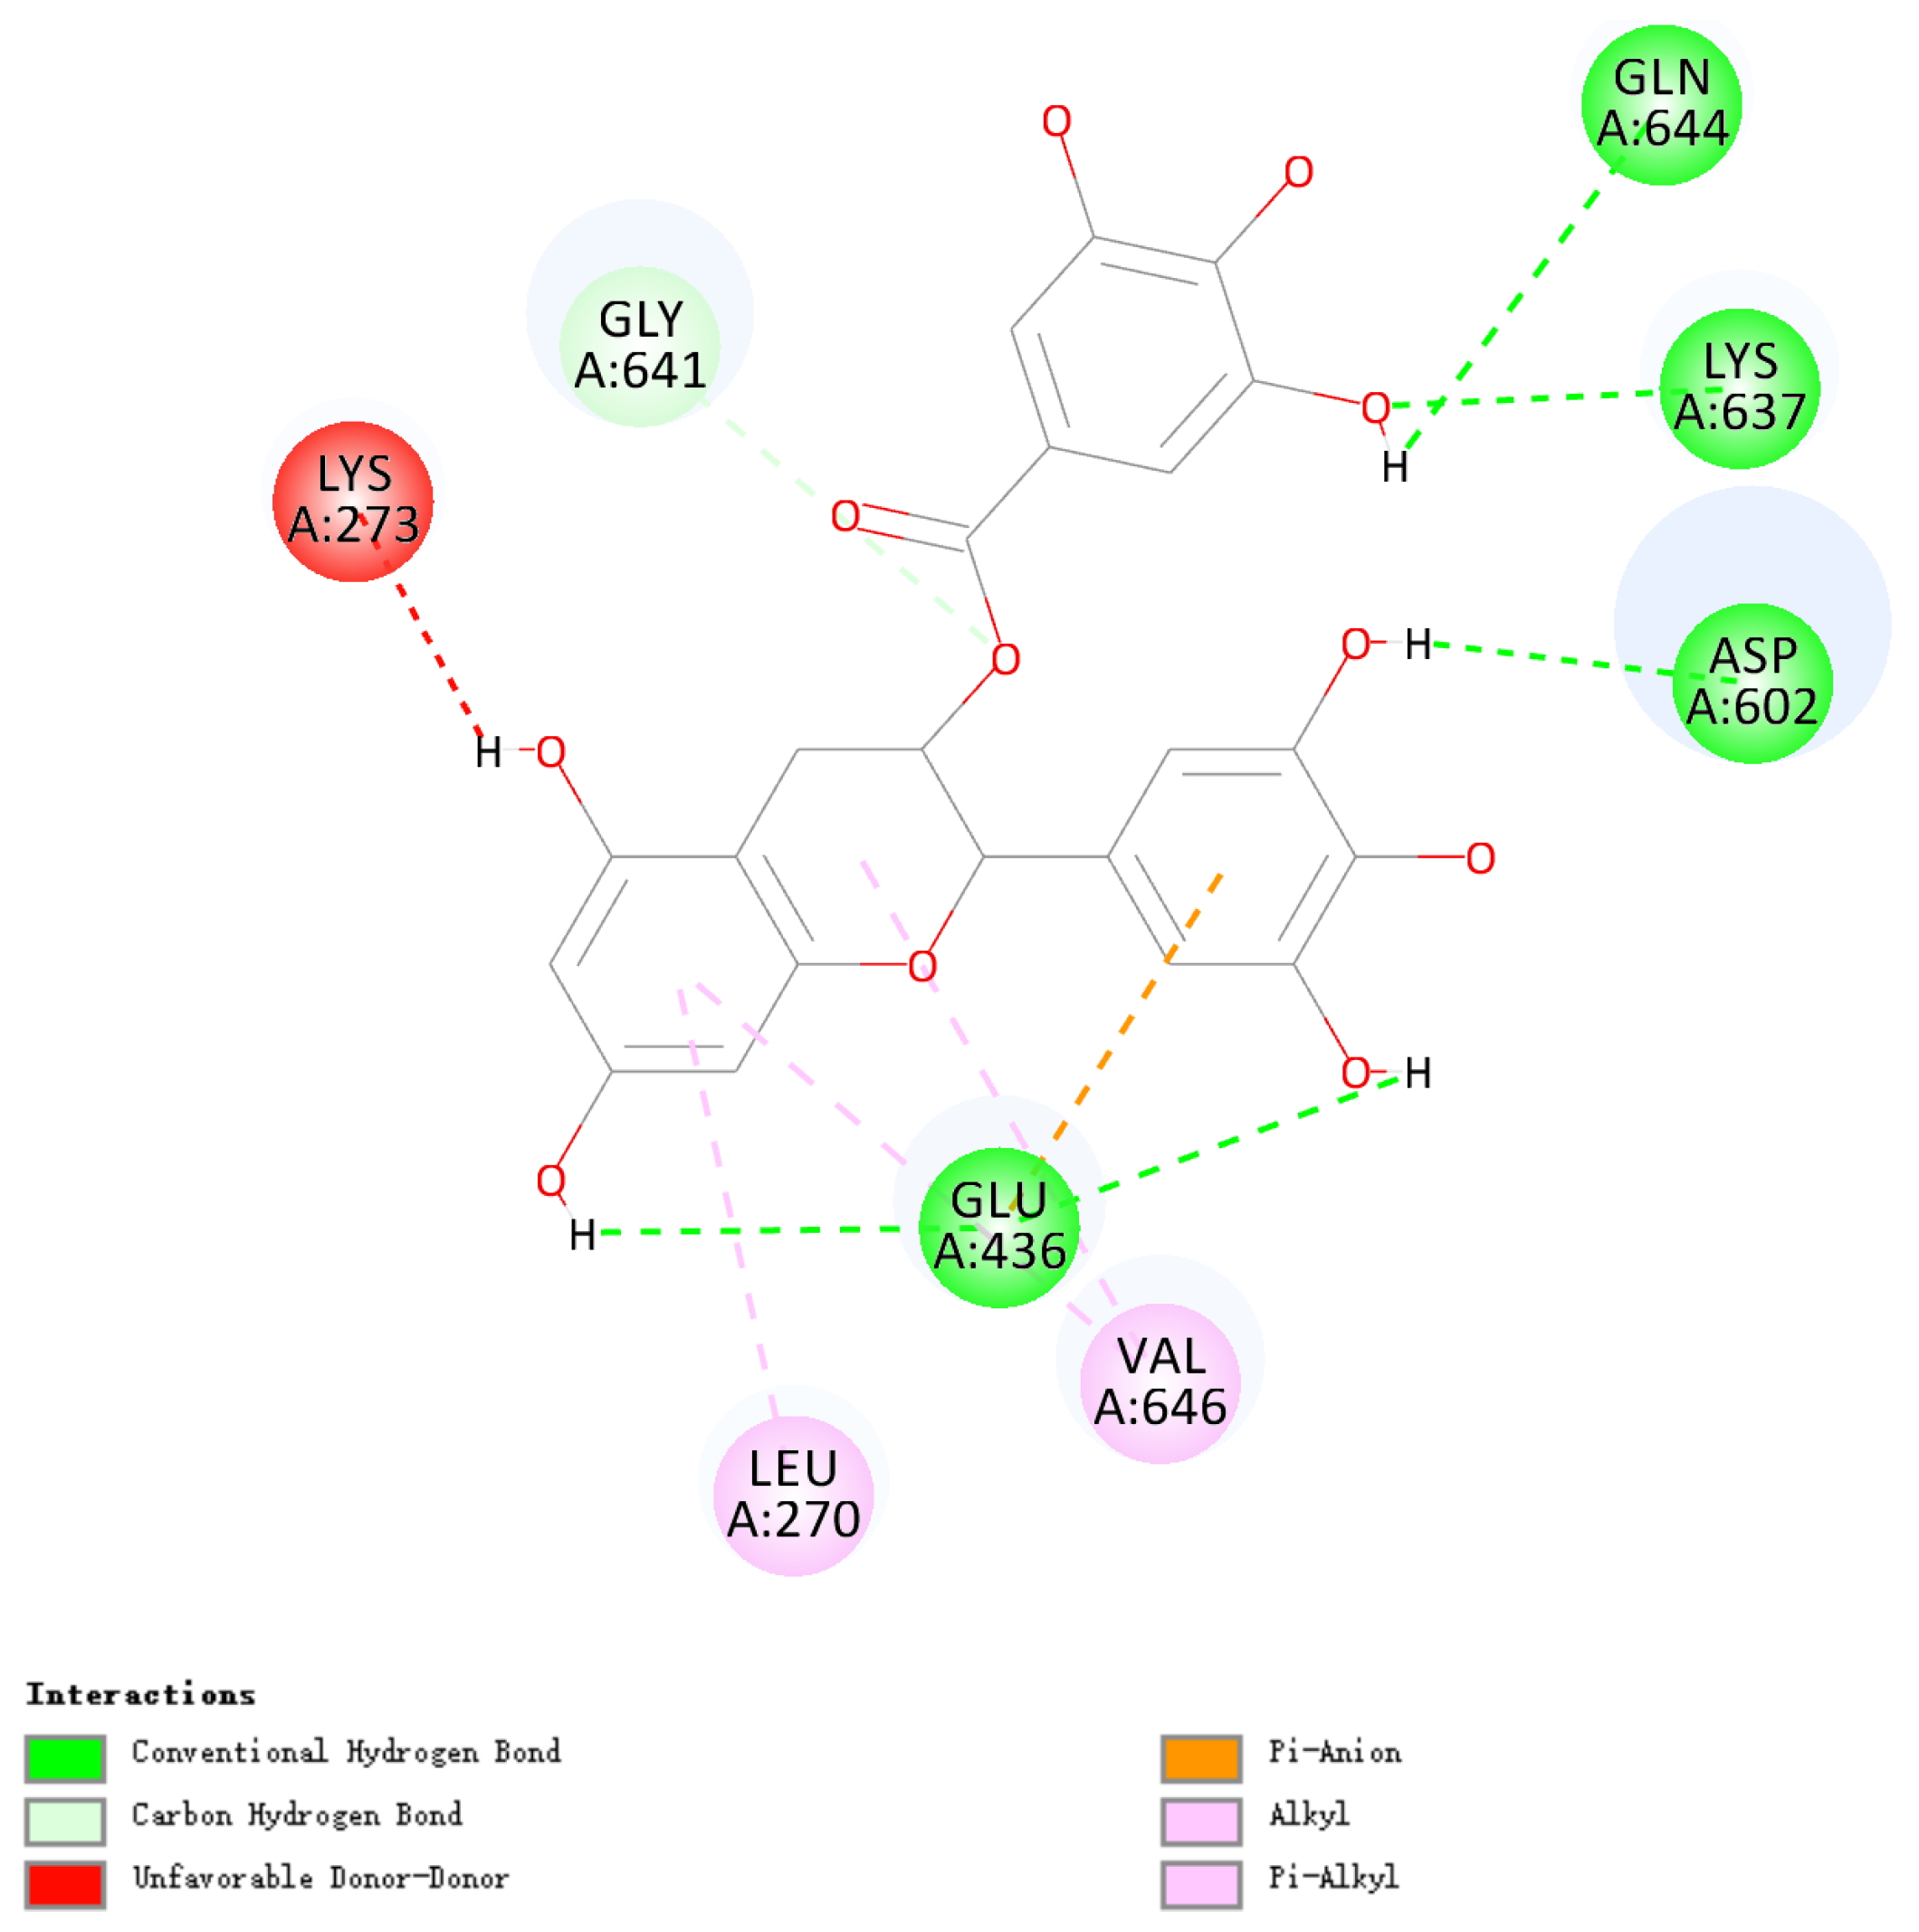
3.9. Molecular Docking of EGCG and SCMHC
4. Conclusions
Author Contributions
Funding
Institutional Review Board Statement
Informed Consent Statement
Data Availability Statement
Conflicts of Interest
References
- Buda, U.; Priyadarshini, M.B.; Majumdar, R.K.; Mahanand, S.S.; Patel, A.B.; Mehta, N.K. Quality characteristics of fortified silver carp surimi with soluble dietary fiber: Effect of apple pectin and konjac glucomannan. Int. J. Biol. Macromol. 2021, 175, 123–130. [Google Scholar] [CrossRef] [PubMed]
- Li, J.L.; Munir, S.; Yu, X.Y.; Yin, T.; You, J.; Liu, R.; Xiong, S.B.; Yang, H. Double-crosslinked effect of TGase and EGCG on myofibrillar proteins gel based on physicochemical properties and molecular docking. Food Chem. 2020, 345, 128655. [Google Scholar] [CrossRef]
- Alipour, H.J.; Rezaei, M.; Shabanpour, B.; Tabarsa, M. Effects of sulfated polysaccharides from green alga Ulva intestinalis on physicochemical properties and microstructure of silver carp surimi. Food Hydrocoll. 2018, 74, 87–96. [Google Scholar] [CrossRef]
- Takeuchi, T. Progress on larval and juvenile nutrition to improve the quality and health of seawater fish: A review. Fish. Sci. 2014, 80, 389–403. [Google Scholar] [CrossRef]
- Balange, A.; Benjakul, S. Enhancement of gel strength of bigeye snapper (Priacanthus tayenus) surimi using oxidised phenolic compounds. Food Chem. 2009, 113, 61–70. [Google Scholar] [CrossRef]
- Arsyad, M.A.; Akazawa, T.; Ogawa, M. Effects of olive leaf powder on mechanical properties of heat-induced surimi gel. J. Aquat. Food Prod. Technol. 2018, 28, 2–13. [Google Scholar] [CrossRef]
- Jongberg, S.; Terkelsen, L.D.S.; Miklos, R.; Lund, M.N. Green tea extract impairs meat emulsion properties by disturbing protein disulfide cross-linking. Meat Sci. 2015, 100, 2–9. [Google Scholar] [CrossRef] [PubMed]
- Jia, N.; Wang, L.T.; Shao, J.H.; Liu, D.Y.; Kong, B.H. Changes in the structural and gel properties of pork myofibrillar protein induced by catechin modification. Meat Sci. 2017, 127, 45–50. [Google Scholar] [CrossRef] [PubMed]
- Lai, W.F.; Baig, M.M.F.A.; Wong, W.T.; Bao, T.Z. Epigallocatechin-3-gallate in functional food development: From concept to reality. Trends Food Sci. Technol. 2020, 102, 271–279. [Google Scholar] [CrossRef]
- Tian, Z.H.; Jiang, X.; Xiao, N.Y.; Zhang, Q.; Shi, W.Z.; Guo, Q.Y. Assessing the gel quality and storage properties of hypophythalmalmichthys molitrix surimi gel prepared with epigallocatechin gallate subject to multiple freeze-thaw cycles. Foods 2022, 11, 1612. [Google Scholar] [CrossRef]
- Yuan, Y.; Zhao, Y.Q.; Yang, X.Q.; Li, L.H.; Wu, Y.Y.; Wei, Y.; Cen, J.W. Cryoprotective mechanism of epigallocatechin gallate on frozen Nile tilapia (Orechromis niloticus) surimi. Food Sci. 2019, 40, 79–85. [Google Scholar] [CrossRef]
- Utrera, M.; Estévez, M. Analysis of tryptophan oxidation by fluorescence spectroscopy: Effect of metal-catalyzed oxidation and selected phenolic compounds. Food Chem. 2012, 135, 88–93. [Google Scholar] [CrossRef]
- Liang, F.; Zhu, Y.J.; Ye, T.; Jiang, S.T.; Lin, L.; Lu, J.F. Effect of ultrasound assisted treatment and microwave combined with water bath heating on gel properties of surimi-crabmeat mixed gels. LWT—Food Sci. Technol. 2020, 133, 110098. [Google Scholar] [CrossRef]
- Yan, B.W.; Jiao, X.D.; Zhu, H.P.; Wang, Q.; Huang, J.L.; Zhao, J.X.; Cao, H.W.; Zhou, W.G.; Zhang, W.H.; Ye, W.J.; et al. Chemical interactions involved in microwave heat-induced surimi gel fortified with fish oil and its formation mechanism. Food Hydrocoll. 2020, 105, 105779. [Google Scholar] [CrossRef]
- Alakhrash, F.; Anyanwu, U.; Tahergorabi, R. Physicochemical properties of Alaska pollock (Theragra chalcograma) surimi gels with oat bran. LWT—Food Sci. Technol. 2016, 66, 41–47. [Google Scholar] [CrossRef]
- Tang, S.W.; Feng, G.X.; Gao, R.C.; Ren, J.Y.; Zhou, X.D.; Wang, H.Y.; Xu, H.; Zhao, Y.H.; Zeng, M.Y. Thermal Gel Degradation (Modori) in Sturgeon (Acipenseridae) Surimi Gels. J. Food Qual. 2019, 84, 3601–3607. [Google Scholar] [CrossRef]
- Jia, N.; Lin, S.W.; Wang, L.T.; Liu, D.Y. Effects of changes in sulfhydryl content and surface hydrophobicity of myofibrillar protein induced by gallic acid on its gel properties. Food Sci. 2020, 41, 1–7. [Google Scholar] [CrossRef]
- Cao, Y.G.; Xiong, Y.L. Chlorogenic acid-mediated gel formation of oxidatively stressed myofibrillar protein. Food Chem. 2015, 180, 235–243. [Google Scholar] [CrossRef]
- Sakamoto, H.; Kumazawa, Y.; Toiguchi, S.; Seguro, K.; Soeda, K.; Motoki, M. Gel strength enhancement by addition of microbial transglutaminase during onshore surimi manufacture. J. Food Sci. 2006, 60, 300–304. [Google Scholar] [CrossRef]
- Tang, C.B.; Zhang, W.G.; Zou, Y.F.; Xing, L.J.; Zheng, H.B.; Xu, X.L.; Zhou, G.H. Influence of RosAprotein adducts formation on myofibrillar protein gelation properties under oxidative stress. Food Hydrocoll. 2017, 67, 197–205. [Google Scholar] [CrossRef]
- Sano, T.; Noguchi, S.F.; Marsumoto, J.J.; Tsuchiya, T. Thermal gelation characteristics of myosin subfragments. J. Food Sci. 1990, 55, 55–58. [Google Scholar] [CrossRef]
- Salehi, F.; Kashaninejad, M. Effect of different drying methods on rheological and textural properties of balangu seed gum. Dry. Technol. 2014, 32, 720–727. [Google Scholar] [CrossRef]
- Gil, B.; Yoo, B. Effect of salt addition on gelatinization and rheological properties of sweet potato starch-xanthan gum mixture. Starch Stärke 2014, 67, 117–123. [Google Scholar] [CrossRef]
- Liu, R.; Zhao, S.M.; Xiong, S.B.; Xie, B.J.; Liu, H.M. Studies on fish and pork paste gelation by dynamic rheology and circular dichroism. J. Food Sci. 2007, 72, E399–E403. [Google Scholar] [CrossRef] [PubMed]
- Zhou, X.X.; Lin, H.H.; Zhu, S.C.; Xu, X.; Lyu, F.; Ding, Y.T. Textural, rheological and chemical properties of surimi nutritionally-enhanced with lecithin. LWT—Food Sci. Technol. 2020, 122, 108984. [Google Scholar] [CrossRef]
- Sun, F.Y.; Huang, Q.L.; Hu, T.; Xiong, S.B.; Zhao, S.M. Effects and mechanism of modified starches on the gel properties of myofibrillar protein from grass carp. Int. J. Biol. Macromol. 2014, 64, 17–24. [Google Scholar] [CrossRef] [PubMed]
- Fan, M.C.; Huang, Q.L.; Zhong, S.Y.; Li, X.X.; Xiong, S.B.; Xie, J.; Yin, T.; Zhang, B.J.; Zhao, S.M. Gel properties of myofibrillar protein as affected by gelatinization and retrogradation behaviors of modified starches with different crosslinking and acetylation degrees. Food Hydrocoll. 2019, 96, 604–616. [Google Scholar] [CrossRef]
- Liu, R.; Zhao, S.M.; Xiong, S.B.; Xie, B.J.; Qin, L.H. Role of secondary structures in the gelation of porcine myosin at different pH values. Meat Sci. 2008, 80, 632–639. [Google Scholar] [CrossRef]
- Cao, Y.G.; True, A.D.; Chen, J.; Xiong, Y.L. Dual role (anti-and pro-oxidant) of gallic acid in mediating myofibrillar protein gelation and gel in vitro digestion. J. Agric. Food Chem. 2016, 64, 3054–3061. [Google Scholar] [CrossRef]
- Jiao, X.D.; Cao, H.W.; Fan, D.M.; Huang, J.L.; Zhao, J.X.; Yan, B.W.; Zhou, W.G.; Zhang, W.H.; Ye, W.J.; Zhang, H. Effects of fish oil incorporation on the gelling properties of silver carp surimi gel subjected to microwave heating combined with conduction heating treatment. Food Hydrocoll. 2019, 94, 164–173. [Google Scholar] [CrossRef]
- Shaarani, S.M.; Nott, K.P.; Hall, L.D. Combination of NMR and MRI quantitation of moisture and structure changes for convection cooking of fresh chicken meat. Meat Sci. 2006, 72, 398–403. [Google Scholar] [CrossRef] [PubMed]
- Hinrichs, R.; Götz, J.; Noll, M.; Wolfschoon, A.; Eibel, H.; Weisser, H. Characterisation of different treated whey protein concentrates by means of low-resolution nuclear magnetic resonance. Int. Dairy J. 2004, 14, 817–827. [Google Scholar] [CrossRef]
- Gravelle, A.J.; Marangoni, A.G.; Barbut, S. Insight into the mechanism of myofibrillar protein gel stability: Influencing texture and microstructure using a model hydrophilic filler. Food Hydrocoll. 2016, 60, 415–424. [Google Scholar] [CrossRef]
- Kudre, T.; Benjakul, S.; Kishimura, H. Effects of protein isolates from black bean and mungbean on proteolysis and gel properties of surimi from sardine (Sardinella albella). LWT—Food Sci. Technol. 2013, 50, 511–518. [Google Scholar] [CrossRef]
- Tokifuji, A.; Matsushima, Y.; Hachisuka, K.; Yoshioka, K. Texture, sensory and swallowing characteristics of high-pressure-heat-treated pork meat gel as a dysphagia diet. Meat Sci. 2013, 93, 843–848. [Google Scholar] [CrossRef] [PubMed]
- Jongberg, S.; Skov, S.H.; Tørngren, M.A.; Skibsted, L.H.; Lund, M.N. Effect of white grape extract and modified atmosphere packaging on lipid and protein oxidation in chill stored beef patties. Food Chem. 2011, 128, 276–283. [Google Scholar] [CrossRef] [PubMed]
- Li, Y.C.; Shi, D.H.; Zhang, X.Y.; Li, X.H.; Zou, Q.; Yi, S.M. Gallic acid combined with ultrasound treatment improves the gel properties of Lateolabrax japonicas myofibrillar protein. Food Sci. 2022, 43, 82–91. [Google Scholar] [CrossRef]
- Goormaghtigh, E.; Ruysschaert, J.M.; Raussens, V. Evaluation of the information content in infrared spectra for protein secondary structure determination. Biophys. J. 2006, 90, 2946–2957. [Google Scholar] [CrossRef] [PubMed]
- Tan, M.T.; Xie, J. Exploring the effect of dehydration on water migrating property and protein changes of large yellow croaker (Pseudosciaena crocea) during frozen storage. Foods 2021, 10, 784. [Google Scholar] [CrossRef]
- Chanphai, P.; Bourassa, P.; Kanakis, C.D.; Tarantilis, P.A.; Polissiou, M.G.; Tajmir-Riahi, H.A. Review on the loading efficacy of dietary tea polyphenols with milk proteins. Food Hydrocoll. 2018, 77, 322–328. [Google Scholar] [CrossRef]
- Zhao, Y.Y.; Zhou, G.H.; Zhang, W.G. Effects of regenerated cellulose fiber on the characteristics of myofibrillar protein gels. Carbohydr. Polym. 2019, 209, 276–281. [Google Scholar] [CrossRef] [PubMed]
- Zhang, L.L.; Zhang, F.X.; Wang, X. Changes of protein secondary structures of pollock surimi gels under high-temperature (100 °C and 120 °C) treatment. J. Food Eng. 2016, 171, 159–163. [Google Scholar] [CrossRef]
- Nagy, K.; Courtet-Compondu, M.-C.; Williamson, G.; Rezzi, S.; Kussmann, M.; Rytz, A. Non-covalent binding of proteins to polyphenols correlates with their amino acid sequence. Food Chem. 2012, 132, 1333–1339. [Google Scholar] [CrossRef] [PubMed]
- Quan, T.H.; Benjakul, S.; Sae-leaw, T.; Balange, A.K.; Maqsood, S. Protein-polyphenol conjugates: Antioxidant property, functionalities and their applications. Trends Food Sci. Technol. 2019, 91, 507–517. [Google Scholar] [CrossRef]


| Rotor Speed (r/s) | Determination Time (s) | Determination of Data Points | |
|---|---|---|---|
| Viscosity | 0.000001–1 | 180 | 30 |
| 1–0.000001 | 180 | 30 | |
| Thixotropy | 0.000001–1 | 180 | 30 |
| 1–0.000001 | 180 | 30 |
| Gels | Gel Strength (g·cm) | Hardness (g) | Cohesiveness (mJ) | Springiness (mm) | Chewiness (mJ) |
|---|---|---|---|---|---|
| Control | 187.61 ± 15.94 c | 268.67 ± 10.26 b | 0.17 ± 0.06 bc | 4.82 ± 0.07 b | 5.27 ± 0.55 b |
| EGCG 0.02% | 406.62 ± 22.79 a | 356.67 ± 10.97 a | 0.43 ± 0.05 a | 5.19 ± 0.11 a | 9.30 ± 0.61 a |
| EGCG 0.04% | 284.81 ± 4.95 b | 283.33 ± 9.29 b | 0.27 ± 0.05 b | 4.57 ± 0.12 b | 4.27 ± 0.25 bc |
| EGCG 0.06% | 167.85 ± 3.04 c | 192.00 ± 8.18 c | 0.13 ± 0.06 c | 4.14 ± 0.14 c | 3.30 ± 0.44 c |
| EGCG 0.08% | 95.81 ± 5.71 d | 134.67 ± 3.51 d | 0.08 ± 0.03 c | 3.47 ± 0.16 d | 1.73 ± 0.25 d |
| EGCG 0.1% | 98.61 ± 4.18 d | 104.67 ± 4.04 e | 0.04 ± 0.01 c | 3.50 ± 0.05 d | 1.43 ± 0.12 d |
| Gels | T2b/ms | T21/ms | T22/ms | T23/ms | P2b | P21 + P22 | P23 |
|---|---|---|---|---|---|---|---|
| Control | 0.647 ± 0.450 a | 3.569 ± 0.479 ab | 32.297 ± 0.849 a | 815.10 ± 5.405 c | 0.113 ± 0.023 d | 96.322 ± 0.072 c | 3.564 ± 0.083 c |
| EGCG 0.02% | 0.623 ± 0.093 a | 1.886 ± 0.032 b | 16.578 ± 2.118 c | 2130.0 ± 267.74 b | 0.556 ± 0.071 cd | 98.958 ± 0.057 a | 0.486 ± 0.119 d |
| EGCG 0.04% | 0.657 ± 0.484 a | 1.219 ± 0.148 b | 22.266 ± 0.935 b | 2863.8 ± 117.260 a | 1.093 ± 0.059 b | 97.781 ± 0.241 b | 1.126 ± 0.057 d |
| EGCG 0.06% | 1.037 ± 0.175 a | 5.821 ± 2.228 a | 23.961 ± 1.658 b | 564.85 ± 22.857 cd | 1.217 ± 0.258 b | 83.786 ± 0.499 d | 14.997 ± 0.564 b |
| EGCG 0.08% | 1.049 ± 0.468 a | 3.331 ± 0.815 ab | 24.129 ± 1.949 b | 431.13 ± 11.035 d | 0.726 ± 0.193 bc | 83.717 ± 0.470 d | 15.556 ± 0.372 b |
| EGCG 0.1% | 0.323 ± 0.227 a | 3.349 ± 0.914 ab | 23.866 ± 1.528 b | 394.59 ± 4.988 d | 2.309 ± 0.303 a | 78.396 ± 0.613 e | 19.295 ± 0.663 a |
Disclaimer/Publisher’s Note: The statements, opinions and data contained in all publications are solely those of the individual author(s) and contributor(s) and not of MDPI and/or the editor(s). MDPI and/or the editor(s) disclaim responsibility for any injury to people or property resulting from any ideas, methods, instructions or products referred to in the content. |
© 2024 by the authors. Licensee MDPI, Basel, Switzerland. This article is an open access article distributed under the terms and conditions of the Creative Commons Attribution (CC BY) license (https://creativecommons.org/licenses/by/4.0/).
Share and Cite
Zhou, F.; Jiang, W.; Tian, H.; Wang, L.; Zhu, J.; Luo, W.; Liang, J.; Xiang, L.; Cai, X.; Wang, S.; et al. Influence of EGCG (Epigallocatechin Gallate) on Physicochemical–Rheological Properties of Surimi Gel and Mechanism Based on Molecular Docking. Foods 2024, 13, 2412. https://doi.org/10.3390/foods13152412
Zhou F, Jiang W, Tian H, Wang L, Zhu J, Luo W, Liang J, Xiang L, Cai X, Wang S, et al. Influence of EGCG (Epigallocatechin Gallate) on Physicochemical–Rheological Properties of Surimi Gel and Mechanism Based on Molecular Docking. Foods. 2024; 13(15):2412. https://doi.org/10.3390/foods13152412
Chicago/Turabian StyleZhou, Fengchao, Wenting Jiang, Han Tian, Liuyun Wang, Jiasi Zhu, Wei Luo, Jie Liang, Leiwen Xiang, Xixi Cai, Shaoyun Wang, and et al. 2024. "Influence of EGCG (Epigallocatechin Gallate) on Physicochemical–Rheological Properties of Surimi Gel and Mechanism Based on Molecular Docking" Foods 13, no. 15: 2412. https://doi.org/10.3390/foods13152412